Risk Control
Menu
Insights & Ideas
Search for:
About us
Our aims
Careers
Sectors
Sectors Overview
Banks
Insurers
Public Institutions
Investment Firms
Industrial Companies
Software
Software Overview
RC-ICAAP and Stress Testing System
RC-Capital Model
RC-Operational Risk Capital Model
RC-Limit System
RC-Rating Scenario System
RC-Connectivity and Data Validation
RC-Credit Scoring System
RC-Dashboard and Database Tool
Services
Services Overview
Risk Strategy
Regulatory Analysis
Risk Assessment and Quantification
Calibration
Risk Model Services
Transaction Design and Implementation
ESG and Climate-Related Services
News
Contact
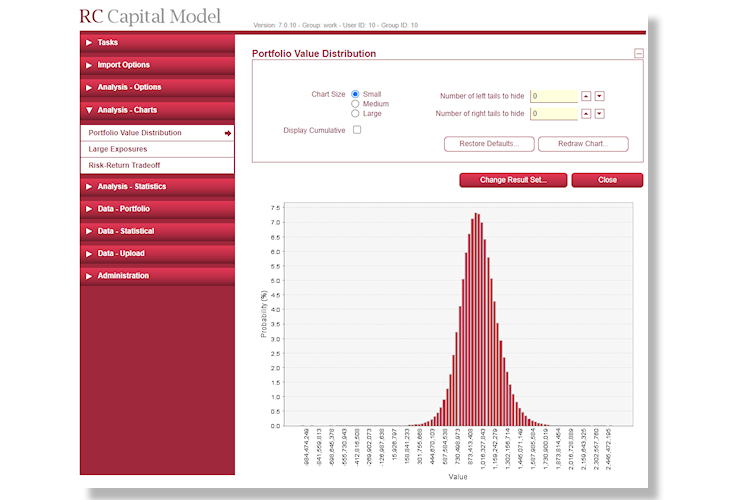
RC-Capital Model – Portfolio Value Distribution
Posted
May 2021
by
by
Harry Mantheakis
Categories
Asset Managers
Banks
Consulting
Corporate
Credit Risk
ESG
Events
Insurers
Investment Firms
Liquidity
Market Risk
Media
Methodology
Presentation
Public Institutions
Rating
Recruitment
Regulation
Research
Risk Methods
Securitisation
Software
Training
Archives
Archives
Select Month
July 2024 (1)
January 2024 (1)
December 2023 (1)
November 2023 (1)
October 2023 (1)
September 2023 (1)
July 2023 (1)
May 2023 (2)
March 2023 (1)
February 2023 (1)
January 2023 (1)
December 2022 (2)
November 2022 (2)
October 2022 (1)
September 2022 (2)
August 2022 (2)
July 2022 (2)
June 2022 (2)
May 2022 (4)
April 2022 (2)
March 2022 (1)
February 2022 (1)
January 2022 (1)
December 2021 (1)
October 2021 (2)
September 2021 (1)
August 2021 (1)
July 2021 (1)
June 2021 (1)
May 2021 (1)
April 2021 (2)
March 2021 (2)
February 2021 (1)
January 2021 (1)
December 2020 (1)
November 2020 (2)
October 2020 (1)
September 2020 (1)
August 2020 (1)
July 2020 (1)
June 2020 (2)
May 2020 (3)
April 2020 (1)
March 2020 (1)
February 2020 (1)
January 2020 (1)
December 2019 (1)
November 2019 (1)
October 2019 (1)
September 2019 (1)
August 2019 (1)
July 2019 (1)
June 2019 (1)
May 2019 (1)
April 2019 (2)
March 2019 (1)
February 2019 (1)
January 2019 (1)
December 2018 (1)
November 2018 (1)
October 2018 (1)
September 2018 (2)
August 2018 (1)
July 2018 (1)
June 2018 (1)
May 2018 (1)
April 2018 (1)
February 2018 (2)
January 2018 (1)
December 2017 (1)
November 2017 (3)
October 2017 (1)
September 2017 (1)
August 2017 (2)
July 2017 (3)
June 2017 (2)
May 2017 (1)
April 2017 (1)
March 2017 (1)
January 2017 (1)
November 2016 (1)
October 2016 (4)
September 2016 (1)
August 2016 (2)
July 2016 (4)
June 2016 (1)
May 2016 (1)
April 2016 (2)
March 2016 (1)
February 2016 (2)
January 2016 (1)
December 2015 (2)
November 2015 (1)
October 2015 (2)
September 2015 (1)
August 2015 (2)
July 2015 (3)
June 2015 (4)
May 2015 (3)
April 2015 (3)
March 2015 (2)
February 2015 (4)
January 2015 (3)
December 2014 (2)
November 2014 (4)
October 2014 (2)
September 2014 (1)
August 2014 (1)
July 2014 (1)
June 2014 (2)
May 2014 (1)
April 2014 (3)
March 2014 (1)
January 2014 (2)