

1. Introduction
The Covid-19 crisis has generated a very particular and unprecedented pattern of credit quality changes across industry sectors. This pattern departs from that observed in past economic downturns. In a classic downturn, cyclically sensitive industries such as commercial property, investment goods, consumer durables producers, energy and materials exhibit clear credit deterioration. Banks may also experience financial distress if the downturn is severe.
In the Covid-19 crisis, firms involved in travel, bricks and mortar retail, hospitality, energy and financials have suffered significant deterioration. Companies engaged in health, a variety of technology sectors and internet retailers have actually performed better than they might have done in the absence of a crisis. Technology sectors have benefitted so markedly that this crisis is almost the inverse of the credit deterioration that followed the bursting of the technology bubble.
Tracking the evolution of credit quality across sectors is important for many financial institutions as they seek to adjust their risk management, pricing and limit setting. The crisis is likely to last many more months and understanding the cross-sectional impact will prove helpful for lenders navigating the resulting recession.
This note shows how representative probabilities of default (PDs) for individual industry sectors have evolved since the crisis began. The techniques applied permit one to refresh PD estimates in real time and, hence, offer extremely timely information about the state of corporate credit.
Our modelling approach uses sector equity and debt data to analyse the statistical behaviour of leverage ratios over time. Volatilities and higher moments of asset returns are used to infer probabilities of default which are then rescaled based on historical default probabilities.
The main findings are that the onset of the crisis in the first half of March 2020 boosted PDs for all sectors but that credit conditions in several ‘gainer’ sectors recovered quickly over the following month, leaving PDs lower than before the crisis. These gainers include Information Technology at the highest level of sector classification and, at the finest level for sector definitions: Health Care Technology, Internet and Direct Marketing Retail, Software, Technology Hardware, Storage and Peripherals, Biotechnology and Life Sciences Tools and Services. The falls in PDs for these latter fine categories range from 28% for Health Care Technology to 8% for Life Sciences.
For ‘loser’ sectors, PDs again rose sharply in March but have recovered only partially as the complexion of the crisis became somewhat clearer. ‘Loser’ sectors include most notably energy and financials among high-level sector categories. Among finer industry categories, a series of very specific sectors are major losers. These include Airlines (which experience a 50.56% increase in PDs since the start of 2020), Distributors (which see a 38.99% rise in PDs) and Hotels, Restaurants & Leisure (for which PDs rise by 32.76% since the start of the year) .
Overall, the change in PDs is not as major as many might expect given the level of disruption to economic activity worldwide. The asset values that feed into our estimates are signalling that the crisis is less serious than many might think at least as far as large corporate credit quality is concerned. This last conclusion is sensitive to the way in which we have projected forward corporate debt levels. As we obtain more information from company accounts following Q2 financial reports, we intend to refine the estimates.
The note is organised as follows. Section 2 briefly describes the methodology and data employed. Section 3 presents results for Global Industry Classification Standard[1] (GICS) sectors at Levels 1, 2 and 3. Section 4 concludes.
2. Methodology
Almost by definition, a company defaults when the total value of its assets (measured in a market rather than a book value sense) falls below the value of its debt. Statistical techniques permit one to infer the market value of a company’s assets from its equity market capitalisation and its leverage. One can apply a similar logic to aggregate data from industries and thereby obtain representative leverage ratios and asset value volatilities.
Representative sector default probabilities may then be estimated using parametric models of the distribution of logarithm asset value changes. We employ both normal and t-distributions for this purpose. In the latter case, the additional degree of freedom parameter of the t-distribution may be inferred from the kurtosis of historical return series. We found that the t-distribution provides a more convincing description of the fat-tail feature of asset returns and, hence, we employ this distribution in our estimation of default probabilities.
Companies are classified into sectors based on Global Industry Classification Standard (GICS) definitions, which follows a hierarchical structure consisting of 11 sectors (Level 1), 24 industry groups (Level 2), 69 industries (Level 3) and 158 sub-industries (Level 4). To preserve adequate granularity while retaining reasonable numbers of individual companies in each category, we conduct our study based on Levels 1, 2 and 3. We rescale the PDs so that their levels at the beginning of 2020 are equivalent to the level of historical average PDs published in S&P (2019).
3. Results
3.1 GICS Level 1 Sector Results
Table 1 presents the PDs and other key statistics for GICS level 1 sectors. The third column shows percentage changes in MSCI sector indices between the start of 2020 and 11th June 2020. The Volatility column shows the standard deviations (or ‘volatilities’) of natural logarithm returns over half-year rolling windows for MSCI sector equity indices. The Leverage column is the D/E ratios from Bloomberg’s company universe.
Table 1 reveals that, leverage ratios vary dramatically across Level 1 GICS sectors. Real Estate, Utilities and Energy have the highest leverage ratios of 69.49%, 66.67% and 61.29%, respectively. Health Care has the lowest leverage of 19.05%, followed by Information Technologies (21.95%) and Telecom (31.58%). Equity markets also exhibit distinctly different performances. Despite an overall downward trend since the beginning of the year, Information Tech has outperformed its beginning of the year level by a remarkable 6.36%. Consumer Discretionary and Healthcare are only slightly affected by the crisis, with drops of 1.66% and 2.20%, respectively. Meanwhile, Energy and Financial sectors are hit hard by the crisis, suffering drops of 35.53% and 24%.
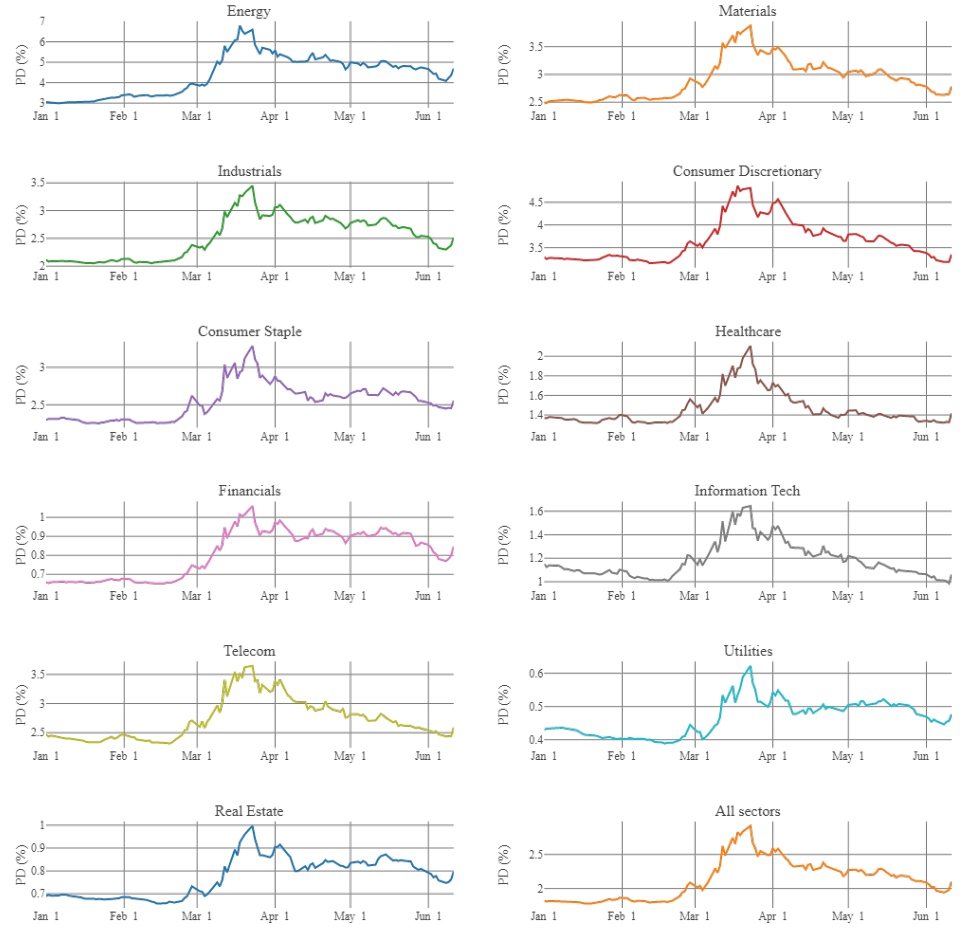
Figure 1 shows how PDs have evolved since the beginning of 2020 for GICS Level 1 sectors. Very different patterns may be observed across sectors. At the onset of the Covid-19 crisis in late February, PDs for all sectors start to increase, reaching a peak in mid-March. After that, Healthcare, Consumer Staple, Consumer Discretionary and Information Tech and Telecom sectors gradually recovered to pre-crisis levels. In contrast, for Energy, Industrials, Financials, Utilities and Real Estate, though some recovery is evident compared to peak crisis values, recovery has been slow.
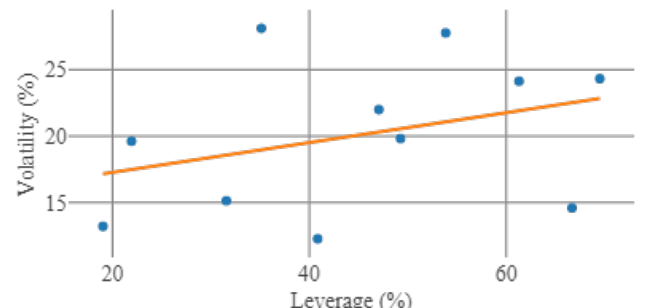
Figure 2 plots calibrated level 1 sector equity return volatilities against their current leverages. A line is fitted to the scatter points using Ordinary Linear Regressions. The upward sloping line shows the strong positive association between equity volatilities and leverages. The models employed in this note may be regarded as simple but consistent frameworks for differentiating the two primary influences on credit quality: leverage and volatility.
Note: Leverage represents the debt to market capitalisation ratio. The line is fitted using Ordinary Linear Regression of all points.
| Equity % | |||||||||
|---|---|---|---|---|---|---|---|---|---|
| chg | PD % chg | PD % chg | |||||||
| GICS | 1/1 to | PD | start | PD | PD | 1/1/20 to | since | ||
| code | Sector | 11/6 | Volatility | Leverage | 2020 | 11/5/20 | 11/6/20 | 11/6/20 | 11/5/20 |
| 10 | Energy | -35.53 | 24.12 | 61.29 | 3.05 | 4.80 | 4.70 | 54.13 | -2.01 |
| 15 | Materials | -10.77 | 28.10 | 35.14 | 2.48 | 3.01 | 2.79 | 12.31 | -7.53 |
| 20 | Industrials | -14.87 | 21.99 | 47.06 | 2.11 | 2.75 | 2.52 | 19.20 | -8.45 |
| 25 | Consumer Discretionary | -1.66 | 19.81 | 49.25 | 3.29 | 3.64 | 3.35 | 1.87 | -7.85 |
| 30 | Consumer Staple | -7.28 | 12.28 | 40.85 | 2.30 | 2.63 | 2.56 | 11.10 | -2.91 |
| 35 | Healthcare | -2.20 | 13.21 | 19.05 | 1.37 | 1.38 | 1.42 | 3.38 | 2.47 |
| 40 | Financials | -24.00 | 27.75 | 53.85 | 0.66 | 0.91 | 0.85 | 28.38 | -6.79 |
| 45 | Information Tech | 6.36 | 19.62 | 21.95 | 1.15 | 1.11 | 1.06 | -7.88 | -4.82 |
| 50 | Telecom | -3.42 | 15.14 | 31.58 | 2.47 | 2.71 | 2.59 | 4.92 | -4.27 |
| 55 | Utilities | -8.50 | 14.60 | 66.67 | 0.43 | 0.51 | 0.48 | 10.79 | -6.23 |
| 60 | Real Estate | -15.13 | 24.31 | 69.49 | 0.69 | 0.83 | 0.80 | 15.50 | -3.61 |
Note: All the numbers are in percentages. Relative PD changes are measured in the last two columns. PD increases/decreases more than 10% are couloured dark red/green. PD increases/decreases between 5% and 10% are coloured light red/green.
3.2 GICS Level 2 Sector Results
Table 2 follows the same format as Table 1 in describing the PDs of more granular classifications. In most cases, subsectors within the same sector have the same directions in change in PDs. However, within Consumer Discretionary, Retailing subsector has become safer than its pre-crisis level, while Consumer Services, Consumer Durables & Apparel and Automobiles & Components have significantly increased PDs of 34.73%, 14.00% and 8.55%, respectively. The magnitude of the impact also differs across subsectors. This is most obvious for the Financials sector, within which the Diversified Financials subsector registers a 9.25% PD increase, while Banks and Insurance PDs increase by 39.31% and 35.57% respectively.
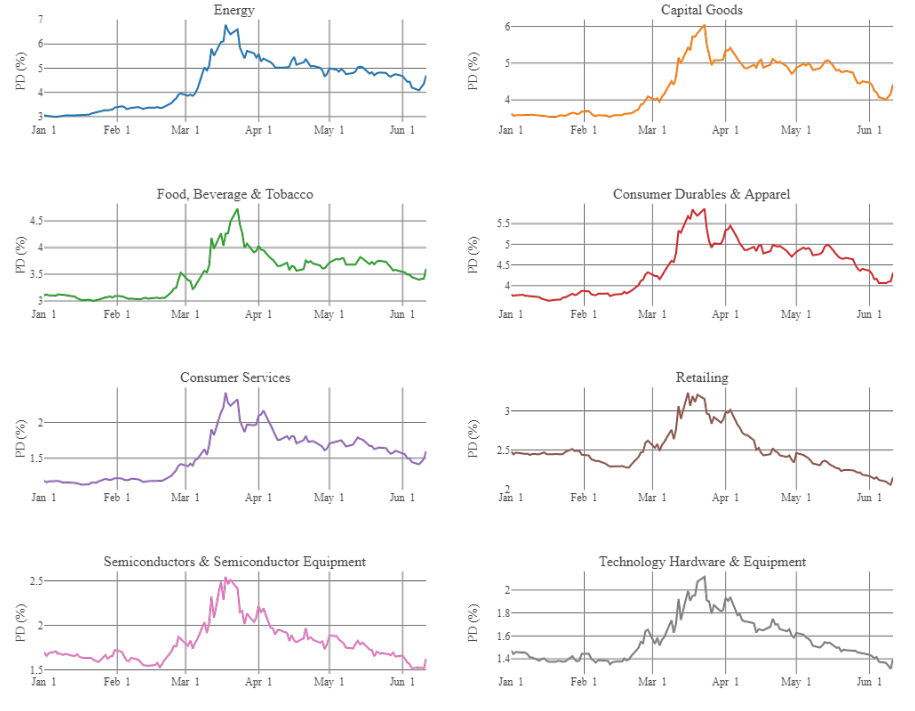
Figure 3 plots the time series of PDs for selected Level 2 sectors which have the largest increases or decreases in PDs. Semiconductors & Semiconductor Equipment and Technology Hardware Equipment have made quick recoveries after the crisis, probably because the demands for them have surged since the lockdown. Sectors of life essential goods normally have low elasticity on the demand side and are relatively stable. This is probably why Retailing has recovered quickly. Interestingly, also deemed as life essentials, Food, Beverages & Tobacco has a persistently higher PD than its previous level, which is possibly driven by its Beverages and Tobacco elements. Other more elastic consumer related sectors, such as Consumer Durables & Apparel and Consumer
Services, are still under the shadow of the crisis. As productions and trading activities drop, Energy and Capital Goods are still being heavily affected.
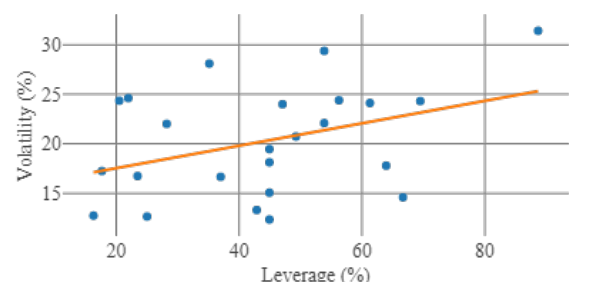
The scatter plot of Level 2 (see Figure 4) shows wider ranges of leverage ratios and volatilities compared to Figure 1, indicating more diversities for sectors on a dis-aggregated level. Consistent with Figure 1, this plot has a similar upward trend line fitted to data points.
Note: Leverage represents the debt to market capitalisation ratio. The line is fitted using Ordinary Linear Regression of all points.
| Equity % | |||||||||
|---|---|---|---|---|---|---|---|---|---|
| chg | PD % chg | PD % chg | |||||||
| GICS | 1/1 to | PD | start | PD | PD | 1/1/20 to | since | ||
| code | Sector | 11/6 | Volatility | Leverage | 2020 | 11/5/20 | 11/6/20 | 11/6/20 | 11/5/20 |
| 1010 | Energy | -35.53 | 24.12 | 61.29 | 3.05 | 4.80 | 4.70 | 54.13 | -2.02 |
| 1510 | Materials | -10.77 | 28.10 | 35.14 | 2.48 | 3.01 | 2.79 | 12.31 | -7.53 |
| 2010 | Capital Goods | -17.21 | 24.00 | 47.06 | 3.63 | 4.86 | 4.42 | 21.71 | -9.10 |
| 2020 | Commercial & Professional Services | -5.45 | 16.67 | 36.99 | 0.70 | 0.81 | 0.75 | 7.57 | -7.43 |
| 2030 | Transportation | -12.44 | 17.79 | 63.93 | 2.00 | 2.46 | 2.31 | 15.55 | -6.16 |
| 2510 | Automobiles & Components | -8.32 | 24.40 | 56.25 | 5.93 | 7.12 | 6.44 | 8.55 | -9.52 |
| 2520 | Consumer Durables & Apparel | -11.92 | 22.09 | 53.85 | 3.78 | 4.77 | 4.31 | 14.00 | -9.60 |
| 2530 | Consumer Services | -21.53 | 18.13 | 44.93 | 1.19 | 1.69 | 1.60 | 34.73 | -5.41 |
| 2540 | Media | -0.21 | 20.73 | 49.25 | 3.07 | 3.18 | 3.08 | 0.22 | -3.19 |
| 2550 | Retailing | 13.47 | 19.46 | 44.93 | 2.48 | 2.31 | 2.15 | -13.28 | -6.72 |
| 3010 | Food & Staples Retailing | -4.24 | 12.35 | 44.93 | 2.53 | 2.71 | 2.68 | 6.05 | -1.03 |
| 3020 | Food, Beverage & Tobacco | -10.42 | 13.31 | 42.86 | 3.10 | 3.69 | 3.60 | 16.10 | -2.23 |
| 3030 | Household & Personal Products | -2.50 | 12.66 | 25.00 | 1.26 | 1.39 | 1.31 | 3.83 | -5.84 |
| 3510 | Health Care Equipment & Services | -4.76 | 16.74 | 23.46 | 2.36 | 2.46 | 2.52 | 7.07 | 2.40 |
| 3520 | Pharmaceuticals, Biotechnology & Life Sciences | -0.66 | 12.75 | 16.28 | 0.38 | 0.38 | 0.39 | 1.01 | 2.42 |
| 4010 | Banks | -31.15 | 29.38 | 53.85 | 0.53 | 0.80 | 0.73 | 39.31 | -7.97 |
| 4020 | Diversified Financials | -13.25 | 31.41 | 88.68 | 1.15 | 1.30 | 1.26 | 9.25 | -3.36 |
| 4030 | Insurance | -21.58 | 24.35 | 20.48 | 0.30 | 0.45 | 0.41 | 35.57 | -9.42 |
| 4510 | Software & Services | 8.60 | 17.25 | 17.65 | 0.28 | 0.26 | 0.25 | -11.01 | -2.97 |
| 4520 | Technology Hardware & Equipment | 4.41 | 22.02 | 28.21 | 1.47 | 1.50 | 1.40 | -5.12 | -6.65 |
| 4530 | Semiconductors & Semiconductor Equipment | 3.38 | 24.61 | 21.95 | 1.69 | 1.74 | 1.63 | -3.94 | -6.48 |
| 5010 | Telecommunication Services | -10.54 | 15.06 | 44.93 | 2.47 | 2.99 | 2.85 | 15.51 | -4.42 |
| 5510 | Utilities | -8.50 | 14.60 | 66.67 | 0.43 | 0.51 | 0.48 | 10.79 | -6.23 |
| 6010 | Real Estate | -15.13 | 24.31 | 69.49 | 0.69 | 0.83 | 0.80 | 15.50 | -3.61 |
Note: All the numbers are in percentages. Relative PD changes are measured in the last two columns. PD increases/decreases more than 10% are couloured dark red/green. PD increases/decreases between 5% and 10% are coloured light red/green.
3.3 GICS Level 3 Sector Results
This Section presents sector results at a more granular level and discover phenomenon which is submerged by aggressions in the previous sections. Table 3 shows results for selected Level 3 sectors, which have the largest increases or decreases in PDs.
Apart from sectors that are identified as having elevated risks in the Level 1 and Level 2 analysis, we also find other risky sectors. Airlines, having a very high leverage ratio of 127.27%, suffer a 50.56% increase in PD since the beginning of the year. Hotels, Restaurants & Leisure is also 32.76% more likely to go bankrupt. Distributors are also heavily affected by the crisis with a 38.99% rise in PDs, indicating disruptions to trade and supply chains. Sectors for which PDs have declined include those related to healthcare and internet technologies.
Figure 5: PD Since the Beginning of 2020 for Selected GICS Level 3 Sectors
Figure 5 shows time series of selected Level 3 sectors. The sector having the most striking pattern is Airlines -its PD continues to rise after other sectors start to recover. Tobacco bounced back very quickly after the spike, compared to other sectors. Health Care Technology had the best performance among all sectors, with the ending PD being more than 1% less than its pre-crisis level.
The scatter plot shown in Figure 6 has a similar upward sloping line as in Figure 2 and Figure 4, although the ranges of volatilities and leverages are wider.
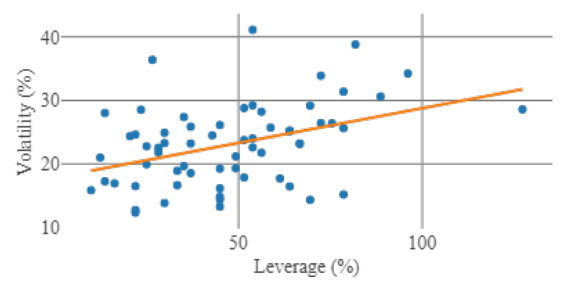
Note: Leverage equals the debt to market capitalisation ratio. The line is fitted using Ordinary Linear Regression of all points.
| Equity % | ||||||||||
|---|---|---|---|---|---|---|---|---|---|---|
| chg | PD % chg | PD % chg | ||||||||
| GICS | 1/1 to | PD | start | PD | PD | 1/1/20 to | since | |||
| code | Sector | 11/6 | Volatility | Leverage | 2020 | 11/5/20 | 11/6/20 | 11/6/20 | 11/5/20 | |
| 101020 | Oil, Gas & | Consumable Fuels | -34.64 | 22.59 | 53.85 | 0.79 | 1.28 | 1.25 | 57.75 | -2.04 |
| 101010 | Energy Equipment | & Services | -50.75 | 38.81 | 81.82 | 5.31 | 8.48 | 8.21 | 54.68 | -3.20 |
| 201010 | Aerospace & | Defense | -28.29 | 21.82 | 28.21 | 0.83 | 1.46 | 1.27 | 52.27 | -13.14 |
| 203020 | Airlines | -47.39 | 28.58 | 127.27 | 3.47 | 5.72 | 5.23 | 50.56 | -8.63 | |
| 401010 | Banks | -31.15 | 29.22 | 53.85 | 0.53 | 0.80 | 0.73 | 39.51 | -8.01 | |
| 255010 | Distributors | -23.85 | 23.27 | 29.87 | 1.24 | 1.87 | 1.72 | 38.99 | -8.08 | |
| 403010 | Insurance | -21.57 | 24.35 | 20.48 | 0.30 | 0.45 | 0.41 | 35.56 | -9.42 | |
| 253010 | Hotels, Restaurants | & Leisure | -21.59 | 19.29 | 49.25 | 1.20 | 1.67 | 1.59 | 32.76 | -5.15 |
| 203050 | Transportation | Infrastructure | -20.86 | 23.99 | 53.85 | 1.29 | 1.85 | 1.63 | 26.36 | -12.08 |
| 151020 | Construction | Materials | -22.46 | 28.79 | 51.52 | 2.73 | 3.81 | 3.43 | 25.65 | -9.93 |
| 302010 | Beverages | -14.45 | 13.81 | 29.87 | 1.69 | 2.17 | 2.12 | 25.15 | -2.18 | |
| 302030 | Tobacco | -15.05 | 16.63 | 33.33 | 4.74 | 6.08 | 5.90 | 24.52 | -3.03 | |
| 254010 | Media | -17.46 | 21.16 | 49.25 | 3.07 | 4.06 | 3.79 | 23.57 | -6.49 | |
| 402020 | Consumer Finance | -30.13 | 34.24 | 96.08 | 1.27 | 1.68 | 1.56 | 23.19 | -7.15 | |
| 501010 | Diversified | Telecommunication Services | -14.35 | 14.82 | 44.93 | 1.14 | 1.46 | 1.40 | 22.45 | -4.00 |
| 551050 | Independent | Power and Renewable Electricity Producers | -21.80 | 26.39 | 75.44 | 1.33 | 1.69 | 1.62 | 22.05 | -4.48 |
| 151030 | Containers & | Packaging | -16.60 | 21.75 | 56.25 | 1.17 | 1.46 | 1.41 | 20.68 | -3.48 |
| 251010 | Auto Components | -19.06 | 28.20 | 56.25 | 7.45 | 9.61 | 8.95 | 20.26 | -6.79 | |
| 352030 | Life Sciences | Tools & Services | 6.25 | 20.98 | 12.36 | 0.84 | 0.80 | 0.78 | -7.91 | -2.81 |
| 352010 | Biotechnology | 6.18 | 15.83 | 9.89 | 0.16 | 0.14 | 0.14 | -8.32 | 4.70 | |
| 452020 | Technology | Hardware, Storage & Peripherals | 9.63 | 24.89 | 29.87 | 2.21 | 2.13 | 1.99 | -9.77 | -6.42 |
| 451030 | Software | 13.68 | 17.23 | 13.64 | 0.24 | 0.20 | 0.20 | -16.75 | -1.54 | |
| 255020 | Internet & Direct | Marketing Retail | 31.16 | 28.52 | 23.46 | 3.83 | 3.07 | 2.86 | -25.16 | -6.73 |
| 351030 | Health Care | Technology | 32.18 | 28.01 | 13.64 | 4.75 | 3.70 | 3.41 | -28.24 | -7.83 |
Note: All the numbers are in percentages. Relative PD changes are measured in the last two columns. PD increases/decreases more than 10% are couloured dark red/green. PD increases/decreases between 5% and 10% are coloured light red/green.
4. Conclusions
This study analyses how PDs for different industries have evolved in the current Covid-19 crisis. We calculate daily PDs for GICS Level 1, 2 and 3 sectors from the start of 2020 until 11th June 2020 and analyse the variation across industry and time.
When the Covid-19 crisis deepened markedly in the first two weeks of March, PDs in all sectors rose dramatically. PD magnitudes increased proportionally by between 50% and 100% over a fortnight. After the initial spike, different sectors experienced quite diverse outcomes, partly reflecting the nature of the crisis and partly resulting from differences in representative leverage ratios and asset volatilities.
Among high-level industry sectors (GICS Level 1), the largest increases in credit risk occurred in Energy, Financials and Industrials sectors. Among sub-sectors (GICS Level 2), the worst affected were Energy, Banks, Insurers, and Consumer Services. Among finer sub-sectors (GICS Level 3), sectors that suffered most included Oil Gas & Consumable Fuels, Airlines, Banks and Automobile Components. Some sub-sectors not contained in the most affected Level 2 categories nevertheless suffered big PD increases. Such cases include Distributors, Tobacco and Hotels Restaurants & Leisure.
While all sectors saw increases in credit risk in the first half of March, some sectors, such as Healthcare and Information Technology made fast recoveries and by early June had lower PDs than before the crisis. Among GICS Level 2 sectors, the biggest gainers were Retailing and Software & Services, and Technology, Hardware & Equipment. From the Level 3 results, one may see that, in fact, the Retailers that benefitted were those using internet-based approaches. Overall, the strength of technology related sectors makes the credit impact of this crisis almost the inverse of the credit deterioration following the 2000-2002 bursting of the technology bubble.
Overall, the decline in PDs since their mid-March peak suggests that market data (on which our estimates are based) are consistent with a fairly rapid recovery in economic activity from the current turmoil. We intend to continue investigating the time paths of sectoral PDs over the next few months and to refine the approaches taken. In particular, we expect that as sectoral debt data comes available, it will be possible to discriminate further the credit impacts on different sectors.
Note that this note is part of a broad research program in which we are engaged to understand the impact of the crisis on credit markets. Other lines of research include (i) the derivation of conditional ratings for corporate credit portfolios, differentiating between sector, country and firm size, and (ii) the analysis of PDs and ratings for banks worldwide.
Appendix 1: GICS Level 3 PDs
Table A1: Level 3 GICS Sector Probabilities of Default (PDs) Equity %
chg PD % chg PD % chg
1/1 to PD start PD PD 1/1/20 to since
GICS code Sector 11/6 Volatility Leverage 2020 11/5/20 11/6/20 11/6/20 11/5/20
101010 Energy Equipment & Services -50.75 38.81 81.82 5.31 8.48 8.21 54.68 -3.20
101020 Oil, Gas & Consumable Fuels -34.64 22.59 53.85 0.79 1.28 1.25 57.75 -2.04
151010 Chemicals -10.15 23.19 36.99 1.03 1.26 1.16 12.85 -7.90
151020 Construction Materials -22.46 28.79 51.52 2.73 3.81 3.43 25.65 -9.93
151030 Containers & Packaging -16.60 21.75 56.25 1.17 1.46 1.41 20.68 -3.48
151040 Metals & Mining -7.71 36.39 26.58 3.66 4.25 3.93 7.54 -7.53
151050 Paper & Forest Products -19.65 29.17 69.49 3.82 4.63 4.52 18.41 -2.43
201010 Aerospace & Defense -28.29 21.82 28.21 0.83 1.46 1.27 52.27 -13.14
201020 Building Products -10.62 26.11 44.93 3.78 4.74 4.22 11.72 -11.02
201030 Construction & Engineering -16.57 25.14 63.93 4.36 5.55 5.12 17.58 -7.69
201040 Electrical Equipment -10.97 25.86 36.99 2.97 3.73 3.35 13.11 -10.12
201050 Industrial Conglomerates -18.66 25.62 78.57 5.45 6.83 6.43 18.08 -5.86
201060 Machinery -10.47 27.37 35.14 3.47 4.27 3.89 12.14 -8.81
201070 Trading Companies & Distributors -12.11 25.71 58.73 4.56 5.36 5.12 12.36 -4.44
202010 Commercial Services & Supplies -7.50 16.13 44.93 0.70 0.82 0.77 10.31 -5.89
203010 Air Freight & Logistics -8.93 19.24 44.93 0.51 0.63 0.57 11.60 -9.81
203020 Airlines -47.39 28.58 127.27 3.47 5.72 5.23 50.56 -8.63
203030 Marine -20.15 31.37 78.57 4.33 5.41 5.05 16.57 -6.69
203040 Road & Rail -8.63 16.43 63.93 0.40 0.46 0.44 10.62 -3.40
203050 Transportation Infrastructure -20.86 23.99 53.85 1.29 1.85 1.63 26.36 -12.08
251010 Auto Components -19.06 28.20 56.25 7.45 9.61 8.95 20.26 -6.79
251020 Automobiles -4.77 23.75 51.52 4.42 5.19 4.64 4.95 -10.61
252010 Household Durables -9.04 24.48 42.86 4.58 5.52 5.05 10.40 -8.45
252020 Leisure Products -9.15 18.90 33.33 1.19 1.55 1.34 13.01 -13.52
252030 Textiles, Apparel & Luxury Goods -13.55 23.19 66.67 5.57 7.00 6.37 14.36 -9.00
253010 Hotels, Restaurants & Leisure -21.59 19.29 49.25 1.20 1.67 1.59 32.76 -5.15
253020 Diversified Consumer Services 1.80 19.64 35.14 1.18 1.04 1.15 -2.15 10.61
254010 Media -17.46 21.16 49.25 3.07 4.06 3.79 23.57 -6.49
255010 Distributors -23.85 23.27 29.87 1.24 1.87 1.72 38.99 -8.08
255020 Internet & Direct Marketing Retail 31.16 28.52 23.46 3.83 3.07 2.86 -25.16 -6.73
255030 Multiline Retail -7.62 23.14 66.67 3.63 4.11 3.90 7.48 -5.07
255040 Specialty Retail -2.78 17.68 61.29 1.24 1.36 1.28 3.12 -5.82
302010 Beverages -14.45 13.81 29.87 1.69 2.17 2.12 25.15 -2.18
302020 Food Products -4.36 13.26 44.93 2.88 3.12 3.06 6.12 -2.03
302030 Tobacco -15.05 16.63 33.33 4.74 6.08 5.90 24.52 -3.03
303010 Household Products -1.20 12.31 21.95 0.21 0.21 0.21 1.83 -2.66
303020 Personal Products -4.59 19.91 25.00 2.32 2.74 2.47 6.35 -9.77
351010 Health Care Equipment & Supplies -4.49 16.92 16.28 0.42 0.43 0.45 6.80 4.18
351020 Health Care Providers & Services -7.04 18.54 36.99 1.90 2.06 2.08 9.57 0.92
351030 Health Care Technology 32.18 28.01 13.64 4.75 3.70 3.41 -28.24 -7.83
352010 Biotechnology 6.18 15.83 9.89 0.16 0.14 0.14 -8.32 4.70
352020 Pharmaceuticals -3.31 12.72 21.95 0.15 0.15 0.16 5.17 2.18
352030 Life Sciences Tools & Services 6.25 20.98 12.36 0.84 0.80 0.78 -7.91 -2.81
401010 Banks -31.15 29.22 53.85 0.53 0.80 0.73 39.51 -8.01
401020 Thrifts & Mortgage Finance 41.12 53.85
402010 Diversified Financial Services -20.24 33.89 72.41 1.12 1.33 1.30 16.15 -2.72
402020 Consumer Finance -30.13 34.24 96.08 1.27 1.68 1.56 23.19 -7.15
402030 Capital Markets -7.75 30.60 88.68 1.08 1.17 1.13 5.18 -3.09
403010 Insurance -21.57 24.35 20.48 0.30 0.45 0.41 35.56 -9.42
451020 IT Services 2.13 16.48 21.95 0.33 0.33 0.32 -2.93 -4.89
451030 Software 13.68 17.23 13.64 0.24 0.20 0.20 -16.75 -1.54
452010 Communications Equipment -6.12 22.76 25.00 1.04 1.16 1.13 8.14 -2.69
452020 Technology Hardware, Storage & Peripherals 9.63 24.89 29.87 2.21 2.13 1.99 -9.77 -6.42
452030 Electronic Equipment, Instruments & Components -5.91 22.54 28.21 1.17 1.37 1.26 7.69 -8.29
453010 Semiconductors & Semiconductor Equipment 3.37 24.61 21.95 1.69 1.74 1.63 -3.94 -6.48
501010 Diversified Telecommunication Services -14.35 14.82 44.93 1.14 1.46 1.40 22.45 -4.00
501020 Wireless Telecommunication Services 0.89 17.85 51.52 3.80 3.96 3.76 -1.01 -5.07
551010 Electric Utilities -6.56 14.32 69.49 0.13 0.15 0.14 8.04 -7.04
551020 Gas Utilities -10.70 14.38 44.93 0.07 0.09 0.09 16.02 -2.42
551030 Multi-Utilities -11.09 15.16 78.57 0.19 0.22 0.21 13.42 -4.99
551050 Independent Power and Renewable Electricity Producers -21.80 26.39 75.44 1.33 1.69 1.62 22.05 -4.48
601010 Equity Real Estate Investment Trusts (REITs) -15.07 25.23 63.93 0.61 0.73 0.70 15.62 -3.94
601020 Real Estate Management & Development -16.72 26.42 72.41 0.77 0.92 0.90 16.05 -2.44 Note: All the numbers are in percentages. Relative PD changes are measured in the last two columns. PD increases/decreases more than 10% are couloured dark red/green. PD increases/decreases between 5% and 10% are coloured light red/green.
Risk Control Limited 13-14 Dean Street London W1D 3RS +44 (0)203 307 0730 www.riskcontrollimited.com
Appendix 2: Detailed Methodology and Data Description
PD calculation methodology This section provides a non-technical description of the methodology employed in estimating sector probabilities of default (PDs). Corporate finance models of the firm suggest that the ratio of forward-looking estimates of firm asset values to debt is the key driver of default.
Let D/E denote the debt equity ratio of a representative firm at a given moment in time. Assume that debt D remains constant within a year and the market value of equity is denoted E. Total assets equal A= D+ E. Suppose that changes in the logarithm of asset values over a 1-year period are Gaussian with mean μ and volatility σA. (A2.1) ∆ ln (A)~N(μ, σA)
Here, ln(∙) is the natural logarithm function, and N(∙) indicates the normal distribution. Assume μ= 0. Let t equal the current time and t+ 1 is a year from now. The one-year default probability is
ln(D D At+1 At+1 At)−μ PD= P( < 1) = P(ln ( ) (A2.2) D At ) < ln (At)) = Φ ( σA
Φ(∙) is the cumulative distribution function of the normal distribution.
The volatility of assets is hard to estimate directly but one may easily obtain equity return volatilities. Assume the number of shares is constant so that the volatility of total equity market capitalisation equals the volatility of equity prices (denoted σE). Asset volatility σA can be inferred from σE. Define E= A−D and f(E) = (E+ D)/D. From this, one may derive the approximate relation:
df E dE E (A2.3) f = E+D × E so σA ≅ σE × E+D
Suppose that log equity changes for individual firms have a single common factor denoted X. For a given firm (with index i) the change in log equity may be expressed as:
(A2.4) ∆ln(Ai) = σA × ( √ρ X + √1 −ρ εi )
Here, X and εi are independent random variables with unit variances and zero means.
A fully diversified equity index representing investments in individual firms will not be exposed to risk associated with the εi firm-level shocks. Hence, individual firm volatilities σE will be related to the index volatility denoted σI through the equation: ⁄ (A2.5) σE = σI √ρ
Using the above results, we wish to infer representative probabilities of default (PDs) for firms in a given sector.
If we identify the common factor, σIX, with the (suitably de-meaned) log change in a sector index, to calculate the default probability in equation (2), we must calibrate three parameters: σI, ρ and the leverage ratio D/E.
Note that the above approach presumes that the random factor driving asset values is Gaussian. When the approach is implemented for firms that have low leverage, default probabilities may be implausibly small because the assumption of Gaussianity makes the likelihood of large changes in asset value extremely small. An alternative approach is to suppose that the random factor driving default has a fat-tailed distribution such as that of a Student’s t-distributed random variable.
If we replace the assumption in equation (1) with:
(A2.6) ∆ ln (A)~T( μ, σA, υ)
Here, υ denotes the degrees of freedom parameter of the t distribution. Then, the same sequence of steps may be followed except that the Gaussian cumulative distribution function Φ(. ) in equation (2) is replaced with Τ(. |υ).
Rescaling All Level 1 GICS sectors and two GICS Level 2 sectors are one-to-one mapped to sectors in the Standard & Poor’s report[2]. For a given sector, supposed the PD calculated by the model on 1st January 2020 is PB, and the PD from the S&P report is PS&P. The whole series of a given sector is scaled by multipling PS&P/PB. The mapping is shown in Table 1.
Table A2.1: Mapping of Sectors in S&P Report to GICS S&P's weighted average PD
Sectors in S&P's report GICS sector GICS code (%, 1981 - 2018)
Aerospace/auto/capital goods/metals Industrials 20 2.11
Consumer/service Consumer staple 30 2.3
Energy & natural resources Energy 10 3.05
Financial institutions Financials 40 0.66
Forest & building products/homebuilders Materials 15 2.48
Health care/chemicals Healthcare 35 1.37
High tech/computers/office equipment Information tech 45 1.15
Leisure time/media Consumer discretionary 25 3.29
Real estate Real estate 60 0.69
Telecommunications Telecom 50 2.47
Utility Utilities 55 0.43
Insurance Insurance 4030 0.3
Transportation Transportation 2030 2
Suppose that a Level 1 sector contains a set of N Level 2 sub-sectors. We rescale the PDs of these sub-sectors so that their average equals the PD of their parent sector.
The before-scaling and after-scaling Level 1 PDs are denoted PB and PA. Let the corresponding PDs for the ith A. In the case when none of the sub-sectors has been sub-sector before and after scaling be denoted PiB and Pi rescaled already, we rescale the sub-sector PDs using the equation:
PA B × PiA = Pi ∑Pi iB/N (A2.7)
Suppose that we already observe pre- and post-scaling PDs for one Level 2 sector with subscript j. Then for each A for i= 1,2, . . , N for i≠j sub-sector i for i≠j, given a set of unscaled PDs, PiB, we can deduce the scaled PDs Pi using the following equation:
A/N PA−Pj B × B PiA = Pi ∑i≠jPi /N (A2.8)
A for i= 1,2, . . , N, we can infer the after scaling Given a set of before and after scaling PDs for Level 2, PiB and Pi A , respectively denote the PDs before and after PDs for Level 3 sectors using the formula where Pk,iB and Pk,i scaling for a Level 3 sub-sector k within a Level 2 sub-sector i, for k = 1, 2, … K.
A Pi B × Pk,iA = Pk,i ∑Pk k,iB /K (A2.9)
Data We use the Global Industry Classification Standard (GICS) developed by MSCI and S&P Dow Jones to define sectors. The GICS approach is widely used in studies of firm financial performance and valuation. It has a hierarchical structure consisting of 11 sectors (Level 1), 24 industry groups (Level 2), 69 industries (Level 3) and 158 sub-industries (Level 4). To preserve adequate granularity while retaining reasonable numbers of individual companies in each category, we conduct our study based on Levels 1, 2 and 3.
The mean sectoral leverage is calculated from all active public companies in the Bloomberg universe, under its EQS function. The universe contains 90,963 companies, of which 45,439 have GICS sector data. Leverage ratios are calculated for each company as total debt divided by the sum of total debt, preferred stock and the market value of common stocks, as of the current date. The provided aggregation functionality of EQS enable us to group the companies by its GIC sectors, industry groups and industries, and derive the average of leverage ratios. These ratios are then transformed to the D/E ratio required. Where there are too few companies (fewer than 5) in a certain category, the average leverage obtained as described above may not be reliable. In this case, the leverage ratio of the parent category is employed (instead of using the average of companies within the category).
MSCI sector indices track the daily price performance of equities for a certain sector. The indices are based on the GICS sector taxonomy. The sector indices are downloaded for Levels 1, 2 and 3 GICS sectors. A sample period from the middle of 2006 to 11th June 2020 is employed in the volatility estimation. Note that according the volatility of an index is smaller than the volatilities of individual companies due to the elimination of company-specific risks. We, therefore, adjust the index volatilities for idiosyncratic risk equation (5). In this adjustment ρ is set to 0.18. This is the mid-point of the range of factor weights employed in the Basel II risk weight formula, namely 12% to 24%.
Last, if the above approach is implemented using a t distribution rather than assuming that risk factors are Gaussian, one must calibrate the degrees of freedom parameter, υ. For this purpose, we calculated the average kurtosis of sector index returns. As it holds for t-distributions that kurtosis – 3 = v−4 , (v> 4), we infer that υ= 5.5.
Notes
[1] GICS was developed in 1999 by MSCI and Standard & Poor's.
[2] See Standard & Poor’s (2019)