

The typical lending of major Multilateral Development Banks (MDBs) that focus on making loans to sovereigns is highly concentrated with a large fraction of the portfolio consisting of loans to the sovereigns of a handful of countries. Exposure Exchange Agreements (EEAs) are a powerful means for MDBs to manage the single name and geographical concentration in their portfolios.
Executive Summary
The typical lending of major Multilateral Development Banks (MDBs) that focus on making loans to sovereigns is highly concentrated with a large fraction of the portfolio consisting of loans to the sovereigns of a handful of countries. Exposure Exchange Agreements (EEAs) are a powerful means for MDBs to manage the single name and geographical concentration in their portfolios.
EEAs consist of bilateral agreements in which a pair of MDBs undertake to compensate each other in the event of defaults on two credit-matched subsets of their respective portfolios. The first such deals took place in 2015 and involved the African Development Bank (AfDB), Inter-American Development Bank (IDB) and International Bank for Reconstruction and Development. In 2020, the Asian Development Bank (ADB) joined the set of MDBs participating in these deals.
The approach employed by these banks was to provide mutual cover for portfolios with the same Exposure at Default (EAD) and with the matching of the ‘expected payouts’, i.e., hold-to-maturity Expected Losses (ELs). Since all the participating banks had the same credit rating, counterparty risk was not considered to be an issue.
Now, some MDBs are interested in engaging in EEAs in which the pair of participating banks have different credit ratings. Possible counterparties include banks with a range of ratings between AAA and AA-. The question arises: how do different counterparty credit qualities affect the risks faced by deal participants?
An MDB engaging in an EEA faces credit risk in the event
(i) that the other MDB’s Borrowing Member Country (BMC) defaults and
(ii) that the MDB’s own BMC’s default and the other MDB also defaults For credit matched portfolios of sovereign loans, if the two MDBs have the same rating, the counterparty risk balances out and so the two portfolios covered by the EEA may be sized equally. However, if the participating MDBs have different ratings, counterparty risk may be material and so the question arises, how might one scale up the EAD for which the lower rated MDB provides guarantees relative to the EAD for which the higher rated MDB gives credit protection? This is the subject of this study
The approach we take is to scale the EAD of the covered portfolios so that the two participating MDBs face the same EL allowing for counterparty risk. It turns out that a simple closed form equation can be derived for the scaling factor in this case. The EL may be computed using actual Probabilities of Default (PDs) and mean Loss Given Default (LGD) rates for sovereigns and MDBs, in which case one obtains what one may label a ‘provisioning approach’. Alternatively, one may use PDs extracted from market spreads, in which case the scaling factors represent those implied by a ‘fair pricing’ approach.[1] It turns out that the EEA scaling factors based on ELs inclusive of counterparty risk satisfy a simple closed form equation.
Table ES1 presents the scaling factors implied by our analysis for EEAs in which MDBs have different ratings. Scaling factors are lower if the WAL of the EEA equals that of typical MDB portfolios, namely around 9 years. For the central case calibrations, the scaling factors for a 12.5-year-WAL EEA are approximately 10%, 20% and 50% when the fair price approach is employed and 1%, 2% and 3% when applying a provisioning approach.
Table ES1: Guarantee Pool Scaling Factors for EEAs with Differently Rated MDBs
Panel a) Provisioning approach Panel b) Fair value approach
Counterparty Underlying Exposure Counterparty Underlying Exposure
Rating Rating Rating Rating
MDB1 MDB2 BBB BB B CCC CC MDB1 MDB2 BBB BB B CCC/CC
AAA AA+ 102.0 101.7 101.2 100.9 100.7 AAA AA+ 111.8 110.8 110.0 109.4
AAA AA 104.0 103.3 102.5 101.7 101.5 AAA AA 125.4 123.3 121.6 120.2
AAA AA- 105.8 104.8 103.6 102.6 102.2 AAA AA- 163.6 158.3 154.1 150.5
AA+ AA 101.9 101.6 101.2 100.9 100.8 AA+ AA 112.1 111.2 110.5 109.9
AA+ AA- 103.6 103.1 102.4 101.7 101.5 AA+ AA- 146.3 142.8 140.0 137.6
AA AA- 101.7 101.5 101.1 100.8 100.7 AA AA- 130.5 128.4 126.7 125.2 Note: All the values are in percentage. The correlation between the MDB and sovereign latent variables is 31% and the Weighted Average Life (WAL) is 12.5 years.
1. Introduction
This study analyses the counterparty risk implicit in Exposure Exchange Arrangements (EEAs) employed by Multilateral Development Banks (MDBs). In an EEA, each party provides the other with guarantees on a portfolio of borrowers. The two subsets, or ‘guarantee pools,’ are generally selected to be of equivalent credit quality (so the guarantees have matching ‘expected payouts’).
Why do MDBs employ EEAs? Unlike some other balance sheet optimisation instruments (for example, credit insurance or securitisation), EEAs do not reduce an MDB’s total risk. But they are effective in diversifying a portfolio that is concentrated. Many major Multilateral Development Banks (MDBs) primarily lend to sovereign governments. The number of their borrowers is, therefore, necessarily small and their loan books are much more concentrated than, for example, those of typical commercial banks.
Major rating agencies make explicit allowance for the concentration of MDB portfolios. In particular, Standard & Poor’s bases its assessment of MDB capital adequacy on its so-called Risk Adjusted Capital (RAC) ratio in which the denominator includes adjustments for geographical diversification and Single Name Concentration (SNC). For this reason, a primary motivation for MDBs in implementing EEAs is to obtain a lower RWA and, thus, higher RAC ratio, reinforcing their Standard & Poor’s rating.[2]
The first EEA deals were concluded in 2015 between African Development Bank (AfDB), Inter-American Development Bank (IDB), and the International Bank for Reconstruction and Development (IBRD). In 2020, the Asian Development Bank (ADB) began to participate in such deals. All four of these MDBs are rated AAA. When the guarantee-pool credit quality and nominal value are matched and the MDBs participating in an EEA have the same rating, the counterparty risk that each MDB faces, from a possible default by the other participating MDB, is equivalent for both parties and, hence, there is no need for an adjustment in the form of different nominal amounts or fees.
Recently, several MDBs with ratings between AA+ and AA- have begun to consider engaging in EEAs, either between each other or with AAA-rated MDBs. In this case, the issue of counterparty risk becomes relevant. One way to allow for counterparty risk is to scale up the nominal value of the exposures guaranteed by the lower rated MDB relative to the nominal value covered by the higher rated MDB.
This raises the question, however, of how much should the nominal value for the lower rated MDB be scaled? EEAs represent cooperative, non-market agreements between MDBs, for which the primary concern is not maximising shareholder value. Hence, one could imagine that different approaches might be taken to the sharing of the collective benefits of engaging in an EEA.
In this study, we examine two possibilities.
1. The nominal values of the two guarantee pools be adjusted until the hold-to-maturity Expected Loss of the participating MDBs are equal, allowing for the fact that counterparty risk for the higher rated MDB would be greater if the nominal value were equal. One may label this the ‘provisioning approach’.
2. The nominal values may be adjusted until the market value of the two legs of the EEA (as baskets of guarantees with counterparty risk) is equal. One may denote this the ‘fair value approach’.
Although they appear very different, technically, the two approaches are similar in that the provisioning approach involves calculating ELs using historical PDs while the fair value approach may be implemented by computing ELs using ‘risk-adjusted’ PDs extracted from market prices.
It turns out that the EEA scaling factors based on ELs inclusive of counterparty risk satisfy a simple closed form equation. When sovereign PDs and LGDs are equal for the two guarantee pools of an EEA, this equation simplifies so the scaling factor depends only on the probabilities that the MDBs default conditional on defaults by the guaranteed sovereign exposures. Since the conditional probabilities depend on (i) the PDs of the MDB,
(ii) the PDs of the guaranteed sovereign exposures and (iii) on the correlations between defaults by the MDBs and the sovereigns, the scaling factors inherit these dependencies. Below, we present look-up tables of scaling factors depending on (i) and (ii) for two correlation assumptions.
As already explained, we compute scaling factors under provisioning and fair price approaches. These are very different in magnitude. Since the chance of a sovereign loan default is much greater than that of a AAA or AA rated guarantor, rescaling the nominal amount of the pool is enough in EL-terms to compensate for different guarantor ratings. However, when spread-implied PDs are used, the scaling factors increases significantly. This reflects the fact that spreads include risk premiums that much exceed ELs for higher rated counterparties.[3] These risk premiums (or more specifically the difference between them for differently rated MDBs) feed through into significant EEA scaling factors.
The fair price approach presents some practical challenges in that one may adopt different assumptions about spreads, using current or time averages of spreads observed in the past. Also, spreads are commonly thought to include premia for illiquidity. One may think that the bonds issued by AA and below rated MDBs will be less liquid than those of AAA-rated MDBs. One then would need to subtract the liquidity premia before deducing risk adjusted probabilities of default to perform credit-based valuations. Discussion of this is provided in Appendix 5.
This study is organised as follows. Section 2 provides background information on MDB EEAs. Section 3 presents the methodology for assessing the counterparty risk in an EEA and demonstrates the scaling factor for a stylised portfolio. Section 4 concludes. Appendices contain information on the modelling assumptions and data inputs.
2. Past EEAs and MDB Concentration
2.1 EEAs completed by MDBs
An Exposure Exchange Agreement (EEA) is a balance sheet optimisation tool devised by major Multilateral Development Banks (MDBs) to manage their geographical and single name concentration risk. An EEA may be thought of as an exchange by two banks of sets of guarantees on notional pools of each other’s sovereign loans.
Typically, the pair of banks involved identify a set of sovereign exposures on each of the two balance sheets that are equivalent in credit quality, for example, having similar expected payouts (hold-to-maturity ELs). Each bank then provides guarantees to the other on an amount of notional value typically no greater than 50% of the other’s exposure to the sovereigns in question. Past EEAs have been structured so that the notional value covered by the guarantees is constant up to a first date (say 10 years in the future) and then decreases (or ‘amortises’) linearly to a second date (say 15 years from the date of closing).
The first EEAs were implemented in 2015 by three MDBs, the Inter-American Development Bank (IDB), International Bank for Reconstruction and Development (IBRD), and African Development Bank (AfDB).
Following these first transactions, no EEAs were completed until 2020, when the Asian Development Bank first engaged EEA transactions. Since then, several further deals have been agreed. By 2023, the volume of outstanding EEAs amounted to $10 billion.[4] Figure 2.1 shows how the total volume of EEAs has changed over time. Figure 2.2 depicts the time-line of the several past deals.
The three MDBs that participated in the 2015 transactions had similar although not equal shares in the Initial volume of outstanding EEAs. Since 2020, IDB has continued to be active in new deals, maintaining its share of the EEA market. The shares of AfDB and IBRD have declined and ADB has become active, agreeing deals with IDB and AfDB totalling $3.5 billion.
All EEAs before 2024 have involved ‘AAA’ rated MDBs. On 16th April 2024, the first EEA between MDBs with different ratings was announced (see OPEC Fund (2024)). This was an EEA between IDB and the OPEC Fund for International Development (OFID). While IDB has a rating of AAA from all three global rating agencies, OFID is rated AA+ by Standard & Poor’s and Fitch. (OFID is not at present rated by Moody’s.) Reportedly, several other non-AAA MDBs are currently considering engaging in EEAs, either amongst each other or with AAA-rated MDBs.
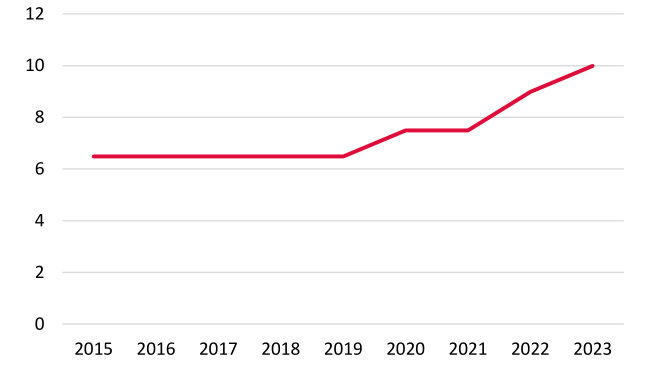
Note: The amount is in USD billion. Here, EEA exposures between two MDBs is counted only once. All the figures are based on the annual reports of IDB, IBRD, AfDB, and ADB from 2015 to 2023.
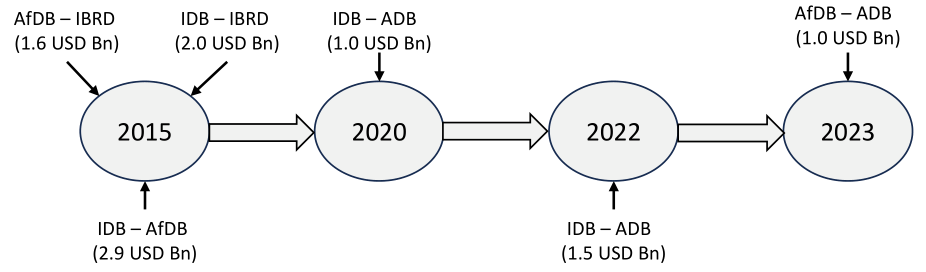
Note: Here, Bn denotes Billions.
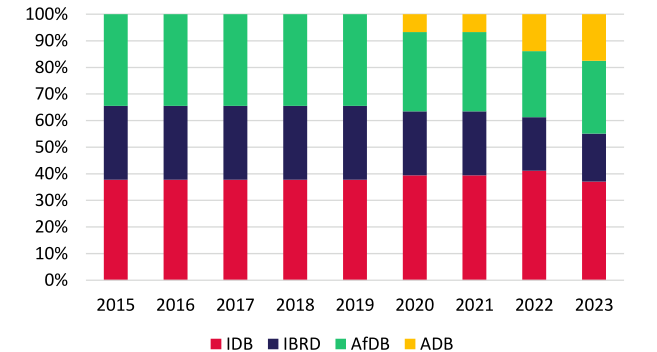
Note: Here EEA exposures between two MDBs is counted only once. All the figures are based on the annual reports of IDB, IBRD, AfDB, and ADB from 2015 to 2023.
2.2 MDB concentration risk and EEAs
MDBs that focus on sovereign lending are particularly susceptible to concentration risk, both geographical concentration and Single Name Concentration (SNC). Indeed, these sources of risk are among the major contributors to the financial ratio employed by Standard & Poor’s in assessing MDB capital adequacy, the Risk Adjusted Capital (RAC) ratio. The RAC ratio equals the ratio of available equity to a measure of Risk Weighted
Assets (RWAs). The latter includes adjustments for geographical concentration and sovereign SNC. On average, 40% of the total RWAs implied by Standard & Poor’s methodology is attributable to sovereign SNC.
Figure 2.4 shows the ratio of sovereign SNC RWAs to total adjusted RWAs for leading MDBs. The two banks with the highest ratios are New Development Bank (NDB) and the Central American Bank for Economic Integration (CABEI) which are non-AAA rated MDBs. The CAF – Development Bank of Latin America and the Caribbean (CAF) and the Caribbean Development Bank (CDB) also have high ratios. It seems that all four of these banks could benefit in their Standard & Poor’s ratings from implementing EEAs. These banks are rated as shown in Table 2.1.
The other two global credit rating agencies (Moody’s and Fitch) also adjust the concentration risk assessment considering an EEA transaction. We believe these adjustments does not significantly affect the credit assessment based on the methodology employed by these rating agencies.
For Moody’s the capital adequacy assessment is weighted sum of three credit factor assessments namely: (i) leverage (40%), (ii) Development Asset Credit Quality (DACQ) (20%) and, (iii) asset performance (40%). The DACQ assessment contributes only 20% to the capital adequacy assessment which is half as that of the other two credit factor’s weight.
DACQ is assessed based on six components out which three of them would be positively affected due to an EEA transaction:
i) Geographic Herfindahl-Hirschman Index (HHI) ii) Largest exposure fraction iii) Top 10 exposure fraction
We believe even after an improvement the assessments of these indicators Moody’s DACQ assessment might not improve.
For Fitch the solvency assessment is based on the combination on capitalisation and risk factors. The risk of an MDB is assessed by four risk factors (i) credit risk (40%), (ii) concentration risk (25%), (iii) equity risk (10%) and, (iv) risk management policies (25%). An EEA transaction would impact the concentration risk assessment which contributed only 25% to the risk assessment. The concentration risk assessment is based on range of concentration of the five largest exposures to total banking exposure (see Table 2.2).
This might not be affected if after the EEA the ratio remains in the range of the previous assessment. For example, the concentration risk is assumed ‘moderate’ when the ratio is between 40% to 60%. For MDBs to benefit in the Fitch’s rating methodology, the ratio must fall below 40%. Otherwise, there is no gain.
This suggests that there may be opportunities for non-AAA MDBs to engage in EEAs. To do so, these MDBs will have to tackle two issues.
1. They must determine portfolios of equivalent credit quality that can be used in the two legs of the EEA.
2. They must determine how to scale the two legs to account for differences in their own ratings. In Section 3, we turn to the issue of scaling to adjust for different ratings.
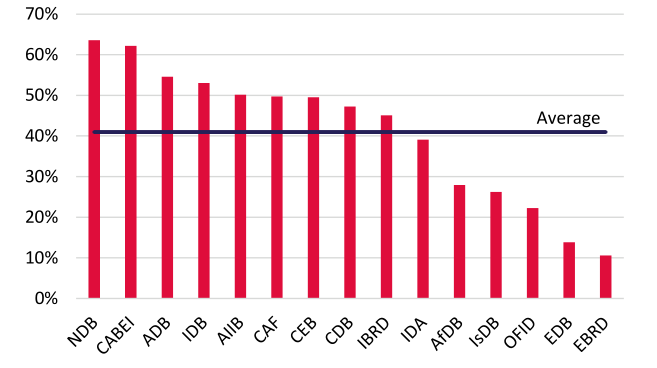
Note: Here, SNC denotes Single Name Concentration, RWA denotes Risk-Weighted Assets, and MLI denotes Multi-lateral Institutions. The data is from S&P (2023). The MDBs are arranged in decreasing order of the ratio. The calculations are performed after MLI adjustments.
| Standard | & | Average | ||
|---|---|---|---|---|
| MDB | Poor's | Moody's | Fitch | Rating |
| CABEI | AA | Aa3 | - | AA- |
| CAF | AA | Aa3 | AA- | AA- |
| CDB | AA+ | Aa1 | AA+ | AA+ |
| OFID | AA+ | - | AA+ | AA+ |
| NDB | AA+ | - | AA | AA |
| Range | Assessment |
|---|---|
| Below 20% | Very low |
| 20 to below 40% | Low |
| 40% to below 60% | Moderate |
| 60% and above | High |
Note: Here the concentration ratio is the ratio of five largest exposures to total banking exposure in percentage.
3. Counterparty Risk Analysis of EEAs
3.1 Theory
This subsection considers how the notional value of the EEA pools might be scaled to allow for differences in counterparty risk if the two participating MDBs have different ratings. To provide a simple analysis, we examine an exchange of guarantees by two MDBs on two equally rated sovereigns and suppose the same factor correlation for defaults by MDBs and the sovereigns they guarantee[5]. We assume that, for each of the sovereign loans, the Probability of Default (denoted PDS) and the expected LGD (denoted LGD) are equal.
Suppose that the two MDBs have different ratings and that their respective probabilities of default are denoted PDM1 and PDM2. The first MDB insures EAD[1] of the second MDB’s sovereign loan and receives, in return, credit protection on a nominal amount EAD[2] of its own loan to a BMC.
MDB[1] experiences losses in two situations:
1. The sovereign exposure (with nominal amount EAD[1]) for which MDB[1] provided protection to MDB[2] defaults.
2. The sovereign exposure (with nominal amount EAD[2]) for which MDB[1] received protection defaults and MDB[2] defaults.
The expected loss (EL) for MDBi (where i, j = 1, 2 and i ≠j ) is, therefore:
(3.1) ELi = EADi × LGD× PDS + EADj × LGD× (PDS∩Mj)
Here, PDS∩Mj denotes the probability that both MDB i’s BMC defaults and MDB j defaults.
One may similarly calculate the Expected Loss (denoted ELj) of MDB j. Equating the two ELs and rearranging the equation, one obtains the result in equation (3.2)
EAD1 (1−PDS∩M2/PDS) (1−PDM2|S) (3.2) Scaling Factor= (1−PDS∩M1/PDS) = EAD2 = (1−PDM1|S)
Here, PDMi|S denotes the probability that MDB i defaults conditional on the event that the BMC of MDB j also defaults for the two cases i, j= 1,2 and j≠i.
When a default by MDB 2 is statistically independent of a default by MDB 1’s BMC, equation (3.2) becomes:
EAD1 (1−PDM2) (3.3) Scaling Factor= (1−PDM1) EAD2 =
If defaults by the sovereign and the MDB are driven by two latent variables ZS,i and ZM,j and they satisfy:
ZS,i = Xi (3.4) ZM,j = √ρ Xi + √1 −ρ εj
Here, Xi and εjare standard Gaussian and ρ is a number in the unit interval which equals the correlation of the two latent variables. Then, one may compute PD(M2|S) as follows:
Φ−1(PDS) 1 Φ−1(PDM2) − √ρ x ∫ Φ ( ) φ(x)dx = 1 Φ[2](Φ−1(PDM2), Φ−1(PDS) |ρ) (3.5) PD(M2|S) = PDS −∞ √1 −ρ PDS
Here Φ(. ), φ(. ) and Φ[2](, , |ρ) are, respectively, standard Gaussian univariate distribution function and density and the distribution of a bivariate standard Gaussian with correlation parameter ρ.
• The above expressions involve equating the Els of the two MDBs participating in the deal. One may think of this approach as constituting a ‘provisioning approach’.
• If one replaces the historical distributions employed with risk-adjusted distributions extracted from market prices, one may perform an identical computation, but, in this case, the value of the two sides of the EEA is being equated for the two participating MDBs and the solution obtained may by termed a ‘fair-price approach’.
3.2 Scaling Factor Results
For a stylised EEA involving two MDBs, each providing guarantees on a single loan to the other’s BMC, one may evaluate equations (3.5) and (3.2) to obtain the scaling factor. Note here that the scaling factors we obtain may be applied to more complex EEAs by computing the (shared) weighted average rating of the two pools.
One may compute the Scaling Factor appropriately when the MDBs have different ratings, using the formulae in equation (3.2). The results of such calculations are presented in Table 3.1 for the provisioning approach in which hold-to-maturity ELs inclusive of counterparty risk effects are included. The PDs employed in these calculations are taken from Risk Control (2024c) which analyses sovereign PDs by rating inclusive of PCT. Multiperiod PDs may be inferred by embedding the PDs in a rating transition matrix. This is explained in Risk Control (2024b).
For a complete list of scaling factor based on provisioning approach for different combinations of investment grade rated MDBs, see Appendix 4.
For what we regard as the central case shown in Panel a), the scaling factors for single B rated sovereign loans is 1.2% for an EEA between an AAA and an AA+ rated MDBs and 3.6% when the MDBs involved are AA- and AAA. In other words, in the first case, the AAA would guarantee a nominal value of, say, 100 and the AA+ MDB would guarantee 101.2. Clearly, the difference is minor in this case.
In interpreting the results, one may note that the scaling factors depend intuitively on the number of notches between the MDB ratings. The one notch differences (AAA to AA+, AA+ to AA, and AA to AA-) are very close (in that the values are 1.2, 1.2 and 1.1%, respectively). And, in this case, the results appear approximately proportional to the number of notches in that two notches generate a scaling factor of around 2.5% and three imply a scaling factor of 3.6%.
Note that the scaling factors increase as the pool credit quality rises because the credit protection provided by the guarantees decreases for higher sovereign ratings and, hence, the nominals must deviate from each other more to compensate for the counterparty-risk difference between the MDBs.
Panels b) Table 3.1 present results like those appearing in Panels a), except the calibration is performed for an EEA of 9 years rather than 12.5 years. The past EEAs agreed by AAA rated MDBs have reportedly involved 15year deals, amortising linearly after 10 years. These have a WAL of 12.5 years. In fact, the WAL of several sovereign-focussed MDB portfolios that we have recently analysed appears to be closer to 9-years (see Table A1.4). Hence, we have performed computations of EEA scaling factors for transactions that last 11 years, amortising after 7. These, we represent with the 9-year results shown in the lower panels of the table. One may observe here that the scaling factors are generally lower for a shorter WAL.
Table 3.2 present fair-price approach results in which the scaling is computed to equate the market price (inclusive of counterparty risk effects) of the guarantees across the two MDBs even when they have different ratings. These results are computed using PDs for MDBs extracted from market prices, i.e., credit spreads on bonds. How this is done is explained in Appendix 1 which sets out how the model inputs are calibrated.
The results shown in Table 3.2 for a central case correlation and WAL of 12.5 years include scaling factors for single B sovereign guarantees of 10% for an EEA between AAA and AA+ MDBs. For AAA and AA-, i.e., two notches, the scaling rises to 21.6%. The results exhibit non-proportionality in notching in that for AAA to AA, and AAA to AA-, the scaling percentages are 21.6% and 54.1% when sovereigns are rated B. When a 9-year WAL is employed, the scaling factors reduce by between a fifth and a third depending on the case in question.
If a fair value approach is adopted, the timing of the spread data employed can affect the results significantly as bond spreads can change significantly. Furthermore, one may argue that bond market spreads include a premium for the illiquidity of the bonds involved. Measuring illiquidity premia is challenging. Appendix 5 shows how the scaling is affected if different assumptions are made regarding illiquidity premiums.
| Panel a) | Correlation of | 31% | and WAL | of 12.5 | Year | Panel b) | Correlation | of | 35% and | WAL | of 9 Year | |
|---|---|---|---|---|---|---|---|---|---|---|---|---|
| Counterparty | Underlying | Exposure | Counterparty | Underlying | Exposure | |||||||
| Rating | Rating | Rating | Rating | |||||||||
| MDB1 | MDB2 BBB | BB | B | CCC | CC | MDB1 | MDB2 | BBB | BB | B | CCC | CC |
| AAA | AA+ 102.0 | 101.7 | 101.2 | 100.9 | 100.7 | AAA | AA+ | 102.1 | 101.7 | 101.2 | 100.8 | 100.6 |
| AAA | AA 104.0 | 103.3 | 102.5 | 101.7 | 101.5 | AAA | AA | 104.0 | 103.3 | 102.4 | 101.5 | 101.2 |
| AAA | AA- 105.8 | 104.8 | 103.6 | 102.6 | 102.2 | AAA | AA- | 105.8 | 104.8 | 103.5 | 102.2 | 101.9 |
| AA+ | AA 101.9 | 101.6 | 101.2 | 100.9 | 100.8 | AA+ | AA | 101.9 | 101.6 | 101.2 | 100.7 | 100.6 |
| AA+ | AA- 103.6 | 103.1 | 102.4 | 101.7 | 101.5 | AA+ | AA- | 103.6 | 103.0 | 102.3 | 101.5 | 101.2 |
| AA | AA- 101.7 | 101.5 | 101.1 | 100.8 | 100.7 | AA | AA- | 101.7 | 101.4 | 101.1 | 100.7 | 100.6 |
Note: All the values are in percentage. Here WAL denotes Weighted Average Life.
| Panel a) | Correlation | of | 31% and | WAL | of 12.5 Year | Panel b) | Correlation of | 35% and | WAL | of 9 |
|---|---|---|---|---|---|---|---|---|---|---|
| Counterparty | Underlying | Exposure | Counterparty | Underlying | Exposure | |||||
| Rating | Rating | Rating | Rating | |||||||
| MDB1 | MDB2 | BBB | BB | B | CCC/CC | MDB1 | MDB2 BBB | BB | B | CCC/CC |
| AAA | AA+ | 111.8 | 110.8 | 110.0 | 109.4 | AAA | AA+ 110.9 | 109.6 | 108.4 | 107.5 |
| AAA | AA | 125.4 | 123.3 | 121.6 | 120.2 | AAA | AA 122.6 | 120.0 | 117.6 | 115.7 |
| AAA | AA- | 163.6 | 158.3 | 154.1 | 150.5 | AAA | AA- 149.6 | 143.8 | 138.7 | 134.6 |
| AA+ | AA | 112.1 | 111.2 | 110.5 | 109.9 | AA+ | AA 110.6 | 109.5 | 108.5 | 107.7 |
| AA+ | AA- | 146.3 | 142.8 | 140.0 | 137.6 | AA+ | AA- 134.9 | 131.3 | 127.9 | 125.2 |
| AA | AA- | 130.5 | 128.4 | 126.7 | 125.2 | AA | AA- 122.0 | 119.9 | 117.9 | 116.3 |
Note: All the values are in percentage. Here WAL denotes Weighted Average Life.
3.3 Simplified Worked Example
We estimate the scaling factor (SF) for a hypothetical EEA transaction with a tenure of 15, which amortises linearly from 10 to 15 years (WAL of 12.5 years). The portfolio has a weighted average rating of ‘B’. The weighted average rating is estimated by calculated the weighted average PD of the portfolio and mapping it back to a rating. (See the default column for 1-year PCT-adjusted PDs in Table A2.2.)
It is assumed that the two MDBs involved in the transaction are rated ‘AAA’ and ‘AA+’, respectively.
If one of the MDBs is rated differently by the three global credit rating agencies (Standard & Poor’s, Moody’s and Fitch), we would assign to it the median rating of the three. If only two agencies rate the MDB, we employ the lower of the two ratings. This is equivalent to (i) assigning a numerical ranking to the rating start from 1 to 20 for AAA to CC, (ii) averaging the numerical rating and rounding up the result to the nearest integer, (iii) mapping the numerical equivalent back to a letter rating grade to obtained the median rating.[6]
Tenure also impacts the default correlation between the MDB and the sovereigns, as the tenure increases correlations falls. We have provided the variation of correlation for different tenure in Table A1.5. The table could be used to estimate the implied correlation appropriate for EEA transaction in consideration.[7]
The data inputs for equation (3.3) for the provisioning approach are:
1. PDS : Cumulative PD for sovereign which is 11.00%
2. ρ : Correlation of 31% (see Table A1.5)
3. PDAAA : Cumulative PD for 12.5 years of AAA rated MDB is 0.20%
4. PDAA+ : Cumulative PD for 12.5 years of AA+ rated MDB is 0.59%
We compute the conditional PDs using equation (3.5) PD(MDBAAA|SovB) = 0.71% (3.6) PD(MDBAA+|SovB) = 1.93%
The resulting provisioning approach SF based on equation (3.2) would be:
1−0.0071 (3.7) SFprovisional = 1−0.0193 = 1.012
This is equivalent to the value obtained for the SF between AAA and AA+ for ‘B’ rated sovereign exposure (see Panel a) of Table 3.1).
Similarly, we can obtain SF for the fair-value approach, the only difference would be in the cumulative PD for sovereign and the MDBs would be risk-adjusted. The risk-adjusted PDs for the sovereign and the MDB are
1. PDS : Cumulative PD for sovereign which is 50.70%
2. PDAAA : Cumulative PD for 12.5 years of AAA rated MDB is 5.91%
3. PDAA+ : Cumulative PD for 12.5 years of AA+ rated MDB is 12.30%
We compute the conditional PDs for the fair-value using equation (3.5) PD(MDBAAA|SovB) = 8.45%% PD(MDBAA+|SovB) = 16.81%
The resulting fair value approach SF based on equation (3.2) would be:
1−0.0845 (3.8) SFfair−value = 1−0.1681 = 1.100
This is equivalent to the value obtained for the SF between AAA and AA+ for ‘B’ rated sovereign exposure (see Panel a) of Table 3.2).
4. Conclusion
This paper analyses counterparty risk issues that arise in Exposure Exchange Arrangements (EEAs) between Multilateral Development Banks (MDBs). These arrangements amount to the provision by pairs of MDBs of mutual guarantees applied to a portfolio of the other’s sovereign loan exposure. The guarantees apply to a notional value of exposure rather than to specific loans. In the past, all EEAs completed were between MDBs with the same rating. In this case, counterparty risk, consisting of a possible failure by one or other MDB to make good on the guarantees it provided, was symmetric and, hence, played no role in the sizing of the (equal) nominal values of the two sets of guarantees offered by the participating MDBs.
Now, however, there is increasing interest among MDBs with a range of sub-AAA ratings in engaging in EEAs either with each other or with AAA-rated institutions. This paper proposes methods for determining the sizing of the notional in MDB EEAs either based
1. on equating the hold-to-maturity, inclusive of counterparty risk, Expected Losses (ELs), here denote the ‘provisioning approach’ or
2. on equating the market price of the guarantees inclusive of counterparty risk, here termed the ‘fair price approach’.
We use a simple analytical model solvable in closed form to deduce appropriate scaling factors. These depend on the credit quality of the sovereign loan pool and the MDB (i.e., their ratings) and the assumed correlation between sovereign and MDB defaults. The results exhibit intuitively reasonable sensitivities. For the central case calibrations we propose, the scaling factors for a 12.5-year-WAL EEA are approximately 10%, 20% and 50% when the fair price approach is employed and 1%, 2% and 3% when a provisioning approach is applied.
Which of the two approaches should be employed? The provisioning approach is in the spirit of standard accounting treatments such as IFRS9 or CECL. The fair price approach requires assumptions about which spreads to employ (current spreads or some form of historical average spreads) and regarding the treatment of liquidity premia which are likely to form part of credit spreads for highly rated bond issuers. Appendix 5 provides sensitivity analysis of how scaling factors when different possible adjustments for liquidity to bond spreads are adopted.
References
Asian Development Bank (2024) “Financial Report 2023,” available at: https://www.adb.org/sites/default/files/institutional-document/959761/adb-financial-report-2023.pdf.
Belhaj, Riadh, Merli Baroudi, Norbert Fiess, Jonas Campino de Olivera, Frank Sperling, and Tim Turner (2017) “Exposure exchange agreements among multilateral development banks for sovereign exposures: An innovative risk management tool,” Journal of Risk Management in Financial Institutions, 10 (1), 78-88.
Duponcheele, Georges, William Perraudin, and Daniel Totouom-Tangho (2013) “Maturity Effects in Securitisation Capital: Total Capital Levels and Dispersion Across Tranches,” September, available at: https://www.riskcontrollimited.com//wpcontent/uploads/2015/02/Maturity_Effects_in_Securitisation_Capital.pdf
International Bank for Reconstruction and Development (2023) “Management’s Discussion & Analysis and Financial Statements June 30, 2023,” available at: https://thedocs.worldbank.org/en/doc/66512fcff3c06766d0bd85f5042d4101-0040012023/original/IBRD- Financial-Statements-June-2023.pdf.
Inter-American Development Bank (2016) “Annual Report 2015 Financial Statements,” available at: https://publications.iadb.org/publications/english/document/Inter-American-Development-Bank-Annual- Report-2015-Financial-Statements.pdf.
Inter-American Development Bank (2024) “Annual Report 2023 Financial Statements,” available at: https://publications.iadb.org/en/publications/english/viewer/Inter-American-Development-Bank-Annual- Report-2023-Financial-Statements.pdf.
OPEC Fund (2024) "IDB and OPEC Fund sign new benchmark Exposure Exchange Agreement," April, available at: https://opecfund.org/media-center/press-releases/2024/idb-and-opec-fund-sign-new-benchmarkexposure-exchange-agreement.
Risk Control (2024a) “Capital Adequacy Benchmarking for MDBs,” 24-30a, February.
Risk Control (2024b) “Fair Pricing of MDB Sovereign Loans,” 24-29a, February.
Risk Control (2024c) “Quantifying Preferred Creditor Treatment by Rating Grade,” 24-56a, April.
Risk Control (2024d) “Balance Sheet Strategies for ADB and IDB,” 24-85a, August.
Risk Control (2024e) “Sovereign Single Name Concentration Risk for MDBs,” 24-77a, August.
Standard & Poor (2023) “Supranationals,” available at: https://www.spglobal.com/ratings/en/research/pdfarticles/231012-supranationals-special-edition-2023- 101587529#:~:text=Supranationals%20Special%20Edition%202023.,that%20first%20started%20in%201986.
Appendix 1: Calibration
A1.1 Calibration In this sub-section, we discuss the parameters employed in calculating the appropriate scaling factor on EEA transaction between two MDBs with different average rating. From equation (3.5) it is evident that to estimate the scaling factors for the provisioning and fair price approaches, we need the following inputs:
1. Probability of Default (PD) of MDB
2. Risk-adjusted PD of MDB
3. Probability of Default of underlying sovereign exposure
4. Risk-adjusted PD of underlying sovereign exposure
5. Correlation between MDB and underlying sovereign exposure
An additional parameter is necessary which is important in understanding the cumulative PD of MDBs and exposure is the tenor of the guarantee agreed in the EEA exposure. Hence, the sixth parameter:
6. Tenor of the EEA Guarantee
Risk Control (2024c) studies the PDs of MDB’s sovereign loans conditional on ratings in the context of analysing the impact of Preferred Creditor Treatment (PCT). Risk Control (2024b) builds on that analysis to derive fair prices of the MDB sovereign loans adjusted for PCT. The findings of these papers are used here in deducing appropriate EEA scaling factors.
The PD of MDB is the historical PD without PCT adjustment, for a one-year loan it would be last column of the Transition Matrix (see Table A2.1 in Appendix 2). Here we have considered a tenor of 12.5 years[8] based on the original EEA transaction which had a maturity of 15 years and linear amortisation post tenth year (see Belhaj et al. (2017)). We also considered a tenor of 9 years.
Similarly, we obtain cumulative PDs for the other two entities using the respective annual TMs in the Appendix:
a) Historical PD of the underlying sovereign exposure using Table A2.2
b) Risk-adjusted PD of the underlying sovereign exposure using Table A2.4.
We obtain the risk-adjusted cumulative PDs for MDB based on MDB-implied spread data using the bond issuance data from Bloomberg (see Section A1.2 for further details).
Table A1.1 and Table A1.2 describes the cumulative PDs of MDBs and BMCs respectively used in the estimation of the scaling factor.
Table A1.1: Historical Cumulative PDs for Different Tenors
Table A1.2: Historical Cumulative PDs for BMCs for Different Tenors
The correlation between MDBs and the sovereign loan is assumed to equal the weighted average pairwise correlation in the historical EEAs between the AAA rated MDBs. The correlation is computed based on the
MSCI equity indices (see Appendix 2 for further details). Similar approach has been followed by Risk Control in the benchmarking exercise of the MDBs in Risk Control (2024a). Table A1.3 provides the weighted average factor correlation computed based on the Risk Control’s correlation estimate between the MDBs and the sovereign exposures.[9] The conservative average WA pairwise correlation of the historical deal is 55%. We use this as the unadjusted correlation in our estimates.
Table A1.3: Pairwise Correlation based on Historical EEAs
WA Transaction Factor Correlation
MDB1 MDB2
AfDB - IBRD 2015 57 62
IDB - IBRD 2015 47 52
IDB - AfDB 2015 66 50
IDB - ADB 2020 62 46
IDB - ADB 2022 50 53
AfDB - ADB 2023 50 51
Average 55 52 Note: Here WA denotes Weighted Average. The concentration is in percentage. The MDB1 denotes WA pairwise correlation of the sovereign exposures of MDB1 guaranteed by MDB2.
The tenor of the guarantee is a significant parameter in determining the scaling factor as it affects:
a) Cumulative PDs of the MDB and BMCs
b) The adjusted correlation coefficient We study for tenors in this study:
1. 15 Year: This was employed in the original EEA master agreement with starts a linear amortisation after 10 years, implying a Weighted Average Life (WAL) of 12.5 years.
2. 11 Years: A shorter tenor to be more aligned with the current weighted average maturity of the outstanding loans of the MDBs. We assume it amortises linearly post 7 years. Thus, the WAL is 9 years.
We employ a shorter tenor guarantee based on the recent MDBs WA maturity of outstanding loan portfolio (see Table A1.4). The average maturity of the MDB sovereign outstanding loans are 9 years. The IDB (2016) mentions that the tenor of EEA could be a minimum of 10 years and a maximum of 30 years. The 11-year tenor satisfies this requirement of the initial master agreement of the EEAs and is also has a similar WAL as of the MDB’s underlying exposure.
Table A1.4: Weighted Average Maturity of Outstanding Loans
MDB WA Maturity
ADB 9.5
IBRD 8.5
IDB 7.9
Average 8.6
In calibrating correlations for ratings-based Credit Portfolio Models (CPMs), it is important to note that, using the same asset-correlation in a one-period model where the one period represents, say, ten years, that one does by using the same asset correlation in a 10-year simulation of a model in which the time steps are 1-year each.
This phenomenon, known to CPM specialists, motivated rating agencies in approving multi-period models used in analysing credit Structured Investment Vehicles and Credit Derivative Product Companies (CDPCs) to require explicit adjustment in correlations when benchmarking again the agencies’ own single period models. The issue is discussed in Duponcheele, Perraudin, and Totouom-Tangho (2013). Here, we perform a calibration like in the past required by CRAs and implemented in Duponcheele, Perraudin and Tatoum-Tango (2013), namely adjusting correlations appropriate for a multi-period model (55%) in order to replicate the default correlations obtained in a 1-period model (31%).
The adjusted correlation to account for the reduction in a multi-period model we employ Monte-Carlo simulation and find the implied correlation for 12.5 year and 9 years given the initial correlation is 55%. We observe that for 12.5 year the pairwise correlation reduces to 31% while for 9-years it reduces to 35%[10].
The implied correlation assumption for different WALs is demonstrated in Table A1.5 to facilitate EEA transaction with different tenure compared to the two cases discussed in this study.
Table A1.5: Default Correlation Assumption for Different WAL
WAL Correlation
5 38
7 37
10 35
12 32
15 29 Note: Here WAL denotes Weighted Average Life. The correlation is in percentage
A1.2 MDB Implied Spread Here, we report estimates of the term structures of credit spreads on debt issuance over and above US Treasury bond prices. The estimates are obtained by implementing the Augmented Nelson-Siegel approach to price and characteristics data on individual bonds issued by specific MDBs (see Appendix 3 of Risk Control (2024d)). The algorithm yields both the yield term structure of bonds issued by MDBs and the spread between their yields and those of US treasury bonds. We average the spreads obtained by corresponding MDBs of same rating and produce spread by ratings (see Table A1.6). We deduce the implied cumulative PD by applying equation (A1.1)
Cumulative PDi,t = t× Annualised SpreadLGD t (A1.1)
Table A1.6: Annualised Spread by Ratings
Maturity AAA AA+ AA AA-
1 37 50 63 130
2 23 59 96 49
3 21 56 91 66
4 22 54 86 85
5 22 52 82 99
6 23 51 80 109
7 23 51 78 117
8 23 50 77 122
9 24 50 76 126
10 24 49 75 130
Here, i denotes rating and t denotes the tenor of the bond. We have assumed a LGD of 50% based on the Moody’s (2023) study. The cumulative PDs based on the MDB implied spreads for 12.5 years[11] and 9 years are shown in Table A1.7.
Table A1.7: Cumulative PDs for MDBs based on MDB Implied Spread
Ratings 12.5 Year 9 Year
AAA 5.91 4.23
AA+ 12.30 8.92
AA 18.70 13.61
AA- 32.39 22.71 Note: All units are in percentage.
Appendix 2: Transition Matrices
Here we present the risk-neutral 1 year transition matrices (TMs) employed in the calculation of the scaling factor based on provisioning. The two risk-neutral TMs are: a. Non-PCT adjusted TM this is used for estimating cumulative PD for an MDB default (see Table A2.1) b. PCT adjusted TM this is used for estimating cumulative PD for a sovereign default to an MDB (see Table A2.2)
Table A2.1: Historical TM without PCT
AAA AA+ AA AA- A+ A A- BBB+ BBB BBB- BB+ BB BB- B+ B B- CCC+ CCC CCC- CC DPC D
AAA 97.10 2.81 0.08 0.00 0.00 - - - - - - - - - - - - - - - - 0.01
AA+ 6.65 86.22 6.86 0.21 0.00 0.00 - - - - - - - - - - - - - - - 0.05
AA 0.19 6.85 85.71 6.93 0.23 0.00 0.00 - - - - - - - - - - - - - - 0.08
AA- 0.00 0.23 7.78 84.31 7.21 0.34 0.00 0.00 - - - - - - - - - - - - - 0.12
A+ 0.00 0.01 0.47 13.37 76.00 9.68 0.31 0.01 0.00 - - - - - - - - - - - - 0.15
A - 0.00 0.01 0.85 13.18 78.86 6.66 0.24 0.01 0.00 - - - - - - - - - - - 0.19
A- - - 0.00 0.02 0.75 11.85 79.30 7.35 0.48 0.01 0.00 - - - - - - - - - - 0.22
BBB+ - - - 0.00 0.02 0.76 13.14 72.38 12.68 0.75 0.01 0.00 - - - - - - - - - 0.26
BBB - - - - 0.00 0.03 1.14 16.74 70.17 11.20 0.42 0.01 0.00 - - - - - - - - 0.29
BBB- - - - - - 0.00 0.04 1.32 14.83 75.94 7.16 0.38 0.01 0.00 - - - - - - - 0.33
BB+ - - - - - - 0.00 0.06 1.54 19.91 67.55 9.83 0.59 0.02 0.00 - - - - - - 0.50
BB - - - - - - - 0.00 0.06 1.61 14.88 70.79 11.25 0.71 0.03 0.00 - - - - - 0.68
BB- - - - - - - - - 0.00 0.04 0.85 10.61 74.58 12.05 1.00 0.03 0.00 - - - - 0.85
B+ - - - - - - - - - 0.00 0.02 0.59 10.67 70.47 15.66 0.88 0.02 0.00 - - - 1.70
B - - - - - - - - - - 0.00 0.02 0.79 13.97 71.78 10.48 0.41 0.01 0.00 - - 2.54
B- - - - - - - - - - - - 0.00 0.03 1.14 15.17 69.56 6.68 0.38 0.03 0.00 - 7.01
CCC+ - - - - - - - - - - - - 0.00 0.08 2.31 25.88 46.49 6.79 1.08 0.37 - 17.01
CCC - - - - - - - - - - - - - 0.00 0.06 1.41 6.55 29.63 10.11 6.98 - 45.26
CCC- - - - - - - - - - - - - - - 0.00 0.00 0.00 0.00 5.07 10.15 - 84.78
CC - - - - - - - - - - - - - - - 0.00 0.00 0.00 0.00 0.00 - 100.00
DPC - - - - - - - - - - - - - - - - - - - - - 100.00
D - - - - - - - - - - - - - - - - - - - - - 100.00 Note: The source of the TM is Table A4.1 from Risk Control (2024b). Here we have disaggregated the CCC rating while in the Risk Control (2024b) it is aggregated for CCC and CC. The units are in percentage. The rating category DPC denotes ‘Default to Private Creditors’.
In Table A2.3, we present the risk-adjusted 1 year transition matrices (TMs) employed in the calculation of the scaling factor based on fair-value of the guarantee. The TM is PCT adjusted and used for estimating cumulative PD for a sovereign default to an MDB
Table A2.2: Historical TM with PCT
AAA AA+ AA AA- A+ A A- BBB+ BBB BBB- BB+ BB BB- B+ B B- CCC+ CCC CCC- CC DPC D
AAA 97.10 2.81 0.08 0.00 0.00 - - - - - - - - - - - - - - - - 0.01
AA+ 6.65 86.22 6.86 0.21 0.00 0.00 - - - - - - - - - - - - - - 0.03 0.02
AA 0.19 6.85 85.71 6.93 0.23 0.00 0.00 - - - - - - - - - - - - - 0.05 0.03
AA- 0.00 0.23 7.78 84.31 7.21 0.34 0.00 0.00 - - - - - - - - - - - - 0.08 0.04
A+ 0.00 0.01 0.47 13.37 76.00 9.68 0.31 0.01 0.00 - - - - - - - - - - - 0.10 0.05
A - 0.00 0.01 0.85 13.18 78.86 6.66 0.24 0.01 0.00 - - - - - - - - - - 0.12 0.07
A- - - 0.00 0.02 0.75 11.85 79.30 7.35 0.48 0.01 0.00 - - - - - - - - - 0.14 0.09
BBB+ - - - 0.00 0.02 0.76 13.14 72.38 12.68 0.75 0.01 0.00 - - - - - - - - 0.16 0.10
BBB - - - - 0.00 0.03 1.14 16.74 70.17 11.20 0.42 0.01 0.00 - - - - - - - 0.16 0.14
BBB- - - - - - 0.00 0.04 1.32 14.83 75.94 7.16 0.38 0.01 0.00 - - - - - - 0.15 0.18
BB+ - - - - - - 0.00 0.06 1.54 19.91 67.55 9.83 0.59 0.02 0.00 - - - - - 0.30 0.21
BB - - - - - - - 0.00 0.06 1.61 14.88 70.79 11.25 0.71 0.03 0.00 - - - - 0.43 0.25
BB- - - - - - - - - 0.00 0.04 0.85 10.61 74.58 12.05 1.00 0.03 0.00 - - - 0.52 0.33
B+ - - - - - - - - - 0.00 0.02 0.59 10.67 70.47 15.66 0.88 0.02 0.00 - - 1.27 0.43
B - - - - - - - - - - 0.00 0.02 0.79 13.97 71.78 10.48 0.41 0.01 0.00 - 1.93 0.61
B- - - - - - - - - - - - 0.00 0.03 1.14 15.17 69.56 6.68 0.38 0.03 0.00 6.15 0.86
CCC+ - - - - - - - - - - - - 0.00 0.08 2.31 25.88 46.49 6.79 1.08 0.37 16.08 0.93
CCC - - - - - - - - - - - - - 0.00 0.06 1.41 6.55 29.63 10.11 6.98 43.57 1.69
CCC- - - - - - - - - - - - - - - 0.00 0.00 0.00 0.00 5.07 10.15 70.96 13.82
CC - - - - - - - - - - - - - - - 0.00 0.00 0.00 0.00 0.00 81.59 18.41
DPC - - - - - - - - - - - - - - 4.55 27.27 22.73 2.27 2.27 4.55 29.55 6.82
D - - - - - - - - - - - - - - - - - - - - - 100.00 Note: The source of the TM is Table 3.1 from Risk Control (2024b). Here we have disaggregated the CCC rating while in the Risk Control (2024b) it is aggregated for CCC and CC. The units are in percentage. The rating category DPC denotes ‘Default to Private Creditors’.
Tabel A2.3: Risk-adjusted TM with PCT
AAA AA+ AA AA- A+ A A- BBB+ BBB BBB- BB+ BB BB- B+ B B- CCC/CC DPC D
AAA 89.28 7.91 1.10 0.58 0.07 - - - - - - - - - - - - 0.81 0.25
AA+ 9.86 65.28 14.21 7.49 0.82 0.73 - - - - - - - - - - - 1.22 0.38
AA 3.30 5.52 58.30 19.20 6.00 2.71 3.00 - - - - - - - - - - 1.51 0.47
AA- 0.27 0.44 1.79 48.10 8.05 3.78 32.13 3.21 - - - - - - - - - 1.71 0.52
A+ 0.10 0.03 0.06 0.79 34.67 5.87 44.07 8.74 3.21 - - - - - - - - 1.86 0.57
A - 0.00 0.00 0.00 0.22 33.21 45.43 11.09 5.34 2.19 - - - - - - - 1.92 0.59
A- - - 0.00 0.00 0.00 0.90 60.90 18.40 12.01 4.61 0.61 - - - - - - 1.96 0.60
BBB+ - - - 0.00 0.00 0.17 3.92 31.62 23.63 32.96 3.05 1.91 - - - - - 2.11 0.65
BBB - - - - 0.00 0.02 1.25 4.19 33.42 42.29 7.40 5.37 2.95 - - - - 2.38 0.73
BBB- - - - - - 0.00 0.25 1.20 3.03 50.11 13.06 17.28 9.44 2.01 - - - 2.78 0.86
BB+ - - - - - - 0.00 0.00 0.00 1.17 17.09 32.68 30.46 12.57 1.44 - - 3.52 1.08
BB - - - - - - - 0.00 0.00 0.00 0.00 33.57 37.23 20.44 3.40 0.37 - 3.81 1.17
BB- - - - - - - - - 0.00 0.00 0.00 0.00 43.73 38.22 9.53 2.84 0.08 4.28 1.32
B+ - - - - - - - - - 0.00 0.00 0.00 0.04 52.07 21.16 18.70 1.49 5.00 1.54
B - - - - - - - - - - 0.00 0.00 0.00 0.01 32.84 49.82 9.13 6.27 1.93
B- - - - - - - - - - - - 0.00 0.00 0.00 0.66 68.61 18.41 9.42 2.90
CCC/CC - - - - - - - - - - - - 0.00 0.00 0.00 0.02 49.66 38.48 11.84
DPC - - - - - - - - - - - - - - 4.55 27.27 31.82 29.55 6.82
D - - - - - - - - - - - - - - - - - - 100.00 Note: The source of the TM is Table 3.3 from Risk Control (2024b). The units are in percentage. The rating category DPC denotes ‘Default to Private Creditors’.
Appendix 3: Correlation Methodology
Correlation assumptions are crucial inputs to credit portfolio analysis. One common practice is to base correlations on equity return data. For the equity index-based approach, we use a mixture of country and region equity indices provided by MSCI. We use monthly time series index data from 2004-01-30 to 2022-12-30. We calculate the monthly log returns by rt = log(xt) −log(xt−1) where xt is the index value on month t, then calculate the pairwise correlations between each index. A list of all countries with sufficient country index data is shown in Table A3.1.
Table A3.1: Countries with Sufficient Country Index Data
Region Countries
Austria, Belgium, Croatia, Czech Republic, Denmark, Estonia, Finland, France, Germany,
Europe and Middle East Greece, Hungary, Ireland, Israel, Italy, Jordan, Lebanon, Netherlands, Norway, Poland,
Portugal, Slovenia, Spain, Sweden, Switzerland, Turkey, United Kingdom
Africa Egypt, Kenya, Mauritius, Morocco, Nigeria, South Africa
Australia, China, Hong Kong, India, Indonesia, Japan, Korea, Malaysia, New Zealand, Asia Pakistan, Philippines, Singapore, Sri Lanka, Taiwan, Thailand
North America Canada, USA
Latin America and Argentina, Brazil, Chile, Colombia, Mexico, Peru Caribbean
Table A3.2: Countries with Insufficient Country Index Data
Region Country
Albania, Bahrain, Belarus, Bosnia and Herzegovina, Bulgaria, Iceland, Iran, Iraq, Jersey, Kosovo, Kuwait, Europe and Middle East Lithuania, Luxembourg, Macedonia, Moldova, Montenegro, Oman, Qatar, Romania, Russia, Saudi (EM) Arabia, Serbia, Syria, Ukraine, United Arab Emirates, Yemen
Algeria, Angola, Benin, Botswana, Burkina Faso, Burundi, Cameroon, Cape Verde, Central African
Republic, Chad, Comoros, Democratic Republic of the Congo, Djibouti, Equatorial Guinea, Eritrea,
Africa Ethiopia, Gabon, Gambia, Ghana, Guinea, Guinea-Bissau, Ivory Coast, Lesotho, Liberia, Libya,
(EFM) Madagascar, Malawi, Mali, Mauritania, Mozambique, Namibia, Niger, Republic of the Congo, Rwanda,
Sao Tome and Principe, Senegal, Seychelles, Sierra Leone, Somalia, South Sudan, Sudan, Swaziland,
Tanzania, Togo, Tunisia, Uganda, Zambia, Zimbabwe
Afghanistan, Armenia, Azerbaijan, Bangladesh, Bhutan, Brunei, Cambodia, Cook Islands, Fiji, Georgia,
Asia Kazakhstan, Kiribati, Kyrgyzstan, Laos, Maldives, Marshall Islands, Micronesia, Mongolia, Myanmar,
(EFM) Nepal, Palau, Papua New Guinea, Samoa, Solomon Islands, Tajikistan, Timor-Leste, Tonga,
Turkmenistan, Tuvalu, Uzbekistan, Vanuatu, Vietnam
Antigua and Barbuda, Bahamas, Barbados, Belize, Bermuda, Bolivia, Cayman Islands, Costa Rica, Latin America Dominican Republic, Ecuador, El Salvador, Grenada, Guatemala, Guyana, Haiti, Honduras, Jamaica, (EM) Nicaragua, Panama, Paraguay, Saint Lucia, Suriname, Trinidad and Tobago, Uruguay, Venezuela
In the case that no country index exists, or the index data does not cover the whole sample period, we map the country to a region index. We use four region indexes: EM Europe and Middle East, EFM Africa, EFM Asia and EM Latin America. Here, EFM stands for Emerging Frontier Markets and EM stands for Emerging Markets. A list of all countries with insufficient country index data is shown in Table A3.2.
We now explain the calculation of the country/sector correlation matrix, including countries with and without sufficient country index data. Each factor (a country or sector) is mapped to a corresponding index. There are two cases: (1) countries with sufficient index data and sectors are mapped to their specific index and (2) countries with insufficient index data are mapped to their region index. We then assign idiosyncratic risk weights. In case (1), the idiosyncratic risk weights are zero. In case (2), the idiosyncratic risk weight is taken to be 0.75. Compared to idiosyncratic risk weights computed by regression analysis (see section on correlation structure in Risk Control (2024a)), this may be regarded as a conservative estimate.
Correlations between factors are then calculated according to equation A3.1.
2 ρ(i[1], i[2]) 2 √1 −η[2] if f[1] ≠f[2] (A3.1) ρ(f[1], f[2]) = {√1 −η[1] 1 if f[1] = f[2]
Here, f[1], f[2] are two factors (countries or sectors), i[1], i[2] are the corresponding indexes (countries or regions) and η[1], η[2] are the idiosyncratic risk weights.
The factor assigned for the sovereign’s are the respective sovereign country while a regional factor is assigned to MDB based on the MDB’s headquarter location. Thus, ADB, AfDB, IBRD and IDB are assigned Asia, Africa, North America, and Latin America and Caribbean, respectively.
Appendix 4: Scaling Factor for Investment Grade MDBs
In this MDB we provide the scaling factor between two investment grades rated MDBs, i.e. banks rated above or equal to BBB-.
Table A4.1: Scaling Factor based on Provisioning Approach Panel a) Correlation of 31% and WAL of 12.5 Year Panel b) Correlation of 35% and WAL of 9 Year
BBB BB B CCC CC BBB BB B CCC CC
AAA & AA+ 102.0 101.7 101.2 100.9 100.7 AAA & AA+ 102.1 101.7 101.2 100.8 100.6
AAA & AA 104.0 103.3 102.5 101.7 101.5 AAA & AA 104.0 103.3 102.4 101.5 101.2
AAA & AA- 105.8 104.8 103.6 102.6 102.2 AAA & AA- 105.8 104.8 103.5 102.2 101.9
AAA & A+ 107.3 106.1 104.7 103.3 102.9 AAA & A+ 107.4 106.1 104.5 102.9 102.4
AAA & A 108.8 107.4 105.7 104.1 103.6 AAA & A 108.9 107.4 105.5 103.5 103.0
AAA & A- 110.7 109.0 106.9 105.0 104.4 AAA & A- 110.6 108.9 106.6 104.3 103.6
AAA & BBB+ 112.7 110.7 108.3 106.0 105.3 AAA & BBB+ 112.4 110.4 107.8 105.1 104.3
AAA & BBB 114.4 112.2 109.4 106.9 106.1 AAA & BBB 114.0 111.8 108.9 105.8 104.9
AAA & BBB- 116.9 114.4 111.2 108.2 107.3 AAA & BBB- 116.2 113.7 110.3 106.8 105.8
AA+ & AA 101.9 101.6 101.2 100.9 100.8 AA+ & AA 101.9 101.6 101.2 100.7 100.6
AA+ & AA- 103.6 103.1 102.4 101.7 101.5 AA+ & AA- 103.6 103.0 102.3 101.5 101.2
AA+ & A+ 105.2 104.4 103.4 102.4 102.2 AA+ & A+ 105.1 104.3 103.2 102.1 101.8
AA+ & A 106.7 105.7 104.4 103.2 102.8 AA+ & A 106.6 105.6 104.2 102.8 102.3
AA+ & A- 108.5 107.2 105.6 104.1 103.6 AA+ & A- 108.3 107.0 105.3 103.5 103.0
AA+ & BBB+ 110.4 108.9 106.9 105.1 104.5 AA+ & BBB+ 110.1 108.6 106.5 104.3 103.7
AA+ & BBB 112.1 110.4 108.1 106.0 105.3 AA+ & BBB 111.6 109.9 107.5 105.0 104.3
AA+ & BBB- 114.5 112.5 109.8 107.3 106.5 AA+ & BBB- 113.8 111.7 109.0 106.0 105.2
AA & AA- 101.7 101.5 101.1 100.8 100.7 AA & AA- 101.7 101.4 101.1 100.7 100.6
AA & A+ 103.2 102.7 102.1 101.6 101.4 AA & A+ 103.2 102.7 102.1 101.4 101.2
AA & A 104.7 104.0 103.1 102.3 102.0 AA & A 104.6 103.9 103.0 102.0 101.7
AA & A- 106.5 105.5 104.3 103.2 102.9 AA & A- 106.3 105.4 104.1 102.8 102.3
AA & BBB+ 108.4 107.2 105.7 104.2 103.7 AA & BBB+ 108.0 106.9 105.3 103.6 103.0
AA & BBB 110.0 108.6 106.8 105.1 104.5 AA & BBB 109.5 108.2 106.3 104.3 103.6
AA & BBB- 112.4 110.7 108.5 106.4 105.7 AA & BBB- 111.7 110.0 107.7 105.3 104.5
AA- & A+ 101.5 101.3 101.0 100.7 100.6 AA- & A+ 101.5 101.2 101.0 100.6 100.5
AA- & A 102.9 102.5 102.0 101.5 101.3 AA- & A 102.9 102.5 101.9 101.3 101.1
AA- & A- 104.6 104.0 103.2 102.4 102.1 AA- & A- 104.5 103.9 103.0 102.0 101.7
AA- & BBB+ 106.5 105.6 104.5 103.4 103.0 AA- & BBB+ 106.2 105.4 104.1 102.8 102.4
AA- & BBB 108.2 107.1 105.6 104.2 103.8 AA- & BBB 107.7 106.6 105.1 103.5 103.0
AA- & BBB- 110.5 109.1 107.3 105.5 104.9 AA- & BBB- 109.8 108.4 106.6 104.5 103.9
A+ & A 101.4 101.2 101.0 100.7 100.6 A+ & A 101.4 101.2 100.9 100.6 100.5
A+ & A- 103.1 102.7 102.2 101.6 101.4 A+ & A- 103.0 102.6 102.0 101.4 101.2
A+ & BBB+ 105.0 104.3 103.4 102.6 102.3 A+ & BBB+ 104.7 104.1 103.2 102.2 101.9
A+ & BBB 106.6 105.7 104.6 103.5 103.1 A+ & BBB 106.2 105.3 104.1 102.9 102.5
A+ & BBB- 108.9 107.8 106.2 104.7 104.2 A+ & BBB- 108.2 107.1 105.6 103.8 103.3
A & A- 101.7 101.5 101.2 100.9 100.8 A & A- 101.6 101.4 101.1 100.7 100.6
A & BBB+ 103.5 103.1 102.4 101.9 101.7 A & BBB+ 103.3 102.8 102.2 101.5 101.3
A & BBB 105.1 104.4 103.6 102.7 102.4 A & BBB 104.7 104.1 103.2 102.2 101.9
A & BBB- 107.4 106.5 105.2 104.0 103.6 A & BBB- 106.7 105.8 104.6 103.2 102.8
A- & BBB+ 101.8 101.6 101.3 101.0 100.9 A- & BBB+ 101.6 101.4 101.1 100.8 100.7
A- & BBB 103.3 102.9 102.4 101.8 101.6 A- & BBB 103.0 102.6 102.1 101.5 101.3
A- & BBB- 105.6 104.9 104.0 103.0 102.7 A- & BBB- 105.0 104.4 103.5 102.4 102.1
BBB+ & BBB 101.5 101.3 101.1 100.8 100.8 BBB+ & BBB 101.4 101.2 101.0 100.7 100.6
BBB+ & BBB- 103.7 103.3 102.7 102.1 101.9 BBB+ & BBB- 103.4 102.9 102.3 101.6 101.4
BBB & BBB- 102.2 101.9 101.6 101.2 101.1 BBB & BBB- 101.9 101.7 101.4 101.0 100.8 Note: All the values are in percentage. Here WAL denotes Weighted Average Life.
Notes
[1] This relies on the fundamental result of valuation theory that market prices equal discounted expected payoffs with risk neutral distributions.
[2] It may be argued that the Standard & Poor’s approach is excessively conservative in its evaluation of SNC. See Risk Control (2024e) and the earlier studies it cites.
[3] This is why a highly rated entity may have an EL of 2 basis points even though spreads may be 40 basis points.
[4] Here, we count only one side of the EEA so the total volume of MDB loans involved is $20 billion.
[5] Strictly, speaking, the counterparty risk-associated ELs depend not just on the MDB’s ratings (i.e., PDs) but also on the correlations between defaults by the MDBs and defaults of the sovereigns for which they provide guarantees. Even with the same rating, it would be possible for correlations to differ across MDBs in which case the effect of counterparty risk would not net off in the determination of an appropriate scaling factor. In the analysis presented in Section 3, we generally assume that the MDB-sovereign default correlations are equal for each MDB so that if the MDBs have the same rating, there is no counterparty risk issue.
[6] For example, if an MDB is rated ‘AAA’, ‘AA+’ and ‘AA’ by the three-rating group the median rating would be average of 1, 2 and 3. The average is 2 and assign the median rating as ‘AA+’.
[7] For example, if the WAL of the EEA transaction is 7 years, the default correlation (ρ) parameter would be 37% (see Table A1.5). Ratings 12.5 Year 9 Year AAA 0.20 0.13 AA+ 0.59 0.42 AA 1.01 0.73 AA- 1.43 1.04 Note: All PDs are in percentage. Ratings 12.5 Year 9 Year BBB 1.92 1.36 BB 4.04 2.78 B 11.00 7.70 CCC 28.49 24.56 CC 38.81 35.56 Note: All PDs are in percentage.
[8] We calculate the nth year cumulative PD by taking the last column of the nth power of the annual TM. We estimate 12.5- year cumulative PD by taking the average of 12-year and 13-year cumulative PDs. Note: WA denotes Weighted Average. Maturity is in years. The data comes from the MDB’s 2023 Annual Reports.
[9] The factor assigned for the sovereign’s are the respective sovereign country while a regional factor is assigned to MDB based on the MDB’s headquarter location. Thus, ADD, AfDB, IBRD and IDB are assigned Asia, Africa, North America, and Latin America and Caribbean, respectively. Note: All units are in basis points. The annualised spread for AA+ is approximated as an average spread between AAA and AA.
[10] The implied correlation is calculated based on the default joint probability of the MDB and underlying exposure obtained from the Monte-Carlos simulation and equating to the analytical joint probability of two standard gaussian variables with correlation rho.
[11] A flat term-structure is assumed after 10 years; thus, the annualised spread for 12.5 years is same as that of the 10 years. Note: All the values are in percentage. Here the WAL assumed is 12.5 years and a correlation of 31%.