

Specialist guarantee companies can play a valuable role in financial markets when other intermediaries such as banks or bond market investors are unable or unwilling to take on specific risks.
Glossary
ABS Asset-backed Security GWP Gross Written Premium
ADB Asian Development Bank ICIEC Islamic Corporation for the Insurance of Investment and Export Credit
AFD French Development Agency IFFEd International Finance Facility for Education
AfDB African Development Bank IFS Insurer Financial Strength
AG Assured Guaranty IFU Danish Investment Fund for Developing Countries
AGE Established Assured Guaranty (Europe) SA LAE Loss Adjustment Expenses
AGF African Guarantee Fund MBIA Municipal Bond Insurance Association Insurance Corporation
AGL Assured Guaranty Ltd. MBS mortgage-backed securities
AGLN Assured Guaranty (London) plc MDB Multilateral Development Bank
AGM Assured Guaranty Municipal Corporation MGIC Mortgage Guaranty Insurance Corporation
AGMH Assured Guaranty Municipal Holdings Inc. MISC Municipal Issuers Service Corporation
AGUK Assured Guaranty UK Ltd. MoC Meeting of Contributors
AMBAC American Municipal Bond Insurance Corporation NAIC National Association of Insurance Commissioners
ASEAN Association of Southeast Asian Nations NASD National Association of Security Dealers
ATIDI African Trade & Investment Development Insurance NDF Nordic Development Fund National Public Finance Guarantee Corp
BAM Build America Mutual NPFG National Public Finance Guarantee Corporation
BII British International Investment OECD Organisation for Economic Co-operation
BMA Business Model Analysis OTC Over-the-counter
CDO collateralised debt obligation P&C Property and Casualty
CGIF Credit Guarantee and Investment Facility PCT Preferred Creditor Treatment
CIFG Compagnie Industrielle et Financière de Garanties PFI Private Finance Initiative
CLF Crédit Local de France PIDG Private Infrastructure Development Group
DAC Development Assistance Committee PPP Public-private Partnership
DFI Development Finance Institution PRA Prudential Regulatory Authority
EEA European Economic Area PRI Political Risk Insurance
EMDE Emerging Market and Developing Economy RoE Return on Equity
FCDO Foreign Commonwealth and Development Office SECO State Secretariat for Economic Affairs
FGIC Financial Guaranty Insurance Company S&P Standard & Poor’s
FSA Financial Security Assurance SME Small and Medium-sized Enterprise
FSAH Financial Security Assurance Holdings Ltd. SMI Specialist Multilateral Insurer
GFC Global Financial Crisis SPV Special Purpose Vehicle
GGC Green Guarantee Company TCX The Currency Exchange Fund
GMC GuarantCo Management Company WAEMU West African Economic and Monetary Union
Executive Summary
Specialist guarantee companies can play a valuable role in financial markets when other intermediaries such as banks or bond market investors are unable or unwilling to take on specific risks.
An example is the guarantees that monoline insurers provided for infrastructure debt in the 1990s and early 2000s. In those years, several developed-economy governments wished to raise funding for public investment without encumbering their balance sheets. Corporates also sought financing for investment purposes either through their own on-balance-sheet debt issues or via bankruptcy remote Special Purpose Vehicles (SPVs). Saving institutions like pension funds lacked the infrastructure teams necessary to evaluate the complex risks involved. The solution was that monoline insurers provided guarantees, raising the ratings of bond issues. They acted as controlling creditors, monitoring project conditions and covenants on behalf of all creditors.
The monoline insurers just described had emerged earlier in the United States (US) municipal bond market. In that context, tax considerations provided incentives that fragmented the market, motivating retail investors to invest in non-diversified ways in opaque bond issues. Again, the monolines provided a solution by supplying 100% wraps on municipal bond issues. These wraps mitigated the effects of informational asymmetry and a taxinduced lack of diversification.
This study examines the experience of monoline insurers to see whether one may draw lessons for the use of specialist guarantee companies in Emerging Market and Developing Economy (EMDE) countries. Donor countries and Development Banks (multilateral and bilateral) have invested in specialist guarantee companies. We review the activities of these EMDE guarantee companies, commenting on constraints and the potential they offer to drive development financing.
The report aims to inform donor-country decision makers considering whether to invest in specialist guarantee companies. We believe that in reviewing the experience of the monolines and studying EMDE guarantee companies, the study may be of interest also to operators of guarantee companies and even for institutional investors.
Our analysis draws on interviews with more than forty industry practitioners including past and current staff of developed-market monolines, Development Finance Institutions (DFIs) and specialist EMDE guarantee funds. We analyse the financial statements and ratings of a prominent developed market monoline and two EMDE guarantee funds to understand the constraints they face, most notably the assessments they receive from rating agencies and the profitability of their business models.
Here, we emphasise four aspects of developed market monolines that may serve to clarify thinking about the role and prospects of EMDE guarantee funds: (i) Products, (ii) Business Models, (iii) Constraints and (iv) Culture.
• On products, the monolines identified areas in which they could add value through the guarantee instruments in which they were expert. In the first such area, municipal bonds, US tax rules accorded monoline guarantees specific advantages. In the second area, infrastructure debt, capital rules made banks reluctant to lend for the long tenors required for project finance. Investment institutions such as pension funds and asset managers potentially interested in financing infrastructure lacked the specialist teams necessary to evaluate project exposures. The monolines entrenched their role by acting as controlling creditor, monitoring, and enforcing covenants and operating conditions. Even in structured finance, although it is clear in retrospect that some monolines poorly understood risk and pricing, they developed specific products which other entities could not supply.
• On business models, the one major monoline that survived the Global Financial Crisis (GFC), Assured Guaranty (AG), describes its business model in its investor communications. The description emphasises the firm’s products, when it pays out on claims, the timing of its contractual premium payment, how it monitors and reviews its portfolio of exposures, how it manages its investments and what are barriers to entry that protects its business. This description implicitly sets out elements of the firm’s financial statements and how they interact in different scenarios. This latter view of an insurer corresponds to how supervisors in the Bank of England explain their own use of Business Model Analysis (BMA) in assessing insurers for which they are responsible. In our interviews with former and current monoline staff, other more specific aspects of the monoline business models were emphasised, specifically a focus on strict underwriting standards, close consideration paid to legal contracting, and the monitoring of exposures through such activities as the controlling creditor role.
• On constraints, the financial performance of a guarantee fund depends on whether the choices it makes optimise its business subject to the limits it faces. Guarantee companies balance the credit rating they obtain from rating agencies against the leverage they can achieve, the price they can charge for their guarantees and the demand for their services that will result. These considerations collectively require a careful financial analysis informed by the rating scorecards employed by the rating agencies.
• On culture, at least in infrastructure and municipals, the monoline staff we interviewed emphasised their strong underwriting culture with deep expertise in their chosen specialist asset classes. The success that they had in constructing expert teams is underlined by the fact that following the failure of several monolines in the GFC, the specialist underwriting staff they employed were snapped up by other firms that used other business models to service ultimate clients, such as private debt funds. Of course, the major setback the sector faced following the GFC reflected a major failure of underwriting in which the monolines, in common with other financial entities, were tempted by the profits on offer in some under-regulated parts of the United States mortgage-backed securitisation market.
What prescriptions do the above points imply for donor-country decisionmakers considering whether to invest in specialist guarantee companies?
1. A narrow focus on products and the appetite that customers may have for them is essential. Products should have features that make them less contestable by competitors so that sustainable businesses can be built.
2. Coherent business model that uses capital effectively and offer possibilities of scalability, alleviating but also exploiting market inefficiencies, so that the enterprise is not simply a temporary solution to a short-term market failure. Note that the monolines were organised as insurers rather than guarantee companies, a business model that, although more complex than guarantors organised as funds or companies, offered the advantage of rigorous disciplines and natural channels to the reinsurance market.
3. Thoughtful and coherent ratings (and depending on the business model adopted, regulatory) strategies are important. Those demanding guarantees from monolines required a high target rating of AA or higher. But, for purchasers of EMDE debt guarantees, a much lower rating may be perfectly acceptable. In either case, a coherent rating strategy is key to success. Ratings strategies should include consideration of tools to sustain ratings as the business develops. Unlike the monolines which largely retained risk on balance sheet, EMDE guarantee companies should find ways of using reinsurance/syndication and the network of brokers and intermediaries that accompany it. These latter contribute a valuable discipline, protecting guarantors from taking ill-advised risk.
4. Building expertise and controlling costs while suitably remunerating and incentivising key staff are key aspects of the businesses the monolines created. Controlling costs is important since the demand for guarantees is price elastic and businesses are only sustainable if they are prudent in this regard.
In suggesting issues that donor-country investors in guarantee companies should bear in mind, we focus on scalability and financial sustainability, omitting development impact. To do otherwise would take us too far afield and the experience of the monolines would suggest no lessons. Note that financial performance is not irrelevant for development impact since for many of the most prominent Development Finance Institutions (DFIs) (for example, the African Development Bank (AfDB) and the International Bank for Reconstruction and Development (IBRD)), the vast majority of current capital sustaining development activity consists of surpluses accumulated historically over multiple decades.
1. Introduction
Credit guarantees (henceforward simply “guarantees”) are a flexible financial instrument for facilitating financial flows when the provider of financing is reluctant to assume in part or in full the credit risks involved. Guarantees have no direct risk or pricing advantage over loans. This is why rating agencies, regulators, MDBs and commercial banks all regard banks’ exposures to guarantees and loans as equivalent for capital adequacy purposes. Guarantees may be easier to employ than loans for certain public organisations but this is a matter of government accounting and mandates.
Guarantees have one major advantage, namely that they permit one to split the bearing of credit risk from that of providing funding. This ‘division-of-labour’ feature can be important
- When loans are in a local currency but a hard currency guarantor is willing to bear the credit risk[1],
- When a guarantor has superior underwriting capabilities but not the facilities or expertise to raise funding or
- When the guarantor has a different regulatory treatment than the lender[2].
Guarantees also have the advantage that they can be layered (with counter-guarantees/reinsurance) or tranched in complex ways to redistribute credit risk. Overall, however, guarantees are more complex than loans as, for the former, three parties must agree rather than two.
This paper considers the use of guarantees in development finance and, specifically, by specialist guarantee companies.
One may ask why employ specialist companies to provide guarantees rather than using the balance sheet of a development bank or of a donor government?[3] For example, some bilateral donors such as the United States’ Development Finance Institution (DFI) and Multilateral Development Banks (MDBs) such as the International Finance Corporation (IFC) have built significant guarantee books.
There are several arguments in favour of specialist funds. Large MDBs, especially those concentrating on sovereign lending, may lack the focus and specialist knowledge to structure guarantees for specific asset classes. They also may not have the capabilities to transfer risk on guarantees to the wider financial markets as insurers can. Also, and importantly, guarantees serve to increase the rating of the underlying loan/bond as far as the lender/investor is concerned. In many EMDEs, lenders/investors have no need of a AAA/AA rating that a guarantee from a large MDB will confer. Potentially, guarantee funds operating on lower ratings can be just as effective while leveraging their capital more than is possible for a very highly rated MDB.[4]
In developed markets, specialist guarantee companies have been used extensively. A prominent example is the monoline insurance industry which emerged in the US municipal bond market in the 1970s and 1980s.[5] This industry grew strongly in the 1990s and early 2000s by offering credit guarantees for structured products and infrastructure debt and then contracted sharply following structured product losses in the GFC of 2007-2010. Other examples of the use of guarantees in developed markets are the public guarantee companies established, for example, in many European countries in Europe to support bank lending to Small and Medium-sized Enterprises (SMEs).
Below, we examine what lessons may be drawn from the role of monolines in developed markets for guarantee companies operating in EMDEs. Particularly relevant is the infrastructure debt guarantees offered by prominent monolines. While the bulk of monolines’ guarantee activities has involved municipal bonds and structured finance, in the 1990s and early 2000s, several monolines created international subsidiaries that guaranteed infrastructure debt. This latter activity permitted project finance borrowers to tap long-tenor capital market financing for which no alternative was at the time available without sovereign guarantees. This experience is particularly relevant for EMDE countries, many of which are saddled with substantial external debt and, hence, would benefit from access to project finance that does not encumber government balance sheets.
One might believe that the role played by monolines in the US municipal bond market is also relevant to understanding what guarantee companies could achieve in EMDEs. The monolines effectively mitigated informational asymmetries in a market in which many small issuers with opaque credit standing wished to raise funds. In this, however, the special role of tax incentives in the US municipal bond market must be taken into consideration.
Having drawn lessons from the experience of monoline insurers, we examine a set of specialist guarantee companies established to operate in EMDEs. These have benefitted from equity investments by bilateral and multilateral DFIs. Examples of such companies include the African Guarantee Fund (AGF), the Credit Guarantee and Investment Facility (CGIF), Dhamana Guarantee Company, the Green Guarantee Company (GGC), GuarantCo, InfraCredit, and InfraZamin.[6]
A reference point for the guarantee organisations analysed in this study is the entities employed by many Multilateral Development Banks (MDBs) as vehicles for donor spending. To illustrate, a major MDB like the Asian Development Bank (ADB) has fifty-five trust funds through which it channels contributions to development made in large part by its shareholder governments. In a few cases, these organisations are set up with their own internal governance arrangements as free-standing bodies. An example is the Credit and CGIF which we examine in Section 3.4. Another is International Finance Facility for Education (IFFEd), set up following an initiative by Gordon Brown, the former UK prime minister.[7]
Another important reference point for EMDE guarantee companies is the two Specialist Multilateral Insurers (SMIs) established by (a) African sovereigns and the African Development Bank (AfDB) and (b) the Islamic Development Bank. These two organisations, the African Trade & Investment Development Insurance (ATIDI) and the Islamic Corporation for the Insurance of Investment and Export Credit (ICIEC), operate as independent organisations and have built substantial and profitable guarantee businesses in their respective areas of operation, Africa in the case of ATIDI and Africa, Asia, and the Middle East in the case of ICIEC.
Note that monoline insurers are a special case of guarantee companies, namely those that have chosen to constitute themselves as insurers. In ways that depend on the regulatory jurisdiction in which they operate, this gives them particular rights to do business and constrains them, for example, to meet regulatory capital and reporting requirements and to follow specific accounting approaches. It is more straightforward for them than for non-insurers to secure reinsurance because their contracts and ways of operating are consistent with those of the wider insurance market. Rating agency methodologies for assessing monoline credit insurers also typically differ from those applied to non-insurer guarantee companies. While it is more complex to create a monoline insurer than a non-insurer guarantee company, the disciplines and transparency of the insurer business model may have advantages.
Questions we address in this study include:
1. How did guarantees support the advent and scaling of new asset classes in developed markets under the auspices of monoline insurers and their peers, to enable asset-backed securities (ABS), municipal bonds, project and infrastructure bonds, privatisations financed through capital markets etc. at scale?
What are the main interventions and practical steps that occurred in their evolution and prime? What are the key ingredients of success that enabled this to occur?
2. What have been the limitations and pitfalls in the use of guarantees in developed countries and negative impacts? What are the risks to economic development in using guarantee products in developing countries?
3. To what extent are the current suite of private and public guarantee instruments delivering on mobilisation at true scale for developing countries? What learnings have they delivered in relation to scale and contribution to market development? Reflecting on the suite of guarantees currently available from both policy-based and commercial providers in developing countries, what are the constraints and untapped opportunities to achieve those ends?
4. What are suggested ways of using scarce public money to drive mobilisation at greater scale in developing countries? How might one seek to apply historic lessons and current practice from mainstream, developed financial markets (for example, the experience of the publicly rated universe and prominent international insurance centres such as New York and London) to developing countries? Can one identify drivers to breaking through constraints to replicating developed country successes in developing countries?
5. What are the risks and limitations of using guarantees, and do guarantors have a long-term future or are they always confined to the “catalytic” phase of market creation?
6. To what extent are the current suite of private and public guarantee instruments delivering on mobilisation at true scale for developing countries?
7. What learnings have they delivered in relation to scale and contribution to market development?
8. Reflecting on the suite of guarantees currently available from both policy-based and commercial providers in developing countries, what are the constraints and untapped opportunities to achieve those ends?
9. What are suggested ways of using scarce public money to drive mobilisation at greater scale in developing countries?
10. How could we seek to apply historic lessons and current practice from mainstream financial markets in developed markets, for example which exists in the publicly rated universe and activity in prominent international insurance centres (New York, London, etc) to developing countries?
11. Identify drivers to breaking through constraints to replicating developed country successes in developing countries.
12. What are the risks and limitations of using guarantees, and do guarantors have a long-term future or are they always confined to the ‘catalytic’ phase of market creation?
More broadly, we aim to provide a framework for donor country decisionmakers considering whether to invest in specialist EMDE guarantee companies with development objectives. In our view, specialist guarantee companies with a focussed business model, appropriate target leverage levels, sound underwriting functions, tight cost control, expertise in their chosen asset class, appropriate incentivisation of key staff, a solidly commercial mandate, can make substantial contributions to development finance with relatively modest capital contributions by investors.
To develop insight into the use of guarantees, we examined public sources and interviewed more than forty market practitioners, including both former and current participants in monoline insurance companies as well as subsequent market actors involved in bond guarantee services in EMDEs. In addition, we develop Business Model Analysis (BMA) of these institutions.
What do we mean, here, by BMA? The UK’s Prudential Regulatory Authority (PRA) has explained how it uses BMA in supervisory assessments of UK insurers. In an expository article, Breckenridge, Farquharson and Hendon (2014) describe how BMA “helps the PRA to make forward-looking judgements by exploring how a firm plans to make money, and what risks it takes in so doing.” As part of the PRA’s supervisory toolkit, BMA is employed to shed light on extreme risks that may impair the stability of an individual insurer or the whole sector.
In our case, BMA consists of modelling a financial institution’s business with a view to understanding its potential scale and profitability depending on different scenarios regarding the demand for its services. In client projects, Risk Control has completed detailed analyses of this type, including, on several occasions, for financial guarantee companies, using internal data. For this project, we have implemented comparable analysis in a simplified form using publicly available data.
A key part of the analysis is to understand the constraints on the business model of the institution in question and those applying to other entities including its potential clients and competitors. The most important constraints in this context are those imposed by ratings agencies (since a higher rating makes the guarantee company’s guarantees more valuable and, hence, permits it to charge more), by regulators, and, when reinsurance or risk syndications is used on a significant scale, the limits and requirements imposed by reinsurers. Regulatory constraints on potential customers contribute to the value created by the guarantee company’s products. On reinsurer constraints, while we view opening guarantee companies to reinsurance or risk syndication as very important, the EMDE companies we examine have not so far moved to this stage. For these reasons, we focus most on rating constraints.
The remainder of this document is organised as follows. Section 2 discusses the emergence and decline of monoline credit insurers in developed markets. Section 3 describes guarantee companies created by donor countries in EMDEs. Section 4 concludes. Appendix 1 provides a factsheet on the four monolines on which we primarily focus. Appendix 2 presents information about the UK Prudential Regulatory Authority’s approach to BMA and a summary of AG’s summary of its business model. Appendix 3 provides a shadow rating for AG using the Fitch methodology. This may be compared with Fitch’s ratings of the EMDE guarantee companies (Fitch being the primary global agency used by these companies).
2. Monolines in Developed Markets
2.1 Emergence of the sector
Monoline insurers first emerged as specialised financial guarantors in the US during the 1970s. They differ from traditional multi-line insurance companies that typically provide a range of products, such as life or Property and Casualty (P&C) insurance. Adapted from the mortgage insurance concept, the monoline business model involved guaranteeing municipal bond payments in exchange for premiums, thereby lowering borrowing costs for issuers, and providing investors with safer credit exposures. The viability of the approach is, thus, closely tied to the credit ratings of the insurers themselves.
Regulatory considerations were key to the emergence of monolines. US insurance regulators wished to prevent losses in certain business lines affecting the stability of general multiline insurers. The situation is summarised in Ibragimov, Jaffee, and Walden (2018) “USA’s insurance regulations require that the major financial guarantee insurance lines—mortgage insurance, municipal bond insurance, and various CDSs—be provided only on a monoline basis in order to protect the policyholders in multiline firms from an insurer default that could result from losses on these high-risk lines.”[8]
The first monoline bond insurance policy was written for the Greater Juneau Alaska Borough in 1971 by the organisation subsequently known as the American Municipal Bond Assurance Corporation (AMBAC).[9] In 1973 the Municipal Bond Insurance Association Insurance Corporation (MBIA) began operating, having convinced Standard & Poor’s (S&P) that its claims-paying ability warranted a AAA rating. AMBAC, which started with an AA credit rating, was subsequently upgraded to AAA in 1979.
In 1983 and 1985, respectively, the Financial Guaranty Insurance Company (FGIC) and Financial Security Assurance (FSA) were formed. Collectively, these firms were subsequently known as the “Big Four” of the monoline industry. By the early 2000s, there were nine major monoline insurance companies. As well as the “Big Four,” these were, SCA (XL Capital Assurance), AG, Radian Asset Assurance, ACA Financial Guaranty Corporation, and Compagnie Industrielle et Financière de Garanties (CIFG).
In what follows, we describe the emergence, strategies, and corporate cultures of these institutions, examining their choice of insured assets, their performance, and the perspectives that ratings agencies had of them before and after the GFC. A key focus will be on their sources of growth and the degree to which they were constrained by ratings agencies and regulations. How were they perceived as creating value for their shareholders and the extent that this was true will also be examined.
2.2 Municipal bond insurances
The monoline insurance sector initially guaranteed only municipal bonds. The municipals market valued monoline insurance in part because of the unique tax treatment of municipal bonds. Interest earned on such bonds is excluded from gross income for federal tax purposes, and in many cases, the investor can also obtain exemption from state and local taxes if they are residents of the state where the bond was issued.
Tax considerations provide an important rationale for the use of municipal bond insurance. First, Nanda and Singh (2004) argue that monoline insurance adds value to municipal bonds by preserving the tax-exempt status of interest payment to investors in the event of issuer defaults. Off-setting this gain is the fact that the insurance prevents investors from claiming potential tax loss benefits, as the guarantee ensures payment. They suggest that the net gains are likely to be greater for bonds with longer maturities as the present value of tax-exempt coupons is larger.
A second tax-related motivation for the use of monoline insurance is that, if bonds are insured, investors can concentrate their investment in bond issues within their locality without being concerned about a lack of diversification. Because state and local tax benefits usually only accrue if a bond holder is resident in the issuing state, the tax treatment tends to fragment the market and discourage investors from diversifying across municipal bond issuers in other locations. Pirinsky and Wang (2011) confirmed that such segmentation imposes cost inefficiencies for issuers and investors. Insurance can partially mitigate these distortions by allowing investors to hold geographically concentrated portfolios while relying on the monoline guarantees for credit protection.
The magnitude of the tax-related benefits of municipal bond insurance is controversial, however. Landoni
(2017) analyses a dataset of municipal bonds issued in 2015 and argues that the tax-arbitrage value created by bond insurance is negligible, and even negative in some realistic calibrations. Moreover, taxable and tax-exempt municipal bonds were insured with broadly similar frequencies, both by number of issues and by insured amount, which is difficult to reconcile with a view that preserving tax-exempt status is the primary motive for buying insurance. Instead, Landoni finds that insurance is disproportionately used by small, unrated issues, for which the insurance premium is often comparable to, or lower than, the cost of obtaining a credit rating, so that the main value of insurance appears to come from credit enhancement and information production rather than tax arbitrage.
Informational asymmetries in the municipal bond market provide an additional rationale for the use of insurance. Many municipal bond issuers are small, unrated entities that may not even publish financial statements. At the same time, the tax treatment of the bonds strongly encourages participation by retail investors, who are often ill-equipped to assess the credit quality of municipals. While specialist ratings agencies can, in principle, substitute for insurance, Bergstresser, Cohen, and Shenai (2015) suggest that monolines have the advantage of having “skin in the game”, as they directly suffer losses if their evaluation of risk proves faulty.[10]
In this context, Pimbley (2015) attributes the sustainability of the monoline municipal bond insurance business to two main factors: (i) the historically low default rates of municipal entities, and (ii) the inefficiency of the municipal bond market with relatively few investors capable of analysing fundamental credit risk due to specific tax-exemption features and the small issue size of many bonds. Consequently, without insurance these bonds tend to attract lower bids than they would in an efficient market. Monoline insurance can therefore be seen as a mechanism that addresses both tax-induced segmentation and informational frictions, helping issuers obtain better pricing and investors access insured, tax-advantaged assets.
The historical development of the municipal bond insurance business is illustrated in Figure 2.1 to Figure 2.3. The figures are constructed using municipal bond insurance data that include both active and inactive insured bonds, providing a more complete picture of historical underwriting activity. Results are shown for AG, AMBAC, FSA, MBIA, and National Public Finance Guarantee Corporation (NPFG). NPFG is MBIA’s US publicfinance insurance subsidiary and is shown separately to capture MBIA-related municipal bond insurance activity consistently over time.
Figure 2.1 shows that the number of newly insured municipal bonds increased sharply across several insurers from the late 1990s into the mid-2000s, before collapsing around the GFC period. AMBAC, FSA, and MBIA all exhibit pronounced peaks in new issuance during the early-to-mid 2000s, followed by a rapid decline to nearzero by the end of the 2000s. NPFG follows a similar pattern, with a strong build-up in the mid-2000s and a sharp drop thereafter, alongside only limited activity in later years. In contrast, AG’s activity peaks around the late-2000s and, while it declines materially after the peak, it remains positive through the 2010s and early- 2020s, fluctuating within a lower but persistent range. Figure 2.2 show a consistent pattern in insured amounts, confirming that the post-GFC retrenchment is visible not only in the number of deals but also in the total volumes insured; AG again stands out as the only entity with sustained post-crisis municipal underwriting, albeit at levels well below the pre-crisis peak.
Figure 2.3 summarises the maturity distribution of insured municipal bonds. Across the insurers shown, insured maturities are concentrated in shorter-to-medium tenors, with the largest volumes typically in the 5–15 years range and a smaller share extending into 15–20 years. Longer maturities beyond 25 years appear only in limited amounts in this sample. Taken together, the tenor distributions suggest that municipal bond insurance activity is primarily focused on medium-dated issuance rather than very long-dated bonds, with only modest exposure in the longest buckets.
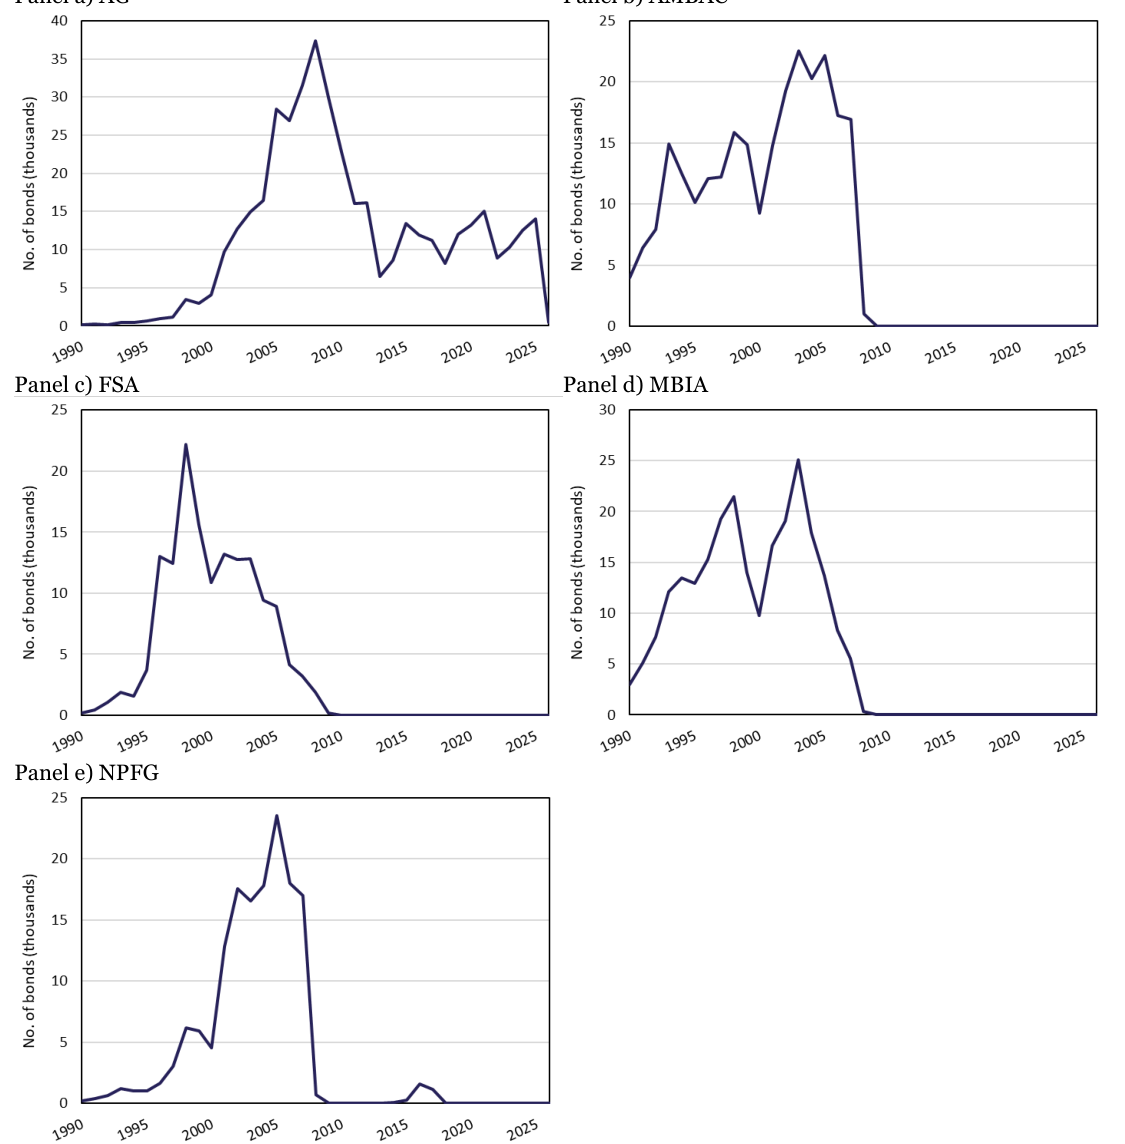
Note: Data are from Refinitiv US municipal bond records and include both active and inactive bonds for the insurers shown, covering 1990–2025.Ratings refer to S&P’s financial strength rating.
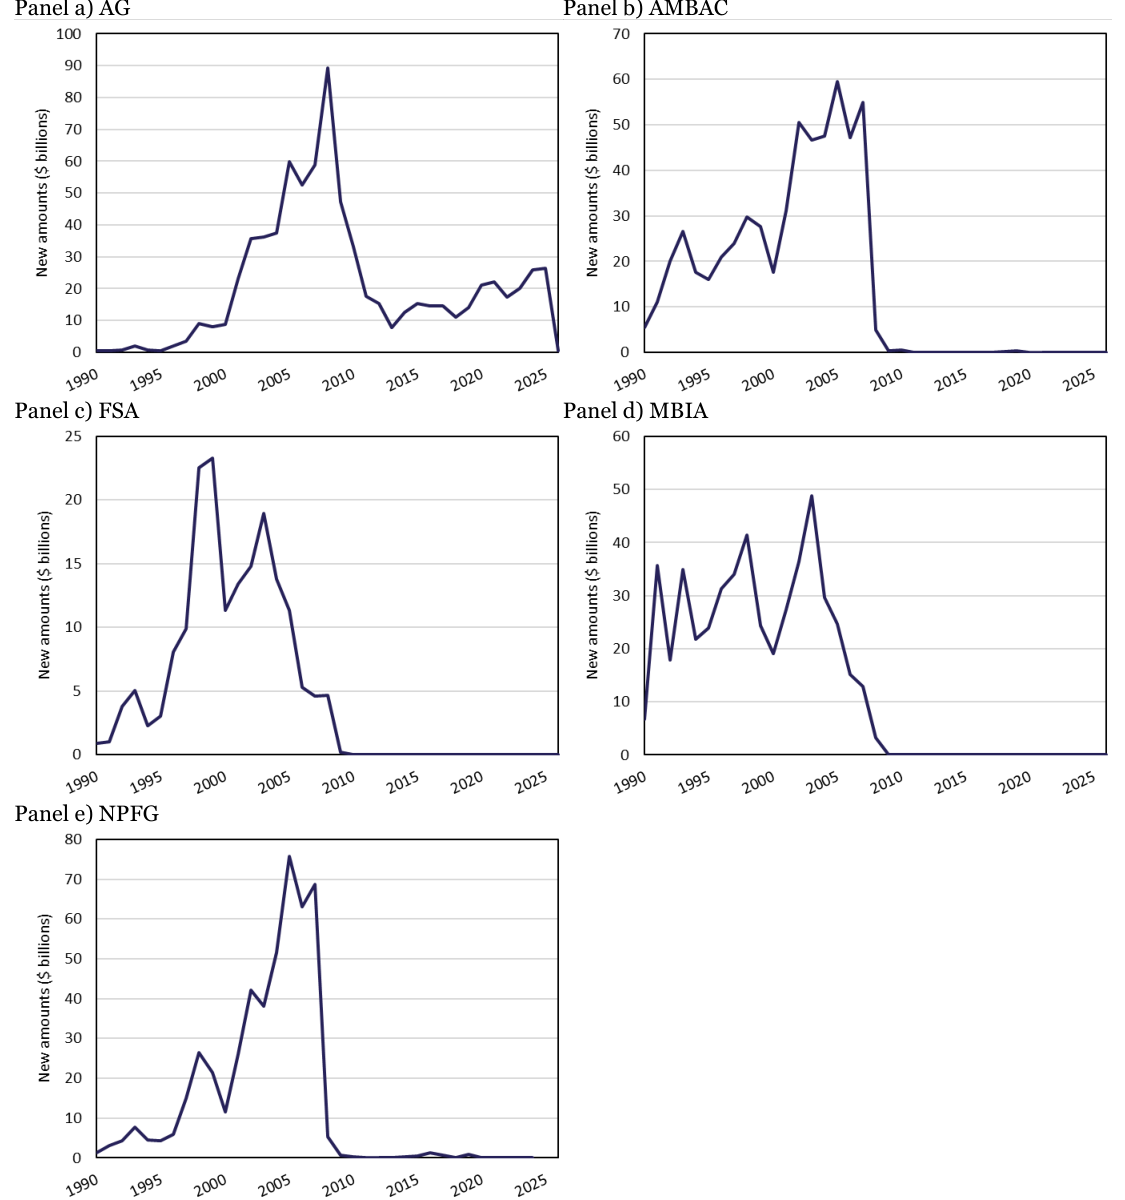
Note: Data are from Refinitiv US municipal bond records and include both active and inactive bonds for the insurers shown, covering 1990–2025.
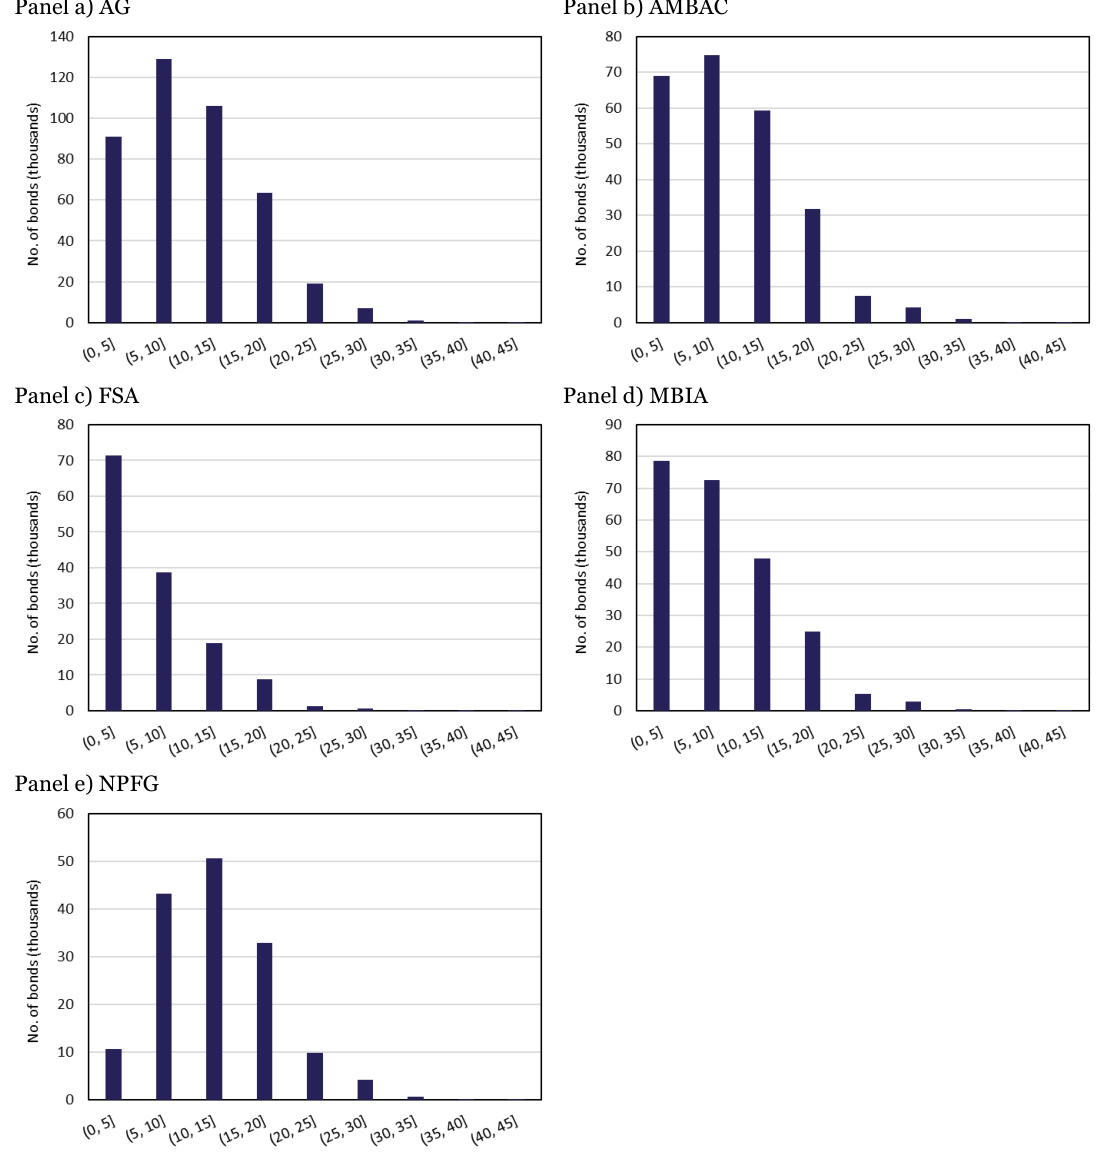
Note: Data are from Refinitiv US municipal bond records and include both active and inactive bonds for the insurers shown, covering 1990–2025.
2.3 New products: infrastructure bonds and structured finance
In the 1990s, the monoline business model, which had up to then focused on municipal bond insurance, began to shift as insurers sought new opportunities. Over time, this expansion took two main forms: guarantees on long-dated infrastructure debt and guarantees on structured finance instruments such as ABS, mortgagebacked securities (MBS) and collateralised debt obligations (CDOs).
In the late 1990s and early 2000s, several monolines established infrastructure guarantee businesses in the UK and Europe. AMBAC, MBIA, and AG were the key participants in this activity. In the 1990s, AMBAC and MBIA created a joint venture in Europe (where MBIA had already started to be active). These businesses targeted private infrastructure projects, Private Finance Initiative (PFI) projects, regulated utilities and securitisations, guaranteeing long-dated infrastructure and utility debt with tenors ranging up to 30–35 years. The guaranteed debt appealed to pension funds seeking to match their liabilities. The UK PFI market during late 1990s was particularly attractive because of the UK’s clear legal framework and strong credit protection which provided a solid base for extending guarantees.
Guarantees provided by highly rated monolines raised the ratings of infrastructure debt from low investment grade to the AAA category. Monolines typically required the debt issuer to obtain a standalone rating[11] and would only consider projects structured to achieve at least a BBB− rating on an unguaranteed basis. Their guarantee then lifted the rating of the instrument to a higher category, making the debt attractive to pension funds and other long-term investors seeking to match long-dated liabilities. The uplift in rating allowed issuers to borrow at spreads closer to those of high-grade credits, while monolines earn insurance premia for assuming the credit risk. This created a form of pricing arbitrage between the underlying risk of the projects and the market pricing of the wrapped bonds.
Infrastructure deals were extremely varied, including, for example, the development of Arsenal Football Club’s stadium and construction in Rome Airport. A key aspect of monolines’ participation in such projects was the senior creditor role that they assumed. In many transactions, the monoline-wrapped tranche sat at the top of the capital structure, so that the monoline became the de facto senior creditor, often ahead of banks or other investors.
Infrastructure project debt typically includes a wide range of restrictions on what the sponsor and construction partner are allowed to do, such as requirements to have in place specific insurance coverages and to maintain assets once constructed. These are necessary to ensure the interests of debt holders in very long maturity facilities such as airports or hospitals.[12] In PFI and other infrastructure deals, the monoline insurer involved would typically coordinate the monitoring and enforcement of these restrictions. One senior monoline staff, interviewed for this study, mentioned that his firm relied heavily on its own credit analysis because they regarded rating agency appraisals as not aways accurate. This self-reliance was a natural consequence of the monolines’ central role in creditor coordination and covenant enforcement.
A second important aspect of monoline guarantees in infrastructure finance was the form of the guarantee obligation. As in the municipal bonds, monoline guarantees covered scheduled principal and interest payments rather than requiring an immediate purchase of the entire debt upon default. Monolines had the right, but not the obligation, to purchase the debt in the event of non-payment. This structure, originally developed to preserve tax privileges in municipal bonds, had the additional advantage in infrastructure finance of permitting gradual and orderly claim management and imposing a much lower liquidity burden on the insurer in the event of a payout.
Another noticeable feature of monoline infrastructure guarantee is the assumption of substantial single-name concentration risk. Monolines did not use reinsurance or syndication extensively but would instead often provide wraps for an entire tranche of project debt. This is only possible (with the leverage levels assumed by the monolines) if the credit quality of the debt guaranteed is high. Monolines aimed to enhance the credit of debt that was already at least low Investment Grade (in the BBB range) by providing “AAA” credit wraps.
The infrastructure bond data is sourced from Refinitiv. Figure 2.4 presents the breakdown of infrastructure bond amounts by monoline guarantors, sectors, bond grades, currencies, and tenors. Panel (a) shows that MBIA dominates the infrastructure bond insurance market, covering 63% of the total amount, followed by AMBAC at 28%. Panel (b) reveals that over 85% of these infrastructure bonds were issued in the utilities sector. Panels (c) and (d) indicate that all three monolines provide guarantees for investment-grade bonds and bonds denominated in USD. Infrastructure bonds with a tenor of 25–30 years were the most favoured across all three monolines, followed by those with tenors of 5–10 years, as shown in Panel (e). Infrastructure deals were extremely varied, including, for example, the development of Arsenal Football Club’s stadium and construction in Rome Airport. A key aspect of monolines’ participation in such projects was the senior creditor role that they assumed. In many transactions, the monoline-wrapped tranche sat at the top of the capital structure, so that the monoline became the de facto senior creditor, often ahead of banks or other investors.
Infrastructure project debt typically includes a wide range of restrictions on what the sponsor and construction partner are allowed to do, such as requirements to have in place specific insurance coverages and to maintain assets once constructed. These are necessary to ensure the interests of debt holders in very long maturity facilities such as airports or hospitals. In PFI and other infrastructure deals, the monoline insurer involved would typically coordinate the monitoring and enforcement of these restrictions. One senior monoline staff, interviewed for this study, mentioned that his firm relied heavily on its own credit analysis because they regarded rating agency appraisals as not aways accurate. This self-reliance was a natural consequence of the monolines’ central role in creditor coordination and covenant enforcement.
A second important aspect of monoline guarantees in infrastructure finance was the form of the guarantee obligation. As in the municipal bonds, monoline guarantees covered scheduled principal and interest payments rather than requiring an immediate purchase of the entire debt upon default. Monolines had the right, but not the obligation, to purchase the debt in the event of non-payment. This structure, originally developed to preserve tax privileges in municipal bonds, had the additional advantage in infrastructure finance of permitting gradual and orderly claim management and imposing a much lower liquidity burden on the insurer in the event of a payout.
Another noticeable feature of monoline infrastructure guarantee is the assumption of substantial single-name concentration risk. Monolines did not use reinsurance or syndication extensively but would instead often provide wraps for an entire tranche of project debt. This is only possible (with the leverage levels assumed by the monolines) if the credit quality of the debt guaranteed is high. Monolines aimed to enhance the credit of debt that was already at least low Investment Grade (in the BBB range) by providing “AAA” credit wraps.
Figure 2.5 displays the cumulative number and amount of infrastructure bonds insured by three representative monolines over time.
In parallel with their diversification into infrastructure, monolines also applied their guarantee model to more complex structured financial products as the US securitisation market grew. FSA was the first insurer organised specifically to cover non-municipal bonds and pioneered ABS insurance. By the end of 2006, monolines collectively guaranteed more than USD 800 billion of structured finance instruments alongside about USD 1.3 trillion of municipal securities.
The next subsection discusses the ultimate consequences of this enthusiasm for structured finance, an asset class for which, it appears, in retrospect, that monolines (in common with many banks) lacked the necessary underwriting expertise.
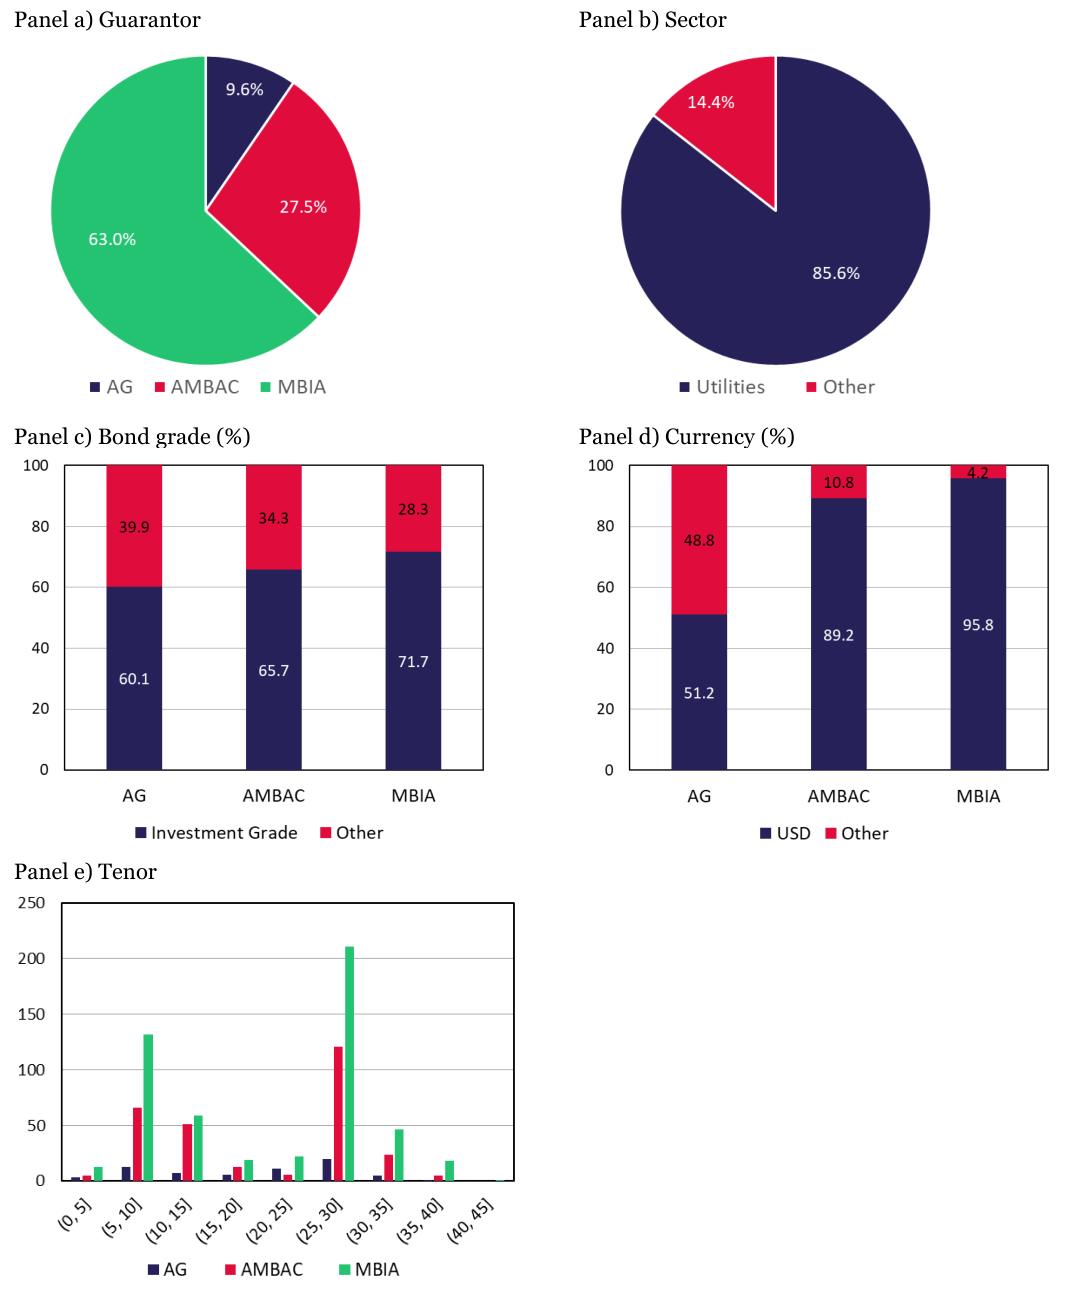
Note: Data are from Refinitiv government and corporate bond records, covering 1990–2025, filtered to bonds whose current guarantor match the monolines shown. Infrastructure bonds are identified using Refinitiv’s Sector field via keyword matching: utility, gas, build, cable, air, facilit, rail, telecommunications, transportation.
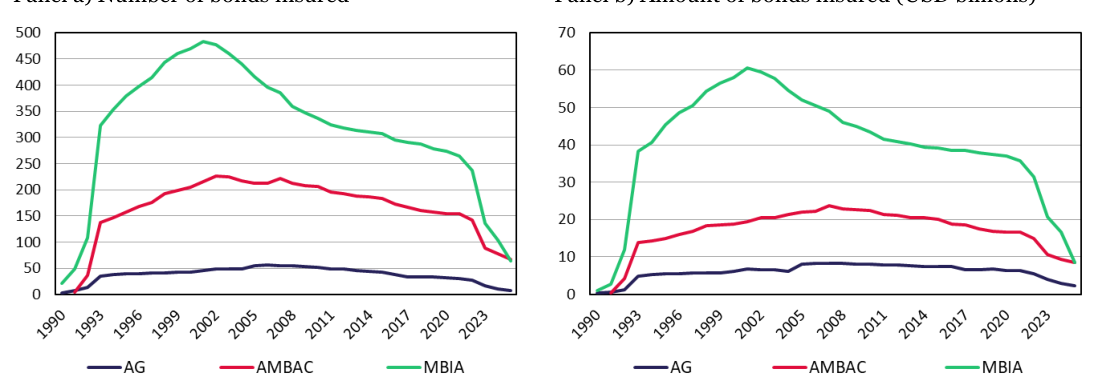
Note: Data are from Refinitiv government and corporate bond records, covering 1990–2025, filtered to bonds whose current guarantor match the monolines shown. Infrastructure bonds are identified using Refinitiv’s Sector field via keyword matching: utility, gas, build, cable, air, facilit, rail, telecommunications, transportation.
2.4 Monolines in the GFC
The 2008 GFC marked a turning point for the industry. As structured finance markets collapsed, rating agencies progressively downgraded the monolines. S&P downgraded both AMBAC and MBIA from their coveted AAA credit rating to AA. Over the subsequent two years’ time, all monoline insurers suffered severe and continuous decline in their credit profiles as assessed by major rating agencies. AMBAC, once AAA− rated, fell to CC in 2009.
AMBAC filed for bankruptcy in 2010 and emerged from Chapter 11 in 2013. FGIC suspended claim payments and entered rehabilitation in 2012. MBIA negotiated partial write-downs on its exposures and split into two entities to separate its municipal and structured finance operations. FSA was acquired by AG, which by contrast, survived the GFC largely because it had maintained an internal policy of avoiding exposure to securitisation tranches, allowing it to continue focusing on municipal bonds and international infrastructure.
Over time, however, once investors and asset managers became more comfortable with the risk profile of infrastructure debt, direct lending by insurers, asset managers and bank infrastructure units began to substitute for wrapped bonds. Contagion from losses on monolines’ structured finance businesses, and the associated downgrades of the parent entities, accelerated this transition by eroding the rating uplift that had underpinned the business model.
In the aftermath of the GFC, the monoline sector contracted dramatically. Of the original players, AG was the only remaining active monoline. But new entrants emerged, such as Build America Mutual (BAM) Assurance Company, which sought to establish themselves and carried ratings in the Aa to Baa range.
Following this decline in monoline activity, a group of MBIA staff, left to join the German asset manager, Allianz, thereby creating the Allianz Infrastructure Debt Fund. Using the deal structuring, risk analysis, and active portfolio surveillance expertise they had acquired within MBIA, this group began a broader expansion of private debt lending to infrastructure projects. AG still actively operates in Europe, but mostly in short-term or bespoke wraps where ratings uplift still creates value. But now there is much more competition from the infrastructure groups of private debt units within asset managers and even in investment banks.
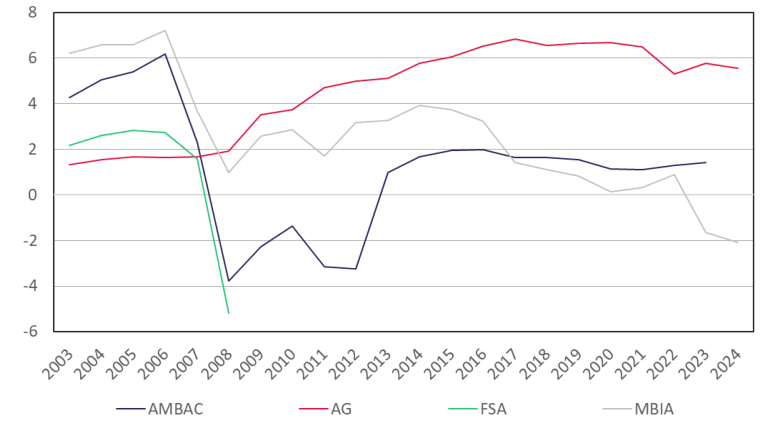
Figure 2.6 shows graphically the amounts guaranteed by four monolines across four key dates: 2006, 2010, 2015, and 2024. AG went from being a small firm in 2006 to growing substantially as it took over the business of its competitors in the years up to 2010 and then shrank again as rating agency constraints limited the business it could do. The other firms either disappeared through takeover (in the case of FSA) or remained frozen in run-off-mode (in the case of AMBAC and MBIA). Figure 2.7 presents the change in the shareholders’ equity of these institutions over time.
Why did AG survive the GFC and, in relative terms, prosper, while other monolines failed? Former monoline managers reported that AG avoided structured finance deliberately in the period up to 2007 for two reasons: first, on “philosophical grounds”, as they thought they did not fully understand the underlying risks; and second, because until just before the crisis struck, AG did not have a AAA Moody’s rating, which prevented it from some mortgage market-related structured finance guarantee activities.[13] Internal policies also forbade collateral posting or mark-to-market settlements, which helped the company to avoid liquidity collapse during the GFC.[14]
Monolines also face a natural product cycle. In the early stages of a market’s development, they opened the capital markets to infrastructure borrowers by providing credit enhancement. Investors relied more on the monoline rating rather than individual project credit histories. This was possible because the AAA-wrapped bonds required less capital for insurers than for bank lenders, creating a pricing advantage. Because infrastructure debt often carried inherently lower default risk than equivalently rated corporates, monolines were able to sustain high leverage levels.
The monoline experience is instructive in several respects. On the positive side, monolines reduced borrowing costs, improved liquidity, and facilitated the growth of capital markets. On the other side, their subsequent collapse exposed critical vulnerabilities: monolines had relied too heavily on credit ratings; and the extension of guarantees to complex, highly correlated structured products created concentrated and systemically important exposures.[15] Taken together, their trajectory demonstrates both the benefits and risks of guarantees in real market conditions.
These considerations are particularly relevant for EMDEs, which are increasingly exploring the use of guarantee mechanisms to mobilise capital, scale new asset classes, and manage risks. The monoline case underscores the need to design guarantee schemes that balance investor confidence, regulatory oversight, and financial stability.
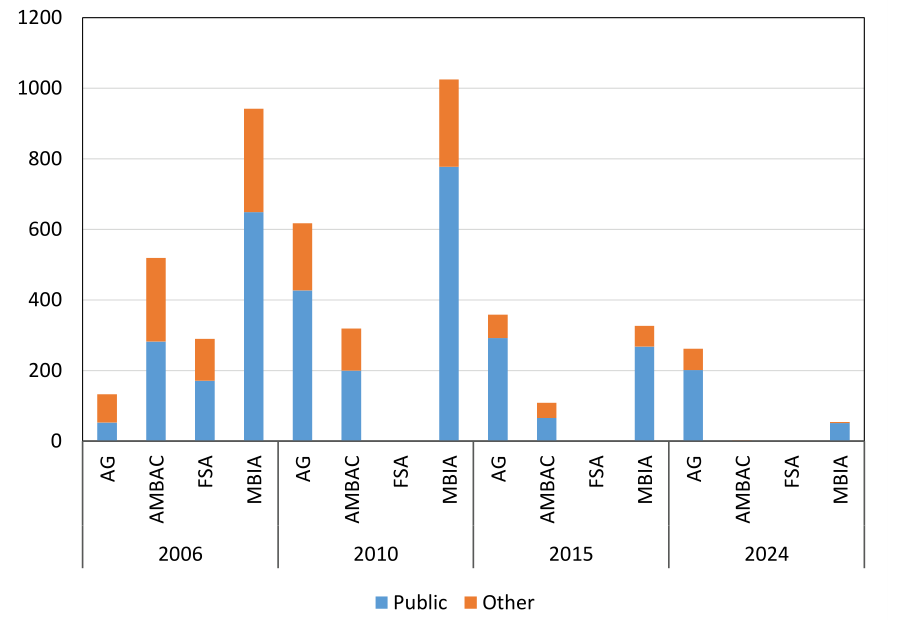
Note: Sources are financial reports and Form 10-K filings. “Public” and “Other” follow each monoline’s disclosure categories. For AG, Public denotes US public finance; Other denotes structured finance and international. For MBIA, Public denotes US public finance; Other denotes non-US public finance and global structured finance. For AMBAC, Public denotes public finance; Other denotes structured finance and international. For FSA, Public denotes municipal; Other denotes asset- backed. FSA data are only available for 2006 in the sources used. Values for AMBAC in 2024 are non-zero but very small (USD 0.84 billion for Public and USD 1.74 billion for Other)
2.5 Monoline case studies
Our primary motivation for studying the monolines is to draw lessons for the use of guarantee companies in EMDEs. Before turning to a discussion of these lessons, let us focus on the key players in the monoline industry by examining case studies describing their rise and, in some cases, decline. Table A1.1 summarises the development of the main four monolines, AMBAC, MBIA, FSA, and AG, where AG being the last survivor of the medium and large monolines after the GFC.
AMBAC and MBIA were the earliest established organisations that created the market in credit insurance for municipal bonds in the early 1970. FSA and AG were part of the expansion of the industry that occurred in the second half of the 1980s when prominent failures by a few municipal bond issuers boosted interest in insurance.
Case Study 1: AMBAC
The AMBAC was founded in 1971 as a subsidiary of MGIC Investment Corporation. In the same year, it became the first company to guarantee a municipal bond by insuring a USD 650,000 issue for the Greater Juneau (Alaska) Borough Medical Arts Building. AMBAC was initially rated AA rating by S&P but was upgraded to AAA in 1979. Although MBIA entered the sector later, it started with a AAA rating in 1974 and overtook AMBAC as the leading monoline by 1984.
Following longstanding financial difficulties, MGIC lost its independence in 1982 when it was acquired by Baldwin-United Corporation. In 1985, Citibank acquired majority control of AMBAC Inc., with the remaining equity held by Xerox, management, and Stephens Inc. At that time, AMBAC accounted for 40% of the municipal bond market, prior to the Tax Reform Act of 1986. Citibank sold more than half its stake in 1991, and completed its divestment in 1992, making AMBAC the first fully publicly held bond insurer.
AMBAC expanded into asset-backed and structured Figure CS1.1: AMBAC’s S&P’s Rating (1974–2010) finance in 1993 and introduced municipal interestrate swaps in 1994, becoming the only monoline active in that area. A joint venture with MBIA, the MBIA-AMBAC International, extended operations abroad in 1995. The company was renamed AMBAC Financial Group, Inc. in 1997, with its insurance arm renamed as AMBAC Assurance. The UK subsidiary, AMBAC Assurance UK Ltd, was established in 1996. AMBAC’s refusal to lower premiums led to declining market share, falling to fourth place by 1998, though non-municipal guarantees rose from 6% in 1994 to 43% in 1998.
In the 1990s and early 2000s, AMBAC expanded into infrastructure and Public-Private Partnership (PPP) financing—particularly in the UK and continental Europe. These included guarantees on PFI projects, toll roads, hospitals, and utilities. The percentage concentration of the municipal bond insurance continued to decrease since the company started to provide credit wraps for structured finance, infrastructure, and PPP financing. The joint venture with MBIA ended in 2000, and offices opened in Tokyo and Sydney in 2001.
Note: Ratings refer to S&P’s financial strength rating.
AMBAC’s guaranteed portfolio peaked at USD 556 billion in 2007. Of this, over one-third was structured finance. The 2008 housing crisis caused severe losses, leading to bankruptcy in 2010. After emerging in 2013, AMBAC adopted a run-off operational mode. Of monolines studied here, AMBAC suffered the fastest and deepest credit deterioration, with its S&P’s rating dropping from AAA to CC within two years. Figure CS1.1 shows how AMBAC’s rating changed over time. Figure CS1.2 displays the amounts guaranteed by AMBAC from 1997 to 2022 by asset categories.
Figure CS1.2: AMBAC Guarantees (1997–2022) Panel a) Absolute amount (USD billions) Panel b) Product concentration (%)
Case Study 2: AG
AG originated from Capital Reinsurance Company, which was established in 1988 as a financial guaranty reinsurer.
In 1999, ACE Limited acquired Capital Re Figure CS2.1: AG’s S&P’s Rating (1988–2024) Corp., the parent company of Capital Reinsurance.
In 2003, Assured Guaranty Ltd. (AGL) was created as a holding company for its insurance subsidiaries, which was later recognised as AG. AGL became a publicly listed company on the New York Stock Exchange in 2004.
Following the GFC, AG acquired Financial Security Assurance Holdings Ltd. (FSAH) and FSA in 2009, excluding FSAH’s financial products division. FSA was founded in 1985 and used to recognised as one of the “Big Four” monoline insurers before the GFC.
Its subsidiary UK branch started writing insurance in 1994 and became AGUK after the acquisition by AG. FSAH was subsequently renamed Assured Guaranty Municipal Holdings Inc. (AGMH), and FSA became Assured Guaranty Municipal Corp. (AGM). Note: Ratings refer to S&P’s financial strength rating.
AG’s expansion continued through acquisitions and restructurings post crisis. The key activities related to its financial guarantee services include:
• 2015: Acquired Radian Asset Assurance Inc. from Radian Guaranty Inc.; Radian Asset was merged into AG.
• 2016: Acquired CIFG Holding Ltd., merging its US operations into AG and integrating its European subsidiary.
• 2017: Purchased MBIA UK Insurance Limited, later renamed Assured Guaranty (London) plc (AGLN).
• 2018: Merged its four UK and European financial guarantee entities under Assured Guaranty UK Ltd. (AGUK).
• 2019: Established Assured Guaranty (Europe) SA (AGE) in France to maintain and grow its business within the European Economic Area (EEA) post-Brexit. In 2020, selected AGUK guarantees were transferred to AGE.
• 2024: Opened a new Sydney office to extend its presence in the Australian market.
• 2024: AGM merged into AG, with AG as the surviving entity.
Over time, AG has shifted from its origins as a financial guaranty reinsurer into a direct financial guaranty insurer, and subsequently into a diversified guarantor engaged in structured finance products and legacy financial guaranty portfolio acquisitions. Today, AG also provides broader risk and capital management solutions to insurance, pension, and banking institutions while guaranteeing structured financings backed by commercial, consumer, and life insurance exposures.
Figure CS2.1 illustrates the evolution of the credit rating of AG assigned by S&P over time. Figure CS2.2 presents the amounts guaranteed by AG from 2005 to 2024 and percentage concentration across different asset classes.
Figure CS2.2: AG Guarantees (2005–2024) Panel a) Absolute amount (USD billions) Panel b) Product concentration (%)
Case Study 3: MBIA
MBIA was established in 1973 under the management of the Municipal Issuers Service Corporation (MISC). MBIA convinced S&P to grant them with a AAA credit rating in 1974, becoming the first municipal bond insurer to achieve this distinction, and gaining a competitive advantage over Ambac, which was rated AA at that time.
MBIA’s business accelerated following New York City’s fiscal crisis during the 1970s, which highlighted the importance of bond insurance. The total par insured reached USD 5 billion in 1980. By 1983, MBIA had guaranteed issues in all 50 US states and began expanding its coverage beyond general obligation bonds to include healthcare, housing, and education bonds.
In 1986, MBIA was reorganised from a consortium of Figure CS3.1: MBIA’s S&P’s Rating (1987–2017) insurers into a single corporation, MBIA Inc. which became the holding company for its insurance operations. The company went public in 1987, listing on the New York Stock Exchange. This was followed by the insurer’s entry into Europe where it later opened offices in Paris (1991) and London (2000).
Through the 1990s, MBIA diversified its services to include asset management, consulting, and revenue enhancement for municipalities. This was also the time when MBIA started to significantly expand its structured finance business.
MBIA launched MBIA Investment Management Corp. in 1993 and MBIA Securities Corp. in 1995. Several acquisitions were made, including Municipal Resource Consultants, MuniFinancial and CapMAC Holdings Inc.
MBIA maintained its dominant market position through the early 2000s, with continuously strong ratings affirmed by analysts and agencies. Note: Ratings refer to S&P’s financial strength rating.
MBIA was significantly affected by the 2008 GFC due to its extensive structured finance exposures and was subsequently involved in a series of legal disputes, including lawsuits against major financial institutions such as Merrill Lynch, alleging misconduct in the origination and sale of structured finance products.
In 2009, MBIA created a separate, US-only public finance insurer, the NPFG, which served as its primary operating subsidiary until March 2025. MBIA itself discontinued underwriting new financial guarantee policies since 2017, and its principal focus today is the ongoing monitoring and management of the existing insured portfolio.
Figure CS3.1 illustrates MBIA’s credit rating evolution assigned by S&P, while Figure CS3.2 presents the amounts guaranteed by MBIA from 1990 to 2024 across major asset classes.
Figure CS3.2: MBIA Guarantees (2003–2024) Panel a) Absolute amount (USD billions) Panel b) Product concentration (%)
Case Study 4: FSA
FSA began operations as a financial guarantee insurance provider in 1985 with a AAA rating from S&P. It was the first insurance company organised to insure non-municipal obligations with a primary focus on ABS. FSA was therefore the first monoline insurance company to provide guarantees for structured financial products.
In 1990, FSA expanded its business focus to include municipal obligations and became a major insurer in the industry. Its partnership with the French bank Crédit Local de France (CLF), later part of the Franco-Belgian bank, Dexia Group, also facilitated rapid expansion into Europe. In 1994, FSA UK received authorisation to write insurance, making itself one of the earliest US monolines with an active international presence.
By the mid-1990s, FSA had a diversified Figure CS4.1: FSA’s S&P’s Rating (1985–2024) portfolio including municipal bonds, structured finance, infrastructure and PPP projects across North America and Europe. FSA was fully acquired by Dexia Group in 2000 as a core subsidiary within its public finance franchise.
At the early stage of the 2008 GFC, FSA maintained relatively reasonable exposure to US subprime MBS compared to peers such as AMBAC (large in structured finance concentration) and MBIA (deep in the amount of structured finance product guaranteed). But continued losses drove Dexia’s transformation plan to refocus on its historical markets (Belgium, France and Luxembourg) and on Turkey and to limit its exposure to US. This eventually led to the disposal of FSA’s core financial guarantee business to AG, announced in November 2008 and finalised in July 2009, becoming AGM, under which FSA’s legacy business continue.
Note: Ratings refer to S&P’s financial strength rating.
FSA’s guaranteed portfolio was over USD 400 billion by 2008 with around one-fourth of the share exposed to structured finance. Similarly to other monolines, its S&P’s credit rating fell since 2009, from AAA to AA−, whilst avoiding insolvency due to the acquisition by AG.
Figure CS4.1 shows FSA’s credit rating assigned by S&P from 1985 to 2024. The rating from 2009 is the same with AG due to the acquisition. Figure CS4.2 displays the amounts guaranteed by FSA during 2003-2008. The data prior to this period is not publicly available.
Figure CS4.2: FSA Guarantees (2003–2008) Panel a) Absolute amount (USD billions) Panel b) Product concentration (%)
AMBAC was the most innovative monoline in the early 1990s, diversifying away from municipal bond insurance by beginning to guarantee ABS and other structured finance transactions in 1993, and by extending its activities to municipal interest-rate swaps in 1994. In 1995, it launched a joint venture in Europe together with MBIA. From the summer of 2008, its rating declined progressively to BBB by June 2009, a rating too low to sustain any new business. In July 2009, AMBAC’s rating collapsed to CC, following which the firm entered bankruptcy in 2010.
AG was a medium-sized monoline before the crisis but had been protected from exposure to US structured finance exposures by a combination of conservative underwriting and a sub-AAA Moody’s rating until shortly before the crisis which limited the structured finance business for which it was eligible. This meant that the firm was able to retain high enough ratings to keep writing new business through the period of the GFC and thereafter. Indeed, AG made a sequence of acquisitions, taking over profitable parts of the businesses of other monolines.
MBIA, founded like AMBAC in the early 1970s, had achieved a dominant market position in the municipal bond insurance market by the early 2000s. In the spring of 2008, its S&P’s rating was downgraded first to AA and then to A. It continued to write a limited amount of new business until 2017 and thereafter focussed on monitoring its existing insurance book, which gradually contracted.
FSA was incorporated in 1985 with an initial S&P’s rating of AAA. It was the first monoline to be established with the primary aim of insuring a non-municipal-bond asset class, namely ABS. It built a diversified guarantee portfolio including municipal and infrastructure bonds in the following years including in Europe. It was acquired by the Franco-Belgian Dexia Group and then sold to AG following crisis-related losses.
2.6 Financial analysis of AG
This subsection examines the monoline business model in more detail by analysing the ratings and financial statements of a single representative institution, AG. This exercise, referred to in the introduction as Business Model Analysis (BMA), provides insights into the rating constraints faced by monolines and the economic prospects of such businesses. The approach may be compared to the BMA practiced by the UK PRA, as described in Breckenridge, Farquharson and Hendon (2014) and summarised in Appendix 2. Note that AG itself includes a description of its business model in its investor presentation (see Appendix 2).
Figure 2.8: Schematic Representation of a Monoline Insurer Business Model
Figure 2.8 provides a schematic overview of an insurer business model.[16] The diagram begins with the demand for new insurance, which is subsequently priced and formalised as new Gross Written Premiums (GWP). These premiums contribute to the insurer’s earnings through retained exposures, which consist of Net Written Premiums and changes in Unearned Premiums (recognised as liabilities).
Exposures that are reinsured contribute to earnings via Earned Commissions. An important feature of the insurer business model, which is not emphasised either in the PRA’s or AG’s representations, is reinsurance. A crucial decision for any insurer is how much of its risk to cede to reinsurers and the way this should be achieved (through stable treaty arrangements or more interactive facultative approaches).
All elements within the business model are constrained by the availability of capital. The capital constraints are associated with credit rating requirements and the regulatory framework applicable to the insurer. In addition, the insurer’s own assessment of required “economic capital,” defined in terms of a target survival probability, acts as a further internal limit on growth and leverage.
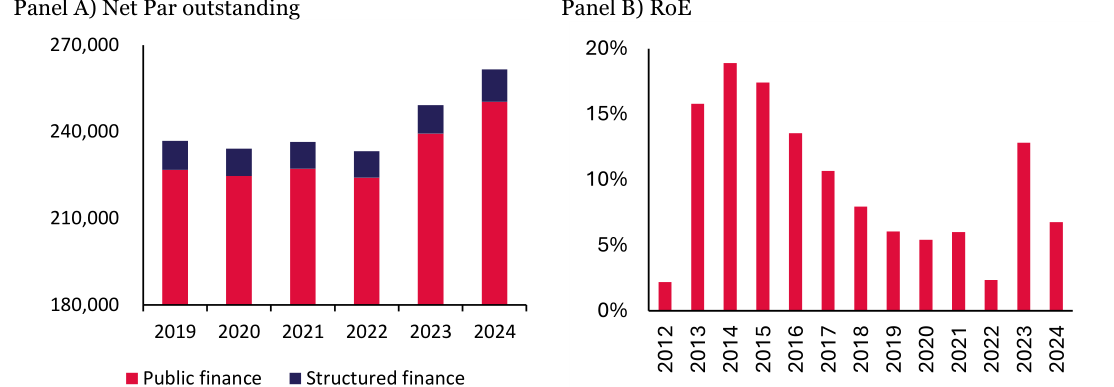
The empirical analysis that follows uses publicly available AG data, including Net Par Insured (broken down by business line, sector and maturity), Gross Par Written, GWP and standard financial statements (income statement and balance sheet). Figure 2.9 presents key indicators of AG’s recent financial performance. Panel a) shows AG’s Net Par Outstanding, i.e., the volume of guarantees, for the period since 2019. Following a period of no growth during the volatile pandemic period, Net Par Outstanding began to grow significantly in 2023 and 2024, reflecting an expansion in public finance business. Panel b) displays AG’s Return on Equity (RoE) from 2013 to 2024. RoE was substantial in the period 2013–2016, declined progressively thereafter and reached a low of 2% in 2022, before recovering in the most recent years.
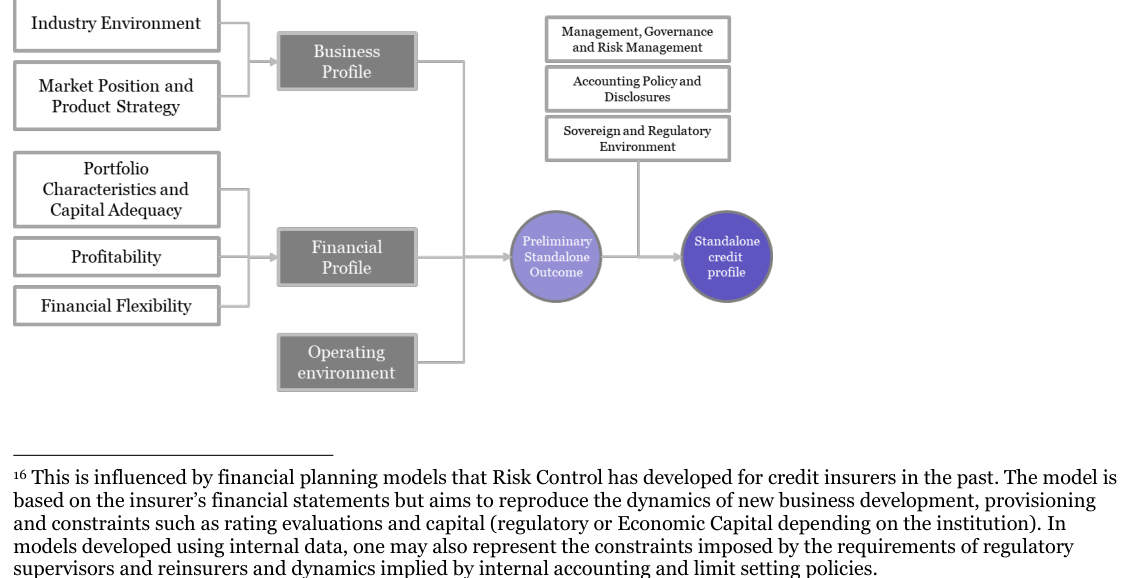
AG is rated by Moody’s under the Financial Guarantor’s Methodology (Moody’s (2024)), which is summarised in
Figure 2.10. The Business and Financial Profiles are combined with a view on the firm’s Operating Environment to obtain a Preliminary Standalone rating. Management, Governance and Risk Management, and combined with Accounting Policies and Disclosures and the Sovereign and Regulatory Environment to yield the Standalone Credit Profile. The result of applying this methodology to AG is displayed in Table 2.1.
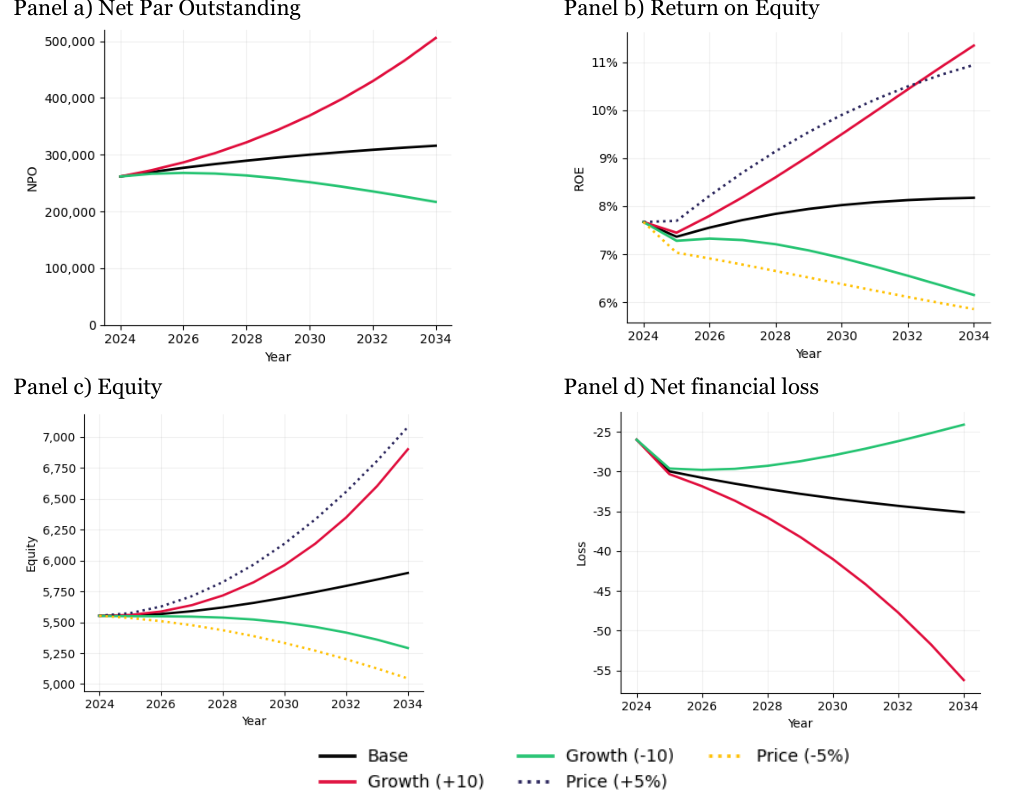
To understand the business and prospects of AG, one can project forward some of its key financial aggregates and analyse at what point it may encounter constraints such as rating downgrades. The analysis involves forecasting the financial results over a ten-year period, starting from the 2024 figures, and incorporating average ratios from the preceding five years.[17]
We consider a set of scenarios in which the firm’s business might evolve. These include different growth rates (positive and negative) in Gross Written Premium and in the premiums that AG could attract. The five scenarios considered are:
• Base: The GWP is constant during the projected period
• Growth (+10): The GWP increases 10% each year
• Growth (-10): The GWP decreases 10% each year
• Price (+5%): The premium rate increases 5% each year
• Price (-5%): The premium rate decreases 5% each year
The forecasting methodology outlined above has a direct impact on both the Portfolio Characteristics & Capital Adequacy and the Profitability components of the Moody’s score card. On one hand, significant growth in newly underwritten business may lead to an improved profitability score. On the other hand, risk-adjusted capital coverage is likely to weaken, as risk-adjusted capital coverage declines. Moody’s calculates risk-adjusted capital coverage for different ratings using distinct risk weights. A guarantor is assigned a score based on the highest score for which the coverage exceeds one.
Figure 2.11 and Table 2.2 show, respectively, the effect of the scenarios on AG’s financials and the impact on its Moody’s rating. The scenarios corresponding to price changes coincide with the base case scenario for net par outstanding and net financial loss because of our assumptions of a unit price elasticity. They nevertheless strongly affect RoE and the amount of equity. The evolution of the rating in the scenarios described at the beginning of this section are displayed in Table 2.2.[18] Growth in volumes ultimately lowers AG’s rating whereas achieving higher insurance premia permits enhanced performance without placing pressure on the rating.
Table 2.3 shows the headroom that AG under the Moody’s rating, i.e., the increase in the volume of its insured amount before it suffers a drop in rating. Most aspects of the rating are unaffected by the growth in volume. The score for Portfolio Characteristics and Capital Adequacy changes successively when the volume grows by7%, 53% and 116%. This suggests that AG is close to its rating constraint under the Moody’s methodology.
Note: Figures in million USD.
Note: Figures are in million USD. For the Net Par Outstanding and Net financial loss, the values for the price-change scenarios are not shown as they equal the base scenario values.
| Score | ||
|---|---|---|
| Business Profile | ||
| Market Env ironment | & Product Strategy | A |
| Industry Env | ironment | A |
| Market Position | & Strategy | A |
| Financial Profile | ||
| Portfolio Characteristics | & Capital Adequacy | Aa |
| Risk-Adjusted | Capital Cov erage | Aa |
| Profitability | Baa | |
| Underwriting | Margin | Baa |
| Return on Capital | A | |
| Sharpe Ratio of | ROC | Aa |
| Financial Flexibility | A | |
| Financial Policy | Baa | |
| Ease of Access | to Capital | A |
| Operating Env | iroment | Aaa - A |
| Preliminary Standalone | Outcome | A1 |
Note: Source Moody’s (2024)
| Metric | 2024 | 2025 | 2026 | 2027 | 2028 | 2029 | 2030 | 2031 | 2032 | 2033 | 2034 |
|---|---|---|---|---|---|---|---|---|---|---|---|
| Base | A1 | A1 | A1 | A1 | A1 | A1 | A1 | A1 | A1 | A1 | A1 |
| Growth (+10) | A1 | A1 | A1 | A1 | A2 | A2 | A2 | A2 | A2 | A2 | A2 |
| Growth (-10) | A1 | A1 | A1 | A1 | A1 | A1 | A1 | A1 | A1 | A2 | A2 |
| Price(+5%) | A1 | A1 | A1 | A1 | A1 | A1 | A1 | A1 | A1 | A1 | A1 |
| Price(-5%) | A1 | A1 | A1 | A1 | A3 | A3 | A3 | A3 | A3 | A3 | A3 |
| Env Growth | Market ironm ent | Industry | Market Position & | Portfolio Char. & Cap. | Profitability | Financial | Financial Ease of | Access | Operating | Rating |
|---|---|---|---|---|---|---|---|---|---|---|
| & Product Strategy | Env rm nt. | Strategy | Adequacy | Flexibility | Policy to | Capital | Env ironm ent | |||
| 0% | A | A | A | Aa | Baa | A | Baa | A | Aaa-A | A1 |
| 7 % | A | A | A | A | Baa | A | Baa | A | Aaa-A | A2 |
| 53% | A | A | A | Baa | Baa | A | Baa | A | Aaa-A | Baa1 |
| 116% | A | A | A | Ba | Baa | A | Baa | A | Aaa-A | Baa2 |
2.7 Research questions on monoline experiences
This section returns to the research questions posed in the introduction on the lessons one may deduce from the experience of the monolines for the use of guarantees and specialist guarantee companies in EMDEs.
One should start by emphasising the very different context in which (i) developed market monolines and (ii) specialist EMDE guarantee companies operate. First, monolines charged a few tens of basis points to provide AAA wraps for large volumes of municipal bonds. Tax aspects reinforced their role while the municipals they guaranteed exhibited high credit quality. In the infrastructure guarantee business developed by monolines, in the 1990s and early 2000’s, spreads were again small as structuring ensured that, prior to the wrap, the debt was already investment grade.
Second, monolines chose to operate in legal jurisdictions in which debt contracts are highly enforceable. This is clearly not the case for many EMDEs. Monolines were only willing to operate in a few EMDEs such as Chile, Mexico, and Türkiye, in which legal frameworks were seen as reasonably predictable. A former senior monoline staff member interviewed for this study said that his company avoided emerging markets unless a multilateral (e.g., IFC, MIGA, EIB) is involved to support enforcement and argued that development of private markets depends on legal enforceability, contract certainty, and investor protection.[19] Furthermore, if a project was in local currency and the guaranteed debt was in another currency, the monoline would typically require a hedge to reduce the chance that currency mismatch for the borrower would create credit risk.
These features of the markets in which monolines operated contrast markedly with the high debt spreads and risk levels and less formalised legal systems of most EMDEs. Nevertheless, there are some aspects of developed monoline experience that appear relevant for EMDE guarantee funds. Here are the questions posed in the introduction and the lessons we draw from what happened to the monolines.
1. How did guarantees support the advent and scaling of new asset classes in developed markets under the auspices of monoline insurers and their peers, to enable ABS, municipal bonds, project and infrastructure bonds, privatisations backed by capital markets financing capital etc. at scale? Monolines operated in a noticeably opportunistic manner, bringing the flexibility of guarantees to bear when market opportunities presented themselves. The infrastructure and structured finance businesses that they built led to dramatically different outcomes, with the infrastructure businesses generating stable, profitable guarantee portfolios on progressively amortising debt claims, while the opaque, poorly underwritten structured finance exposures brought disaster. Infrastructure debt guarantees by monolines created a new market, extending maturities and providing access to financing to a set of safe but capital constrained investment opportunities.
The debacle of monoline involvement in structured finance reflected poor underwriting (which meant that AG alone rejected some of the commercial opportunities on offer) but this was consistent with the collective failure of regulators, US mortgage lenders and rating agencies to understand the fragility of the US housing market. The approach of creating products that meet clear market opportunities (evident and successfully pursued in the municipal bond and infrastructure financing markets) stands out as a lesson from monoline experience.
The most obvious equivalent for the guarantee funds we consider below is the focus on local currency financing that some have adopted and, in the case of others, the attempt to work within specific market niches in which opportunities to complete market gaps present themselves.
2. What are the main interventions and practical steps that occurred in their evolution and prime? The monoline businesses were all made possible by the agency ratings they obtained and the regulatory permissions they enjoyed.[20] For monolines, unlike banks, ratings rather than regulatory capital provided the primary limitation on activity and profitability. Optimising their businesses to the ratings was, therefore, the monolines’ primary focus. A similar although different optimisation is necessary for EMDE guarantee companies. Monolines aimed at the highest possible ratings since beneficiaries of the ratings like pension funds, banks and capital market investors sought extremely low credit risk and limited yield uplift from US or other developed-economy sovereign Treasury rates. For EMDE guarantee beneficiaries, risk and yield appetite are likely to be much higher and domestic sovereign rating caps may constrain the highest rating demanded by domestic currency investors.
But regulatory constraints did serve to limit competition that monolines might otherwise have faced from multiline insurers. Over time, decisions by regulators to extend permissions to cover additional asset classes, led monolines to progressively diversify away from municipal bonds to provide cover for infrastructure bonds and structured products. Similarly, for EMDE guarantee companies, the degree to which domestic regulators apply capital requirements on local actors such as banks will affect the demand for guarantees by some local actors. Group level application of capital requirements to international banks may also affect the demand for hard currency guarantees although the ratings that guarantee companies must have to satisfy such clients may be hard to achieve.
3. What are the key ingredients of success that enabled this to occur? Current and former monoline staff to whom we spoke, particularly those engaged in the infrastructure business, emphasised the importance of underwriting standards and expertise in the specific asset classes they guaranteed. The controlling and monitoring aspects[21] of the monoline business model meant that, in infrastructure, specialist teams emerged that limited the scope for competition. Only when losses on structured finance undermined the monolines’ infrastructure guarantee activity was this expertise lost to private debt competitors which in turn began to service the market.
EMDE guarantee companies must also build rigorous underwriting capabilities. This is easiest to achieve in the case of relatively simple guarantees such as those on financing for local banks. The most demanding area for building underwriting expertise is for pure project finance, as the monolines themselves managed to do.
4. What have been the limitations and pitfalls in the use of guarantees in developed countries and negative impacts? The regulatory philosophy behind the requirement that certain insurance products be supplied only by monolines was that this approach would prevent claims in one insurance product area causing failures among general insurers offering consumer products. The concern that this might indeed happen was born out by events in that the monolines diversified away from municipal bond insurance into cover for structured products, an area in which, certainly in retrospect, their underwriting expertise was lacking.
The primary lesson for EMDE guarantee companies is the need to avoid imprudent involvement in guarantees for relatively opaque underlying credits. The monolines that became heavily exposed to structured finance were encouraged by the idea that they were diversifying into a profitable area uncorrelated with other areas like municipals and infrastructure debt.
5. What are the risks to economic development in using guarantee products in developing countries? The collapse of the monolines undermined the markets in which they operated, reducing the availability of municipal bond wraps and hampering the infrastructure financing in which they had begun to make a significant impact. AG continued to write business with a slightly reduced rating and indeed was highly profitable for several years as the guarantee books absorbed from other monolines proved to be of good credit quality. The migration of monoline underwriters to private debt businesses such as Allianz accelerated the product cycle as other market solutions emerged.
These episodes underline the need for specialist guarantee companies to maintain strict and conservative underwriting standards to preserve their own and their sector’s franchise value and to focus on approaches and products for which their position is less contestable.
3. EMDE Guarantee Companies
3.1 How the sector has developed
Section 2 emphasised two important roles played by monolines operating in developed markets:
- they opened access to long-tenor capital-market funding for infrastructure projects and
- they mitigated informational frictions in fragmented markets such as US municipal bonds.
Monoline-supplied guarantees enabled institutional investors to take on infrastructure and municipal exposure at scale. The controlling creditor role played by monolines in infrastructure and the specialist role they had in the US municipal debt market entrenched their market position .
This section examines whether specialist guarantee companies operating in EMDEs are or could perform analogous functions. The EMDE guarantee sector considered here comprises
(i) Independent guarantee companies in the foundation of which the Private Infrastructure Development Group (PIDG)[22] took the lead (see InfraCredit,[23] InfraZamin, and Dhamana,[24]) and GuarantCo which remains under a PIDG organisational umbrella.
(ii) Other guarantee companies benefitting from donor or public backing including AGF, CGIF, IFFEd, and GGC. These organisations are typically capitalised by bilateral DFIs, MDBs and, to a limited extent, domestic institutional investors.
In studying these institutions, we leave aside their developmental or environmental impacts. Our focus here is on their scalability and financial sustainability. Analysing the impact of these institutions would take us too far afield and may be considered as a topic for future research. But one should note that the institutions vary somewhat in the degree to which their shareholder-provided mandates emphasise developmental impact and this may have implications for commercial performance.
Several institutions on which we focus emphasise infrastructure and local-currency financing, notably GuarantCo, InfraCredit, InfraZamin and CGIF. We also consider a regional SME-focused company, AGF, and a start-up, hard-currency guarantee company, GGC. Central questions for us are what role can these guarantee companies play in EMDEs and how can their products and business models address the structural constraints identified in Section 2?
In many EMDEs, banks are reluctant or unable to provide long-tenor local-currency loans to infrastructure projects, and domestic institutional investors lack the capacity or mandate to take direct long-dated project risk. Furthermore, sovereign balance sheets are often heavily constrained. In this environment, it seems that guarantee companies can play a catalytic role analogous to that of the monolines in developed markets. In this, they must use their capital and expertise to intermediate between projects and investors, lengthening tenors, and supporting the emergence of local capital markets. Table 3.1 shows the ratings of the guarantee companies and funds we consider. CGIF and GuarantCo are the only entities with ratings based on supranational methodology (in CGIF’s case by S&P and in GuarantCo’s case by Moody’s). The primary global rating agency for guarantee companies we consider is Fitch but the latter employs a credit guarantor rather than a supranational methodology. Fitch rates all the companies except InfraZamin and Dhamana. Fitch rates CGIF AAA, GuarantCo and AGF AA−, InfraCredit and GGC as BB− and BBB respectively.
Table 3.2 presents metrics from the rating agency assessments. These shed light on the degree to which the different institutions are gearing up their capital. Based on the Fitch net par-to-capital ratio, of the EMDE funds with sufficient disclosure, AGF currently exhibits the highest leverage (1.6x), although this is only marginally above GuarantCo’s 1.5x. These levels remain modest relative to the pre-GFC monolines and to the specialised multilaterals ICIEC and ATIDI mentioned later in Section 3.6, for which the leverage ratios are in the region of 4x.
InfraCredit’s very low leverage ratio (0.5x) reflects the fact that much of its capital is held in hard currency, whereas its guarantees are denominated in Nigerian Naira (NGN), which has undergone substantial devaluation.[25] The GGC is still in launch mode but has signalled an intention to operate with higher leverage (between 2.7x and 6.3x) once its portfolio is established. Data are not yet available for Dhamana and InfraZamin, which remain at an early stage in building their guarantee books.
Figure 3.1 shows that CGIF (which targets higher rated underlying credits than the other companies shown here) currently has the largest outstanding guarantee portfolio, with guarantees rising from USD 2.4 billion in 2023 to USD 2.6 billion in 2024. GuarantCo’s book is smaller in absolute terms but has grown from around USD 0.6 billion to USD 0.9 billion over the same period, while InfraCredit’s guaranteed amounts remain below USD 0.2 billion. For AGF, data are available only for 2023, when its outstanding guarantees totalled around USD 0.9 billion.
The figure confirms that, in contrast to the scale achieved by developed-market monolines prior to the GFC, EMDE guarantee companies are operating with small portfolios and conservative leverage, (consistent with their catalytic and developmental mandates), rather than replicating the commercial objectives of the monoline model. The central question is whether these entities can evolve towards more leveraged, sustainable balance sheets, analogous to the trajectory of monolines before the GFC, while avoiding the concentration and correlation risks and underwriting failures that subsequently undermined the latter. Some aspects of the mandates on these institutions that place heavy emphasis on innovation and sustainability might be reconsidered since these institutions are only likely to be able to make significant development impact if they achieve a greater scale of operations.
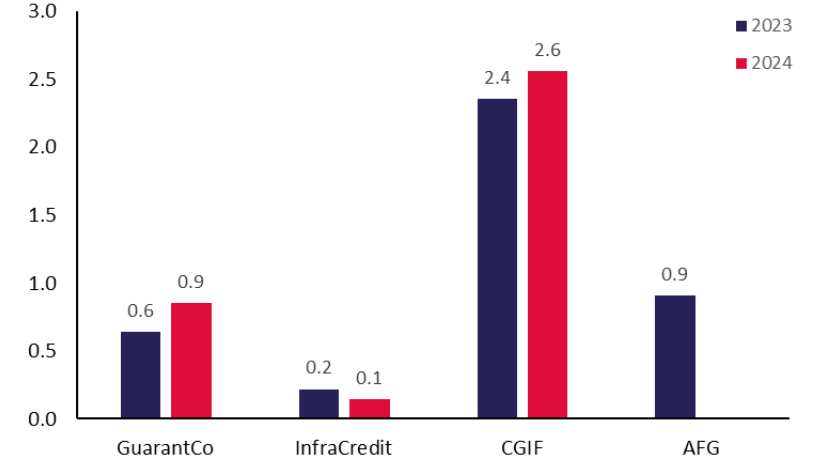
Note: Amounts are expressed in USD billions. We omit InfraZamin, the GGC, and Dhamana. These companies are newly launched and have not published financial statements stating the volumes they have guaranteed. Data for AGF is presented for 2023, the latest year for which an annual report is available.
| Bloomfield | |||||||||
|---|---|---|---|---|---|---|---|---|---|
| Standard | Agusto & | RAM | TRIS | ||||||
| Institution | & Poor's | Moody's | Fitch | PACRA Co | GCR | Ratings | Ratings | Pefindo | West |
| Africa | |||||||||
| African | |||||||||
| AA- | |||||||||
| Guarantee | (2017) | ||||||||
| Fund | |||||||||
| Credit | |||||||||
| Guarantee and | AA / A- | AAA | AAA | ||||||
| AAA(ind) | idAAA | ||||||||
| Investment | 1+ | (ind) | (ind) | ||||||
| Facility | |||||||||
| Dhamana | AA | ||||||||
| AA- | |||||||||
| A1 | (2014) | AAA | AAA | AAA | |||||
| GuarantCo | |||||||||
| (2014) | AAA | (2015) | (2014) | (2014) | |||||
| (idn) | |||||||||
| BB- | |||||||||
| (2025) | |||||||||
| B+ | |||||||||
| AAA | |||||||||
| InfraCredit | (2023) | Aaa | (Ng) | ||||||
| AAA | |||||||||
| (nga) | |||||||||
| (2023) | |||||||||
| Aaa | |||||||||
| (long | |||||||||
| term) | |||||||||
| Infrazamin | |||||||||
| A1+ | |||||||||
| (short | |||||||||
| term) | |||||||||
| The Green | |||||||||
| BBB | |||||||||
| Guarantee | (2025) | ||||||||
| Company |
| Moody's | Fitch's net | |
|---|---|---|
| Standard & | ||
| Institution Poor's RAC | leverage | par/capital |
| ratio | ratio | |
| African Guarantee | ||
| 1.6x | ||
| Fund | ||
| Credit Guarantee and | ||
| 47.80% | 1.1x | |
| Investment Facility | ||
| Dhamana | ||
| GuarantCo | 1.5x | |
| InfraCredit | 0.5x | |
| InfraZamin | ||
| between | ||
| The Green Guarantee | ||
| Company | 2.7x and | |
| 6.3x |
3.2 GuarantCo
GuarantCo’s objective is to boost sustainable infrastructure financing in lower-income countries in Africa and Asia by providing both hard- and local- currency credit guarantees on bond issues and loans. It expresses its mission as becoming “a market-based, recognised provider of contingent credit solutions aimed at enhancing the availability and role of local currency finance for infrastructure projects and developing local capital markets.”
GuarantCo seeks to address the same type of market failures as the monoline infrastructure guarantors discussed in Section 2, i.e., that domestic banks are often unwilling or unable to offer long-tenor local-currency finance, institutional investors lack the capacity to assess project risk, and governments wish to support infrastructure without expanding explicit sovereign guarantees.
GuarantCo was incorporated in Mauritius in 2005. For a decade, its activity remained limited in scope. By 2011, it had completed a single transaction and employed six staff. Since the mid-2010s, however, its development has accelerated somewhat with a greater number and volume of deals.[26] Staff numbers are in the region of seventy, and it has offices in London, Nairobi and Singapore, and the institution has broadened its footprint across Africa and Asia.
In its public communications, GuarantCo emphasises the innovative nature of these and other transactions and the developmental and environmental impacts. It has supported a sequence of innovative transactions which include:
• Local currency bond in Nigeria (2011).
• Local currency bond in Sri Lanka (2012), also the first in Asia.
• Sukuk in Pakistan (2012), also the first guarantee on Islamic financial products.
• Co-guarantee with US AID, in Uganda (2012).
• Project financing in Cameroon (2014).
• Local corporate bond in Vietnam and Ghana (2018).
• Synthetic green bond in India (2018).
• Dual-currency guarantee in Bangladesh (2019).
• Guarantee in Jordan (2019).
• Co-financing with ADB (2019), following the creation of a co-guarantee platform in 2018.
• Guarantee in Madagascar and Tanzania (2020).
• Guarantee in Cambodia and Cote d’Ivoire (2022).
• Guarantee in Benin/Togo (2023)
• Guarantees in Iraq, Mongolia and Senegal (2025)
In 2023, PIDG of which GuarantCo is a part adopted a new strategy of catalysing domestic guarantee vehicles, leading to the establishment first of InfraCredit in Nigeria in 2017 and subsequently of InfraZamin in Pakistan and Dhamana in Kenya. GuarantCo has also increasingly emphasised sustainable, renewable energy and climaterelated projects.
GuarantCo focuses primarily on credit guarantees for local-currency-denominated infrastructure financing.[27] It is still seeking to increase its size and build scale. It has exposure in a wide range of sectors, including agriprocessing, manufacturing, logistics, storage, telecoms, energy, transportation and social infrastructure. Its impact strategy concentrates on on-shore solutions with strong demonstration effects that are close to commercial viability.
A distinctive feature of GuarantCo’s mandate is its geographic focus: it prioritises countries classified by the Organisation for Economic Co-operation and Development (OECD) Development Assistance Committee (DAC) as categories 1–3[28] of Least Developed Countries (LDC) and Fragile Conflict-Affected States (FCAS). This tends to exclude more advanced EMDEs and restricts the pool of bankable projects.
Several frictions constrain growth. The pipeline of projects is limited by a shortage of bankable infrastructure proposals and by the perceived complexity of guarantee products for some counterparties. GuarantCo does not refinance existing assets and relies on originating or co-originating new transactions, sometimes in partnership with banks. It does not hedge local-currency risk, noting that guarantee calls are most likely when local currencies have depreciated and that, in this sense, currency risk is “right-way.” Pricing is not very differentiated by tenor, reflecting an emphasis on simplicity.
GuarantCo capital consists of paid-in and callable equity and donor debt facilities provided by governments of the UK, Switzerland, Australia, Sweden, the Netherlands, Canada, and France via the PIDG Trust and associated structures.[29] At end-2024, shareholder equity amounted to USD 382 million, of which USD 272 million represented equity net of accumulated losses; callable capital totalled GBP 130 million and committed debt facilities CAD 40 million and EUR 75 million. Portfolio and investment management are outsourced to Cardano Development via GuarantCo Management Company (GMC). Within the PIDG group, GuarantCo uses common policies and shared treasury, finance, and impact-analysis functions, while maintaining its own risk and IT operations.
GuarantCo has maintained strong external ratings. Since 2014 it has held a supranational A1 rating from Moody’s and a Long-Term Insurer Financial Strength rating of AA− from Fitch, alongside national-scale AAA ratings from Fitch and Bloomfield in West Africa and Pefindo in Indonesia. Moody’s incorporates a two-notch uplift for expected support from the UK government, while Fitch includes callable capital in its assessment of capital adequacy. Thus, GuarantCo’s guarantees derive their value not only from its stand-alone balance sheet but also from shareholder backing.
Partnerships with development finance institutions (DFIs) are possible, but GuarantCo emphasises a complementary rather than competing role. DFIs can provide hard-currency loans at apparently attractive interest rates, reflecting their own high credit ratings and access to concessional funding. However, such finance can undercut the development of domestic private markets, leaving borrowers exposed to substantial foreigncurrency risk (materialising as local currencies depreciate over time). By contrast, GuarantCo’s mandate is explicitly to mobilise private capital—particularly local institutional investors—into local-currency infrastructure instruments. It, therefore, does not perceive itself as having many direct competitors.[30]
In the lower-income, cash-constrained countries in which GuarantCo operates, governments generally wish to keep infrastructure projects off the public balance sheet, reinforcing the case for a specialised, privately oriented guarantor. GuarantCo operates with an internal leverage policy whereby guarantees should not exceed a multiple of three times the sum of equity, callable capital, and donor debt facilities. Leverage based on paid in equity and hybrid equity could be higher than the current levels of around three.
GuarantCo has considered seeking risk syndication from the insurance market and closed one syndication with the Lloyds Market in 2023. In turn, GuarantCo could provide syndication or reinsurance to domestic vehicles as they are established. The InfraCredit-style domestic monoline model can only be replicated in countries with sufficiently deep local capital markets, such as parts of West Africa or Asia (e.g. Vietnam).[31]
Figure 3.2 and Table 3.3 summarise GuarantCo’s leverage and profitability. The par-to-equity ratio (defined as total notional guarantees outstanding divided by equity) has risen from around 0.6 in 2015 to just over 3.0 by 2024, reflecting the acceleration in business volume. This remains well below the internal policy ceiling, which limits guarantees to three times the sum of equity, callable capital and donor debt facilities It is also substantially below the leverage levels achieved by pre-GFC monolines and by specialised multilaterals such as ICIEC and ATIDI. Return on equity has been positive in most years but volatile, with sharp declines associated with periods of elevated provisioning and slow deal flow. Net par outstanding reached USD 855 million by end-2024, still short of the earlier internal target of USD 1 billion.
These patterns highlight both the rationale and the limits of GuarantCo’s model. On the one hand, its guarantees clearly play a catalytic role: they enable long-tenor local-currency infrastructure financing in markets where banks and investors would not otherwise provide it, closely paralleling the monoline role in developed-market infrastructure. On the other hand, GuarantCo’s scale is constrained by the interaction of project-pipeline limitations in DAC 1–3 countries,[32] conservative leverage and rating policies anchored in donor governance, and the need to preserve high external ratings to ensure that its guarantees deliver a meaningful uplift for investors.
In this sense, GuarantCo illustrates how a specialist guarantee company can address a well-defined market failure in EMDE infrastructure finance, while also showing that capital, ratings, and pipeline constraints bound the extent to which the monoline model can be replicated in a developmental context. 2024 2023 2022 2021 2020 2019 2018 2017 2016 2015
Equity 272,365 244,352 225,141 229,773 279,744 272,620 270,489 273,245 255,668 237,973
Net Profit 5,281 4,087 -26,760 -55,156 2,124 2,131 -4,756 3,322 -3,296 -7,257
Guaranteed Amount 855,171 641,958 500,495 476,857 560,348 511,043 374,484 168,904 179,785 142,969
RoE 1.94% 1.67% -11.89% -24.00% 0.76% 0.78% -1.76% 1.22% -1.29% -3.05%
Par-to-equity Ratio 3.14 2.63 2.22 2.08 2.00 1.87 1.38 0.62 0.70 0.60 Note: Monetary values are expressed in thousands. Equity, Net Corporate Gain, Guaranteed Amount are reported in USD. GuarantCo reports only its “active exposure,” defined as the outstanding guaranteed amount for guarantees that have become effective. This excludes funded exposures recorded as loan receivables and excludes “non-active” guarantees that have been issued but are not yet activated due to pending underlying documentation. GuarantCo does not disclose a net exposure measure, the “Guaranteed Amount” reported reflect active guarantees.
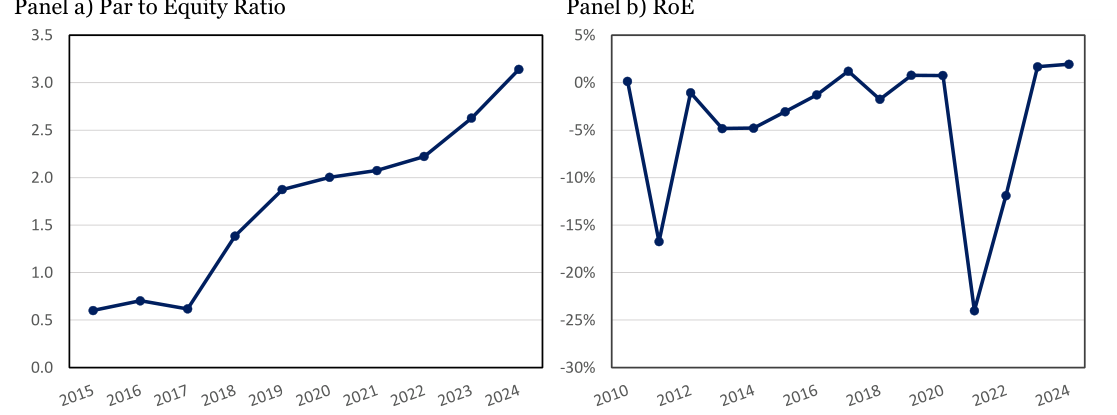
Note: The par-to-equity ratio refers to the total notional guarantee exposure divided by the total equity. The USD equivalent amounts guaranteed before 2015 are not publicly available.
3.3 InfraCredit
InfraCredit was founded in 2017 by Nigeria Sovereign Investment Authority (NSIA) in collaboration with GuarantCo, a subsidiary of PIDG. The capital providers include Nigeria Sovereign Investment Authority, KFW, Africa Finance Corporation, AfDB, InfraCo Africa, MOBILIST, Leadway Assurance, AIICO Insurance, Access ARM Pensions and Cardinal Stone Pensions.
InfraCredit provides guarantees for financing with tenors of up to 20 years. In December 2017, the company issued its first guarantee, supporting a 10-year corporate infrastructure bond. This was followed by a guarantee of a 15-year corporate green infrastructure bond in 2019, as well as its first co-guarantee with USAID (now DFC). In 2021, InfraCredit issued its first blended finance guarantee and the first guarantee with the longest 20-year tenor. Most recently, in 2025, InfraCredit guaranteed the first successful corporate infrastructure bond for a subnational Public–private Partnership (PPP). By Q2 2025, the company’s total capitalisation amounts to NGN 318.5 billion (USD 223 million equivalent). The total guaranteed debt achieves NGN 311 billion (USD 504 million). Of these guaranteed debts, twenty-two infrastructure projects have reached financial close.
According to Fitch, InfraCredit has a leverage ratio 0f 0.88x on total capital and 2.08x on total equity. InfraCredit holds an Insurer Financial Strength (IFS) Rating at “BB−” from Fitch and National IFS rating at “AAA” (NG).
The risk sharing partners of InfraCredit include ATIDI, British International Investment (BII), GuarantCo, US International Development Finance Corporation (DFC), FCDO and Financial Sector Deepening Africa (FSD Africa). In March 2024, InfraCredit signed a local currency counter-guarantee agreement with ATIDI on a risk sharing arrangement of NGN 37 billion (USD 40.7 million), following a Memorandum of Understanding between the two institutions in 2022. This was followed by a USD 30 million risk-sharing blended local currency cofinancing facility with BII to support decentralised renewable energy projects. In addition to being a co-founder and capital provider of InfraCredit, GuarantCo also serves as a risk-sharing partner by providing an NGN 20.2 billion (USD 25 million) counter-guarantee for Lagos Free Zone Company in 2023. 2024 2023 2022 2021 2020 2019 2018 2017 2016
Equity 103,605 103,728 95,333 90,357 84,067 52,198 48,975 23,813 -299
Net Profit 39,856 51,762 13,791 8,294 7,111 2,882 473 -1,128 -378
Gross Exposure 144,426 219,688 260,927 180,568 111,799 87,744 27,663 28,011 /
Net Exposure 97,079 195,277 229,675 152,792 94,725 61,040 26,198 25,979 /
RoE 38.47% 49.90% 14.47% 9.18% 8.46% 5.52% 0.97% -4.74% 0
Gross Exposure / Equity 1.39 2.12 2.74 2.00 1.33 1.68 0.56 1.18 /
Net Exposure / Equity 0.94 1.88 2.41 1.69 1.13 1.17 0.53 1.09 / Note: Monetary values are expressed in thousands. Equity, Net Corporate Gain, Gross/Net Exposure are converted to USD using the NGN to USD rate applicable at each year-end. “Gross exposure” represents the maximum liability set out in the credit guarantee. “Net exposure” reflects the amount remaining after deducting the value of the relevant utilised approved credit-risk mitigants facilities (re-guarantees, accrued interest, and reserve account).
When InfraCredit was set up, there was uncertainty regarding the funding cost of bond issues that it wrapped. Its first bond priced at less than 1% above the government curve. The InfraCredit model benefits from the existence of Nigeria’s treasury bond yield curve (extending to more than 25-year tenors) against which debt can be priced. That curve must extend to long tenors which is not the case in many African countries in which governments only borrow local currency at short maturities using T-bills.
Initially, InfraCredit’s rating was aligned with the sovereign. The latter was downgraded without a change in InfraCredit’s rating, which now is slightly higher than that of the sovereign. InfraCredit’s capital is largely dollarbased so devaluation of the NGN increases its capital base in local currency terms and relative to its written guarantees. Holding its funding in hard currency assets was the initial preference of its donor funders although it did expose InfraCredit to currency risk.[33]
InfraCredit has made progress towards operating on a fully commercial basis. It has listed on the Nigerian National Association of Security Dealers (NASD) over-the-counter (OTC) exchange and attracted equity investment from two local pension companies. It is now shifting its capital base to be more NAIRA-based. Its success has been based on conservative underwriting. In its 8 years of existence, it has experienced no claims.
The potential for creating the business was apparent from the fact that Nigerian companies were at the time borrowing for investment at 27% for tenors around 3-5 years while the government rate for the same tenors was around 16%. These companies would have preferred to borrow at 10-year tenors, but this was unavailable in the debt capital market.
On a typical guaranteed corporate infrastructure bond, InfraCredit earns a risk-reflective fee of approximately 2%, thus, reducing the borrower's all-in cost to 18%. This would cover a 10-year bond issue with a 2-year principal payment moratorium. InfraCredit might have considered more aggressive pricing since its guarantees were benefitting borrowers so much. But borrowers would have been tempted to borrow directly, reducing the medium and long-term demand for InfraCredit’s services. One early beneficiary of InfraCredit's guarantee (North South Power in 2019) has indeed started to borrow directly but this is following a rating upgrade that makes the gap between the unguaranteed and wrapped version of the bond issue much smaller.
InfraCredit offers 100% wraps. These are simpler for pension fund investors and the ratings agencies to understand. They play a monitoring role to ensure that bond proceeds are used appropriately and that equipment suppliers are paid. InfraCredit takes a senior secured credit position, with fixed and floating charges. But it is not a depository institution and does not possess the same level of real-time liquidity information that a bank lender would have.
In the long-run, the infrastructure debt product life cycle that has been apparent in developed markets may reduce InfraCredit’s role, at which point it may have to vary its approach. In some sophisticated EMDE markets like Chile, pension funds have built the teams and expertise to lend directly to infrastructure projects. One may expect that at some point similar developments will occur in Nigeria as funds become comfortable with the product.
Private debt may also provide competition for InfraCredit’s guarantee business. In 2017 (the year InfraCredit was founded), the Nigeria Infrastructure Debt Fund was also set up. It has followed a similar trajectory to that of InfraCredit and has started to offer loans at 10-year tenors having registered that InfraCredit was providing guarantees up to that tenor.
Note that InfraCredit’s guarantees have so far been applied to corporate infrastructure projects in which InfraCredit would have recourse to the corporate borrower if the project ran into difficulties. Such projects are inherently simpler to underwrite than bankruptcy remote infrastructure projects organised through SPVs. Expanding into this latter type of projects may offer InfraCredit the opportunity to expand its offerings.
PPP projects for the benefit of government bodies may also offer expansion possibility. In Nigeria, such bodies have little experience of managing infrastructure projects. The Nigerian market is complicated by the country’s federal structure. Each of Nigeria's 36 states has its own state assembly, tax authority and laws governing public infrastructure development. InfraCredit is considering diversification outside Nigeria, but it also has plenty of opportunities for the moment within its own domestic market. So far, it has facilitated the raising of USD 500 million in NGN financing (NGN 300 billion), based on the relevant exchanges rates at each financial close.
In Nigeria, the availability of long-term government bonds (even up to 20- to 30-year tenors) provides a reference which is not available in many other EMDE countries. When countries experience sovereign financial distress government issuance shrinks to short maturities (for example 1-year issuance in Ghana). Another success factor for Nigeria is the presence of a vibrant pension sector following its privatisation in 2004. Different pension funds will bid to purchase debt instruments. This contrasts to many developing countries in which pensions are managed by a single government agency.
InfraCredit’s staff currently numbers thirty-seven. Senior managers include former big accounting and consulting firm or rating agency employees. They have built in-house legal capacity to develop template guarantee documents suitable for their market. The number of analysts has expanded in recent years and InfraCredit has created an academy to build up staff expertise (currently focusing, for example, on project finance which will permit the writing of guarantees less on corporate and more on pure project finance bond issues). In some project finance related exposures they have guaranteed, their exposure has been limited by results-based grants from DFIs and donors.
Even with corporate infrastructure, much can go wrong. InfraCredit’s approach to underwriting is conservative. Guarantees are approved by the Board Credit Committee which includes highly experienced individuals. Local expertise can be more valuable than experience of projects in multiple locations. Investments are subject to bottlenecks associated with supplier or government agency delays. InfraCredit has successfully navigated stress periods already. The recent currency devaluation was favourable for some InfraCredit-guaranteed borrowers. The hike in diesel prices following Russia’s invasion of Ukraine was for some more challenging, depending on infrastructure clients' ability to pass through price increases in a timely manner.
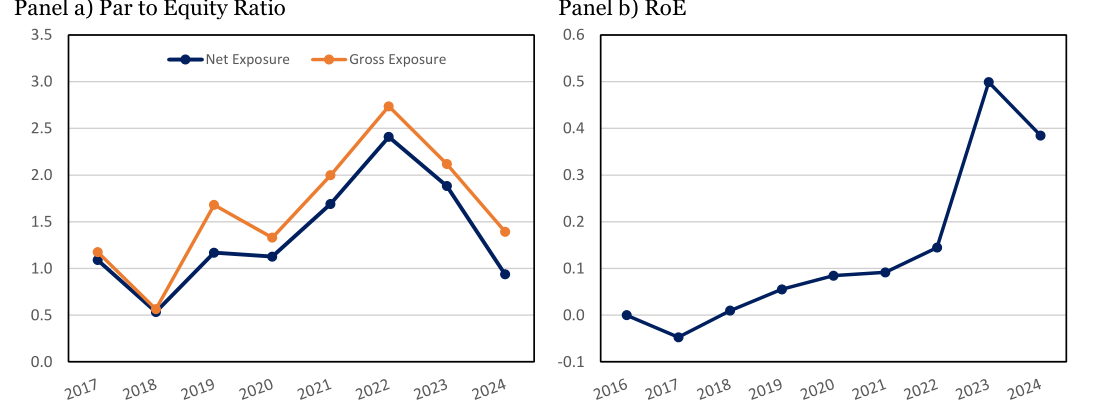
Note: The par-to-equity ratio refers to the total notional guarantee exposure divided by the total equity. The USD equivalent amounts guaranteed before 2017 are publicly unavailable.
3.4 Cgif
Of the EMDE guarantee funds considered here, CGIF is the closest to a developed-market monoline bond insurer Its business model consists of guaranteeing corporate bonds listed in EMDE stock markets in South-East Asia. At CGIF’s inception, bond underwriting in the region was seen as lacking.
CGIF was established in November 2010 by the 10 member countries of the Association of Southeast Asian Nations (ASEAN) (namely, Brunei, Cambodia, Indonesia, Laos, Malaysia, Myanmar, Philippines, Singapore, Thailand, and Vietnam) plus China, Japan, and South Korea, and the ADB, with the aim of promoting the financial stability and boosting long-term investments in the ASEAN+3 region.
The Meeting of Contributors (MoCs) serves as the highest decision-making body of CGIF, having authority over its strategic direction and governance matters. The MoCs is assembled annually within five months of the end of the previous fiscal year. China and Japan are the current largest contributors to CGIF, together providing 60% of its total paid-in capital.
CGIF issued its first two bond guarantees in 2013 and has since steadily increased its capital base while expanding the guaranteed exposure. The Facility’s annual report suggests that, by the end of 2024, its total equity equalled approximately USD 1.35 billion, while its outstanding guaranteed exposure amounted to USD 2.56 billion.
The Facility’s official website reports that, as of November 2024, CGIF has provided guarantees for 87 bond and sukuk issues in 9 ASEAN+3 currencies, with a cumulative value of USD 3.69 billion. This has benefited 56 corporate issuers across 12 countries in the area. The only contributing country without a CGIF-guaranteed bond is Brunei. Vietnam, Thailand, and Singapore are the current top three beneficiary countries by amount guaranteed. Real estate, industrial, and consumer discretionary remain the most represented sectors 2024 2023 2022 2021 2020 2019 2018 2017 2016 2015 2014 2013
Equity 1,355,407 1,302,467 1,223,232 1,372,765 1,351,659 1,255,067 957,756 739,224 727,521 722,557 716,499 715,232
Net Profit 48,894 43,992 13,834 29,791 23,963 23,162 16,857 10,844 10,082 7,781 3,548 2,718
Guaranteed Amount 2,557,290 2,353,461 2,186,440 2,299,333 2,308,298 2,090,350 1,409,541 1,096,246 1,120,458 748,913 615,996 125,054
RoE 3.61% 3.38% 1.13% 2.17% 1.77% 1.85% 1.76% 1.47% 1.39% 1.08% 0.50% 0.38%
Par-to-equity Ratio 1.89 1.81 1.79 1.67 1.71 1.67 1.47 1.48 1.54 1.04 0.86 0.17 Note: Monetary values are expressed in thousands. Equity, Net Corporate Gain, Guaranteed Amount are reported in USD. The “Guaranteed Amount” represents CGIF’s total outstanding guaranteed amount and reflects the full notional obligation of all bonds covered by its guarantees, inclusive of coupon payments.
S&P assigned CGIF a long-term “AA” credit rating and a “A-1+” short-term foreign currency issuer credit rating in February 2025. It received a National IFS Rating of AAA (Indonesia) from Fitch by December 2024. The total capitalisation of CGIF stood at USD 1.36B. The leverage ratio on total equity was 1.89x. The company does not have any callable capital or subordinated debt.
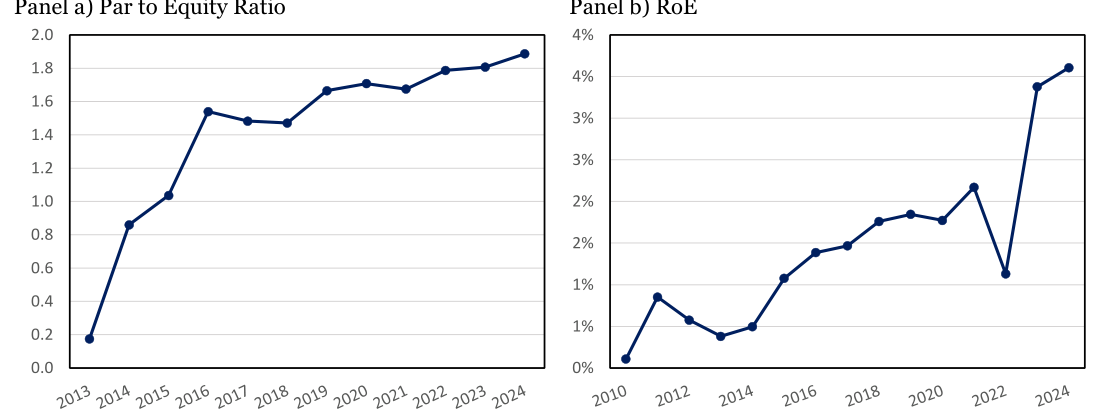
Note: The par-to-equity ratio refers to the total notional guarantee exposure divided by the total equity.
3.5 Agf
The AGF was established in Mauritius in 2011 by the Government of Denmark (represented by DANIDA), the Government of Spain (represented by AECID) and the AfDB. It is incorporated under the Companies Act of Kenya, with its registered office located in Nairobi. Between 2015 to 2018, the French Development Agency (AFD), the Nordic Development Fund (NDF), the Danish Investment Fund for Developing Countries (IFU) and KfW successively became shareholders of AGF.
The aim of AGF is to facilitate access to finance for SMEs and thereby to drive economic growth in Africa. According to its last annual report, AGF achieved its highest annual credit guarantee volume in 2023, reaching USD 535 million. This volume of new business comprised 75 new agreements and contributed to a portfolio of 515 active guarantees with 250 Financial Institutions across 44 African countries. By end 2023, AGF had issued cumulative guarantees totalling USD 2.5 billion, of which USD 342 million was re-guaranteed. Accumulated guarantee claims total USD 310 million. 2023 2022 2021 2020 2019 2018 2017 2016 2015 2014 2013 2012
Equity 187,329 183,998 171,961 148,878 158,913 121,311 80,643 86,920 79,419 63,662 48,121 49,624
Net Profit -5,423 -2,962 -8,897 -10,034 -647 -1,598 -6,276 810 1,757 -959 -1,503 -375
Gross Exposure 905,483 595,040 633,454 444,191 379,580 346,608 334,818 233,610 195,352 150,960 9,414 1,023
Net Exposure 633,617 441,892 498,205 361,094 315,244 270,095 269,918 228,137 144,732 106,685 9,414 1,023
RoE -2.90% -1.61% -5.17% -6.74% -0.41% -1.32% -7.78% 0.93% 2.21% -1.51% -3.12% -0.76%
Gross Exposure / Equity 4.83 3.23 3.68 2.98 2.39 2.86 4.15 2.69 2.46 2.37 0.20 0.02
Net Exposure / Equity 3.38 2.40 2.90 2.43 1.98 2.23 3.35 2.62 1.82 1.68 0.20 0.02 Note: Monetary values are expressed in thousands. Equity, Net Corporate Gain, Gross/Net Exposure are reported in USD. “Gross exposure” represents the maximum liability set out in AGF’s live credit guarantees. “Net exposure” reflects the amount remaining after deducting the value of re-guaranteed portions.
The main area of operations is the West African Economic and Monetary Union (WAEMU) region. This accounted for 37% of AGF’s total guarantees in 2023 (lower than the 2022 percentage of 42%). 30% of the outstanding guarantee volume represents exposures to the Wholesale & Retail Trade sector. The Fund aims to expand its engagement in its three priority sectors: Agriculture, Energy, and Infrastructure & Manufacturing.
AGF obtained a long-term IFS rating of “AA−” from Fitch in August 2025. It was the first guarantee fund in Africa to be assigned such a rating in 2017. AGF’s net par to equity ratio (based on the 2023 annual report) is 3.38x.
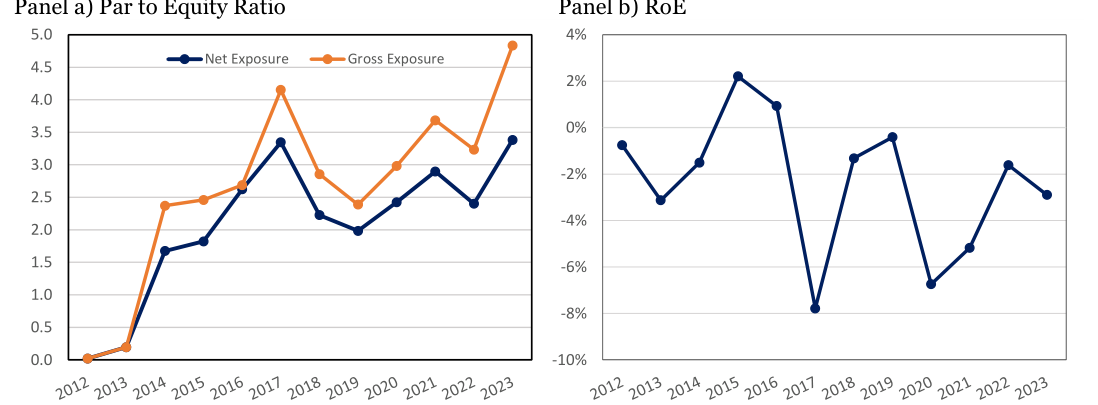
Note: The par-to-equity ratio refers to the total notional guarantee exposure divided by the total equity.
3.6 Specialised Multilateral Insurers
Important reference cases for the guarantee companies described above are two SMIs, namely the ICIEC and the ATIDI. These were both established by individual MDBs with the involvement of some of their sovereign shareholders.
ICIEC is a member of the Islamic Development Bank (IsDB) Group. Its shareholders are sovereign members of the IsDB and the Waqf fund which is also part of IsDB Group. ATIDI is owned by a set of sovereign shareholders and financial institutions. These were initially located primarily in East Africa, but ATIDI has progressively attracted shareholdings from sovereigns elsewhere in the continent. The AfDB was involved in the initial foundation of ATIDI (which operated as Africa Trade Insurance (ATI) until 2023) and retains a small shareholding. 2024 2023 2022 2021 2020 2019 2018 2017 2016 2015 2014
Equity 186,481 159,151 148,420 125,915 110,422 117,240 114,618 109,903 113,420 108,253 101,334
Net Corporate Gain 14,358 13,359 5,835 4,641 4,273 4,789 1,684 869 -5,470 -395 -2,022
Gross Exposure 3,416,738 2,668,359 3,102,905 2,148,845 1,542,259 1,752,777 2,229,269 2,319,300 2,668,090 1,177,491 835,385
Net Exposure 773,687 750,676 840,751 721,613 527,213 467,192 573,127 824,974 866,281 544,549 563,721
RoE 7.70% 8.39% 3.93% 3.69% 3.87% 4.08% 1.47% 0.79% -4.82% -0.37% -2.00%
Gross Exposure / Equity 18.32 16.77 20.91 17.07 13.97 14.95 19.45 21.10 23.52 10.88 8.24
Net Exposure / Equity 4.15 4.72 5.66 5.73 4.77 3.98 5.00 7.51 7.64 5.03 5.56 Note: Monetary values are expressed in thousands. Equity amounts have been calibrated in line with IFRS measurement principles. Equity, Net Corporate Gain, and Gross/Net Exposure are converted to USD using the Islamic Dinar (ID) to USD rate (1 ID = 1 SDR) applicable at each year-end.
ICIEC and ATIDI provide trade and Political Risk Insurance (PRI) but in fact are also engaged in loan and bond guarantees (in the case of ICIEC) and project related guarantees (in the case of ATIDI). The debt claims they guarantee have, in fact, substantial overlap with the claims covered by the specialist guarantee companies described above.
A striking feature of the two SMIs just mentioned is the high leverage they achieve. In the case of ICIEC, the ratio of exposure of net of reinsurance to equity (paid in equity plus reserves) is 4.149 while the ratio of gross exposure to equity is 18.322. For ATIDI, the corresponding ratios are 11.207 and 1.336. The volumes of insurance written by the two organisations are USD 3.416 billion and USD 8.871 billion for ICIEC and ATIDI, respectively.
At the same time, as leverage has increased through greater use of reinsurance, the two organisations have become profitable with RoE of 7.7% and 7.5%, respectively, for ICIEC and ATIDI. From the plots in Panel b) of Figure 3.7 and 3.6, it is apparent that this profitability has developed over time and that some years ago both organisations were less profitable and achieved much lower leverage. In both cases, changes in senior management coincided with much better financial performance and a step change in ambition and impact. Now, each organisation is recording low claim rates and accumulating capital through retained earnings. 2024 2023 2022 2021 2020 2019 2018 2017 2016 2015 2014
Equity 791,554 699,305 553,347 516,251 410,785 349,179 262,272 242,164 208,284 186,173 180,610
Net Profit 59,518 69,057 32,838 34,870 39,449 27,678 11,927 9,910 716 2,378 3,439
Gross Exposure 8,871,048 9,553,963 8,052,635 6,626,852 6,262,406 6,449,273 4,786,842 2,391,438 1,945,681 1,690,910 1,262,174
Net Exposure 1,057,351 1,227,438 1,141,941 933,627 968,386 1,073,640 1,006,804 877,999 870,485 744,268 514,291
RoE 7.52% 9.88% 5.93% 6.75% 9.60% 7.93% 4.55% 4.09% 0.34% 1.28% 1.90%
Gross Exposure / Equity 11.21 13.66 14.55 12.84 15.24 18.47 18.25 9.88 9.34 9.08 6.99
Net Exposure / Equity 1.34 1.76 2.06 1.81 2.36 3.07 3.84 3.63 4.18 4.00 2.85 Note: Monetary values are expressed in thousands. Equity, Net Corporate Gain, Gross/Net Exposure are reported in USD.
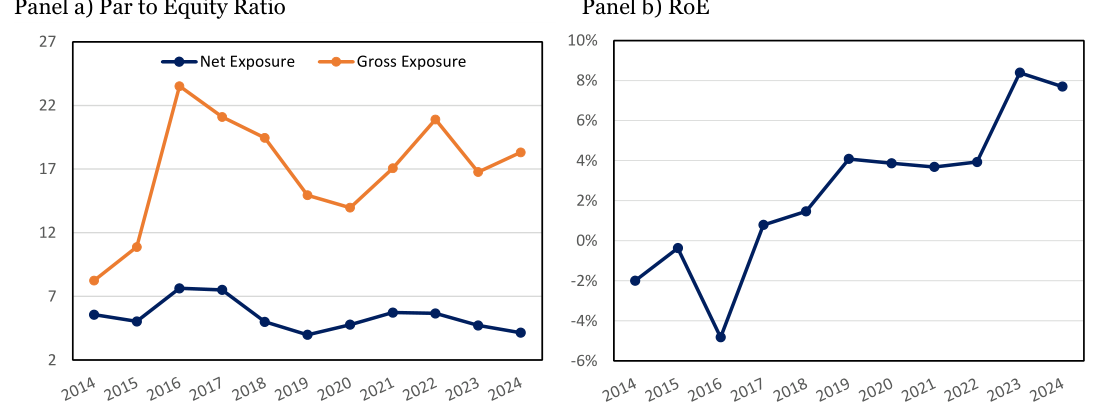
Note: The par-to-equity ratio refers to the total notional guarantee exposure divided by the total equity.
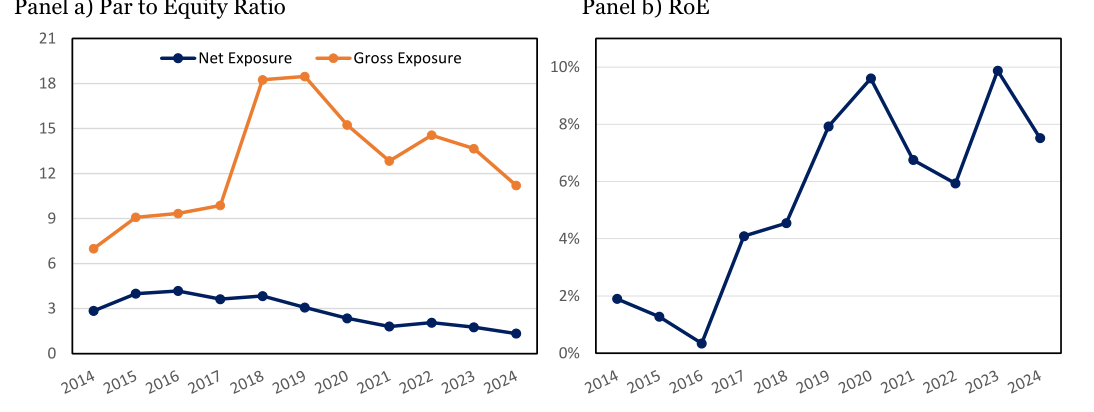
Note: The par-to-equity ratio refers to the total notional guarantee exposure divided by the total equity.
3.7 Financial analysis of GuarantCo
This section presents financial analysis of two EMDE guarantee companies, GuarantCo and InfraCredit. The analysis is comparable to that of AG provided in Section 2.6. Figure 3.8 represents graphically a simplified business model of a guarantee company. Such organisations have a simpler financial structure and more limited public financial statements than insurers. Unlike insurers, guarantee companies face no regulatory capital.
As for AG, the analysis of GuarantCo presented below is based on the firm’s public financial statements and rating reports. GuarantCo follows the accounting standards of a guarantor rather than an insurer. This prevents one from tracking some financial results necessary for financial modelling when only public data are accessible. Rather than inferring the fields necessary for obtaining a full breakdown of revenue and expenses, we consider increases in the amount newly insured while supposing that premium per dollar insured falls according to an assumed elasticity.
GuarantCo is rated by Moody’s under the agency’s supranational criteria. The rating was last reviewed in May of
2025. GuarantCo was assigned a long-term rating of A1 with stable outlook. The Moody’s supranational criteria are illustrated in Figure 3.9.
Figure 3.9: Fitch Criteria for Financial Guarantors
The methodology begins with an assessment of capital adequacy alongside funding and liquidity factors to calculate the preliminary intrinsic financial strength. Capital adequacy is determined using a leverage ratio that is not risk sensitive. Subsequently, the operating environment and quality management factors are integrated to establish the adjusted intrinsic financial strength. The final rating is then determined by the inclusion of the strength of member support. GuarantCo’s scores are displayed in Table 3.8. This methodology is designed for multilateral institutions and is not specifically tailored for financial guarantors or insurers.
GuarantCo is also rated by Fitch but under the agency’s Insurer methodology. GuarantCo’s Fitch rating was last updated in May 2025, at which point it was assigned an insurer long-term rating of AA−. The rating includes a 3notch uplift reflecting shareholder’s support.
The Fitch methodology for financial guarantors is illustrated in Figure 3.9. Quantitative Credit Factors are based on metrics and thresholds that determine the score of the factor. The metrics employed to assess each factor differ depending on the specific insurance sector. For instance, in the case of financial guarantors, the capitalisation and leverage factor is established using the Financial Leverage Ratio and the Par-to-Capital Ratio. Conversely, for non-life insurers, Fitch utilises its Prism Model Score to determine the same factor. Fitch assigns weights to each of the factors to aggregate them into the SACP. Finally, the support is added to determine the final rating. The scores for GuarantCo are displayed in Table 3.10.
The analysis assumes an annual growth of 5% of the amount insured. This is broadly in line with the growth observed over the last years. Table 3.12 presents the projected financial results according to the procedure described above. There results assumed a fee elasticity of 100% relative to the growth in the insured amount. This means that the fees get a reduction in the same proportion there is a production of new exposures.
GuarantCo faces challenges in that its ratings limit the degree to which it can increase the size of the business (a 40% volume increase would reduce its rating) and yet its operational costs exceed income from guarantees written. Past losses preclude use of commercial reinsurance or risk transfer to the private sector. Perhaps the best strategy would be risk transfer on concessional terms to other public entities and the progressive accumulation of a more favourable underwriting track-record, accompanied by intensified cost control.
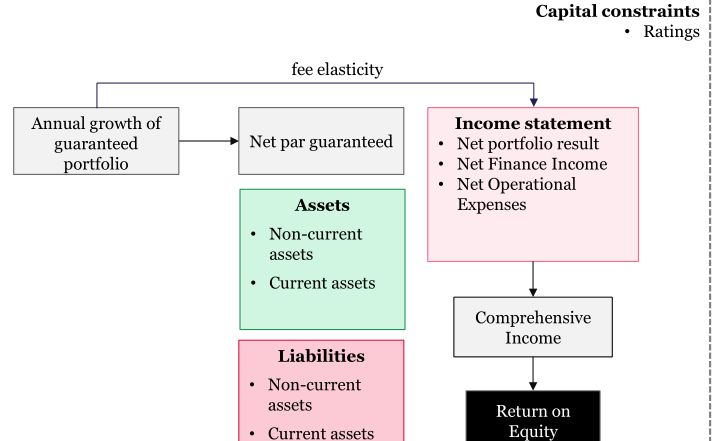
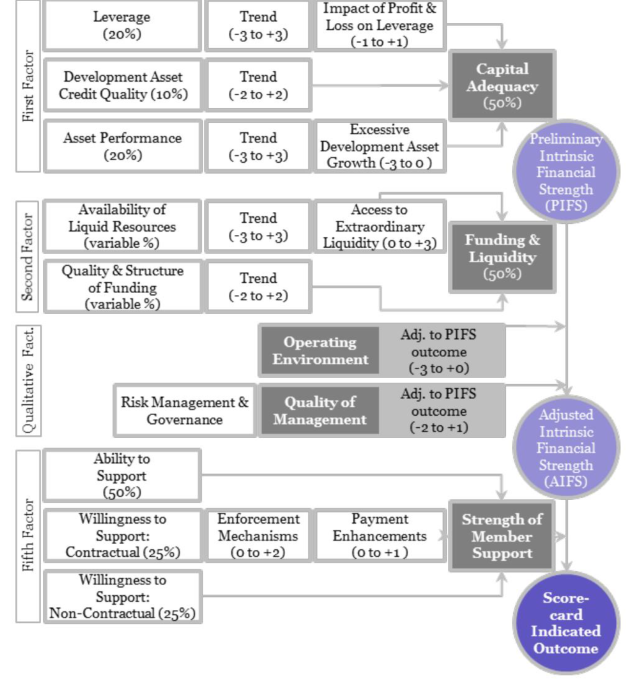
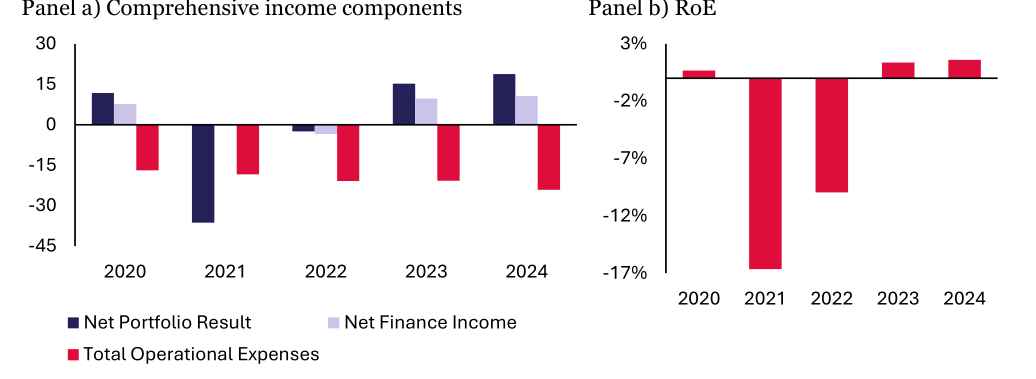
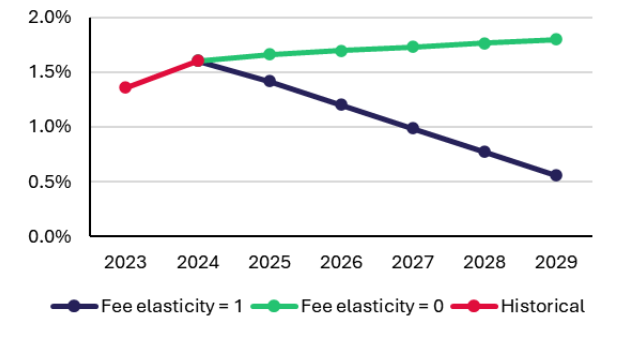
| Factor | Score |
|---|---|
| Capital adequacy | ba1 |
| Liquidity and funding | a1 |
| Preliminary IFS | baa1 |
| Other adjustment | 0 |
| Adjusted IFS | baa1 |
| Member support score | High |
| Scorecard outcome | A1 -A3 |
| Rating | A1 |
| Lev Growth | erage | Capital | Liquidity and | Preliminary intrinsic financial | Qualitativ e | Adjusted intrinsic | Strength of member | Scorecard |
|---|---|---|---|---|---|---|---|---|
| ratio | Adequacy | funding | strength | adjustments | financial | support | indicated | |
| 0 | 388 | ba1 | a1 | baa1 | 0 | baa1 | High | A1 |
| 6 | 401 | ba2 | a1 | baa1 | 0 | baa1 | High | A1 |
| 42 | 536 | ba3 | a1 | baa2 | 0 | baa2 | High | A2 |
| 130 | 867 | b1 | a1 | baa2 | 0 | baa2 | High | A2 |
| 219 | 1202 | b2 | a1 | baa3 | 0 | baa3 | High | A3 |
| Metric | Base | ||
|---|---|---|---|
| Industry Profile | & Operating Env | ironment (IPOE) bb | to |
| Company Profile | bb+ | ||
| Capitalization & | Lev erage | aa- | |
| Debt Serv ice & | Financial Flexibility | n/a | |
| Financial | Performance & Earnings | b+ | |
| Inv estment & | Asset Risk | aa | |
| Asset/Liability & | Liquidity | Management | aa |
| Reserv e Adequacy | a | ||
| Reinsurance / | Risk Mitigation / | Catastrophe | a+ |
| Insurer Financial | Strength Rating | (IFS) – Preliminary | a- |
| Ownership | +3 | ||
| Insurer Financial | Strength Rating | (IFS) | AA- |
| Growth | IPOE | Company | Capitalizatio | Financial Inv Performance & & | estment Asset | Asset/Liability & Liquidity | Reserv e Risk | Reinsurance / Mitigation | IFS – Preliminar | Ownership | IFS | ||
|---|---|---|---|---|---|---|---|---|---|---|---|---|---|
| Profile | n & Lev erage | Earnings | Risk | Management | Adequacy / | Catastrophe | y | ||||||
| 0 | bb | to | a- | bb+ | aa- | b+ | aa | aa | a | a+ | a- | +3 | AA- |
| 46% | bb | to | a- | bb+ | aa- | b+ | aa | aa | a | a+ | a- | +3 | AA- |
| 94% | bb | to | a- | bb+ | a- | b+ | aa | aa | a | a+ | bbb | +3 | A |
| 180% | bb | to | a- | bb+ | bbb | b+ | aa | aa | a | a+ | bbb | +3 | A |
| 312% | bb | to | a- | bb+ | bb+ | b+ | aa | aa | a | a+ | bbb- | +3 | A- |
| Field | 2022 | 2023 | 2024 | 2025 | 2026 | 2027 | 2028 | 2029 |
|---|---|---|---|---|---|---|---|---|
| Amount Guaranteed | 893 | 945 | 1 ,024 | 1 ,07 5 | 1 ,1 29 | 1 ,1 86 | 1 ,245 | 1 ,307 |
| Assets | ||||||||
| Non-current assets | 1 1 | 1 0 | 7 | 7 | 7 | 7 | 7 | 7 |
| Current assets | 258 | 290 | 323 | 329 | 335 | 340 | 344 | 347 |
| Total assets | 269 | 301 | 330 | 336 | 342 | 346 | 351 | 354 |
| Liabilities | ||||||||
| Non-current liabilities | 32 | 32 | 32 | 32 | 32 | 32 | 32 | 32 |
| Current liabilities | 1 2 | 24 | 26 | 27 | 27 | 28 | 29 | 30 |
| Total liabiliites | 44 | 56 | 58 | 58 | 59 | 60 | 61 | 62 |
| Equity | ||||||||
| Share capital | 344 | 359 | 382 | 382 | 382 | 382 | 382 | 382 |
| Accumulated losses | -1 1 9 | -1 1 5 | -1 1 0 | -1 04 | -1 00 | -96 | -92 | -89 |
| Total equity | 225 | 244 | 27 2 | 27 8 | 282 | 287 | 290 | 293 |
| Income statetment | ||||||||
| Net Portfolio Result | -2.5 | 1 5.3 | 1 8.9 | 1 8.8 | 1 8.7 | 1 8.6 | 1 8.5 | 1 8.5 |
| Net Finance Income | -3.4 | 9.7 | 1 0.7 | 1 0.7 | 1 0.7 | 1 0.7 | 1 0.7 | 1 0.7 |
| Operational Expenses | -20.9 | -20.8 | -24.1 | -24.7 | -25.3 | -25.9 | -26.5 | -27 .2 |
| Comprehensiv e Income | -26.8 | 4.1 | 5.3 | 4.8 | 4.1 | 3.4 | 2.7 | 2.0 |
| Return on equity | -9.9% | 1 .4% | 1 .6% | 1 .4% | 1 .2% | 1 .0% | 0.8% | 0.6% |
Note: The projected results in this table assume a fee elasticity of 100% relative to the growth in the insured amount. This implies that an alpha per cent increase in guarantees results in the fees being scaled by a factor of (1 − alpha). The columns 2022, 2023 and 2024 are observed historical results.
3.8 Financial analysis of InfraCredit
In this section, we present financial analysis of InfraCredit again based on publicly available financial statements and rating reports.
Like GuarantCo, InfraCredit adheres to the accounting standards used by a financial guarantor. Consequently, some financial results are not fully traceable from public data sources alone. Fitch rates InfraCredit under its insurer methodology for financial guarantors. Figure 3.9 displays this methodology. In July 2025, Fitch assigned InfraCredit an international-scale rating of BB−. Its Nigerian national rating from Fitch was AAA (nga). Table 3.13 displays components of the rating.
Headroom analysis for the rating (i.e., calculations of how much it could expand its guarantee volumes before experiencing downgrades) is presented in Table 3.14. Headroom analysis explores how the rating performs as the par value amount insured increases. At the end of 2024 InfraCredit had a par-to-capital ratio of 0.51x, a ‘Very High’ risk portfolio and financial leverage of 46%. These two factors combine to yield a Capitalisation and Leverage score of bbb+. As the amount insured grows, the par-to-capital ratio and financial leverage increase[34]. Only after an increase of 335% of the insured par value amount does a decline of the Capitalisation and Leverage factor to bbb− occur. An even greater increase would be necessary to generate downgrade in InfraCredit’s IFS rating. This event occurs when the financial leverage ratio is larger than 60%. This shows that InfraCredit, in its current configuration, is extremely far from a binding rating constraint.
To understand InfraCredit’s financial situation better, we perform projections of its financial statements under different scenarios. We adopt the following assumptions:
• Growth in par insured growth of 10% per year.
• Unchanged currency composition of the balance sheet during the projection period.[35]
• Guarantees are denominated in Naira.
• The USD-NGN exchange rate depreciates by 10% a year over the projected period.
• Guarantee fee income and guarantee fee expenses depend on the volume guaranteed and the results observed in the prior financial year.
• Interest income depends on the amount of investment securities. Interest expenses depend on the volume of unsecured subordinated long-term loans.
• Foreign exchange gains or losses depend on movements in the appreciation or depreciation of total equity at the beginning of the year.
• The total comprehensive income fully retained for the next year.
Table 3.15 presents the projected financial results for InfraCredit. It shows that total comprehensive income is highly sensitive to movements in the USD/NGN exchange rate, a pattern that has also characterised performance in previous years. Figure 3.11 illustrates the return on equity both including and excluding foreign exchange gains. Excluding these FX gains, InfraCredit’s average return on equity would be 4.2% over the last seven years.
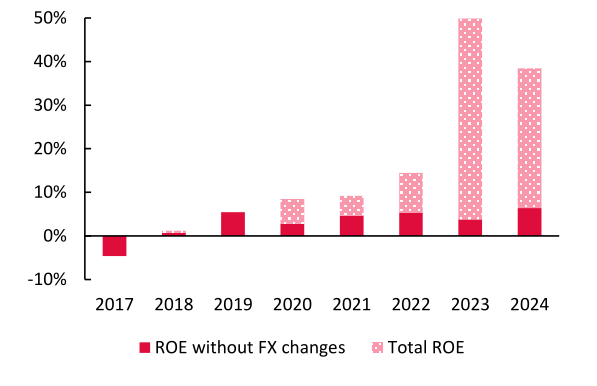
| Metric | Base | |
|---|---|---|
| Industry Profile | & Operating Environment (IPOE) ccc+ | to |
| Company Profile | bb- | |
| Capitalization & | Leverage | bbb+ |
| Debt Service | Capabilities & Financial Flexibility | bb+ |
| Financial | Performance & Earnings | a |
| Investment & | Liquidity Risk | b- |
| Reserve Adequacy | bbb | |
| Reinsurance / | Risk Mitigation / Catastrophe | a- |
| Insurer Financial | Strength Rating (IFS) – Preliminary | bb- |
| Ownership | 0 | |
| Insurer Financial | Strength Rating (IFS) | BB- |
| Growth | IPOE | Company | Capitalization Cap. | Debt Service & Financial | Financial Perf. & | Investment | Reserve | Reinsurance / Risk | IFS – | Ownership | IFS | ||
|---|---|---|---|---|---|---|---|---|---|---|---|---|---|
| Profile | & Leverage | Flexibility | Earnings | & Liq. Risk | Adequacy | Mitigation / Catastrophe | Preliminary | ||||||
| 0 | ccc+ | to | bb | bb- | bbb+ | bb+ | a | b- | bbb | a- | bb- | 0 | bb- |
| 335% | ccc+ | to | bb | bb- | bbb- | bb+ | a | b- | bbb | a- | bb- | 0 | bb- |
| 475% | ccc+ | to | bb | bb- | bb+ | bb+ | a | b- | bbb | a- | bb- | 0 | bb- |
| 730% | ccc+ | to | bb | bb- | bb | bb+ | a | b- | bbb | a- | bb- | 0 | bb- |
| 1005% | ccc+ | to | bb | bb- | b+ | bb+ | a | b- | bbb | a- | b+ | 0 | b+ |
| 1125% | ccc+ | to | bb | bb- | b | bb+ | a | b- | bbb | a- | b+ | 0 | b+ |
| Balance Sheet | 2022 | 2023 | 2024 | 2025p | 2026p | 2027p | 2028p | ||
|---|---|---|---|---|---|---|---|---|---|
| Par insured | growth | 60.1% | 59.9% | 15% | 10% | 10% | 10% | 10% | |
| USD/NGN | 460 | 896 | 1,527 | 1,680 | 1,848 | 2,032 | 2,236 | ||
| Depreciation | 10.81% | 94.82% | 70.42% | 10% | 10% | 10% | 10% | ||
| Amount | Guaranteed | 120,003 | 191,840 | 220,539 | 242,593 | 266,852 | 293,537 | 322,891 | |
| Notional Amount | Guaranteed | 105,630 | 174,968 | 148,239 | 163,063 | 179,370 | 197,307 | 217,037 | |
| Assets | |||||||||
| Total assets | 86,405 | 175,434 | 309,244 | 405,162 | 479,165 | 571,400 | 681,685 | ||
| Total liabilities | 42,561 | 82,494 | 151,039 | 180,363 | 215,718 | 258,361 | 309,807 | ||
| Total equity | 43,845 | 92,940 | 158,205 | 224,799 | 263,446 | 313,039 | 371,878 | ||
| Total liabilities | and equity | 86,405 | 175,434 | 309,244 | 405,162 | 479,165 | 571,400 | 681,685 | |
| Income | |||||||||
| Gross revenue | 7,294 | 12,222 | 26,914 | 29,605 | 32,565 | 35,822 | 39,404 | ||
| Guarantee fee | income | 1,950 | 3,514 | 5,208 | 5,729 | 6,302 | 6,932 | 7,625 | |
| Guarantee fee | expenses | -298 | -642 | -1,506 | -1,656 | -1,822 | -2,004 | -2,204 | |
| 1,652 | 2,872 | 3,702 | 4,073 | 4,480 | 4,928 | 5,421 | |||
| Interest income | 5,345 | 8,708 | 21,706 | 29,636 | 35,716 | 43,324 | 52,444 | ||
| Interest expense | -1,948 | -3,007 | -6,674 | -8,076 | -9,772 | -11,824 | -14,307 | ||
| Impairment | losses on financial instruments | -259 | -897 | -1,565 | -2,137 | -2,575 | -3,124 | -3,781 | |
| Other income | 0 | 0 | 21 | 24 | 26 | 29 | 31 | ||
| Foreign exchange | gain (loss) | 4,041 | 42,834 | 50,731 | 15,821 | 22,480 | 26,345 | 31,304 | |
| 8,831 | 50,511 | 67,922 | 39,340 | 50,355 | 59,677 | 71,112 | |||
| Personnel | expenses | -1,480 | -2,059 | -3,585 | -3,943 | -4,337 | -4,771 | -5,248 | |
| Depreciation | of | property and equipment | -70 | -94 | -106 | -116 | -128 | -140 | -155 |
| Depreciation | of | right of use asset | -22 | -22 | -31 | -34 | -38 | -41 | -45 |
| Amortisation | of | intangible asset | -16 | -17 | -10 | -11 | -13 | -14 | -15 |
| Other operating | expenses | -965 | -1,272 | -2,632 | -2,895 | -3,184 | -3,503 | -3,853 | |
| -2,552 | -3,464 | -6,363 | -6,999 | -7,699 | -8,469 | -9,316 | |||
| Profit before | minimum tax and income tax expense | 6,279 | 47,047 | 61,559 | 32,341 | 42,655 | 51,208 | 61,796 | |
| Minimum | taxation | -36 | -61 | 0 | 0 | 0 | 0 | 0 | |
| Profit after | minimum tax | 6,242 | 46,986 | 61,559 | 32,341 | 42,655 | 51,208 | 61,796 | |
| Income tax | expense | 101 | -607 | -698 | 0 | 0 | 0 | 0 | |
| Profit for the | period | 6,343 | 46,379 | 60,860 | 32,341 | 42,655 | 51,208 | 61,796 | |
| Total comprehensive | income | 6,343 | 46,379 | 60,860 | 32,341 | 42,655 | 51,208 | 61,796 | |
| Return on | equity | 14.5% | 49.9% | 38.5% | 14.4% | 16.2% | 16.4% | 16.6% |
Note: Figures are in NGN millions.
3.9 Research questions on EMDE guarantee funds
This section returns to the research questions posed in the introduction on the experience of specialist, EMDE guarantee companies. From the above subsections, one may observe that EMDE guarantee companies adopt a wide range of different strategies. These vary according to:
• Whether guarantees are expressed in local-currencies or not.
• Whether the asset classes involved are infrastructure debt, SME lending or general corporate financing.
• Whether the guarantee activity is single- or multi-country.
• Whether the companies rely on an umbrella organisation providing common services or not.
When we include the two SMIs described in Section 3.6, ICIEC and ATIDI, the following additional dimensions of difference may be included.
• Whether the debt guaranteed includes sovereign exposure or is fully private in nature.
• Whether reinsurance or risk syndication is employed.
The primary constraints one may be concerned about are
1. The ratings and what this implies about the achievable leverage the guarantee company can sustain.
2. Cost levels may constrain the pricing that the guarantee company can employ and, hence, how competitive its guarantees are in the market.[36] The target rating should be consistent with a clear economic opportunity, i.e., a set of guarantee purchasers who will perceive the ratings uplift provided by the guarantee to be valuable to them.
Building a successful business in the medium term requires maintaining strict underwriting standards to establish a track-record supportive of reinsurance and risk syndication. A guarantee company can only tap the reinsurance market after establishing such a track-record. These lessons are visible in the experience of the monolines. The conclusion about track-record and reinsurance is evident from the experience of the two SMIs, ICIEC and ATIDI.
Before drawing more conclusions about the specialist guarantee companies, let us return to the questions posed in the introduction.
1. To what extent are the current suite of private and public guarantee instruments delivering on mobilisation at true scale for developing countries? The use of guarantees in development finance has been widely discussed the volume of guarantees extended by DFIs remains small. Figure 3.11 shows the volume of guarantees outstanding for a set of prominent DFIs as recorded in the latest accounts of each institution. Almost half of the total volume of guarantees is extended by the two US government agencies DFC and USAID. The recent dismantling of development activities by the US Federal government suggests these volumes will come under pressure.
Otherwise, IFC, IBRD, ADB, IDB and AfDB have significant volumes (more than USD 1 billion in each case) while IDB Invest, AFD, FMO and BII have smaller volumes. It is worth noting that many of these DFIs make significant use of commercial credit insurance and guarantees themselves in managing the risks on their own balance sheets. As shown above, the gross guarantee cover provided by ICIEC and ATIDI were USD 3.4 billion and USD 8.9 billion at the end of 2024.[37]
At the height of their success just prior to the GFC at end 2006, three monolines had guarantee books which each exceeded USD 300 billion. The specialist guarantee providers that are the subject of this study, such as AGF, CGIF, Dhamana, GuarantCo, InfraCredit, and InfraZamin, have a total volume of business that is in comparison very small, equalling a small handful of billions of USD. The comparison is in some sense ‘unfair’ in that the latter operate is much less developed and smaller financial markets.
The relevant question is, therefore, not whether the EMDE guarantee vehicles could emulate the scale of the monolines but instead if they could follow the examples of ICIEC and ATIDI in building leveraged and sustainable balance sheets with reasonable profitability on a scale approaching ten or more billion USD? Below, we reflect more on the steps necessary to achieve this.
2. What learnings have they delivered in relation to scale and contribution to market development? The guarantee companies have followed a wide range of different approaches. Success factors are: a. A focus on well-defined products for which demand is evident and other providers lacking (an example is AGF’s activity of providing portfolio SME loan guarantees to established banks). b. Adopting an appropriate business model (an example is InfraCredit’s approach of intermediating between local firms and pension funds to exploit a pricing gap and lengthen tenors) c. Building expert teams d. Incentivising staff
The key steps to success in achieving scale and contributing to market development from the various case studies and analyses we have examined are
1. product focus,
2. appropriate ratings,
3. a pricing strategy consistent with finding a sustainable demand for guarantee products without encouraging competition,
4. tight cost control that permits fine pricing,
5. experienced underwriting teams,
6. incentivising staff.
Some guarantee activities are intrinsically easier than others to support operationally and commercially. Project-finance-based infrastructure debt (issued by bankruptcy remote SPVs) has considerable complexity and, for effective underwriting, requires expertise of the level developed by the monolines. In EMDEs, much of infrastructure financing still has a strong ‘corporate infrastructure’ flavour to it in the sense that the investments are being made from the balance sheet of a business which has a set of operations already underway. Guarantees on SME portfolios from established banks are the easiest form of guarantee activity and is readily scalable. InfraCredit has so far largely provided corporate infrastructure guarantees although they are considering deals that are more Project Finance in character.
3. Reflecting on the suite of guarantees currently available from both policy-based and commercial providers in developing countries, what are the constraints and untapped opportunities to achieve those ends? There are two ecosystems of guarantee provision in EMDEs: entities that offering hard currency denominated guarantees and those that supply guarantees denominated in local currency. The first is dominated by DFIs such as those shown in Figure 3.13. The high ratings of these DFIs means that such hard currency guarantees dramatically raise the credit standing of EMDE debt issues. Investors that benefit from these guarantees are unlikely to pay much attention to the credit quality of the underlying debt. So one may doubt that guarantees of this type do much to encourage new engagement by developed market investors in EMDE debt markets.
The newly launched GGC is following the approach of issuing guarantees from a lower rated balance sheet. The return on the debt benefitting from these guarantees will have to be correspondingly higher since the guarantee will lead to less rating uplift. The investors in this debt will be receiving a lower quality final investment for which they will receive more than the minimal return from debt that in effect has the credit quality of the US or Dutch governments. Given the higher returns and the fact that a lower rating implies the need to monitor risk, these investors may be incentivised to engage more with their EMDE investments, which in the long run could lead to more sustainable financial flows from developed country investors.
One may also be concerned that hard currency guarantees encourage EMDE borrowers to load their balance sheets with hard currency debt. Interest rates on such debt are temptingly lower than those on local currency debt. The difference reflects the expected depreciation of the local currency so borrowers will not lose on average by borrowing locally (if markets offer this possibility). EMDE borrowers to the extent they are cash-strapped and have short horizons may prefer hard currency debt and associated guarantees even though their use may undermine the financial stability of their businesses by introducing currency risk.[38]
These various considerations provide the justification for the creation of local currency guarantee providers.[39] Such entities can boost investment financing while also generating significant local financial market development, the latter being a significant prerequisite if EMDEs are to make substantial economic progress.
4. What are suggested ways of using scarce public money to drive mobilisation at greater scale in developing countries?
Mobilisation using guarantees can be achieved directly by DFIs employing these instruments directly from their balance sheets. Mobilisation alone, however, is not the whole answer because such guarantees are relatively inefficient (being backed by AAA-rated balance sheets), contribute only to a limited extent to creating investor appetite for EMDE debt (as they are acquiring exposure to the DFIs themselves rather than to the EMDE borrower), and contribute to local financial market development but to a more limited extent that might be achieved via other means. Also, hard currency guarantees paired with similarly denominated debt issues may lead some EMDE borrowers (for which income flows do not track hard-currency denominated values such as commodity prices) to have sub-optimal exposure to currency fluctuations.
A higher quality mobilisation may be achieved by creating sustainable guarantee businesses in EMDEs and this may be scaled if these businesses maintain their profitability, which permits them to attract capital and make use of reinsurance or risk syndication. Crucial in building robust, commercially oriented businesses (even if they also have a development mandate) is containing costs and maintaining conservative underwriting standards. This requires building teams with strong credit analysis credentials and providing them and their senior management with appropriate incentives. Containing costs is easier if the operations are primarily located in EMDEs. Building expertise may be more challenging outside developed-country financial centres but is necessary if local knowledge is to be combined with prudent credit assessments. The disciplines of regulated insurance operations may have advantages in constructing stable businesses over more apparently flexible fund management forms of organisation, especially if the objective is to tap the reinsurance markets.
5. How could we seek to apply historic lessons and current practice from mainstream financial markets in developed markets, for example which exists in the publicly rated universe and activity in prominent international insurance centres (New York, London, etc) to developing countries?
The primary lessons of monoline experience relevant for specialist guarantee companies in EMDEs are:
(a) Opportunism in the sense of identifying products in which the monolines had clear comparative advantages.
(b) Focus on areas and activities that reinforce market position and make the business less contestable through activities like the controlling creditor monoline played in project-finance-oriented infrastructure deals.
(c) Team building in that expert underwriting groups were created to service these business lines.
(d) Prudent underwriting standards was emphasised to us by former monoline infrastructure team members (although this clearly was not effective in Structured Finance portfolios).
6. Identify drivers to breaking through constraints to replicating developed country successes in developing countries.
(a) The most important way in which one may break through constraints is by involving high quality senior managers with a focus on commercial success and a strategic understanding of what it takes to build sustainable guarantee business.
(b) Incentivising staff to deliver profitable outcomes.
(c) Adoption of an insurer business model could aid in creating a genuinely sustainable model.
(d) Securing shareholding from regional entities including potentially sovereigns would confer advantages through PCT or quasi-PCT.
7. What are the risks and limitations of using guarantees, and do guarantors have a long-term future or are they always confined to the ‘catalytic’ phase of market creation? As argued in the introduction, guarantees have a ‘division-of-labour’ aspect that permits a separation between the entity that provides the financing and the one that bears the credit risk. They are also able to support flexible and complex forms of risk transfer as evidenced by the operation of the reinsurance market. These factors mean that there is no reason why, if expertise is difficult for investors to build up, guarantee businesses should not remain as sustainable businesses over long periods.
Medium- and low-income countries in regions like Africa currently do not engage in bankruptcy remote project-finance-style financing even when revenue flows exist that could be attached to debt issues. At the same time, sovereigns and other entities have encumbered balance sheets. Guarantee companies that can build expertise comparable to what the monolines offered in developed markets could result in sustainable business. Connections to local sovereigns and other public authorities would be helpful in persuading reinsurers that, like ICIEC and ATIDI, defaulted claims would receive reasonable treatment in restructurings.
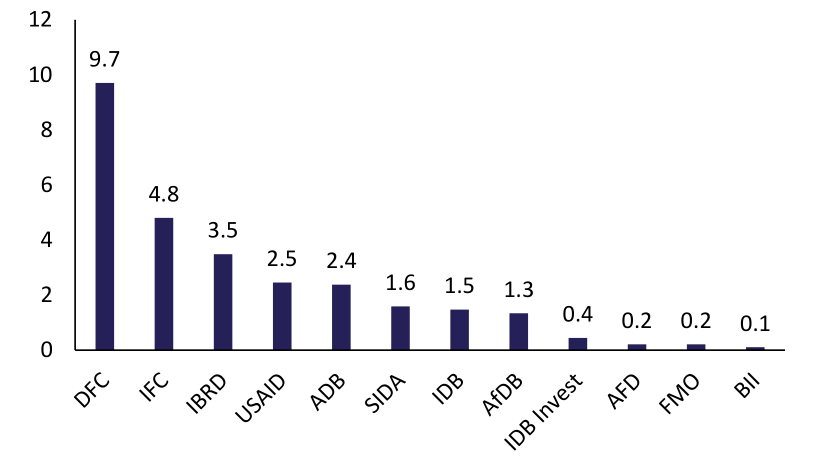
Note: Amounts are in USD billions. The data is based on the latest annual report from each institution as of 5 June 2025. Here, DFC denotes US International Development Finance Corporation, IFC denotes International Finance Corporation, IBRD denotes International Bank for Reconstruction and Development, USAID denotes United States Agency for International Development, IDB denotes Inter-American Development Bank, and, FMO denotes Nederlandse Financierings-Maatschappij voor Ontwikkelingslanden N.V. The guarantees provided by MDBs to each other through Exposure Exchange Agreements are omitted.
4. Conclusion
This study examines the role of monoline insurers in developed markets to draw lessons for specialist guarantee companies operating in EMDE countries. In recent years, donor country investors have established a number of such specialist companies with the objective of driving development in Africa and Asia.
Monoline credit insurers have a poor reputation because some collapsed after the 2007-2009 GFC. Though involvement in US mortgage-related structure finance exposures undermined the credit standing of the monolines, their profitable and constructive involvement in infrastructure and municipal bond guarantees could supply useful lessons for EMDE-focussed guarantee companies.
The primary audience for this study is donor-country policymakers but the analysis may also prove useful to those involved in running guarantee companies or non-governmental entities that may consider investing in the sector. The study builds on a set of interviews with monoline and development finance specialists, a review of the literature on the experience the monolines (especially in the municipal bond and infrastructure debt markets) and a series of technical assessments of the ratings and financial statements of one monoline and two EMDE guarantee companies.
To clarify thinking about the role and prospects of EMDE guarantee funds, we emphasise four aspects of developed market monolines:
1. Products
2. Business Models
3. Constraints
4. Culture
In the first of these aspects, products, monolines focussed on insurance lines through which their expertise in guarantee provision could add value. In the US municipal bond market, particular features of the US state and federal income tax systems created a role for the monolines. In the project finance bond market, opportunities arose when public authorities wished to issue debt without committing their own balance sheets in support of the issue and banks and investors lacked the specialist teams to evaluate the credit quality of the debt securities. The monolines played an important role in these transactions by acting as an actual or de facto controlling creditor, trusted by other debt holders to monitor and enforce covenants and operating conditions. In structured finance, the monolines supplied product offerings which other entities would have found it hard to replicate.
As regards business models, a clear description of its business line is provided in its investor communications by AG, a monoline that survived the crisis and which we examine at some length in this report. AG’s description places emphasis on its specific products, on contractual features of its guarantees that protect its liquidity position, on its underwriting and exposure monitoring approaches, its investment portfolio policies and the barriers to entry that partly shield it from competition. Implicit in this description is a view on how the elements of the firm’s financial statements behave.
In turn, such a perspective may be compared to the view of insurer business models provided by the Bank of England in the latter’s supervisory approach for insurers (which the Bank calls Business Model Analysis (BMA)). Former monoline staff whom we interviewed for this study emphasised other specific features within the monoline business model such as a focus on strict underwriting standards, close consideration paid to legal contracting, and the monitoring of exposures through such activities as the controlling creditor role (actual or de facto).
As regards constraints, guarantee companies must optimise their financial performance subject to a set of constraints, most notably the methodologies employed by the rating agencies in evaluating them and the rules imposed by regulators relating to capital adequacy and other aspects. These constraints may limit the degree of leverage that the guarantee companies can achieve and the value that their guarantees provide to investors in the guaranteed securities. Working within these constraints necessitates a careful financial analysis informed by the rating scorecards employed by the rating agencies.
On culture, monoline staff we interviewed emphasised their strong and conservative underwriting policies in municipals and infrastructure. The specialist teams build up by the monolines were dispersed to other market participants after the monoline sector franchise value was undercut by the GFC. These other market participants found other ways (primarily through debt fund solutions) to meet the needs of the ultimate borrowers. The negative outcome of the GFC for several monolines reflected weaknesses in the underwriting of structured exposures but monoline staff we interviewed emphasised that all but a few exposures even in that category performed well.
What prescriptions do the above points imply for donor-country decisionmakers considering whether to invest in specialist guarantee companies?
1. Choose the right product niches where guarantees add unique value. A narrow focus on products and the appetite that customers may have for them is essential. Products should have features that make them less contestable by competitors so that sustainable businesses can be built.
2. Design strong, scalable, economically sound business models. Coherent business model that employs capital effectively and offer possibilities of scalability, alleviating but also exploiting market inefficiencies, so that the enterprise is not simply a temporary solution to a short-term market failure. Note that the monolines were organised as insurers rather than guarantee companies, a business model that, although more complex than guarantors organised as funds or companies, offered the advantage of rigorous disciplines and natural channels to the reinsurance market.
3. Develop and maintain a thoughtful rating strategy, using reinsurance/syndication wisely. Thoughtful and coherent ratings (and depending on the business model adopted, regulatory) strategies are important. Those demanding guarantees from monolines required a high target rating of AA or higher. But, for purchasers of EMDE debt guarantees, a much lower rating may be perfectly acceptable. In either case, a coherent rating strategy is key to success. Ratings strategies should include consideration of tools to sustain ratings as the business develops. Unlike the monolines which largely retained risk on balance sheet, EMDE guarantee companies should find ways of using reinsurance/syndication and the network of brokers and intermediaries that accompany it. These latter contribute a valuable discipline, protecting guarantors from taking ill-advised risk.
4. Build a strong underwriting culture with rigorous expertise and cost control. Building expertise and controlling costs while suitably remunerating and incentivising key staff are key aspects of the businesses the monolines created. Controlling costs is important since the demand for guarantees is price elastic and businesses are only sustainable if they are prudent in this regard.
In suggesting issues that donor-country investors in guarantee companies should bear in mind, we focus on scalability and financial sustainability, omitting development impact. To do otherwise would take us too far afield and the experience of the monolines would suggest no lessons. Note that financial performance is not irrelevant for development impact since for many of the most prominent Development Finance Institutions (DFIs) (for example, the African Development Bank (AfDB) and the International Bank for Reconstruction and Development (IBRD)), the vast majority of current capital sustaining development activity consists of surpluses accumulated historically over multiple decades.
More broadly, one may consider how equity investment in guarantee companies compare to the broader blendedfinance toolkit that donor governments may deploy such as debt funds, securitisation platforms, first-loss instruments, etc. One may reduce the choice to one of maximising the feasible leverage the maximum underlying exposure that may be generated using a dollar of risk-bearing equity. Investment in securitisation platforms, firstloss instruments etc typically involve something resembling senior equity in MDBs. Since MDBs typically achieve leverage of 2 to 3, one might think that senior equity would generate leverage in this range. Most guarantee companies of the type considered in this paper also have low leverage levels, comparable to although some that have found ways of tapping the reinsurance market like ICIEC and ATIDI achieve distinctly higher leverage. Since there is execution risk in any newly created guarantee company, donors should probably consider investments in such entities within a diversified set of development-finance-motivated investments. To maximise the chance of success, the prescriptions listed above should, in our view be followed.
References
African Guarantee Fund (2024) “2023 Annual Report,” available at: https://africanguaranteefund.com/wpcontent/uploads/2024/08/AGF-Annual-Report-2023.pdf
Bandura, Romina and Sundar R. Ramanujan (2019) “Innovations in Guarantees for Development,” October, available at: https://www.csis.org/analysis/innovations-guarantees-development
Bergstresser, Daniel, Randolph Cohen, Siddharth Shenai (2015), “Skin in the game: The Performance of Insured and Uninsured Municipal Debt,” available at: https://ideas.repec.org/p/brd/wpaper/88.html
Bergstresser, Daniel, Randolph Cohen, Siddharth Shenai (2015), “Skin in the game: The Performance of Insured and Uninsured Municipal Debt,” available at: https://ideas.repec.org/p/brd/wpaper/88.html
Breckenridge, John, James Farquharson, Ruth Hendon (2014), “The role of business model analysis in the supervision of insurers,” available at: https://ideas.repec.org/a/boe/qbullt/0131.html
Chen, Fang, Jing-Zhi Huang, Zhenzhen Sun, and Tong Yu (2020) “Why do firms issue guaranteed bonds?” Journal of Banking & Finance 119, available at: https://papers.ssrn.com/sol3/Delivery.cfm?abstractid=2565602
Credit Guarantee and Investment Facility (2025a) “Independent auditors report and financial statements for the year ended 31 December 2024,” available at: https://www.cgif-abmi.org/storage/2025/05/FS-ADB-Credit- Guarantee-and-Investment-Facility-31-Dec-2024-Signed.pdf
Credit Guarantee and Investment Facility (2025b) “Ratings,” available at: https://www.cgifabmi.org/investors/ratings/
Cohen, Natalie R (2013) “Municipal Bond Insurance: Past, Present, and Future,” Municipal Finance Journal, available at: https://www.civicresearchinstitute.com
Cornaggia, Kimberly, John Hund, and Giang Nguyen (2022) “Investor attention and municipal bond returns,” Journal of Financial Markets 60: 100738.
Drake, Pamela Peterson and Faith R. Neale (2010) “Financial Guarantee Insurance and the Failures in Risk Management,” November, available at: https://papers.ssrn.com/sol3/Delivery.cfm/SSRN_ID1703602_code640325.pdf?abstractid=1703602
Encyclopedia (2025a) “AMBAC Financial Group, Inc.” International Directory of Company Histories. Available at: https://www.encyclopedia.com/books/politics-and-business-magazines/ambac-financial-group-inc
Encyclopedia (2025b) “MBIA Inc.” International Directory of Company Histories. Available at: https://www.encyclopedia.com/books/politics-and-business-magazines/mbia-inc
Fitch (2024) “Insurance Rating Criteria: Master Criteria,” March.
Fitch (2024) “Rating report, African Guarantee Fund for Small and Medium-sized Enterprises Ltd.,” available at: https://www.fitchratings.com/research/insurance/african-guarantee-fund-for-small-medium-sized-enterprisesltd-05-09-2024
Fitch (2025) “Fitch Affirms InfraCredit's IFS at 'BB-'; Outlook Stable,” available at: https://www.fitchratings.com/research/insurance/fitch-affirms-infracredit-ifs-at-bb-outlook-stable-24-06- 2025#:~:text=Fitch%20Ratings%20%2D%20Frankfurt%20am%20Main,'High%20Risk'%20guarantee%20portfo lio.
Gao, Haoya, Yuting Huang and Jingyuan Mo (2020) “Boosted Credit Ratings in China: The Effects of Credit Enhancement on Bond Pricing,” April, available at: https://dx.doi.org/10.2139/ssrn.3549270
Ibragimov, Rustam, Dwight Jaffee, and Johan Walden (2018) “Equilibrium with Monoline and Multiline Structures,” Review of Finance, Vol. 22, No. 2, 595–632, March, available at: https://doi.org/10.1093/rof/rfw073
InfraCredit (2025a) “Investor Report 2025Q2,” June, available at: https://infracredit.ng/update/wpcontent/uploads/2025/08/Q2-2025-Investor-Report.pdf
InfraCredit (2025b) “Unlocking Long Term Local Currency Infrastructure Finance in Nigeria, July Factsheet,” available at: https://infracredit.ng/update/wp-content/uploads/2025/07/July-Factsheet_NG_02-06-25.pdf
Jaffee, D. (2006) Monoline restrictions, with applications to mortgage insurance and title insurance, Review of Industrial Organization 28, 83–108.
Landoni, Mattia (2017) “Do taxes or information drive demand for bond insurance?”, available at: SSRN 3143160.
MBIA Inc., available at: https://www.mbia.com/index.html
MGIC Investment Corp., “AMBAC Financial Group, Inc. History,” available at: https://www.fundinguniverse.com/company-histories/ambac-financial-group-inc-history/
Moody’s (2024) “Assured Guaranty Inc: Update following merger with Assured Guaranty Municipal Corp.,” November, available at https://assuredguaranty.com/investor-information/by-company/assuredguaranty-ltd/ratings
Nanda, Vikram, and Rajdeep Singh (2004) “Bond insurance: What is special about munis?” The Journal of Finance 59(5), 2253-2280.
Pimbley, Joseph (2012) “Bond insurers,” Journal of Applied Finance (Formerly Financial Practice and Education) 22(1), available at: https://ssrn.com/abstract=268988
Pirinsky, Christo A., and Qinghai Wang (2011) “Market segmentation and the cost of capital in a domestic market: Evidence from municipal bonds,” Financial Management 40(2), 455-481.
Raczakacosi (2025) “Is Municipal Bond Insurance Worth the Cost? Your Ultimate 2025 Investor’s Guide,” Gov Capital, available at: https://gov.capital/is-municipal-bond-insurance-worth-the-cost-your-ultimate-2025investors-guide/
Shenai, Siddharth Bhaskar, Randolph B. Cohen, and Daniel Bergstresser (2010) “Financial guarantors and the 2007-2009 credit crisis,” In AFA 2011 Denver Meetings Paper.
Standard & Poor’s (2025) “Assured Guaranty Ltd.,” June, available at: https://assuredguaranty.com/investorinformation/by-company/assured-guaranty-ltd/ratings
Appendix 1: Monoline Factsheet
Table A1.1: Monoline Factsheet
AMBAC AG FSA MBIA
1971: Municipal Issuers Service Corp. (MISC) 1988: Capital Reinsurance Company began forms. operations as a financial guaranty reinsurer. 1973: Municipal Bond Insurance Association 1994: KRE Reinsurance Ltd. (Bermuda was created by its managing agency MISC. insurance company), commenced operations. 1995: Municipal Bond Investors Assurance 1971: as a subsidiary of MGIC Investment 1999: ACE Limited acquired Capital Re Corp. 1985: Formed and began operations as a Foundation/ Evolution Corporation changes its name to MBIA Corp 2003: ACE formed Assured Guaranty Ltd. financial guaranty insurer Insurance Corporation to reflect an expanded (AGL) as the holding company for its financial guarantee business and to project a insurance operating subsidiaries known as single, consistent image. AG, Assured Guaranty Re Ltd. (AG Re) and 2000: International joint venture between AGRO. MBIA and AMBAC restructured 2009: Acquired FSAH and FSA 2009: Established a separate US-only public 2015: Acquired Radian Asset Assurance Inc. 2010: Filed for bankruptcy. finance financial guarantee insurance to 2017: Acquired MBIA UK Insurance Ltd. 2013: Emerged with no debt. handle the safe muni bond business. and left 2018: Took over most of Syncora Guarantee ~ Now: Guarantee business in "run-off" status MBIA Insurance Corp. with toxic structured Post GFC Status Inc.'s insured portfolio 2009: Acquired by Assured Guaranty. since 2010; now focus on speciality property finance exposures. 2018: Merged AGUK, AGLN, and CIFGE and casualty (P&C) insurance via Everspan & 2017: MBIA UK was acquired by AG; MBIA Created Assured Guaranty UK Limited (AGUK) Cirrata National ceased bond insurance. 2024: Merged AGM into AG (August); AG is Now: In a run-off operation mode. now the sole operating entity $ 519 bn = 282 (Public) + 163 (Structured) + 74 359.6 bn (in 2007) = 253.2 (Public) + 106.4 2006 132.3 bn = 66.6 (Public) + 65.7 (Structured) 617.6 bn (International) (Other) MBIA Corp: 190.1 bn = 34.1 (Public) + 156 Amount $ 319 bn = 199 (Public) + 74 (Structured) + 46 2010 617.1 bn = 467.7 (Public) + 149.4 (Structured) n/a (Structured) Insured (International) National: 482.7 bn
2025 < $ 20 bn 261.6 bn = 250.4 (Public) + 11.2 (Structured) n/a 25.3 bn (National) + 2.3 bn (MBIA Corp)
AA (1974~1979)→AAA (1979~2007) → AA AAA (1974~2008) → AA- (2008) → A-
(2008) → A (2008) → BBB (2009) → CC (2009) AAA (1988) -> AA+ (2010) -> AA- (2011) -> AA (2008~2009) → BB (2009) → BB- (2010) → B- S&P AAA (1985~2008) → AA+ (2009) → SD (2009) → CC(2009) → R (2010) → NR (2014~Now) (2011~2013) → BBB (2013~2014) → A-
(2010) (2014~2017) → BBB (2017~2018) → NR (2018)
Credit rating Aa1 (2007) → Aaa(2007~2008) → Aa2 Aaa (~2007) → Baa1 (2008) → Ba1 Aaa (1987~2007) → Aa3 (2008) → Baa1 (2008) Aaa (1987~1998) → WR (1998) → Aaa evolution (2008~2009) → Aa3 (2009~2012) → A3 (2009~2011) → Ba3 (2011~2012) → B2 (2012) Moody's → Ba3 (2009) → Caa2 (2009~2010) → WR (1998~2008) → Aa3 (2008~2009) → A2 (2013) (2013~2022) → A2 (2022~2024) → A1 → Caa1 (2012) → B3 (2013) → Ba1
(2011) → NR (2013~Now) (2024~Now) (2014~2018) → Ba3 (2018~Now)
Fitch: AAA (2000~2007) → AA (2008) → WD AAA (1998~2008) → AA (2009) → AA+ (2009) Fitch AAA (1999~2007) → AA (2008) → A (2008) →
(2008) → AA (2009) → NR (2010~Now) NR (2008)
Appendix 2: Business Model Analysis Applied to Insurers
The UK’s PRA characterises a generic insurer business model as shown in Figure A2.1. The PRA uses BMA as a key part of its supervisory approach. This involves assessing the activities in a holistic way, considering whether a company’s business model could generate instability.
Figure A2.1: UK Prudential Regulatory Authority Insurer Business Model
Panel a) Stylised insurer balance sheet Panel b) Simplified cash-flow diagram
Note: The source is Breckenridge, Farquharson and Hendon (2014) which explains that: “At the end of each accounting period, ‘retained earnings’ are equal to the remainder of cash inflows (premiums plus investment income) net of outflows (claims and expenses; and dividends). Retained earnings feed back into the stock of capital — so in Figure a), would be represented by an increase in the size of the balance sheet that reflects higher cash on the asset side and higher capital on the liabilities side.”
Figure A2.2: AG Q1 2025 Investor Report Excerpt Panel a) Insurance cover, monitoring and premiums Panel b) Investments, payouts & entry barriers
Breckenridge, Farquharson and Hendon (2014) explain the PRA’s approach at a high level, arguing: “BMA helps the PRA to understand the sources of a firm’s profits, and what might happen in the future to threaten these profits. To identify risks to a firm’s profitability, the PRA needs to understand the company’s overall strategy. This may be, for example, to increase volumes or to sell higher-margin products. Risks can also arise from competitors, so there is a need to be aware of prevailing conditions in the markets where a firm operates — including any barriers to entry to insurance markets. As risks can also emerge from changes to the social and broader macroeconomic environment, BMA helps to assess the impact of potential changes to consumer preferences or demand for certain products. Similarly, BMA can be used to identify any legislative or regulatory changes that may impact an insurer’s business.”
AG describes its own Business Model as shown in Panel a) of Figure A2.2 emphasises key features of the business model, namely the risks insured and what cover is provided, how the risks and monitored and how premiums are earned. Panel b) of the figure deals with the investment side of the insurer, how losses are assessed and what are the barriers to entry.
Appendix 3: S&P’s Rating Analysis for AG
Analysis of AG’s Moody’s rating is presented in Section 2.6. AG is also rated by S&P. The agency employs for this purpose its Insurers Rating Methodology (Standard & Poor’s (2025)) which is summarised in Figure A3.1. In June 2025, AG was rated AA by the agency using year-end 2024 data. See Table A3.1.
AG was assigned Very Strong Business Profile and a Very Strong Financial Risk Profile. The company's capital adequacy exceeded the 1x threshold required for an “Excellent” rating. S&P indicates that the capital adequacy buffer is expected to decrease over the coming years. However, it is not completely clear what is the exact current level of the capital adequacy.
Figure A3.1: S&P’s Insurance Methodology
Table A3.1: AG’s S&P’s Rating Scores
The capital adequacy is computed as Ending capital plus projected paid and incurred losses plus loss reserves over projected and incurred losses. To assess the potential losses within the guarantee portfolio, S&P applies capital charges based on the credit ratings of the bonds and classification categories determined by the relevant sector. Therefore, for the purpose of our analysis, the increases of the par insured amount would directly increase the capital adequacy ratio. The implied ratings for different levels of capital adequacy are displayed in Table A3.2.
Table A3.2: Implied S&P’s Ratings Given Capital Adequacy for AG
Capital and Financial Risk Issuer Capital adequacy Earnings Profile Rating
≥1 x Excellent Very strong AA
≥0.9x, <1 x Very strong Strong AA-
≥0.8x, <0.9x Strong Satisfactory A+
≥0.6x, <0.8x Satisfactory Fair A-
≥0.45x, <0.6x Fair Marginal BBB
≥0.25x, <0.45x Marginal Weak BB+
Vulnerable ≥RC*, <0.25x Weak B+
Vulnerable <RC*, <0.25x Vulnerable B+ Note: RC denotes the minimum regulatory capital requirements.
Appendix 4: Shadow Fitch Rating for AG
This appendix presents analysis of a shadow Fitch rating of AG. Fitch is the primary rating agency for the EMDE guarantee companies we study and it is, hence, of interest to examine how the agency might evaluate AG. Table A4.1 shows a shadow rating using AG’s latest public financial statement data.
Table A4.1: Approximated Fitch Rating for AG
Factor Score
Industry Profile & Operating Env ironment (IPOE) aa+ to a-
Company Profile a-
Capitalization & Lev erage aa-
Debt Serv ice & Financial Flexibility aa-
Financial Performance & Earnings bbb
Inv estment & Asset Risk bb
Asset/Liability & Liquidity Management aaa
Reserv e Adequacy a
Reinsurance / Risk Mitigation / Catastrophe a
Insurer Financial Strength Rating (IFS) – Preliminary a
Ownership 0
Insurer Financial Strength Rating (IFS) A Note: Approximation based on the 2024 financial statements of AG and the Fitch’s Insurance criteria (Fitch (2024)).
Like the Moody’s rating, the projected financial statements have an impact both in the capitalisation and the financial performance of the company. The projected Fitch Insurer ratings are shown in Table A4.2.
Table A4.2: Fitch’s Rating Evolution for Each Scenario
Metric 2024 2025 2026 2027 2028 2029 2030 2031 2032 2033 2034
Base A A A A A A A A A A A
Growth (+10) A A A A A A+ A+ A+ A+ A+ A+
Growth (-10) A A A A A A A A- A- A- A
Price (+5%) A A A A A A A+ A+ A+ A+ A+
Price (-5%) A A A A A A A A A- A- A-
Table A4.3: Headroom Analysis for Shadow Fitch Rating for AG
Reinsurance Debt Serv ice Financial Asset/Liabilit Company Capitalization Inv estment Reserv e / Risk IFS – Growth IPOE & Financial Performance y & Liquidity Ownership IFS Profile & Lev erage & Asset Risk Adequacy Mitigation / Preliminary Flexibility & Earnings Management Catastrophe
0% aa+ to a- a- aa- aa- bbb bb aaa a a a 0 A 47 % aa+ to a- a- a aa- bbb bb aaa a a a 0 A 153% aa+ to a- a- bbb+ aa- bbb bb aaa a a a- 0 A- 249% aa+ to a- a- bbb- aa- bbb bb aaa a a a- 0 A- 47 6% aa+ to a- a- bb+ aa- bbb bb aaa a a a- 0 A-
Risk Control 8 Golden Square London W1F 9HY +44 (0)20 3307 0730 www.riskcontrollimited.com
Notes
[1] A local currency denominated guarantee creates exchange rate risk for a hard-currency focussed guarantee provider but much less than that associated with a local currency-denominated l0an or a bond since only the premia and the payout in the event of a claim are subject to currency fluctuations.
[2] For example, insurers may be able to provide credit protection with greater leverage under Solvency II or US insurer capital requirements than can a bank subject to Basel regulations.
[3] Some staff of major development banks with whom we spoke questioned why one would not simply run guarantee books off their balance sheets or, better yet, employ loan financing their institutions can provide. The latter point reflects the view that funding backed by a guarantee involves a debt issue by a party less skilled at raising debt financing than a large MDB. An aspect omitted from this view is that the development of local market may be advanced by debt issues by local entities, initially supported by guarantees and then subsequently by entities developing their own debt issuance.
[4] Academic studies have examined rationales for the existence and efficiency of monoline versus multiline insurers, see Ibragimov, Jaffee, and Walden (2018) and the papers they cite. The argument is that, when capital is costly, the obvious benefits of diversification may be more than offset by the distortion that arises by pricing insurance off the same balance sheet (i.e., in our terms, having the same target rating).
[5] Other examples are the networks of public guarantee companies established in some countries, supporting banks that are lending to SMEs).
[6] Of these, Dhamana and the GGC are newly established and, hence, so far, have no track record.
[7] IFFEd provides guarantees to MDBs on projects related to education, having received itself equity, guarantees, and grant contributions from governments including those of the UK, Sweden, and Korea. IFFEd’s contributions permit MDBs to make discounted loans for educational purposes. Beneficiary governments are often reluctant to borrow for educational projects (since no direct revenue is generated to pay for loan repayments) so IFFEd’s contributions have generated activity that would not otherwise have occurred.
[8] Jaffee (2006) explains that while there is some variation across US states in monoline insurance laws, most are consistent with a model law proposed by the National Association of Insurance Commissioners (NAIC).
[9] AMBAC was at the time named the Mortgage Guaranty Insurance Corporation (MGIC) Investment Corporation and was a subsidiary of the MGIC Investment Corporation.
[10] They argue that insured municipal bonds exhibit better transition behaviour than bonds that are merely rated by rating agencies.
[11] When the instrument to be guaranteed lacks a public rating, a monoline will sometimes accept a private credit or shadow rating.
[12] Such restrictions would never be accepted by a corporate raising financing for investment.
[13] Reportedly, some AG were also suspicious toward Moody’s and S&P’s risk models.
[14] Such policies were applied by other monolines and were not particular to AG, however.
[15] One specialist, consulted as part of this research, argued that the monolines’ experience underlines the importance of “specialism”. Guarantors should fully understand the risks of a specific asset class to the point that they are able to better distinguish between actual and perceived risks than a generalist investor. This informational advantage allows the guarantor to mobilise the investor while also generating a return for itself. If guarantors work with new assets classes, they may end up relying on third parties (e.g., rating agencies) in an ill-advised manner.
[17] The algorithm implemented here may be summarised as follows: 1. The model begins with assumptions regarding the Gross Par Written for the upcoming year. Based on this, and using assumptions on the premium rate, the GWP is estimated. 2. The Net Par Outstanding for the following year is calculated by taking the previous year’s figure, adding the new Gross Par Written, and subtracting the portion of exposures expected to mature during the year. 3. From the Gross Premium Written, the model derives the Net Premium Earned (income), Premium Receivables (asset), and Unearned Premium Reserve (liability). 4. Based on the updated Net Par Outstanding, Loss and Loss Adjustment Expenses (LAE) are estimated using average loss rates observed over the past five years. 5. Other components of income and expenses that are not linked to premiums or loss reserves are projected to follow trends consistent with the past five years, incorporating a standard deviation to ensure a realistic behaviour. 6. Net income is calculated from income and expenses, and this is added to Shareholders’ Equity. Dividends, assumed to reflect the five-year historical average, are then deducted from Shareholders’ Equity. 7. Finally, total assets are adjusted to balance liabilities and equity. These adjustments are applied solely to other assets, excluding Premium Receivables, which are determined by the volume of underwriting.
[18] The rating shown in Table 2.1 was assigned using data for the year-end 2023 financial results. The ratios and results presented below are calculated using the latest financial results of AG.
[19] A former head of infrastructure guarantees for a major monoline suggested that new market entry should consider the factors including (i) political and contractual stability, (ii) sovereign underpinning, (iii) governance risk and (iv) the feasibility of constructing significant pipelines. Another former monoline manager said that he believed that guarantees could play a crucial role in the emerging markets by providing initial credibility and risk mitigation to crowd in private capital.
[20] A former monoline staff member emphasised that the real constraints to monolines come from rating agency capital models rather than regulatory capital requirements.
[21] A former monoline manager emphasised to us that in the PPP/PFI model, monolines were not only just credit insurers, but also long-term project stewards. Where monolines were successful, this was to strong legal enforceability. The strengths of monolines include (i) credit enhancement, (ii) structuring discipline and (iii) active surveillance.
[22] Established in 2002.
[23] A PIDG entity (InfraCo Africa) currently holds less than 5% of InfraCredit's common equity. InfraCredit also recently converted to public limited company status, listed on the NASD OTC Securities Exchange in Nigeria.
[24] PIDG acts as an umbrella for other companies not involved in providing guarantees, namely the private debt fund, the Emerging Africa Infrastructure Fund.
[25] Measured in local currency, InfraCredit’s capital base has, thus, risen relative to its guaranteed exposure.
[26] The fact that guarantees are denominated in local currency means that the USD volume of existing transactions is subject to a negative drift as EMDE currencies tend to depreciate against the dollar.
[27] It has some portfolio guarantees covering SME-loan portfolios, but unlike for AGF, these are not its core business.
[28] See https://www.oecd.org/en/topics/sub-issues/oda-eligibility-and-conditions/dac-list-of-oda-recipients.html
[29] It also has a standby credit facility provided by Standard Chartered Bank.
[30] CGIF has a geographically specific remit in Asia and focuses on corporate bonds; the Green Guarantee Company is primarily hard-currency focused; and AGF concentrates on SME-related guarantees, which GuarantCo deliberately avoids.
[31] InfraCredit is also exploring regional expansion in Ghana and Ethiopia (see https://www.ghanaweb.com/GhanaHomePage/business/Ghana-to-establish-infrastructure-credit-guarantee-scheme-
[2001538] and https://www.stockmarket.et/ethiopia-taps-nigerias-infracredit-to-build-first-credit-guarantee-facility/).
[32] Large scale infrastructure deals, to the extent they occur in DAC 1-3 countries, are mostly financed by bilateral or multilateral DFIs with subsidised hard-currency debt.
[33] In contrast, InfraZamin, established in Pakistan following the model of InfraCredit, converted its funding into local currency denominated assets which meant that the value of donor investments was reduced when, shortly after its launch, the Pakistan rupee (denoted PKR) was devalued.
[34] The increase in the financial leverage ratio (defined as Debt plus the Debt Component of Hybrids over Equity Capital plus Debt and Total Hybrids) is modelled on the assumption that the institution maintains its current liquidity position, which Fitch assesses as Strong. As the volume of par guarantees rises, the institution is required to hold higher levels of financial guarantee liabilities, necessitating a corresponding increase in liquid assets. This expansion in liquid assets is subsequently offset through higher levels of debt issuance. Using data from the last four years, it was estimated that USD 1 of new par guaranteed corresponds to USD 0.0482 of new financial guarantee liabilities.
[35] As of end of 2024, 86.6% of the assets, 84.4% of liabilities and 100% of the equity are denominated in USD.
[36] Cost levels are clearly important for the success of a guarantor. It would be interesting to analyse how different cost structures from the set of guarantee funds examined in this study perform. The information necessary to perform such a review has not been available to us but could be examined in future research on DFI business models.
[37] One might wonder why we do not mention here the guarantee business of the World Bank’s insurance entity Multilateral Investment Guarantee Agency (MIGA). This latter organisation had USD 31.5 billion of insurance cover outstanding at the end of 2024. While MIGA has started to provide insurance for trade and credit exposure, the great bulk of its business is traditional Political Risk Insurance (PRI). Such cover for the combinations of the standard PRI perils of Expropriation, Breach of Contract, Convertibility and War and Civil Disorder is very low risk and to some extent meets technical and regulatory needs.
[38] Some EMDE borrowers may prefer to borrow in hard currencies since their income flows are related to commodity prices and this may create roles for guarantee companies specialised in hard currency guarantees. A further consideration is that local markets may simply be too shallow to generate the volumes of financing that EMDE borrowers require.
[39] The case would be weakened if MDBs were able to engage themselves in local currency lending, based on building up local liquidity pools. But for the moment, few MDB have made significant progress in this direction. Metric 2024 Score Business Risk Profile Very strong Competitiv e Position Very strong IICRA Low Financial Risk Profile Very strong Capital and Earnings Excellent Risk Exposure Moderately high Funding Structure Neutral Anchor aa Gov ernance Neutral Liquidity Exceptional Comparable Ratings Analy sis 0 Stand Alone Rating aa Issuer Rating AA Note: Source Standard & Poor’s (2025).