

This document reports capital adequacy benchmarking for a set of nine prominent Multilateral Development Banks (MDBs). The project has been completed by Risk Control with sponsorship from the MDB Challenge Fund.
Executive Summary
This document reports capital adequacy benchmarking for a set of nine prominent Multilateral Development Banks (MDBs). The project has been completed by Risk Control with sponsorship from the MDB Challenge Fund.
The MDB Challenge Fund’s objectives are to assist MDBs in their efforts to implement the recommendations of the Independent Panel on MDB Capital Adequacy Frameworks (henceforth, ‘the CAF Panel’). The Panel published an influential report in 2022 (see CAF Panel (2022)) proposing how MDBs could expand lending by managing their balance sheets differently.
Recommendation 5 of the CAF Panel was that MDB shareholders generate regular MDB benchmarking exercises to enhance the governance of these institutions. If shareholders better understand the MDBs they own, the banks are likely to use their capital more efficiently, and the shareholders themselves will be able to provide more targeted support.
Specifically, the Panel advocates: “a regular capital benchmarking report that presents MDB capital adequacy frameworks in a standardized format and with consistent definitions and metrics.” Here, one may distinguish between (i) benchmarking capital adequacy and (ii) benchmarking capital adequacy frameworks.
Capital adequacy frameworks consist of the organisational arrangements through which banks manage their capital. These arrangements include such elements as the definition and level of country limits operated by the MDB, how they determine both the risk appetite and the primary risk metrics they use. The CAF Panel report already included the summary of descriptive information on such arrangements.
In addition, benchmarking may provide measures, computed on a consistent basis, of the balance sheet risk of multiple MDBs. The interest of these is to permit shareholders to understand how MDBs vary in the extent to which they need additional capital to achieve their objectives.
This project aims to provide benchmarking of capital adequacy rather than frameworks. For this purpose:
• We devise and calibrate a consistent, canonical, Economic Capital (EC)-based methodology for assessing MDB capital adequacy. The methodology implies an amount of required capital for a given target confidence level. Using this measure, one may compute a Capital Adequacy Ratio (CAR) equal to capital resources divided by capital required.
• We apply the methodology we develop to a set of MDBs using publicly available data and compare the results with other measures of MDB capital adequacy, including Basel and rating agency metrics.
Since our measures for individual MDBs are computed using a standard methodology, measures may be more informative for shareholders than risk metrics generated by the banks themselves. The latter are based on techniques that vary considerably across the banks. It is much easier, therefore, to ‘read across’ and compare calculations among banks.
One may argue that comparable data on the risk profile of different MDBs is already available as most major MDBs are rated by all three global rating agencies: Standard & Poor’s, Moody’s, and Fitch. However, the methodologies applied by the three agencies are inconsistent, and are not very closely aligned with how Basel regulators, commercial banks, or the MDBs themselves assess capital adequacy.
The benchmarking performed by Risk Control provides a ‘snapshot’ of the capital adequacy of MDBs at the end of 2022. In the future, shareholders may wish to perform more dynamic benchmarking to assess how much progress MDBs have made in implementing the CAF Panel recommendations. For example, for a risk transfer deals program, the shareholders may want to understand the capital savings generated and the additional lending headroom created. The models generated by the project could be used for this purpose, but the project itself does not attempt to deliver such assessments.
The aims of the current draft are as follows:
1. To explain what can be achieved by benchmarking.
2. To exposit at a high level the financial profile of the nine MDBs in our sample.
3. To set out what Basel and rating agency methods suggest for an initial narrower group of 4 MDBs.
4. To describe and justify a capital adequacy methodology that can be applied to all 9 institutions
5. To present the results of that analysis for the nine MDBs.
Table ES1: Implied CARs at 99.99% Confidence Level
Risk
Basel S&P's Fitch's Control 1-
CAR RAC FRA Year CAR
ADB 7.4 1.4 1.7 2.8
AfDB 4.3 1.2 1.5 3.1
CAF 6.3 0.8 1.4 2.6
CEB 5.4 1.2 1.1 2.0
EBRD 2.9 1.3 1.3 2.7
IBRD 4.4 1.1 1.5 2.2
IDB 5.4 1.0 1.5 2.1
IDB Invest 3.3 1.5 1.3 2.8
NDB 10.6 1.1 2.5 3.3 Note: Here, the Basel-implied CAR is based on the Internal Ratings Based (IRB) formula with a confidence level of 99.99%. Standard & Poor’s RAC implied CAR is obtained by dividing the RAC ratio by 23%. This makes the denominator of the ratio equivalent to Economic Capital (EC) with a 99.99% confidence level. The Fitch-Usable Capital-to-Risk-Weighted-Assets-Ratio (FRA) implied CAR is obtained by dividing the FRA ratio by 35%, which yields a ratio in which the denominator is equivalent to EC for a AAA rated. The Risk Control’s CAR is based on the economic capital required at 99.99% confidence level.
Table ES2: Pearson Correlation of MDB Capital Adequacy Metrics
Basel Basel Moody's Fitch's
CAR 1-yr CAR 3-yr CAR CAR 1-yr CAR 3-yr CAR S&P's Leverage Equity to
w/o PCT w/o PCT w/o PCT with PCT with PCT with PCT RAC Ratio RWA
CAR 1-yr
w/o PCT 1.00 1.00 0.38 0.46 0.69 -0.34 0.63 0.54 -0.09
CAR 3-yr
w/o PCT 1.00 1.00 0.36 0.46 0.69 -0.35 0.60 0.56 -0.10
Basel
CAR
w/o PCT 0.38 0.36 1.00 0.67 0.59 0.71 0.23 0.53 0.76
CAR 1-yr
with PCT 0.46 0.46 0.67 1.00 0.95 0.37 0.31 0.82 0.62
CAR 3-yr
with PCT 0.69 0.69 0.59 0.95 1.00 0.13 0.44 0.87 0.44
Basel
CAR
with PCT -0.34 -0.35 0.71 0.37 0.13 1.00 -0.26 0.24 0.86
S&P's
RAC 0.63 0.60 0.23 0.31 0.44 -0.26 1.00 0.09 -0.08
Moody's
Leverage
Ratio 0.54 0.56 0.53 0.82 0.87 0.24 0.09 1.00 0.52
Fitch's
Equity to
RWA -0.09 -0.10 0.76 0.62 0.44 0.86 -0.08 0.52 1.00 Note: The CAR is calculated using a constant idiosyncratic factor of 75%. The correlations for the ‘Moody’s Leverage Ratio’ are multiplied by a factor negative one. The highlighted row demonstrates the correlation of relevant prudent CAR measures for the MDB with other capital adequacy metrics. Here, w/o denotes without. See note for Table ES1 for Basel CAR.
Our findings are as follows. For the group of nine MDBs, we find that CARs implied by the canonical EC methodology are substantial, being no less than 200% even when a high confidence level of 99.99% is employed. The high CAR statistics reflect the Preferred Creditor Treatment (PCT) that the MDBs enjoy in their sovereign lending and the conservative nature of their lending to non-sovereigns. In calibrating the Probabilities of Default (PDs) and the Loss Given Default (LGD) rates employed in the calculations, we draw on earlier studies Risk Control (2022), Risk Control (2024a), and Risk Control (2024b). Moreover, we examine the information provided by the MDBs in their public financial statements and risk reports.
We compare the CARs implied by the methodology with capital ratios obtained using Basel and rating agency methodologies (see Table ES1). Here, we find that, even when the calculations are performed using a ‘triple-A’ confidence level of 99.99%, the Basel-implied CAR ratios exceed 2.9 for all nine banks. The CAR ratios implied by the Standard & Poor’s Risk Adjusted Capital (RAC) ratio and the Fitch Usable Capital to Risk Weighted Assets (FRA) ratio (in both cases at a 99.99% confidence level) are much lower, ranging from 0.8 to 1.5 for Standard & Poor’s and 1.1 to 2.5 for Fitch.
We compute the correlations across nine banks of the different CAR ratios and the Moody’s leverage ratio (see Table ES2). It is noticeable that the CARs calculated by Risk Control have relatively higher correlation with the Basel-implied CAR but lower correlation with the Standard & Poor’s RAC-implied CAR The CPM-based CAR is also strongly correlated with the Moody’s leverage ratio, which is surprising given the non-risk-sensitive nature of the latter. The Standard & Poor’s RAC implied CAR has very low correlation with the Moody’s leverage ratio and is negatively correlated with the FRA ratio of Fitch.
1. Introduction
This report develops and implements capital adequacy benchmarks for Multilateral Development Banks (MDBs). Such benchmarking is recommended by the report of the Independent Panel commissioned in 2021 by the Italian Presidency of the G20 to review the Capital Adequacy Frameworks (CAFs) of MDBs. The Panel’s report (see CAF Panel (2022)) makes five steps suggestions that MDB could take to boost their lending. Of these, the fifth advocates that MDBs and shareholders institute regular benchmarking of the risk profile of MDBs.
In the Panel’s view, such benchmarking would improve MDB governance by giving shareholders consistent and systematic information MDB risk profiles. Some non-borrower shareholders in major regional MDBs and World Bank institutions have shareholdings in multiple institutions and are naturally interested in comparing the capital needs of different banks. The overlap of borrower shareholders across regional MDBs is less, but these shareholders would also like to understand the risk profiles of the MDBs to which they contribute capital and which serve their regions.
This document (i) explains the capital adequacy methodology developed by Risk Control, applicable to MDBs and (ii) presents capital benchmarking calculations for nine MDBs. These nine consist of Asian Development Bank (ADB), African Development Bank (AfDB), Development Bank of Latin America and the Caribbean (CAF), Council of Europe Development Bank (CEB), European Bank for Reconstruction and Development (EBRD), Inter-American Development Bank (IDB), IDB Invest, International Bank for Reconstruction and Development (IBRD) and New Development Bank (NDB).
The benchmarking methodology relies on consistently and transparently computed risk measures including measures of:
1. Economic Capital (EC)
2. Basel capital
3. Capital adequacy as viewed by rating agencies
The EC calculations are performed under different assumptions. These include (i) different confidence levels and risk horizons, (ii) risk parameters that allow for PCT or not, (iii) assumptions LGDs with and without volatility, and (iv) under different correlation assumptions. The EC calculations are broken down by subportfolio Sovereign Obligor (SO) and Non-Sovereign Obligor (NSO), high-income, medium-income and lowincome countries and by risk category (credit, operational and market risk), and with computation of concentration risk effects.
The Basel capital calculations rely on the Internal Ratings Based Approach (IRBA) and, again, yield computations under different assumptions about (i) confidence levels, (ii) allowing for PCT and not, and (iii) with down-turn LGD assumptions.
As well as EC calculations, the benchmarking includes the primary capital adequacy metrics employed by the rating agencies. These include the Standard & Poor’s Risk Adjusted Capital (RAC) ratio with adjustments for PCT and concentration risk, the Moody’s Leverage Ratio, and the Fitch Usable Capital to Risk Weighted Assets ratio.
We implement the benchmarking methodology just described using public data for nine MDBs taken from their end-Financial Year 2022 financial statements.
One may compare the MDB benchmarking here developed to the Pillar 3 reporting that Basel regulators require of commercial banks. Basel rules oblige commercial banks to publish aggregate and semi-aggregate risk measures for their assets, liquidity measures and such information as the capital-ratio trigger levels at which their national regulators will restrict dividend payment.
The primary motivation for Pillar 3 as stated by regulators is to contribute to the ‘market discipline’ that banks face, i.e., to assist investors in bank liabilities to evaluate in understanding the banks’ risk profiles. Regulators believe that investors will reflect their risk assessment in the terms on which they provide financing and, hence, banks will be motivates to limit the risk they take on.
The motivation for Pillar 3 is very different from that for MDB benchmarking (MDB shareholders certainly do not want the pricing terms of MDB bond issues to provide discipline if an MDB’s risk profile worsens). But the principles established by the Basel Committee may serve as helpful guides in designing MDB benchmarking. Also, the idea of influencing external parties’ views of banks by publishing information inducing them to take some action is a point in common. Providing a clear understanding of capital adequacy across MDBs may help influence ratings agencies to review their approaches to assessing MDBs and persuade bond market investors to supply financing to MDBs on favourable terms.
The remainder of this study is organised as follows: Section 2 sets out principles for MDB benchmarking, drawing on the discussion provided by the CAF Panel report as well as Basel guidelines and standards documents. Section 3 supplies risk profiles for a set of 20 MDBs, consisting of basic financial ratios. Section 4 presents the methodologies employed including EC measures, the Basel IRBA, and the approaches of the three rating agencies. Section 5 provides results for nine MDBs. Section 6 concludes.
2. Principles for MDB Benchmarking
2.1 Introduction
This section explains the motivation for the approach we take to MDB benchmarking. The CAF Panel recommendations are discussed in detail. Note that the Panel’s conception of benchmarking is broader than what we aim to accomplish in this project. Our objective aligns closely with a specific part of the Panel’s recommendation on benchmarking, namely that measures of capital adequacy be provided on a comparable basis for MDBs in general.
Our approach, based on canonical approaches to assessing Economic Capital (EC) meets many sensible principles that one might wish to require of a transparency exercise undertaken on behalf of a group of banks. We show this by setting out guidelines established by the Basel Committee in the form of principles for commercial banks’ Pillar 3 disclosures. We briefly explain in this section how our approach relates to these principles but will return to this topic below after expositing methodologies and performing and reporting calculations for a group of MDBs.
2.2 CAF Panel Recommendations on MDB Benchmarking
The July 2022 report of the G20 Independent Panel on MDB Capital Adequacy Frameworks (CAF) proposes that MDBs and their shareholders generate benchmark comparisons of the capital needs and risks of MDBs. Specifically, the Panel’s recommendation 5b proposes that MDB shareholders should: “Prepare regular capital benchmarking reports on each MDB’s capital adequacy framework in a comparable format employing harmonized definitions and support regular MDB reviews of capital resources.”
The Panel, furthermore, states that: “Well-designed capital adequacy frameworks and related policies and procedures have a number of important components […]. Their key elements and drivers should be accessible to shareholders and other stakeholders in a manner that is readily understandable and that allows comparison across institutions. In the Panel’s view, this would be best addressed with a regular capital benchmarking report that presents MDB capital adequacy frameworks in a standardized format and with consistent definitions and metrics. This would address an important gap in MDB’s governance toolkit on financial policy, and support shareholder decision-making at a time when there are considerable expectations for MDBs to scale up and deliver on the Sustainable Development Goals (SDGs) and climate goals. Given the rapid developments in the global economy such a report would best be prepared annually, though the exact frequency would need to be considered by shareholders. Shareholders may wish to consider combining regular capital adequacy reporting with the reporting mandates already in place on MDB balance sheet optimization, due to the close relation of these issues.”
Furthermore, the Panel proposes: “Such a report could build on the benchmarking methodology and tables in the [Panel report itself] but should go a step further by harmonizing nomenclature and concepts and mapping methodologies across the MDBs to flag where they have commonalities and where they differ. In particular, it should provide a comparable risk adjusted capital indicator across MDBs and describe its components and their methodologies. [Here, the italic formatting is inserted by Risk Control.] The aim should be to i) better support capital and headroom comparisons for regular operations as well as countercyclical buffers and ii) give comfort to shareholders that these concepts are broadly aligned across institutions (see Recommendation 5c).”
The Panel report addresses these recommendations of action to shareholders rather than to the MDBs themselves (see Table 4.1 G20 CAF Panel (2022) page 53) although implementing the proposal would require participation and support from MDBs.
The objective of Risk Control’s benchmarking project for the MDB Challenge Fund is to devise and implement a common methodology meeting the requirements of the italicised text in the above paragraph. Note that the project does not aim to contribute on two other elements of MDB capital adequacy benchmarking. Specifically, we do not document the internal arrangements, processes, and tools that form parts of MDB CAFs. This documentation would require significant cooperation by MDBs themselves.
Nor do we attempt to monitor the progress that MDBs make in adopting the recommendations of the CAF Panel Report. Ideally, this would yield comparable measures of the materiality of balance sheet optimisation steps, for example expressed as calculations of the additional lending headroom created. Again, monitoring MDBs’ progress in implementing CAF Panel recommendations requires cooperation by MDBs and access to granular internal MDB data.
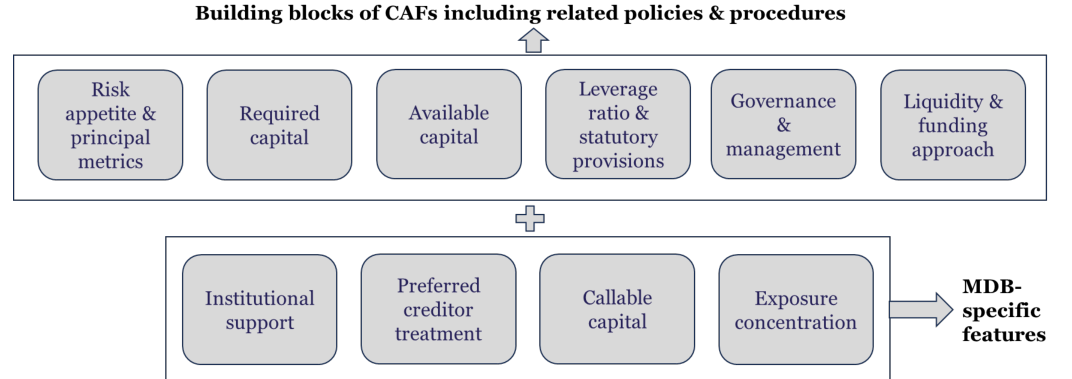
Note: The figure is reproduced from CAF Panel (2022).
2.3 Basel Principles on Risk Disclosure
BCBS (2015) provides an authoritative expression of how banks should make the nature of the risks they face transparent to outsiders. This document explains the motivation of the Basel transparency requirements as follows: “Pillar 3 of the Basel framework aims to promote market discipline through regulatory disclosure requirements. These requirements enable market participants to access key information relating to a bank’s regulatory capital and risk exposures to increase transparency and confidence about a bank’s exposure to risk and the overall adequacy of its regulatory capital” see BCBS (2015) page 1.
The CAF Panel’s notion that the provision of enhanced and consistent information on their capital adequacy by MDBs differs from what the Basel Committee has in mind. Shareholders rather than the wider market are the audience but ‘shareholder discipline’ is not wholly different from market discipline. If additional information gives shareholders greater confidence to commit additional equity or risk-bearing capacity in the form of guarantees, then MDBs would be the gainers.
BCBS (2015) (see pages 3-4) sets out five guiding principles for banks’ Pillar 3 disclosures. These are as follows:
• “Principle 1: Disclosures should be clear Disclosures should be presented in a form that is understandable to key stakeholders (i.e., investors, analysts, financial customers and others) and communicated through an accessible medium. Important messages should be highlighted and easy to find. Complex issues should be explained in simple language with important terms defined. Related risk information should be presented together.”
• “Principle 2: Disclosures should be comprehensive Disclosures should describe a bank’s main activities and all significant risks, supported by relevant underlying data and information. Significant changes in risk exposures between reporting periods should be described, together with the appropriate response by management. Disclosures should provide sufficient information in both qualitative and quantitative terms on a bank’s processes and procedures for identifying, measuring and managing those risks. The level of detail of such disclosure should be proportionate to a bank’s complexity. Approaches to disclosure should be sufficiently flexible to reflect how senior management and the board of directors internally assess and manage risks and strategy, helping users to better understand a bank’s risk tolerance/appetite.”
• “Principle 3: Disclosures should be meaningful to users Disclosures should highlight a bank’s most significant current and emerging risks and how those risks are managed, including information that is likely to receive market attention. Where meaningful, linkages must be provided to line items on the balance sheet or the income statement. Disclosures that do not add value to users’ understanding or do not communicate useful information should be avoided. Furthermore, information which is no longer meaningful or relevant to users should be removed.”
• “Principle 4: Disclosures should be consistent over time Disclosures should be consistent over time to enable key stakeholders to identify trends in a bank’s risk profile across all significant aspects of its business. Additions, deletions and other important changes in disclosures from previous reports, including those arising from a bank’s specific, regulatory or market developments, should be highlighted and explained.”
• “Principle 5: Disclosures should be comparable across banks The level of detail and the format of presentation of disclosures should enable key stakeholders to perform meaningful comparisons of business activities, prudential metrics, risks and risk management between banks and across jurisdictions.”
Below, we shall explain our approach to benchmark MDB capital adequacy and relate this to the above five principles. One may note that calculations of Economic Capital (EC) using canonical methodologies meet many of the Basel Committee requirements. While EC has some technicalities in its computation, it is straightforward to explain its overall nature and the motivation for its use (Principle 3). It also represents an approach widely accepted across the banking sector and is commonly adopted in other non-bank financial organisations. Our approach involves a comprehensive application (Principle 2) of EC approaches to MDBs in a way that is comparable across banks (Principle 5) and can be repeated in future (Principle 4). In the exposition of results below, we aim to present EC calculations in a clear and easily comprehensible form(Principle 1), showing their sensitivity to different aspects of the assumptions adopted.
3. How MDB Balance Sheets Vary
3.1 Introduction
This section presents descriptive information about the balance sheets of a group of 20 MDBs. More detailed information about the rating profile of MDB loans and guarantee Development Related Assets (DRAs) is presented for a smaller group of 4 MDBs.
3.2 Key Financial Ratios
Table 3.1 presents, for 20 MDBs, a set of financial ratios important for understanding the balance sheets of these institutions. The data are taken from these institutions’ publicly available financial or annual[1] reports.[2] In this, we adopt the following assumptions:
1. The net loans and guarantees are the sum of loans outstanding described in the assets side of the MDBs balance sheet. They do not include the allowance for credit losses.
2. Equity investments are added only when they appear in the balance sheet.
3. The reporting of treasury or liquid investments is inconsistent between the observed 20 MDBs. Thus, the value is reported equal to that the MDB refers to as aggregate treasury or liquid investment in their financial/annual report. If aggregate information on liquid investments is missing, then the liquid assets reported in the balance sheet are taken (usually assets reported above the total outstanding loans).
4. Debt issued is the borrowing reported by the MDB in the liability side of the balance sheet.
5. Total assets, callable capital, paid-in capital is directly taken from MDBs either financial or annual report.
6. Reserves is the difference between the total equity and paid-in capital.
Most MDBs may be said to have fully deployed their capital, but one, AIIB, is still ramping up its loan portfolio and has a high equity-to-loans-and-guarantees ratio.
Few institutions listed in the table hold significant fractions of their Development Related Assets (DRAs) in instruments other than loans and guarantees. Four exceptions are IFC, EBRD, CEB, and IDB Invest for which equity exposures constitute 26%, 14%, 12%, and 5% of DRAs.
The ratios of Treasury to total asset vary considerably across the institutions listed. In some cases, the reason is evident. EIB has access to European Central Bank (ECB) liquidity and does not find it necessary to hold a large Treasury portfolio. For lower-rated MDBs, it is costly to run large Treasury portfolios since their cost of borrowing is high.
Accounting approaches may affect ratios. For example, some MDBs record the value of swaps on both sides of their balance sheets, which leads to higher total assets. If the swap’s asset side is not included in investments or the Treasury assets aggregate, then the ratio of Treasury assets to total assets will be low. This is true of ADB.
Table 3.1 also shows the ratio of callable equity to Total Equity. The latter includes both paid-in equity and accumulated reserves. The ratio varies greatly, equalling 14 for AfDB and 4.9 for IBRD, for example, but zero for IFC and IDB Invest.
| Equity | to Equity | to Callable | to | Treasury | Equity | Inv. | |
|---|---|---|---|---|---|---|---|
| Loans | Assets | Equity | to | to Total | Treasury | ||
| MDB Ratio | Ratio | Ratio | Assets | DRA | to | Debt | |
| ADB | 37% | 19% | 2.5 | 16% | 1% | 36% | |
| AfDB | 48% | 26% | 14.0 | 38% | 5% | 60% | |
| AFREXIMBANK | 23% | 19% | 0.6 | 15% | 0% | 122% | |
| AIIB | 116% | 43% | 3.8 | 21% | 0% | 40% | |
| APICORP | 66% | 32% | 3.0 | 25% | 21% | 53% | |
| BOAD | 45% | 33% | 0.7 | 8% | 6% | 18% | |
| CAF | 45% | 27% | 0.1 | 30% | 1% | 71% | |
| CDB | 64% | 41% | 1.6 | 32% | 0% | 63% | |
| CEB | 17% | 11% | 1.4 | 32% | 12% | 42% | |
| EBRD | 65% | 27% | 1.2 | 43% | 14% | 70% | |
| EIB | 18% | 14% | 2.9 | 14% | 2% | 18% | |
| IBRD | 25% | 18% | 4.9 | 24% | 0% | 34% | |
| IDA | 97% | 82% | 0.0 | 14% | 0% | 100% | |
| IDB | 34% | 26% | 4.4 | 22% | 0% | 31% | |
| IDB Invest | 50% | 32% | 0.0 | 28% | 5% | 45% | |
| IFC | 112% | 32% | 0.0 | 36% | 26% | 77% | |
| IsDB | 59% | 37% | 4.1 | 32% | 3% | 52% | |
| NDB | 77% | 43% | 3.8 | 43% | 0% | 104% | |
| NIB | 19% | 10% | 1.8 | 34% | 0% | 42% | |
| TDB | 31% | 23% | 1.2 | 21% | 1% | 29% | |
| Total | 40% | 27% | 2.2 | 21% | 2% | 36% |
Note: All the values are estimated using Table A1.1. The term Equity employed in the headers refers to ‘Total Equity’, i.e., paid in equity plus reserves. The data are taken from the banks’ financial statements and are not adjusted for differences in accounting treatments.
4. Basel and Rating Agency Views of MDB Capital Adequacy
4.1 Introduction
In this and subsequent sections, we report risk measures for a sample of nine MDBs. These are Asian Development Bank (ADB), African Development Bank (AfDB), Development Bank of Latin America and the Caribbean (CAF), Council of Europe Development Bank (CEB), European Bank for Reconstruction and Development (EBRD), Inter-American Development Bank (IDB), IDB Invest, International Bank for Reconstruction and Development (IBRD) and New Development Bank (NDB). We focus on these nine institutions rather than the wider group of twenty listed in Section 3 because their financial reports offer fuller information so one may analyse their capital adequacy using public data.
As a first step in understanding the capital adequacy of the MDBs, in this section, we present capital calculations using the Basel credit risk capital formula. Banks permitted by their supervisors to use the Internal Ratings Based Approach (IRBA) employ this formula for wholesale exposures.
The IRBA formula equals the Marginal Value at Risk (MVaR) implied by a simplified model of portfolio credit risk under the assumption that exposures are perfectly granular, defaults are driven by Gaussian latent variables with a single common factor, LGDs are deterministic,[3] and losses are only registered when a loan defaults.[4]
Under these assumptions (which regulators sometimes refer to as the ‘Asymptotic Single Risk Factor’ model), MVaRs are given by a simple analytical formula that depends only on PDs, LGDs and correlations. The Basel formula supposes that correlations are a function of loan PDs. Regulators calibrated this function using corporate data. It assumes that lower quality (higher PD) loans are less correlated with each other than are higher quality loans. Supposing this and the correlation levels assumed by Basel might be questioned in the context of sovereign loans and we shall examine different correlation assumptions in what follows below.
In this section, we also apply to the nine MDBs in our sample the approaches to measuring capital adequacy employed by the global ratings agencies, Standard & Poor’s, Moody’s and Fitch. These agencies, respectively, on a Risk Adjusted Capital (RAC) ratio, a leverage ratio and an Equity to Risk Weighted Assets (RWAs) ratio.
4.2 Basel CET1 Ratio
This section focusses on the Basel Core Equity Tier 1 (CET1) ratio using an Internal Ratings Based formula to calculate capital (see CRE31.5 in BCBS (2023c)). Note that we estimate the two CET1 ratios (i) only accounting for credit risk, and (ii) accounting for credit, market and operational risk.
The parameters employed in estimating Basel economic capital are:
1. Probability of Defaults (PDs) for SO: The Preferred Creditor Treatment (PCT) adjusted PDs for the SO are taken from a Risk Control study providing PCT-adjusted PDs (see Risk Control (2024b)). The non- PCT adjusted PDs for the SO are taken from the Standard & Poor’s default study of the sovereign (see Table 33 of Standard & Poor’s (2023b)). The PDs employed are one-year PDs.
2. PDs for NSO: The PDs for the corporates are based on the Standard & Poor’s default study on global corporates (see Table 23 of Standard & Poor’s (2023a)).
3. Loss Given Default (LGD): The different LGDs employed for the four cases are: a. SO (PCT-adjusted): It is taken as 20% to incorporate stressed LGD estimates of the MDB. It is double the LGD estimate used in the Risk Control’s Capital Adequacy model (see Section 5.3.4). b. SO (non-PCT adjusted): It is taken as 50% consistent with the 50% issuer-weighted recover rate observed in the Moody’s study on sovereign bond issues (see Moody’s (2023e)). It is conservative estimate compared to the GEMs (2024) study on recovery rate. c. NSO: It is taken as 50%, like the SO exposures without PCT adjustment.
4. Maturity: All the exposures were assumed to be 1-year loans.
Basel III suggests that banks will assign a risk weight of 400% to speculative unlisted equity exposure[5] (see CRE20.57 in BCBS (2023b)). Then the capital requirement of equity investment would be calculated based on equation (4.1).
(4.1) Capital Cℎarge = 400% × Equity Investment 12.5
Table 4.1 and Table 4.2 present Economic Capital (EC) implied by the Basel IRB approach. When the IRB formula is evaluated with a confidence level of 99.9% (i.e., unity minus 10 basis points), the EC may be regarded as corresponding to a ‘A’ rated stress level. In this study we are focussed on MDBs that mostly aim for a ‘AAA’ rating from the CRAs. Thus, we also evaluate the Basel EC with a 99.99% confidence level (i.e., 1 basis point). This may be regarded as equivalent to a ‘AAA’ stress level. The methodologies employed to obtain EC for market and operational risk are explained in Section 5.5 and Section 5.6, respectively.
We observe from Table 4.2 that the Basel CET1 ratio (equity resources divided by total RWAs) at a 99.9% confidence level, ranges from 28% to 108% for difference MDBs. The Basel-implied CAR for a 99.99% confidence level is calculated by evaluating the IRB formula for 1 basis point. In this case, the Basel CAR ranges from 2.9 to 10.6. The Basel CAR ratios clearly vary very substantially across the group of MDBs we study.
We also estimate the Basel EC without adjusting for PCT for the SOs. The results appear in Table 4.3 and Table 4.4. The CET1 ratios are much lower in this case, ranging across the banks from 19% to 55%.
| Basel | 10bp | Basel | 1bp | MR | OR | EI | |
|---|---|---|---|---|---|---|---|
| MDB | SO | NSO | SO | NSO | |||
| ADB | 2,503 | 488 | 4,246 | 687 | 1,322 | 571 | 460 |
| AfDB | 595 | 630 | 1,007 | 832 | 628 | 150 | 444 |
| CAF | 593 | 149 | 1,020 | 198 | 669 | 171 | 122 |
| CEB | 134 | 77 | 268 | 140 | 237 | 41 | 0 |
| EBRD | 199 | 2,638 | 344 | 3,695 | 1,005 | 381 | 1,673 |
| IBRD | 3,823 | 0 | 6,746 | 0 | 4,320 | 1,395 | 0 |
| IDB | 2,006 | 326 | 3,502 | 471 | 2,412 | 627 | 0 |
| IDB Invest | 0 | 406 | 0 | 614 | 139 | 62 | 85 |
| NDB | 197 | 133 | 352 | 196 | 424 | 51 | 0 |
Note: All amounts are in USD million. Here, MR denotes Market Risk, OR denotes Operational Risk and EI denotes Equity Investment.
| Total | TE to | Total | Basel | Total | Basel | Basel | |
|---|---|---|---|---|---|---|---|
| Equity | DRA | Basel | CET1 | Basel | CET1 | Implied | |
| MDB | (TE) | Ratio | RWAs | ratio | RWAs | ratio | CAR |
| ADB | 54,214 | 37% | 43,140 | 126% | 66,800 | 81% | 7.4 |
| AfDB | 13,143 | 45% | 20,867 | 63% | 30,590 | 43% | 4.3 |
| CAF | 13,719 | 44% | 10,796 | 127% | 21,300 | 64% | 6.3 |
| CEB | 3,685 | 17% | 2,630 | 140% | 6,111 | 60% | 5.4 |
| EBRD | 20,699 | 56% | 56,379 | 37% | 73,703 | 28% | 2.9 |
| IBRD | 55,320 | 23% | 47,792 | 116% | 119,225 | 46% | 4.4 |
| IDB | 37,873 | 34% | 29,153 | 130% | 67,149 | 56% | 5.4 |
| IDB Invest | 2,964 | 48% | 6,141 | 48% | 8,647 | 34% | 3.3 |
| NDB | 10,815 | 77% | 4,126 | 262% | 10,058 | 108% | 10.6 |
Note: All amounts are in USD million. MR denotes Market Risk, OR denotes Operational Risk, EI denotes Equity Investment, and w/o denotes without. The Basel implied CAR ratio is based on 99.99% confidence level equivalent to AAA rating stress level.
| Basel | 10bp | Basel | 1bp | MR | OR | EI | |
|---|---|---|---|---|---|---|---|
| SO | NSO | SO | NSO | ||||
| ADB | 10,382 | 488 | 15,566 | 687 | 1,322 | 571 | 460 |
| AfDB | 2,985 | 630 | 4,198 | 832 | 628 | 150 | 444 |
| CAF | 3,213 | 149 | 4,468 | 198 | 669 | 171 | 122 |
| CEB | 622 | 77 | 1,106 | 140 | 237 | 41 | 0 |
| EBRD | 981 | 2,638 | 1,414 | 3,695 | 1,005 | 381 | 1,673 |
| IBRD | 18,147 | 0 | 27,316 | 0 | 4,320 | 1,395 | 0 |
| IDB | 10,548 | 326 | 15,142 | 471 | 2,412 | 627 | 0 |
| IDB Invest | 0 | 406 | 0 | 614 | 139 | 62 | 85 |
| NDB | 960 | 133 | 1,417 | 196 | 424 | 51 | 0 |
Note: All amounts are in USD million. Here, MR denotes Market Risk, OR denotes Operational Risk and EI denotes Equity Investment.
| Total | TE to | Total | Basel | Total | Basel | Basel | |
|---|---|---|---|---|---|---|---|
| Equity | DRA | Basel | CET1 | Basel | CET1 | Implied | |
| MDB | (TE) | Ratio | RWAs | ratio | RWAs | ratio | CAR |
| ADB | 54,214 | 37% | 141,630 | 38% | 165,290 | 33% | 2.9 |
| AfDB | 13,143 | 45% | 50,741 | 26% | 60,464 | 22% | 2.1 |
| CAF | 13,719 | 44% | 43,552 | 32% | 54,055 | 25% | 2.4 |
| CEB | 3,685 | 17% | 8,730 | 42% | 12,211 | 30% | 2.4 |
| EBRD | 20,699 | 56% | 66,151 | 31% | 83,474 | 25% | 2.5 |
| IBRD | 55,320 | 23% | 226,842 | 24% | 298,275 | 19% | 1.7 |
| IDB | 37,873 | 34% | 135,926 | 28% | 173,922 | 22% | 2.0 |
| IDB Invest | 2,964 | 48% | 6,141 | 48% | 8,647 | 34% | 3.3 |
| NDB | 10,815 | 77% | 13,659 | 79% | 19,591 | 55% | 5.2 |
Note: All amounts are in USD million. MR denotes Market Risk, OR denotes Operational Risk, EI denotes Equity Investment, and w/o denotes without. The Basel implied CAR ratio is based on 99.99% confidence level equivalent to AAA rating stress level.
4.3 Rating Agency’s Capital Adequacy Metric
The three global rating agencies, Standard & Poor’s, Moody’s and Fitch, calculate financial indicators in their assessments of MDB capital adequacy. This section discusses these indicators for the nine MDBs for which we perform capital adequacy benchmarking.
Standard & Poor’s bases its initial assessment of MDB capital adequacy on the agency’s proprietary Risk Adjusted Capital (RAC) ratio. The assessment is then adjusted to reflect qualitative aspects of loan performance and the MDB’s risk management (see Standard & Poor’s (2023c)). Table 4.5 lists the RAC ratios examined by Standard & Poor’s.
Moody’s MDB assesses capital adequacy based on the weighted sum of three factors: (i) the Leverage Ratio, (ii) the Development Asset Credit Quality (DACQ) and (iii) Asset Performance (see Moody’s (2024)). The Leverage Ratio accounts for 40% of the capital adequacy assessment. The ratio equals the sum of development-related assets and treasury assets (rated A3 and lower) divided by total equity. Table 4.5 lists the Leverage Ratios reported by Moody’s in the MDBs’ rating reports.
Fitch’s capital adequacy assessment is assessed using three factors. In decreasing order of importance, these are: (i) the Usable Capital to Risk-Weighted Assets (RWA), (ii) the Equity to Assets ratio and (iii) internal capital generation (see Fitch (2023c)). Fitch’s Usable Capital to RWA ratio equals the sum of total equity and 10% of callable capital subscribed by ‘AAA’ and ‘AA-rated shareholders divided by the agency’s proprietary definition of RWA. Table 4.5 lists the capital to RWA reported by the Fitch in MDB rating reports.
| Moody's | Fitch's | ||
|---|---|---|---|
| S&P's | Leverage | Capital | |
| MDB | RAC | Ratio | to RWA |
| ADB | 32% | 281% | 59.0% |
| AfDB | 28% | 229% | 52.0% |
| CAF | 18% | 235% | 48.1% |
| CEB | 27% | 573% | 39.1% |
| EBRD | 30% | 203% | 44.0% |
| IBRD | 25% | 420% | 52.8% |
| IDB | 22% | 300% | 52.0% |
| IDB Invest | 34% | 224% | 44.2% |
| NDB | 26% | 133% | 86.0% |
Note: The source is from public available rating agency reports for fiscal year end 2022. The Fitch’s capital to RWA for ADB and Moody’s leverage ratio for NDB are Risk Control estimates. The Fitch’s capital to RWA for CAF and IDB Invest are end Sep 2022.
4.4 Correlations
This section shows how related are Basel CET1 and rating agency’s capital adequacy metrics for the nine MDBs in our sample. Table 4.6 shows correlation coefficients for the indicators. We include Moody’s leverage ratio which we multiply by minus one since, while all the other indicators are increasing in capital adequacy, a higher leverage ratio is associated with lower capital adequacy.
Table 4.6 shows that the two Basel CET1 measures based on risk parameters with and without PCT are reasonably highly correlated at 74%. The measure without PCT also has a 23% correlation with the S&P RAC ratio. The Fitch useable equity to RWA ratio has a high correlation of 74% and 82% with the two Basel ratios. The S&P’s RAC ratio has a lower correlation with the other indicators ranging from minus 24% to positive 23%.
| Basel | Basel | Moody's | Fitch's | ||
|---|---|---|---|---|---|
| CET1 | CET1 with | S&P's | Leverage | Equity to | |
| w/o pct | PCT | RAC | Ratio | RWA | |
| Basel | |||||
| CET1 | 1.00 | 0.74 | 0.23 | 0.39 | 0.74 |
| w/o pct | |||||
| Basel | |||||
| CET1 | 0.74 | 1.00 | -0.24 | 0.16 | 0.82 |
| with PCT | |||||
| S&P's | |||||
| 0.23 | -0.24 | 1.00 | 0.09 | -0.08 | |
| RAC | |||||
| Moody's | |||||
| Leverage | 0.39 | 0.16 | 0.09 | 1.00 | 0.52 |
| Ratio | |||||
| Fitch's | |||||
| Equity to | 0.74 | 0.82 | -0.08 | 0.52 | 1.00 |
| RWA |
Note: The correlations for the ‘Moody’s Leverage Ratio’ are multiplied by a factor negative one. The CET1 ratio used here is inclusive of market and operational risk.
5. How to Assess MDB Economic Capital
5.1 Introduction
For MDBs, the greatest source of risk is the credit risk generated by their portfolios of Development Related Assets (DRAs). MDBs’ Treasury portfolios may also contribute a small amount of credit risk. Some MDBs have significant exposure to equity investments. For our purposes, in line with Basel regulations, we will treat this as a sub-category of credit risk.
This section sets out a methodology for modelling credit risk capital, including DRA, Treasury portfolios and equity risk. The approach is based on canonical approaches to modelling credit risk first proposed in the 1990s and described in the industry publication J.P Morgan (1997). In this approach, defaults are caused by correlated latent variables.
In line with the classical Merton model of firm default, the latent variable may be interpreted as the logarithmic change in the asset value of the borrower’s ‘assets.’ Even when no such asset value interpretation is appropriate (for example, when the insolvency default is one of a sovereign borrower), the approach may be regarded as a reduced form representation of default.
When an exposure defaults, a random Loss Given Default (LGD) is generated equal to a stochastic LGD rate applied to the Exposure at Default. Suitable Probabilities of Default (PDs) and the mean and volatility of LGD rates are estimated using historical data, and EADs are computed based on amortisation and drawdown assumptions. The correlations of the latent variables driving defaults may be calibrated in a variety of ways. Common industry practice is base correlation estimates on equity index log returns data. Alternative data sources are spread changes (either Credit Default Swap (CDS) or bond spreads), rating changes or time series of default rates.
In the approach just described, defaults occur when a latent variable exceeds a threshold value. The threshold value is inferred from the assumed probability of default. Similar assumptions are employed in the statistics literature for modelling discrete choice events. When the underlying random variable is Gaussian, statisticians refer to this approach as ‘the Probit model’. Hence, one may refer to the credit risk modelling approach described as a version of the Probit model allowing for correlation.
5.2 Data Sources
We provide this benchmarking analysis for nine prominent MDBs, namely:
(i) Asian Development Bank (ADB)
(ii) African Development Bank (AfDB)
(iii) Development Bank of Latin America and the Caribbean (CAF)
(iv) Council of Europe Development Bank (CEB)
(v) European Bank for Reconstruction and Development (EBRD)
(vi) International Bank for Reconstruction and Development (IBRD)
(vii) Inter-American Development Bank (IDB)
(viii) Inter-American Investment Corporation (IDB Invest)
(ix) New Development Bank (NDB)
In the cases of ADB, AfDB, CAF, CEB, EBRD, IDB, IDB Invest and NDB, the benchmarking is performed using public data contained in the banks’ annual reports for the year ending December 2022 (see ADB (2023), AfDB (2023), CAF (2023), CEB (2023), EBRD (2023), IDB (2023), IDBI (2023) and NDB (2023)). The benchmarking for IBRD is based on end June 2022 data since this coincides with that institution’s financial statement reporting date (see IBRD (2022)). Most MDBs we examine have portfolios mainly comprising Sovereign Obligor (SO) loans with smaller exposures to Non-sovereign Obligors (NSOs) (see Table 5.1). In contrast, two NSO-focused MDBs, EBRD and IDB Invest, have outstanding loans to NSO counterparties that contribute 78.5% and 100%, respectively, of their total outstanding loans.
CEB and NDB do not supply aggregate summary tables of loans broken down by NSO and SO obligors in their financial statements. For these two banks, we, therefore, rely on the Standard & Poor’s Supranationals report (Standard & Poor’s (2023c)) which gives the proportions of SO and NSO loans. We assume that the proportions of NSO loans for CEB and NDB to be 17% and 13%, respectively. We suppose that the same proportion of SO and NSO apply to both outstanding loans and undisbursed loans.
For the SO exposures, each MDBs provides a table that includes loan data aggregated by countries and is divided into outstanding and undisbursed loans. We use this to calculate the exposure amount by sovereign as the sum of the outstanding loans and 50% of undisbursed loans.
For NSO exposures, only IDB and IDB Invest provide a breakdown by country. Hence, for other MDBs we assume that total NSO exposure is distributed as follows:
• If the MDB is sovereign-focused, 50% of the NSO exposures is distributed by weight of the SO exposures to the top 5 borrowing countries of the MDB ordered by their GDP. Then the rest of the 50% is distributed by the weight of the SO exposures of the rest of the borrowing countries.
• For the other MDBs (here EBRD alone, since IDB Invest already provides distribution by country), the NSO exposures follows the same distribution aggregate loan distribution by country.
NSO exposures are assigned to sectors and countries. These affect the correlation between these exposures used in the model. EBRD and IDB Invest provide loan data aggregated by sectors. We convert their sector categories into Global Industry Classification Standard (GICS). For banks that do not report sectoral distributions, we make the following assumptions:
• Each country’s NSO exposure is divided into two GICS sectors: (i) Financials and (ii) Utilities, with 60% and 40% of the NSO exposure allocated respectively. This distribution is based on the reported sectoral distribution of ADB’s NSO exposures.
Of the nine MDBs listed in Table 5.2, five have equity exposures. The EBRD has the greatest volume of equity investments, accounting for 27.0% of its total equity. ADB, AfDB and CAF do not provide the equity investment aggregated by countries. We, therefore, assume that equity exposure is distributed as follows:
• 50% of the equity exposures is distributed to the top 5 borrowing countries of the MDB (ordered by their GDP) in proportion to the SO exposure weights. If one of the top five sovereigns does not have an MSCI equity index, we assign the NSO weight to the largest country that does have such an index.
• The remaining 50% is distributed to a single region corresponding to the MDB.
| NSO OL | |||||||
|---|---|---|---|---|---|---|---|
| NSO | SO | % of | NSO | SO | Equity | Total | |
| MDB | OL | OL | Total OL | UL | UL | Investment | Equity |
| ADB | 6,471 | 138,589 | 4.5% | 2,428 | 48,272 | 1,438 | 54,214 |
| AfDB | 3,898 | 24,601 | 13.7% | 2,538 | 12,748 | 1,388 | 13,143 |
| CAF | 1,168 | 29,791 | 3.8% | 339 | 8,641 | 382 | 13,719 |
| CEB | 3,619 | 17,671 | 17.0% | 1,655 | 8,082 | 0 | 3,685 |
| EBRD | 26,787 | 7,321 | 78.5% | 6,827 | 9,262 | 5,229 | 20,699 |
| IBRD | 0 | 229,344 | 0.0% | 0 | 74,523 | 0 | 55,320 |
| IDB | 4,177 | 108,520 | 3.7% | 1,876 | 29,252 | 0 | 37,873 |
| IDB Invest | 6,221 | 0 | 100.0% | 1,562 | 0 | 265 | 2,964 |
| NDB | 1,869 | 12,505 | 13.0% | 928 | 6,212 | 0 | 10,815 |
Note: All the amount is in USD million. The Euro/USD exchange rate used is 1.0705 as on 30/12/2023. The UA/USD exchange rate used is 1.33 as for December 2022. OL denotes Outstanding Loans and UL denotes Undisbursed Loans.
| Equity % of | Total % of | Total | |
|---|---|---|---|
| MDB | Investment | Equity | DRA |
| ADB | 1,438 | 2.7 | 1.0 |
| AfDB | 1,388 | 10.6 | 4.8 |
| CAF | 382 | 2.8 | 1.2 |
| CEB | 0 | 0.0 | 0.0 |
| EBRD | 5,229 | 27.0 | 14.1 |
| IBRD | 0 | 0.0 | 0.0 |
| IDB | 0 | 0.0 | 0.0 |
| IDB Invest | 265 | 8.9 | 4.3 |
| NDB | 0 | 0.0 | 0.0 |
Note: All the amount is in USD million.
5.3 Credit Risk EC Methodology
The default probability of any defaultable security is assumed to be summed up by its rating. Ratings are assumed to be distributed as a time-homogeneous Markov chain. This implies that ratings are multinomially distributed from one period to the next.
To allow for correlations between ratings transitions, the model employs an ordered probit method in that, given an initial rating i (in a set of possible initial ratings j= 1,2, . . , J) at date t, the rating of the exposure at date t+ 1 is determined by the realisation of a standard Gaussian latent variable A. If A lies in the interval [Zi,j−1, Zi,j] where Zi,j−1 and Zi,j are elements in a set of cut off points Zi,2 < Zi,3 < ⋯< Zi,J , then the exposure is rated j at t+ 1. The approach is multi-period in that the model described here is applied repeatedly to generate time paths of ratings for each given exposure over the full simulation horizon.
The ordered probit approach is illustrated above in Figure 5.1 Suppose there are J= 7 rating classes. The initial rating of the obligor is i= ′BB′ and, depending on the realisation of the latent variable A (as plotted on Figure 5.1), the terminal rating may be j= ′AAA′, ′AA′ … or ′CCC′. The areas between two consecutive thresholds Z and below the normal distribution correspond to the conditional probabilities of ending up in the various ratings.
(i,j)], the cut off points Zi,j may be deduced directly from the Given an estimate of a rating transition matrix, [πt,T recursive equations:
(i,J) = 1 −Φ(Zi,J−1) πt,T πt,T(i,j) = Φ(Zi,j) −Φ(Zi,j−1), j= 2, … , J−1 (5.1) (i,1) = Φ(Zi,1) πt,T
Here, Φ(. )stands for the cumulative distribution function for the standard Gaussian.
The approach of assuming that transitions between several discrete states are driven by a latent variable with a continuous distribution is widely applied in the discrete choice econometrics literature. When the latent variable is normally distributed, it corresponds to the ordered probit approach. The major benefit of employing this approach in credit risk modelling is that it permits one to allow rating transitions by different obligors to be correlated simply by assuming that the latent variables driving transitions for different credit exposures are correlated.
For the Sovereign Obligors (SO), the model assumes that the latent variable for the itℎ exposure Ai can be broken down into an idiosyncratic component ei and multiple systematic risk factors. All the factors are rescaled so that they have unit variance and a zero mean. In this study a two-factor model drives the latent variable Ai for asset, namely:
i) Country factor, Fc,i ii) Sector (or Industry) factor, Fs,i Equation 5.2 represents the Ai in terms of the common factors Fc,iand Fs,i
Ai = √1 −ηi[2] ( α fc,i + β fs,i) + ηiei Wi Wi (5.2) Wi = √α[2] + β[2] + 2αβ× Corr(fc,i, fs,i)
where, ηi is the exposure’s idiosyncratic factor, ei is the idiosyncratic shock, α is the weight of the country factor, β is the weight of the sector factor and α+ β= 1.
The pair-wise correlation ρi,j between two exposures Aiand Ajis shown in equation 5.3.
√1 −ηi[2] × √1 −ηj (5.3) ρi,j = [α[2]ρc(i, j) + 2αβρc,s(i, j) + β[2]ρs(i, j)] WiWj Here,
• ρc(i, j) is the correlation between the country of risk for exposures i and j,
• ρc,s(i, j) is the correlation between the country of exposure i and the sector of the exposures j.
• ρs(i, j) is the correlation between the sector of the exposures i and j.
The estimation of the correlation structure between countries and sectors is discussed in sub section 5.4.3.
For the Non-Sovereign Obligors (NSO) we assumed diversified pool exposures, see Section 5.3.1 for further details. These exposures rather than being a single underlying exposure such as a loan or a bond, represents a diversified pool of such primitive, individual exposures. We implement diversified pool exposures to offset the lack of granular information of the NSO exposures and use aggregated NSO exposures by country.
The parameters which influence the EC calculated using the CPM are:
(i) Confidence Level: It dictates the prudence in the Value-at-Risk (VaR) estimation from the CPM. We produce the results at 1 basis point confidence interval, which correspond to ‘AAA’ confidence level.
(ii) Credit Ratings: We use the sovereign credit ratings as in Risk Control (2024b), in the order of preference Standard & Poor’s, Moody’s, Fitch and ratings inferred from OECD country risk classification. If there is no rating from all the four sources, we assign the exposure as ‘CCC’. For the NSO exposures the rating is assumed three notches below the sovereign rating of the NSO exposure.
(iii) Transition Matrix (TM): This matrix provides the probabilities of transition from one rating to another. The last column is the array of probabilities of default (PDs). We employ three transition matrixes
(a) SO without PCT: It is based one is based on historical TM from Standard & Poor’s (see Table 33 Standard & Poor’s (2023))
(b) SO with PCT: We implement the methodology discussed in Risk Control (2024a) to obtain historical TM with PCT for rating between AAA to C (see Appendix 2 for the TM employed).
(c) NSO exposures: It is based one is based on historical TM from Standard & Poor’s (see Table 23 Standard & Poor’s (2023))
(iv) Correlation Matrix: The correlation between borrowing countries and sector which is estimated using the MSCI equity indices for the different countries and sectors.
(v) Idiosyncratic Risk Weights (ηi): This factor denotes the weight which drives the value of latent variable Ai for an idiosyncratic shock. For SO ηi is assumed to be zero as the idiosyncratic factors are included in the correlation matrix calculated for this study, and for NSO ηi is assumed to be 40%.
(vi) Loss Given Defaults (LGDs): We employ a stochastic LGD with mean 10% and volatility as 16.8% for SO exposures with PCT adjustment. While, for SO exposures without PCT adjustment we employ LGD with mean 50% and volatility 28.0%. For the NSO exposures, the means of LGD varies across different regions and industries, where the recovery rates (equal to unity minus the LGD rate) are shown in Table 5.3. The volatilities equal to λ× √θ(1 −θ), where θ is the mean of LGD. Cruces and Trebesch (2013) estimated mean and standard deviation of haircuts as 37.04 and 27.28 0.27 respectively. Using these results, we calculate the value of λ as √0.37(1−0.37). = 0.56.
Table 5.3: Loss Given Default by Industry and Region
Infrastructure Financials Other
East Asia and the Pacific 0.65 0.629 0.719
Europe and Central Asia 0.791 0.738 0.708
Latin America and the Caribbean 0.731 0.654 0.728
Middle East and North Africa 0.879 0.826 0.814
South Asia 0.689 0.786 0.639
Sub-Saharan Africa 0.943 0.821 0.808
N/A 0.705 0.567 0.669 Note: The source is from GEMs (2024). We presume N/A here are for those contracts for which no information about region was available.
(vii) Number of Simulations: We have used 3 million replications in the Monte Carlo simulation, to achieve convergence in the economic capital estimate.

5.3.1 Diversified Pool Exposures
Suppose an obligor, i, defaults at time t if a latent random variable Zi,t < −c for some constant c.
Suppose the Zi,t for t = 0,1,2 … and i = 1,2,3 … n satisfy a factor structure in that:
(5.4) Zi,t = √ρXt + √1 −ρεi,t
Assume that: (5.5) Xt = √βXt−1 + √1 −βηt
Where εi,t and ηt are standard normal and independent for pairs of obligors i and j and across time t. Note that the Xt has been constructed so that it has unconditional unit variance.
If Xt has unconditional unit variance then so to does Zi,t. The unconditional probability of default then satisfies:
Φ−1(−c) = q (5.6)
This model is the basis for a derivation that leads to a dynamic process for the loss fraction, θt, of a pool of exposures at time t. Further details may be found in Lamb and Perraudin (2008). In fact, the process derived is for a transformation of the loss fraction given by taking its standard normal inverse:
Φ−1(θ) = θ̃ (5.7)
The dynamics of the transformed loss rate is then given by:
1−√β √ρ√1−β (5.8) θ̃t = √βθ̃t−1 + √1−ρ Φ−1(q) − √1−ρ ηt
Hence, the transformed loss rate at t has a normal distribution:
1−√β ρ(1−β) (5.9) θ̃t ≡Φ−1(θt)~N(√βθ̃t−1 + √1−ρ Φ−1(q), 1−ρ )
We calibrate the parameters as follows: β= 0, ρ= 0.5. Of these assumptions, β= 0 is conservative as it removes mean reversion from the default rate, The value ρ= 0.5 is an intra-pool correlation for a specialised single-asset class portfolio within a bank. Although again conservative, it may be compared to the Basel corporate correlations which range from 12% to 24%. Note that, as the diversified pool exposures appear in the MDB’s balance sheet, other corelation parameters play a role. The common factor ηtdriving each diversified pool exposure (see equations (5.4) and (5.5)) is a weighted sum of a pool level shock (which may diversify across pools) and country and sector factors.
The country and sector factors are correlated with the correlation calibrations being based on equity index correlations. An important parameter is the weight on the combined country sector-factor. The value we choose implies that the latent variables for two diversified pool exposures in the same country and sector would have a correlation of 0.84. As soon as the sectors and countries differ, this correlation will decrease substantially.
5.3.2 NSO Credit Ratings
In this section, we discuss the NSO credit ratings assumed for the eight MDBs (excluding IBRD which has only sovereign obligors) with NSO exposures considered in the study. We find that the MDB report the distribution of loan portfolio based on the bank’s internal credit rating group. We leverage this to assign an appropriate notching to the sovereign rating of the NSO exposures to match the distribution or weighted average rating of the NSO portfolio with the bank’s own estimate.
We match the observed rating distribution of NSO observations for the following banks: (i) ADB, (ii) AfDB, (iii)EBRD, and (iv) NDB, as these banks provide rating distribution which is an equivalent rating by external Credit Rating Agencies CRAs.
1. Asian Development Bank (ADB) ADB (2023) reports the distribution of the NSO loan portfolio by different risk groups based on the bank’s internal rating and also provides equivalent ratings by CRAs. We downgrade the sovereign rating by 1 notch to obtain the rating of the NSO obligors. Table 5.4 demonstrates that the Risk Control estimate is conservative to reflect the presence of non-performing loans in the ADB portfolio.
2. African Development Bank (AfDB) AfDB (2023) reports the distribution of the NSO loan portfolio by different risk groups based on the bank’s internal rating and also provides equivalent ratings by CRAs. We downgrade the sovereign rating by one notch to obtain the rating of the NSO obligors. The Risk Control estimates have a low proportion of loans in investment grade (see Table 5.5) due to the assumption of geographic distribution of NSO exposures (explained in Section 5.2).
2. European Bank for Reconstruction and Development (EBRD) EBRD (2023) reports the distribution of the loan portfolio by different risk groups based on the bank’s internal rating and also provides equivalent ratings by CRAs. We downgrade the sovereign rating by one notch to obtain the rating of the NSO obligors. We do not assume any NSOs in the non-performing loan category when estimating the economic capital estimate. Thus, we take a conservative assumption compared to the observed distribution. Table 5.6 demonstrates that risk control estimates almost double the proportion of loans in the CCC+ to CC rating group.
4. New Development Bank (NDB) NDB (2023) reports the distribution of the loan portfolio by the bank’s internal rating. We apply the same rating criteria for NSO obligors as we do for SO obligors. Table 5.7 demonstrates that Risk Control’s estimation is close to the distribution reported by the bank.
IDB, IDB Invest, and CEB provide rating distribution based on the bank’s internal rating classification. The internal rating classification is mapped to the external rating, such the resulting likelihood of the loss based on the external CRA is similar to the observed likelihood of the loss for a given internally rated exposure.
5. Inter-American Development Bank (IDB) IDB (2023) reports the distribution of the NSO loan portfolio by different coarse rating grades based on the bank’s internal rating. The internal rating is mapped to Standard & Poor’s rating so that the likelihood of loss based on the Standard & Poor’s rating is similar to IDB’s internal likelihood of loss. We estimate the weighted average rating (using the NSO PDs, as seen in Section 5.3.2) of the IDB’s NSO portfolio to be B- based on the IDB (2023) report. We apply no notch to the sovereign rating of the NSO exposures and get a weighted average rating of B- (using the NSO PDs, as seen in Section 5.3.2).
6. IDB Invest IDB Invest (2023) reports the distribution of the loan portfolio by the bank’s internal credit risk classification range. We apply the same rating criteria for NSO obligors as we do for SO obligors. We compute the NSO weighted average rating (WAR) using Risk Control’s PDs. The WAR inferred from the portfolio reported by the bank is BB-. In contrast, Risk Control’s estimation is B. IDB Invest has a higher inferred WAR than Risk Control’s estimation since the bank maps internal ratings to long-term PDs published annually by an international rating agency (IDB Invest (2023)). Hence, we cap the rating of the NSO obligors at the sovereign’s rating which is a conservation assumption based on the bank’s own loan performance.
7. Council of Europe Development Bank (CEB) CEB (2023) reports the distribution of the loan portfolio by the bank’s internal credit risk classification range. We apply the same rating criteria for NSO obligors as we do for SO obligors. We compute the NSO weighted average rating (WAR) using Risk Control’s NSO PDs. The WAR inferred from the portfolio reported by the bank is BBB, whereas the Risk Control’s estimation is BB. This discrepancy might be due to the bank using long-term PDs.
8. CAF Development Bank (CAF) CAF does not report the rating distribution of the loan portfolio, which could be used to compare with the external rating of the CRAs. Thus, we make a prudent assumption of 1 notch downgrade to the sovereign ratings to arrive at the NSO ratings.
| ADB Risk Control | ||
|---|---|---|
| Investment grade | 37 | 33 |
| BB+ to BB- | 32 | 27 |
| B+ to B- | 26 | 20 |
| CCC+ to CC or NPL | 5 | 19 |
Note: Here, OL denotes outstanding loans and NPL denotes non-performing loans.
| AfDB Risk Control | ||
|---|---|---|
| Investment grade | 18 | 3 |
| BB+ to BB- | 16 | 22 |
| B+ to B- | 34 | 41 |
| CCC+ to C | 32 | 34 |
Note: Here OL denotes outstanding loan.
| EBRD Risk Control | ||
|---|---|---|
| Investment grade | 13 | 17 |
| BB+ to BB- | 25 | 28 |
| B+ to B- | 40 | 20 |
| CCC+ to CC | 16 | 35 |
| Non-performing loans | 6 | 0 |
Note: Here OL denotes outstanding loan and UL denotes undrawn loans.
| NDB Risk Control | ||
|---|---|---|
| AAA to A- | 32 | 32 |
| BBB+ to BBB- | 32 | 29 |
| BB+ to CCC | 36 | 39 |
Note: Here, OL denotes outstanding loans and UL denotes undrawn loans.
5.3.3 Probabilities of Default
The transition matrix for the SO and NSO exposures resembles the historical rating transition observed in the Standard & Poor’s (2023b) and Standard & Poor’s (2023a) default study respectively. In the other study by Risk Control (2024b) the Preferred Creditor Treatment (PCT) adjusted PDs by ratings are estimated. This set of PDs is used for the default column of the Standard & Poor’s TM for SO with PCT adjustment.
Table 5.8 presents (i) Risk Control (2024b) PD, (ii) the Standard & Poor’s historical sovereign PD and (iii) the Standard & Poor’s historical global corporate PD. In the Credit Portfolio Model (CPM), Risk Control’s PD and Standard & Poor’s global corporate PD are used for SOs and NSOs respectively. The effect of PCT is substantial for ‘B’ and ‘CCC’ rating grades. This estimate is consistent with another study performed by the Risk Control for the G20 CAF (Capital Adequacy Framework) panel, which found the ratio of without PCT PDs to with PCT PDs to be more than 3 for single ‘B’ rating grade.
5.3.4 Loss Given Default Rates
For stochastic LGD, we suppose that recoveries (equal to unity minus the LGD rate) are beta-distributed on the unit interval with the means equal to θ and volatilities equal to λ× √θ(1 −θ). Cruces and Trebesch (2013) estimated mean and standard deviation of haircuts as 37.04 and 27.28 respectively. Using these results, we 0.27 calculate the value of λ as √0.37(1−0.37). = 0.56. Additionally, for SO exposures, we assume that (1-θ) (mean LGD) is equal to 10% with PCT adjustments and 50% without PCT adjustments. Therefore, volatilities are 0.168 and 0.28 with PCT and without PCT adjustments respectively. The means of LGD for the NSO exposures vary across different regions and industries, which are shown in Table 5.3.
5.3.5 Correlation Structure
Correlation assumptions are crucial inputs to credit portfolio analysis. One common practice is to base correlations on equity return data.
For the equity index-based approach, we use a mixture of country, region and GICS sector equity indices provided by MSCI. We use monthly time series index data from 2004-01-30 to 2022-12-30. We calculate the monthly log returns by rt = log(xt) −log(xt−1) where xt is the index value on month t, then calculate the pairwise correlations between each index.
A list of all countries with sufficient country index data is shown in Table 5.9 and a list of all GICS sectors is shown in Table 5.10.
In the case that no country index exists, or the index data does not cover the whole sample period, we map the country to a region index. We use four region indexes: EM Europe and Middle East, EFM Africa, EFM Asia and EM Latin America. Here, EFM stands for Emerging Frontier Markets and EM stands for Emerging Markets. A list of all countries with insufficient country index data is shown in Table 5.11.
We now explain the calculation of the country/sector correlation matrix, including countries with and without sufficient country index data. Each factor (a country or sector) is mapped to a corresponding index. There are two cases: (1) countries with sufficient index data and sectors are mapped to their specific index and (2) countries with insufficient index data are mapped to their region index. We then assign idiosyncratic risk weights. In case (1), the idiosyncratic risk weights are zero. In case (2), the idiosyncratic risk weights are regionspecific and are calibrated based on historical data.[6] The idiosyncratic risk weights for each region are shown in Table 5.12.
Table 5.13 provides average pairwise correlation factors for the four MDBs using two different idiosyncratic factors (i) regional idiosyncratic factor and (ii) constant idiosyncratic factor of 75%. The average pairwise correlation of AfDB is significantly lower than ADB and IDB when regional idiosyncratic factors are used. When using a constant idiosyncratic factor, the average pairwise correlation for AfDB resembles that observed in ADB.
| SO | SO | ||
|---|---|---|---|
| with | without | ||
| Ratings | PCT | PCT | NSO |
| AAA | 0.01 | 0.01 | 0.01 |
| AA+ | 0.02 | 0.05 | 0.02 |
| AA | 0.03 | 0.08 | 0.02 |
| AA- | 0.04 | 0.12 | 0.03 |
| A+ | 0.05 | 0.15 | 0.04 |
| A | 0.07 | 0.19 | 0.05 |
| A- | 0.09 | 0.22 | 0.07 |
| BBB+ | 0.10 | 0.26 | 0.09 |
| BBB | 0.14 | 0.29 | 0.14 |
| BBB- | 0.18 | 0.33 | 0.22 |
| BB+ | 0.21 | 0.50 | 0.29 |
| BB | 0.25 | 0.68 | 0.45 |
| BB- | 0.33 | 0.85 | 0.91 |
| B+ | 0.43 | 1.70 | 1.91 |
| B | 0.61 | 2.54 | 2.85 |
| B- | 0.86 | 7.01 | 5.53 |
| CCC+ | 0.93 | 17.01 | |
| CCC | 1.69 | 45.26 | |
| 25.70 | |||
| CCC- | 13.82 | 84.78 | |
| CC | 18.41 | 100.00 | |
| C | 6.82 | - | - |
Note: All the Probability of Default (PD) values are in per cent. Here rating ‘C’ could be understood as obligors who have defaulted to private creditors but not have gone into non- accrual status with MDB.
| Region | Country | ||
|---|---|---|---|
| Austria, Belgium, Croatia, | Czech Republic, Denmark, Estonia, | Finland, | France, |
| and Middle East Hungary, Ireland, Israel, | Italy, Jordan, Lebanon, Netherlands, | Norway, | Poland, |
| Spain, Sweden, Switzerland, Turkey, | United | Kingdom | |
| Africa Egypt, | Kenya, Mauritius, Morocco, Nigeria, | South | Africa |
| Australia, China, Hong | Kong, India, Indonesia, Japan, Korea, | Malaysia, | New |
| Asia | Philippines, Singapore, Sri Lanka, Taiwan, | Thailand | |
| America | Canada, USA | ||
| and Caribbean | Argentina, Brazil, Chile, Colombia, | Mexico, | Peru |

| Region | Country | |||||||
|---|---|---|---|---|---|---|---|---|
| and Middle East | Albania, Bahrain, | Belarus, | Bosnia and | Herzegovina, Bulgaria, | Iceland, | Iran, | Iraq, Jersey, Kosovo, | Kuwait, |
| (EM) | Lithuania, | Luxembourg, Arabia, | Macedonia, Serbia, | Moldova, Montenegro, Syria, Ukraine, United | Oman, Arab | Qatar, Emirates, | Romania, Russia, Yemen | Saudi |
| Algeria, | Angola, Benin, | Botswana, | Burkina Faso, Burundi, | Cameroon, | Cape Verde, Central | African | ||
| Republic, | Chad, Comoros, | Democratic | Republic of the | Congo, | Djibouti, | Equatorial Guinea, | Eritrea, | |
| Africa | Ethiopia, | Gabon, Gambia, | Ghana, | Guinea, Guinea-Bissau, | Ivory | Coast, | Lesotho, Liberia, | Libya, |
| (EFM) | Madagascar, | Malawi, Mali, | Mauritania, | Mozambique, Namibia, | Niger, | Republic of the Congo, | Rwanda, | |
| Sao Tome | and Principe, | Senegal, | Seychelles, Sierra Leone, | Somalia, | South | Sudan, Sudan, | Swaziland, | |
| Tanzania, Togo, | Tunisia, Uganda, | Zambia, | Zimbabwe | |||||
| Afghanistan, | Armenia, | Azerbaijan, | Bangladesh, Bhutan, Brunei, | Cambodia, | Cook Islands, Fiji, | Georgia, | ||
| Asia | Kazakhstan, | Kiribati, | Kyrgyzstan, Laos, | Maldives, Marshall | Islands, | Micronesia, | Mongolia, | Myanmar, |
| (EFM) | Nepal, | Palau, Papua | New Guinea, | Samoa, Solomon | Islands, | Tajikistan, | Timor-Leste, | Tonga, |
| Turkmenistan, | Tuvalu, Uzbekistan, | Vanuatu, | Vietnam | |||||
| America | Antigua | and Barbuda, | Bahamas, | Barbados, Belize, Bermuda, | Bolivia, | Cayman Islands, Costa | Rica, | |
| (EM) | Dominican Nicaragua, | Republic, Panama, | Ecuador, El Paraguay, Saint | Salvador, Grenada, Guatemala, Lucia, Suriname, | Trinidad and | Guyana, | Haiti, Honduras, Tobago, Uruguay, | Jamaica, Venezuela |
| Region Eta | Count | ||
|---|---|---|---|
| Africa | 81% | 8 | |
| Asia | 69% | 15 | |
| Europe and Middle East | 81% | 19 | |
| Latin America and Caribbean | 69% | 8 | |
| Correlations between factors are | then | calculated according | to |
| 2 2 | |||
| {√1 = | −η1 √1 −η2 ρ(i1, | i2) | |
| ρ(f1, f2) | |||
| 1 | |||
| Here, are two factors (countries | or | sectors), are | the |
| f1, f2 | i1, i2 | ||
| sectors) and are the | idiosyncratic | risk weights. | |
| η1, η2 |
| SO | NSO | |
|---|---|---|
| MDB | exposure | exposure |
| ADB | 43% | 27% |
| AfDB | 41% | 27% |
| CAF | 49% | 27% |
| CEB | 52% | 28% |
| EBRD | 38% | 26% |
| IBRD | 37% | - |
| IDB | 47% | 27% |
| IDB Invest | - | 27% |
| NDB | 56% | 29% |
5.4 Equity Investments
In this study, we assume that equity investments by MDBs have log normal returns. The log normal return is modelled like the latent variables driving credit quality for rated exposures, in that it is made up of country factors plus an idiosyncratic shock.
The country factor for equity investments is assumed to equal the MSCI country equity index. If there is no MSCI equity index for the country or if it is assigned as regional by the bank, we assign it to the regional MSCI index corresponding to the region of the MDB’s headquarters. For example, the regional equity investments are assigned to ‘Europe and Middle East’ for EBRD.
We adopt the following input parameter assumptions for equity investments:
• The mean excess annual return is assumed to be zero. This parameter captures the total excess expected return on the equity. Excess is over the risk-free amount.
• Annual dividend rate is assumed as zero. This parameter captures the dividend payout rate on equity, i.e., the fraction of value paid out to equity-holders each period.
• Annual volatility of returns is assumed based on the MSCI country factor of the equity investment.
In the financial statements of the MDBs, we find that only EBRD considers equity investments as a source of market risk and tries to estimate the potential impact of profit or loss of holding the equity.
5.5 Market Risk
Market risk is defined as the risk of losses in both on- and off-balance sheet risk exposures due to movement in the market prices. For MDBs the primary factors which affect the exposures in their balance sheet are movement in the (i) interest rate and (ii) foreign exchange rate. Thus, the four banks have consensus on the two principal risks which contribute to market risk are:
1. Interest Rate Risk
2. Foreign Exchange Risk
The economic capital required for the interest rate risk is calculated by using the following data:
• MDB sensitivity: The fair value losses of the MDB portfolio due to an upward parallel shift by 1 basis point (bp) in the interest rates at the end of the fiscal year. IBRD and AfDB provides sensitivity results of the portfolio in gross value. ADB provides stress sensitivity results of the portfolio in gross value.
• US treasury yield: The monthly market yield of the US Treasury Securities at 3-year constant maturity for the last 10 years from December 2012 to December 2022 (see Federal Reserve Economic Data (2024)).
We estimate the 1-year change in the US treasury yield at the following confidence levels assuming the change in interest rate has a gaussian distribution with mean zero:
1. At 5 per cent
2. At 10 bps (equivalent to ‘A’ stress level)
3. At 1 bp (equivalent to a ‘AAA’ stress level)
The Value at Risk (VaR) due to interest risk at a given confidence level is the product of the 1-year interest rate change (at a given confidence level) with the MDB loss due to a change in interest rate by 1 bp.
The fluctuations due to foreign exchange risk is minimised by the four banks considered in this study by matching the currencies of the assets and liabilities to the extent possible. Due to this, there is a negligible contribution to the economic capital required for exchange rate risk.
In the financial statement of IBRD (2022), the bank reports that it has matched currencies of borrowing and outstanding loans (including derivatives) with 83% in USD and 17% in Euro. AfDB provides sensitivity results for currency risk, which shows a minimal effect of 4 basis points for a 10% depreciation of each African currency against the Special Drawing Rights (SDR).
We estimate the market risk economic capital for other MDBs based on the three banks: ADB, AfDB, and IBRD. First, we calculate the ratio of market risk at 1 basis point to credit risk at a 1-year horizon, with PCT adjustments. We then take the average of these ratios and apply it to the remaining MDBs.
5.6 Operational Risk
Operational risk is defined as the risk of loss due to inadequate or failed internal processes, people or external events. This definition is consistent with definitions found across the financial statements of the four regional MDBs (i) ADB, (ii) AfDB, (iii) IBRD and (iv) IDB, and the Basel III framework for the commercial banks. It is interesting to note that Basel’s operational risk only includes legal risk and excludes strategic and reputational risk. The IDB considers operational risk to be events that can cause financial losses and financial reporting misstatements and impact the reputation of the MDB.
AfDB (2023) calculates the Operational Risk Capital (ORC) equal to 15 per cent of the 3-year average operation income of the bank, resembles recommended in Basel II. In this study, we benchmark the ORC according to the Basel III recommendations.
In the Basel III, ORC is calculated using the following three components (see BCBS (2023a)):
1) Business Indicator (BI): It is estimated using the bank's financial statement and is the proxy for operational risk. It is the sum of three components (i) Interest, Leases and Dividend Component (ILDC), (ii) Services Component (SC), and (iii) Financial Component (see equation 5.1). 2) Business Indicator Component (BIC): It is the product of BI with the Basel III’s marginal coefficients (α). The value of α increases with the BI. For BI under €1 billion α is 12 per cent, for BI in between €1 billion and €30 billion α is 15 per cent, and for BI, over €30 billion α is 18 per cent. 3) Internal Loss Multiplier (ILM): It is a scaling factor estimated using the bank’s average historical losses and the BIC.
Equation (5.5) describes the ORC estimated based on the Basel III framework.
∑i=0 abs(interst incomet−i −interest expenset−i) , ∑i=0 dividend incomet−i + ILDCt = min[2] ∑i=0 interest earning assetst−i 3 2.25% × ( 3 ) 2 2 ∑i=0 otℎer operating incomet−i ∑i=0 otℎer operating expenset−i , ) SCt = max( (5.5) 3 3 2 2 ∑i=0 fee incomet−i ∑i=0 fee expenset−i + max ( , ) 3 3
2 2 ∑i=0 abs(Net P&L trading book)t−i ∑i=0 abs(Net P&L banking book)t−i + FCt = 3 3 ORC= BIC × ILM
The data input required to estimate the ORC is shown in Table 5.14. All the data is for a three-year time-period. For the MDBs, we have assumed zero trading book profit and loss. The interest-earning assets are assumed to be the difference between total assets and due from banks (cash). When the financial statement provided by the MDB does not differentiate between interest and non-interest revenue, all the revenue is assumed equal to interest income. Borrowing expense is considered as interest expense in the calculation of ILDC. If an MDB’s income statement provides information on the net fee income and dividend income we include in the input to Table 5.14, otherwise it is assumed zero. The net Profit & Loss (P&L) of the banking book is assumed equal to the total comprehensive income reported by the MDBs. Finally, the scaling factor ILM is assumed to be unity due to the absence of the bank’s historical loss data due to operational issues.
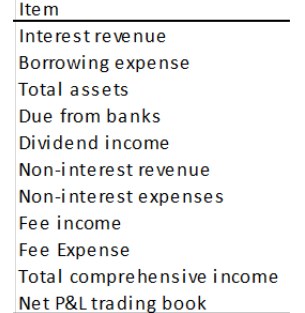
Note: The expense is entered as a negative amount in the data input.
5.7 Conclusion
This section has explained the Economic Capital methodology we have devised for measuring capital adequacy. This includes risk categories such as credit risk, market risk (which here comprises interest rate risk alone) and operational risk. Omitted are foreign exchange risk, treasury credit risk (due to lack of granular data on treasury assets by MDBs) and pension fund risk.
6. MDB Capital Adequacy Benchmarking
6.1 Introduction
This section presents results for nine MDBs: ADB, AfDB, CAF, CEB, EBRD, IBRD, IDB, IDB Invest, and NDB, using the Economic Capital (EC) methodology described in Section 5.
6.2 Credit Risk EC Results
The Economic Capital (EC) required for the credit risk faced by the four regional banks appears in Table 6.1.
Figure 6.1 is divided into two parts. Panel a) shows the breakdown of credit risk exposures, measured by Marginal VaR, categorized by income group for each MDB, while Panel b) shows the breakdown of original loan portfolio exposures across these income groups. ADB and AfDB have significant exposure to lowermiddle-income countries. CEB has its credit risk primarily exposed to high-income countries. Comparing the two panels demonstrates that countries with lower income contribute a higher proportion of total EC than the proportion of DRAs.
Figure 6.2 contrasts between the type of MDB DRAs by asset classes. Most MDBs covered in this study are sovereign focused (implying having SO account for 50% or more of total DRAs). We could observe that when we have presence of NSO or equity asset types it takes a larger share of the total required EC compared to their proportion of outstanding loans in total DRAs. The panel demonstrates the effect of PCT which enables the SOs to have lower contribution to EC compared to asset types which does not benefit from PCT.
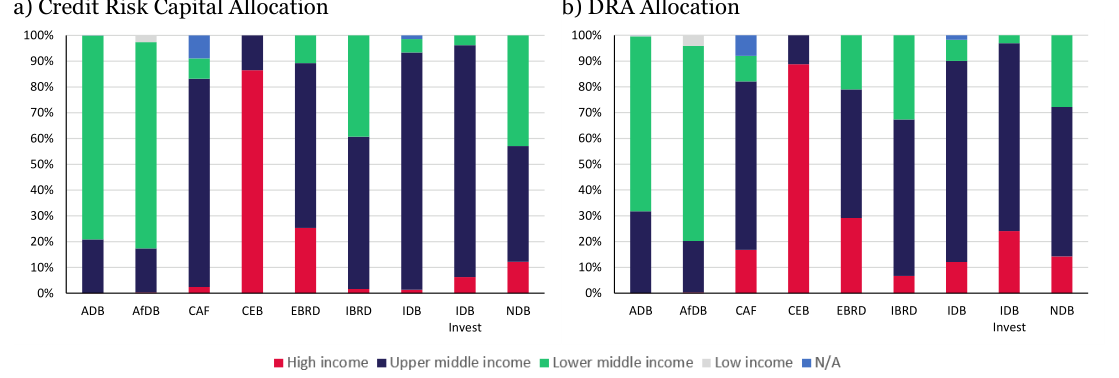
Note: Here the credit risk is based on 1-year VaR at 1 basis point confidence level.
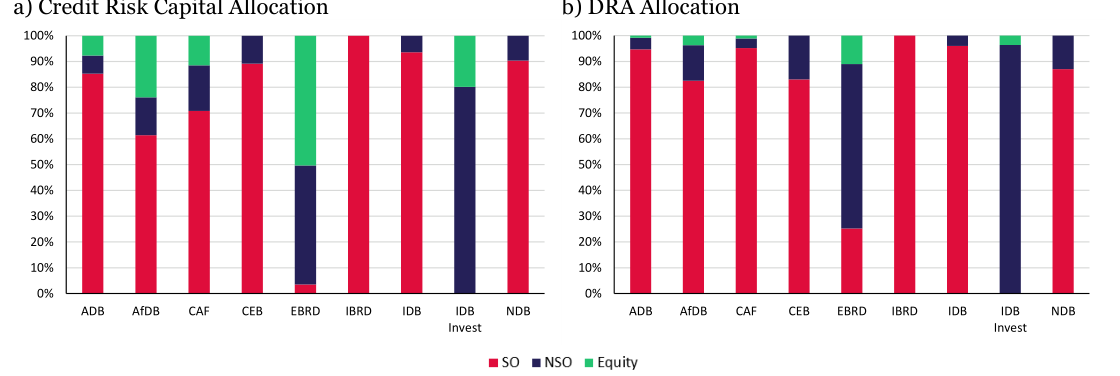
Note: Here the credit risk is based on 1-year VaR at 1 basis point confidence level.
| ADB | 57,777 | 65,595 | 17,714 | 22,410 |
|---|---|---|---|---|
| AfDB | 11,884 | 12,612 | 3,421 | 4,239 |
| CAF | 15,137 | 15,536 | 4,423 | 5,666 |
| CEB | 7,064 | 8,320 | 1,575 | 2,136 |
| EBRD | 9,503 | 10,284 | 6,457 | 7,333 |
| IBRD | 90,027 | 97,744 | 19,303 | 25,179 |
| IDB | 52,226 | 54,349 | 14,986 | 18,203 |
| IDB Invest | 859 | 943 | 859 | 943 |
| NDB | 8,018 | 8,776 | 2,803 | 3,588 |
Note: All units are in USD million. The Euro/USD exchange rate used is 1.0705 as on 30/12/2023. The UA/USD exchange rate used is 1.33 as for December 2022.
6.3 Market Risk EC Results
We compute EC for Market Risk by multiplying interest sensitivities published by several MDBs by a series of stresses. The yearly interest rate change of the 3-year US Treasury Security at 95%, 99.9%, and 99.99% confidence level are 1.21%, 2.03% and 2.40%, respectively.
Based on these calculations, the EC required for the market risk ranges from 2% to 8% of the total equity (see Table 6.2). IBRD has the highest required EC for market risk of $4.3 billion (at 1 bp). For ADB, the 1-yr VaR at 95% confidence level is 1.2%. This may be compared with the value that ADB itself reports of 1.56% of the equity. AfDB’s EC is around the median value for the MDBs at 4.8% of total equity.
Table 6.3 implements the approach described in Section 5.5. When a bank does not report an interest rate sensitivity, Market Risk EC is assumed to equal that bank’s Credit Risk EC times the average of the ratio of Market to Credit Risk EC of the three banks that do report sensitivity data (i.e., ADB, AfDB and IBRD). The average ratio in question is 15% of the Credit Risk EC.
| Yearly 3-Yr | VaR in | gross value | at | VaR | as % of | Total Equity | at | ||
|---|---|---|---|---|---|---|---|---|---|
| Sensitivity | Treasury | Total | |||||||
| for +1bp | Volatility | 500 bp | 10bp | 1bp | Equity 500 | bp | 10bp | 1bp | |
| ADB | 5.5 | 666 | 1,118 | 1,322 | 54,214 | 1.2% | 2.1% | 2.4% | |
| AfDB | 2.6 | 0.62% | 316 | 531 | 628 | 13,143 | 2.4% | 4.0% | 4.8% |
| IBRD | 18.0 | 2,176 | 3,654 | 4,320 | 55,320 | 3.9% | 6.6% | 7.8% |
Note: All amounts are in USD million. The volatility is estimated using monthly yield data of 3-yr USD Treasury security. The yearly interest rate change at 95%, 99.9% and 99.99% confidence level are 1.21%, 2.03% and 2.40%.
| ADB | 17,714 | 1,322 |
|---|---|---|
| AfDB | 3,421 | 628 |
| CAF | 4,423 | 664 |
| CEB | 1,575 | 236 |
| EBRD | 6,457 | 969 |
| IBRD | 19,303 | 4,320 |
| IDB | 14,986 | 2,248 |
| IDB Invest | 859 | 129 |
| NDB | 2,803 | 420 |
Note: All amounts are in USD million. The credit risk is 1-year with PCT adjustment. Market risk is estimated as 15% of credit risk (as described in Section 5.6).
6.4 Operational Risk EC Results
Table 6.4 shows that IBRD has the highest Operational Risk Economic Capital (OREC) at $1.4 billion among the major MDBs. The figures for ADB and IDB are similar at $0.6 billion ORC, almost half of the IBRD. Using the Basel III guidelines, AfDB’s ORC is estimated to be $148 million. This may be compared to the level that AfDB reports which was stated to be $79 million in the Bank’s latest financial statement.
The ORCs for the nine MDBs range from 1 to 3 percent of the bank’s total equity, with an average of 1.5%.
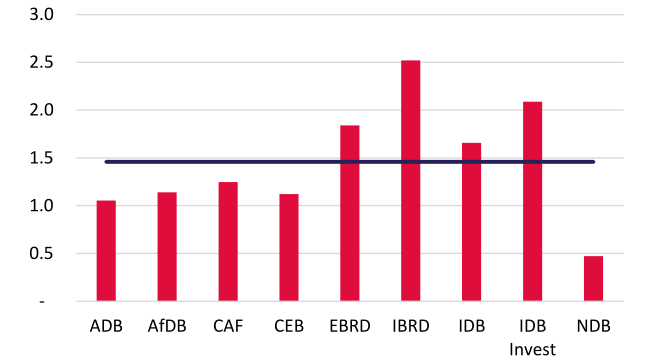
Note: The vertical axis is expressed in percentage.
| MDB | ILDC | SC | FC | BI | ORC % of | TE |
|---|---|---|---|---|---|---|
| ADB | 1,862 | 792 | 1,366 | 4,020 | 571 | 1.1 |
| AfDB | 560 | 292 | 361 | 1,213 | 150 | 1.1 |
| CAF | 996 | 187 | 171 | 1,355 | 171 | 1.2 |
| CEB | 156 | 59 | 129 | 344 | 41 | 1.1 |
| EBRD | 1,121 | 124 | 1,507 | 2,752 | 381 | 1.8 |
| IBRD | 2,319 | 2,080 | 5,113 | 9,512 | 1,395 | 2.5 |
| IDB | 1,731 | 1,137 | 1,528 | 4,396 | 627 | 1.7 |
| IDB Invest | 176 | 169 | 171 | 515 | 62 | 2.1 |
| NDB | 231 | 81 | 112 | 424 | 51 | 0.5 |
Note: All units are in USD million. ILDC denotes the Interest, Leases and Dividend Component, SC denotes the Services Component, FC denotes the Financial Component, BI denotes the Business Indicator, and ORC denotes Operational Risk Capital. The Internal Loss Multiplier is assumed to be unity.
6.5 Summary Findings
This section presents the results of the EC calculations for the nine MDBs in the sample. The CAR is calculated as ratio of total equity to EC, where the EC includes Credit Risk EC (inclusive of equity instruments), Market Risk EC and Operational Risk EC. Table 6.5 shows the CAR ratio (inclusive of PCT) using 1-year and 3-year EC for the nine MDBs. The 1-year CAR ranges from 2.0 to 3.3, with an average of 2.6.
Similarly, Table 6.6 displays CAR ratios with 1-year and 3-year Credit Risk EC without adjusting for PCT. The CAR ratios are significantly lower for the sovereign-focussed MDBs. The CAR ratio with 1-year EC without PCT varies from 0.5 to 2.8, with an average of 1.2.
The Credit Risk EC component of the CAR is calculated using a canonical Credit Portfolio Model (CPM). This is calibrated to estimate Value-at-Risk results at a 1 basis point confidence level, i.e., at a level equivalent to a ‘AAA’ stress event.
We generate equivalent Basel-implied and rating agency-implied CAR ratios. The Basel-implied CAR is computed using the Internal Ratings Based (IRB) formula with a confidence level of 99.99%. The Standard & Poor’s RAC-implied CAR is obtained by dividing the RAC ratio by 23%. This transforms the denominator of the ratio into EC at a 99.99% confidence level. The Fitch-Usable Capital-to-Risk-Weighted-Assets-Ratio (FRA) implied CAR is obtained by dividing the FRA ratio by 35%, which yields a ratio in which the denominator is equivalent to EC for a AAA rated entity.
Table 6.7 compares the CARs implied by the canonical CPM with Basel- and rating-agency-implied capital ratios. The Basel-implied CAR ratios (computed for a 99.99% confidence level) are significantly higher than the CPM-based CAR ratios. The latter are in turn higher than those implied by the Standard & Poor’s Risk Adjusted Capital (RAC) ratio and the Fitch Usable Capital to Risk Weighted Assets (FRA) ratio.
Table 6.8 presents correlations for the nine banks of the different CARs and the Moody’s Leverage Ratio (multiplied by minus 1). As expected, the correlation between the CPM-based using 1 and 3-year EC is 95%. The CPM-based CARs have relatively higher correlation with the Basel-implied CAR but lower correlation with the Standard & Poor’s RAC-implied CAR The CPM-based CAR is also strongly correlated with the Moody’s leverage ratio, which is surprising given the non-risk-sensitive nature of the latter. The Standard & Poor’s RAC implied
CAR has very low correlation with the Moody’s leverage ratio and is negatively correlated with the FRA ratio of Fitch.
| EC | CAR | Equity to | ||||||
|---|---|---|---|---|---|---|---|---|
| CR | MR | OR | Loans | Total | ||||
| 1-yr | 3-yr | 1-yr | 3-yr | Ratio | Equity | |||
| ADB | 17,714 | 22,410 | 1,322 | 571 | 2.8 | 2.2 | 37 | 54,214 |
| AfDB | 3,421 | 4,239 | 628 | 150 | 3.1 | 2.6 | 48 | 13,143 |
| CAF | 4,423 | 5,666 | 664 | 171 | 2.6 | 2.1 | 45 | 13,719 |
| CEB | 1,575 | 2,136 | 236 | 41 | 2.0 | 1.5 | 17 | 3,685 |
| EBRD | 6,457 | 7,333 | 969 | 381 | 2.7 | 2.4 | 65 | 20,699 |
| IBRD | 19,303 | 25,179 | 4,320 | 1,395 | 2.2 | 1.8 | 25 | 55,320 |
| IDB | 14,986 | 18,203 | 2,248 | 627 | 2.1 | 1.8 | 34 | 37,873 |
| IDB Invest | 859 | 943 | 129 | 62 | 2.8 | 2.6 | 50 | 2,964 |
| NDB | 2,803 | 3,588 | 420 | 51 | 3.3 | 2.7 | 77 | 10,815 |
Note: Here the EC is based on 99.99% confidence level. All the amounts are in USD million.
| EC | CAR | Equity to | ||||||
|---|---|---|---|---|---|---|---|---|
| CR | MR | OR | Loans | Total | ||||
| 1-yr | 3-yr | 1-yr | 3-yr | Ratio | Equity | |||
| ADB | 57,777 | 65,595 | 1,322 | 571 | 0.9 | 0.8 | 37 | 54,214 |
| AfDB | 11,884 | 12,612 | 628 | 150 | 1.0 | 1.0 | 48 | 13,143 |
| CAF | 15,137 | 15,536 | 664 | 171 | 0.9 | 0.8 | 45 | 13,719 |
| CEB | 7,064 | 8,320 | 236 | 41 | 0.5 | 0.4 | 17 | 3,685 |
| EBRD | 9,503 | 10,284 | 969 | 381 | 1.9 | 1.8 | 65 | 20,699 |
| IBRD | 90,027 | 97,744 | 4,320 | 1,395 | 0.6 | 0.5 | 25 | 55,320 |
| IDB | 52,226 | 54,349 | 2,248 | 627 | 0.7 | 0.7 | 34 | 37,873 |
| IDB Invest | 859 | 943 | 129 | 62 | 2.8 | 2.6 | 50 | 2,964 |
| NDB | 8,018 | 8,776 | 420 | 51 | 1.3 | 1.2 | 77 | 10,815 |
Note: Here the EC is based on 99.99% confidence level. All the amounts are in USD million.
| Risk | ||||
|---|---|---|---|---|
| Basel | S&P's | Fitch's Control | 1- | |
| CAR | RAC | FRA Year | CAR | |
| ADB | 7.4 | 1.4 | 1.7 | 2.8 |
| AfDB | 4.3 | 1.2 | 1.5 | 3.1 |
| CAF | 6.3 | 0.8 | 1.4 | 2.6 |
| CEB | 5.4 | 1.2 | 1.1 | 2.0 |
| EBRD | 2.9 | 1.3 | 1.3 | 2.7 |
| IBRD | 4.4 | 1.1 | 1.5 | 2.2 |
| IDB | 5.4 | 1.0 | 1.5 | 2.1 |
| IDB Invest | 3.3 | 1.5 | 1.3 | 2.8 |
| NDB | 10.6 | 1.1 | 2.5 | 3.3 |
Note: Here, the Basel-implied CAR is based on the Internal Ratings Based (IRB) formula with a confidence level of 99.99%. Standard & Poor’s RAC implied CAR is obtained by dividing the RAC ratio by 23%. This makes the denominator of the ratio equivalent to Economic Capital (EC) with a 99.99% confidence level. The Fitch-Usable Capital-to-Risk- Weighted-Assets-Ratio (FRA) implied CAR is obtained by dividing the FRA ratio by 35%, which yields a ratio in which the denominator is equivalent to EC for a AAA rated. The Risk Control’s CAR is based on the economic capital required at 99.99% confidence level.
| Basel | Basel | Moody's | Fitch's | ||||||||
|---|---|---|---|---|---|---|---|---|---|---|---|
| CAR | 1-yr CAR | 3-yr | CAR CAR | 1-yr CAR | 3-yr | CAR | S&P's | Leverage | Equity | to | |
| w/o | PCT w/o | PCT w/o | PCT with | PCT with | PCT with | PCT | RAC | Ratio | RWA | ||
| CAR 1-yr | |||||||||||
| w/o PCT | 1.00 | 1.00 | 0.38 | 0.46 | 0.69 | -0.34 | 0.63 | 0.54 | -0.09 | ||
| CAR 3-yr | |||||||||||
| w/o PCT | 1.00 | 1.00 | 0.36 | 0.46 | 0.69 | -0.35 | 0.60 | 0.56 | -0.10 | ||
| Basel | |||||||||||
| CAR | |||||||||||
| w/o PCT | 0.38 | 0.36 | 1.00 | 0.67 | 0.59 | 0.71 | 0.23 | 0.53 | 0.76 | ||
| CAR 1-yr | |||||||||||
| with PCT | 0.46 | 0.46 | 0.67 | 1.00 | 0.95 | 0.37 | 0.31 | 0.82 | 0.62 | ||
| CAR 3-yr | |||||||||||
| with PCT | 0.69 | 0.69 | 0.59 | 0.95 | 1.00 | 0.13 | 0.44 | 0.87 | 0.44 | ||
| Basel | |||||||||||
| CAR | |||||||||||
| with PCT | -0.34 | -0.35 | 0.71 | 0.37 | 0.13 | 1.00 | -0.26 | 0.24 | 0.86 | ||
| S&P's | |||||||||||
| RAC | 0.63 | 0.60 | 0.23 | 0.31 | 0.44 | -0.26 | 1.00 | 0.09 | -0.08 | ||
| Moody's | |||||||||||
| Leverage | |||||||||||
| Ratio | 0.54 | 0.56 | 0.53 | 0.82 | 0.87 | 0.24 | 0.09 | 1.00 | 0.52 | ||
| Fitch's | |||||||||||
| Equity to | |||||||||||
| RWA | -0.09 | -0.10 | 0.76 | 0.62 | 0.44 | 0.86 | -0.08 | 0.52 | 1.00 |
Note: The CAR is calculated using a constant idiosyncratic factor of 75%. The correlations for the ‘Moody’s Leverage Ratio’ are multiplied by minus one. The highlighted row demonstrates the correlation of relevant prudent CAR measures for the MDB with other capital adequacy metrics. Here, w/o denotes without. See note for Table 6.7 for Basel CAR.
7. Conclusion
This study presents comparable measures of capital adequacy for several MDBs. In this, we aim to shed light on the financial state of the institutions included. We are also interested in how the different measures perform and whether they measure required capital consistently.
We focus on nine MDBs. We provide some balance sheet ratios for some other multilateral lenders but their limited transparency regarding risk makes analysing their capital adequacy on the basis of public information difficult.
Our findings are as follows. For the nine MDBs, the CARs implied by the canonical EC methodology are high, being never less than 2 even when a conservative confidence level of 99.99% is employed. The high CARs reflect the Preferred Creditor Treatment (PCT) the MDBs enjoy in their sovereign lending and the conservative nature of their lending to non-sovereigns.
In calibrating the Probabilities of Default (PDs) and the Loss Given Default (LGD) rates employed in the calculations, we draw on earlier studies Risk Control (2022) and (2024) and employ information provided by the MDBs in their public financial statements and risk reports.
We compare the CARs implied by the methodology with capital ratios obtained using Basel and rating agency methodologies (see Table 6.7 and Figure 7.1). Even when Basel and rating agency-implied CARs are computed for a triple-A or 99.99% confidence level, the Basel-implied CAR ratios exceed 2.9 for all nine banks.
On the other hand, the CAR ratios implied by the Standard & Poor’s Risk Adjusted Capital (RAC) ratio and the Fitch Usable Capital to Risk Weighted Assets (FRA) ratio (in both cases at a 99.99% confidence level) are much lower, varying from 0.8 to 1.5 for Standard & Poor’s and from 1.1 to 2.5 for Fitch.
We compute the correlations across the 9 banks of the different CAR ratios and the Moody’s leverage ratio (see Table 6.8). It is noticeable that the Risk Control CARs have relatively higher correlation with the Basel-implied
CAR but lower correlation with the Standard & Poor’s RAC-implied CAR The CPM-based CAR is also strongly correlated with the Moody’s leverage ratio, which is surprising given the non-risk-sensitive nature of the latter. The Standard & Poor’s RAC implied CAR has very low correlation with the Moody’s leverage ratio and is negatively correlated with the FRA ratio of Fitch.
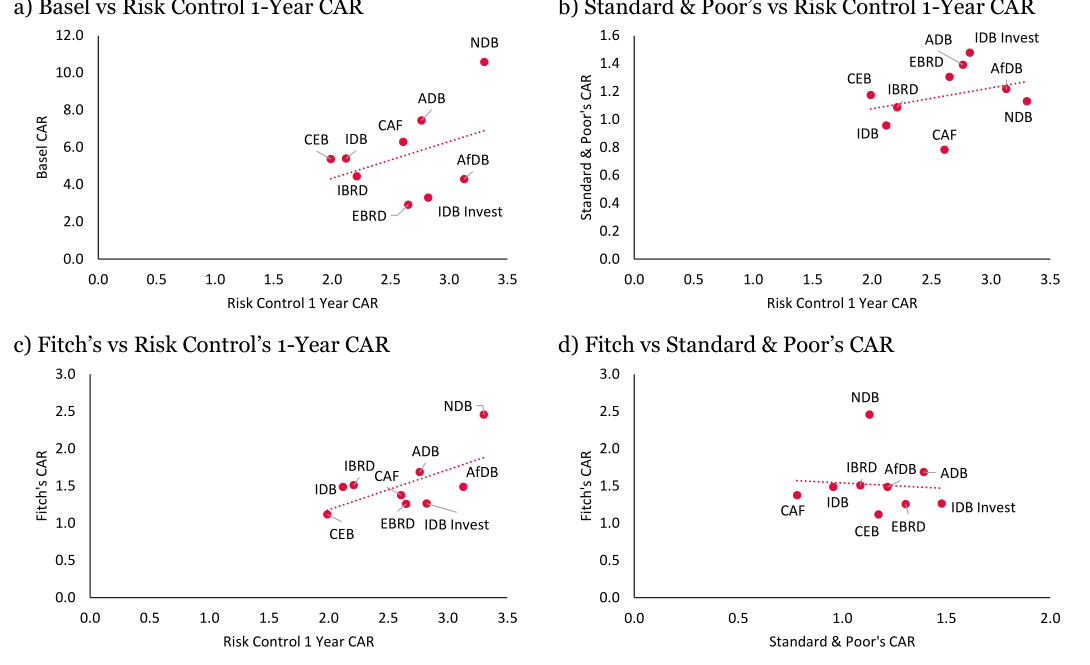
Note: Here the dashed line represents the best fit line for the scatter plots.
References
MDB Annual Reports
Asian Development Bank (2023) “Financial Report 2022,” March, available at: https://www.adb.org/sites/default/files/institutional-document/872636/adb-financial-report-2022.pdf.
African Development Bank (2023) “Financial Report 2022,” May, available at: https://www.afdb.org/en/documents/financial-report-2022.
AFREXIMBANK (2023) “Annual Report 2022,” available at: https://media.afreximbank.com/afrexim/Afreximbank-2022-AR.pdf.
AIIB (2023) “Auditor’s Report and Financial Statements for Year Ended Dec.31, 2022,” available at: https://www.aiib.org/en/about-aiib/financial-statements/.content/index/pdf/AIIB-2022-yearend-Financial- Statements-signed.pdf.
APICORP (2023) “Annual Report 2022,” available at: https://reporting.apicorp.org/2022/.
BOAD (2023) “Statutory Auditor’s report on the Audit of the Financial Statements,” available at: https://www.boad.org/wp-content/uploads/2023/04/Statutory-Auditor-Report-on-financial-statements-yearended-december-31-2022.pdf.
CAF (2023) “ Financial Statements,” available at: https://www.caf.com/media/4384356/cafannualingle-s31- 12-2022coninformedelosauditoresindependientes.pdf.
CDB (2023) “Annual Report 2022,” available at: https://www.caribank.org/publications-andresources/resource-library/annual-reports/cdbs-annual-report-2022.
CEB (2023) “Financial Report 2022,” available at: https://coebank.org/media/documents/2022_CEB_Financial_report.pdf.
EBRD (2023) “Financial Report 2022,” May, available at: https://www.ebrd.com/financial-report-2022.
EIB (2023) “Financial Report 2022,” May, available at: https://www.eib.org/en/publications/20220270financial-report-2022.
International Bank for Reconstruction and Development (2022) “Management’s Discussion & Analysis and Financial Statements June 30.2022,” available at: https://thedocs.worldbank.org/en/doc/16796f0d7a20087d312ec8634ace777c-0040012022/original/IBRD- Financial-Statements-June-2022.pdf.
International Bank for Reconstruction and Development (2023) “Management’s Discussion & Analysis and Financial Statements June 30.2023,” available at: https://thedocs.worldbank.org/en/doc/66512fcff3c06766d0bd85f5042d4101-0040012023/original/IBRD- Financial-Statements-June-2023.pdf.
IDA (2023) “Management’s Discussion & Analysis and Financial Statements June 30.2023,” available at: https://thedocs.worldbank.org/en/doc/b38629a142167d3f5b6dcf39646379c5-0040012023/original/IDA- Financial-Statements-June-2023.pdf.
Inter-American Development Bank (2023) “Annual Report 2022 Financial Statements,” available at: https://publications.iadb.org/en/inter-american-development-bank-annual-report-2022-financial-statements.
IDB Invest (2023) “2022 Information Statement,” available at: https://idbinvest.org/sites/default/files/2023- 04/FY22%20IDB%20Invest_Info%20Statement_Final_Ext%20Pub_ENG_2023.02.23_branded.pdf.
IFC (2023) “Management’s Discussion and Analysis and Consolidated Financial Statements June 30,2023,” available at: https://www.ifc.org/content/dam/ifc/doc/2023/FY23-IFC-Annual-MDA-and-FS.pdf.
IsDB (2023) “Ordinary Capital Resources Financial Statements and Independent Auditor’s Report,” available at: https://www.isdb.org/publications/isdb-ocr-financial-statements-2022.
NDB (2022) “Annual Report 2021,” available at: https://www.ndb.int/annual-report- 2021/pdf/NDB_AR_2021_complete.pdf.
NIB (2023) “2022 Annual Report,” available at: https://www.nib.int/files/417e821473134738d7e3cf646fd24cc7eed54498/nib-annual-report-2022.pdf.
TDB (2023) “Annual Report & Financial Statements 2022,” available at: https://www.tdbgroup.org/wpcontent/uploads/2023/08/TDB-Annual-Report-2022-ENG.pdf.
Other references
Basel Committee on Banking Supervision (2023a) “Calculation of RWA for operational risk,” OPE25, March, available at: https://www.bis.org/basel_framework/chapter/OPE/25.htm?inforce=20230101&published=20230330.
Basel Committee on Banking supervision (2023b) “Calculation of RWA for credit risk,” CRE20, January, available at: https://www.bis.org/basel_framework/chapter/CRE/20.htm?inforce=20230101&published=20221208#fn_C

Basel Committee on Banking supervision (2023c) “Calculation of RWA for credit risk,” CRE31, January, available at: https://www.bis.org/basel_framework/chapter/CRE/31.htm?inforce=20230101&published=20200327
Basel Committee on Banking Supervision (2015) “Standards - Revised Pillar 3 disclosure requirements,” d309, January, available at: https://www.bis.org/bcbs/publ/d309.pdf.
CAF Panel (2022) “Boosting MDBs investing capacity, An Independent Review of Multilateral Development Banks’ Capital Adequacy Frameworks,” available at: https://www.dt.mef.gov.it/export/sites/sitodt/modules/documenti_it/rapporti_finanziari_internazionali/rap porti_finanziari_internazionali/CAF-Review-Report.pdf.
Cruces, Juan J., and Christoph Trebesch (2013) “Sovereign defaults: The price of haircuts.”, 5 (3), 85-117, available at: https://www.econstor.eu/bitstream/10419/52478/1/669443050.pdf
Fitch (2023a) “Fitch Affirms African Development Bank at 'AAA'; Outlook Stable,” July, available at: https://www.fitchratings.com/research/sovereigns/fitch-affirms-african-development-bank-at-aaa-outlookstable-10-07-2023.
Fitch (2023b) “Fitch Affirms IBRD at 'AAA'; Outlook Stable,” January, available at: https://www.fitchratings.com/research/sovereigns/fitch-affirms-ibrd-at-aaa-outlook-stable-20-01-2023.
Fitch (2023c) “Supranationals Rating Criteria,” April, available at: https://www.fitchratings.com/research/sovereigns/supranationals-rating-criteria-11-04-2023.
Fitch (2023d) “Supranationals Rating Criteria: Discussion Paper,” December, available at: https://www.fitchratings.com/research/sovereigns/supranationals-rating-criteria-discussion-paper-12-12- 2023.
Fitch (2022) “Fitch Affirms Inter-American Development Bank at 'AAA'; Outlook Stable,” November, available at: https://www.fitchratings.com/research/sovereigns/fitch-affirms-inter-american-development-bank-at-aaaoutlook-stable-16-11-2022.
Federal Reserve Economic Data (2024) “Market Yield on US Treasury Securities at 3-year constant maturity (GS3),” available at: https://fred.stlouisfed.org/series/GS3.
GEMs (2024) “Recovery Statistics,” available at: https://www.gemsriskdatabase.org/#Recovery%20Statistics%20Publication
Lamb, Robert, and William Perraudin (2008) “Dynamic default rates,” manuscript, University of Minnesota, available at: https://www.riskcontrollimited.com/wp-content/uploads/2015/02/Dynamic_Default_Rates.pdf.
Moody’s (2024) “Multilateral Development Banks and other supranational entities methodology,” February, available at: https://rb.gy/1f55lu.
Moody’s (2023a) “Asian Development Bank – Aaa stable,” July, available at: https://www.adb.org/sites/default/files/institutional-document/33067/moodys-report-20230728.pdf.
Moody’s (2023b) “IBRD (World Bank) – Aaa stable,” March, available at: https://thedocs.worldbank.org/en/doc/15143476b7c65175c6ad7a5b3e412650-0340022023/original/Moody-s- IBRD-03Mar2023.pdf.
Moody’s (2023c) “Moody’s affirms AfDB’s Aaa rating, maintains stable outlook,” October, available at: https://www.moodys.com/research/Moodys-affirms-AfDBs-Aaa-rating-maintains-stable-outlook-Rating- Action--PR_480177.
Moody’s (2023d) “Moody’s affirms the Inter-American Development Bank’s Aaa rating,” March, available at: https://www.moodys.com/research/Moodys-affirms-the-Inter-American-Development-Banks-Aaa-ratingmaintains-stable-Rating-Action--PR_474022.
Moody’s (2023e) “Sovereign default and recovery rates, 1983-2022,” April, available at: https://www.moodys.com/research/Sovereigns-Global-Sovereign-default-and-recovery-rates-1983-2022- Sector-In-Depth--PBC_1358913.
Risk Control (2024a) “Fair Pricing of MDB Sovereign Loans,” September, 24-122a.
Risk Control (2024b) “Quantifying Preferred Creditor Treatment by Rating Grade,” September, 24-119a.
Standard & Poor’s (2023a) “Default, Transition, and Recovery: 2022 Annual Global Corporate Default And Rating Transition Study,” April, available at : https://www.spglobal.com/ratings/en/research/articles/230425default-transition-and-recovery-2022-annual-global-corporate-default-and-rating-transition-study-12702145.
Standard & Poor’s (2023b) “Default, Transition, and Recovery: 2022 Annual Global Sovereign Default And Rating Transition Study,” April, available at: https://www.spglobal.com/ratings/en/research/articles/230428default-transition-and-recovery-2022-annual-global-sovereign-default-and-rating-transition-study- 12695994#:~:text=All%20of%20S%26P%20Global%20Ratings,of%20default%2C%20and%20vice%20versa.
Standard & Poor’s (2023c) “Supranationals,” October, available at: https://www.spglobal.com/ratings/en/research/pdf-articles/231012-supranationals-special-edition-2023- 101587529.
Appendix A1: MDB Data from Financial Statements
Table A1.1: Key Financial Information Net
loans & Equity Treasury Total Debt Callable Paid in Total Total Last FY Average
MDB guarantees investments investments assets issued capital capital Reserves equity liabilities end date Rating
ADB 145,060 1,438 47,550 290,658 131,571 134,494 7,081 47,133 54,214 236,444 31/12/2022 AAA
AfDB 27,523 1,388 19,343 50,832 32,256 184,586 8,262 4,882 13,143 37,688 31/12/2022 AAA
AFREXIMBANK 22,966 0 4,100 27,863 3,368 3,171 850 4,357 5,207 22,656 31/12/2022 BBB+
AIIB 17,642 0 9,746 47,409 24,476 77572 19393 1,073 20,466 26,944 31/12/2022 AAA
APICORP 4,229 68 2,210 8,742 4,209 8,500 1,500 1,309 2,809 5,933 31/12/2022 AA
BOAD 3,982 239 464 5,487 2,550 1,348 426 1,377 1,803 3,684 31/12/2022 BBB
CAF 30,622 382 15,127 50,377 21,252 1,626 9,778 3,941 13,719 36,657 31/12/2022 AA-
CDB 1,324 0 660 2,066 1,051 1,375 388 458 846 1,220 31/12/2022 AA+
CEB 21,289 2,993 10,854 33,751 25,932 5,207 656 3,029 3,685 30,066 31/12/2022 AAA
EBRD 31,887 5,379 32,683 76,675 46,479 25,202 6,655 14,044 20,699 55,975 31/12/2022 AAA
EIB 468,217 11,757 82,964 582,981 462,132 242,581 23,755 60,210 83,965 499,016 31/12/2022 AAA
IBRD 243,896 0 79,824 332,641 237,265 296021 21,819 38,563 60,382 272,259 30/06/2023 AAA
IDA 191,684 0 32,679 227,482 32,567 0 271,258 -85,476 185,782 41,700 30/06/2023 AAA
IDB 112,697 0 32,545 148,026 103,693 164,901 11,854 26,019 37,873 110,153 31/12/2022 AAA
IDB invest 5,921 287 2,586 9,401 5,784 0 2,424 541 2,964 6,437 31/12/2022 AA+
IFC 31,414 10,778 40,120 110,547 52,443 0 22,596 12,442 35,038 75,509 30/06/2023 AAA
IsDB 22,645 637 11,369 36,008 21,775 54,899 8,533 4,871 13,405 22,604 31/12/2022 AAA
NDB 13,965 0 10,583 24,888 10,140 41,199 10,299 434 10,733 14,155 31/12/2021 AA+
NIB 23,273 0 14,176 42,049 33,823 8,053 906 3,484 4,390 37,659 31/12/2022 AAA
TDB 6,301 71 1,738 8,392 6,046 2,323 580 1,387 1,968 6,424 31/12/2022 BBB-
Total 1,426,538 35,419 451,320 2,116,275 1,258,812 1,253,058 429,013 144,079 573,091 1,543,184
Note: All units are in USD million. The Euro/USD exchange rate used is 1.0705 as on 30/12/2023. The UA/USD exchange rate used is 1.33 as for December 2022. The XOF/USD exchange rate used is .0016 as on 30/12/2022. The exchange rate used for ID/USD is 1.33 as on 23/12/2022. Reserves is calculated as the difference between ‘Total equity’ and ‘Paid In Capital’’. ‘Total liabilities’ are calculated as the difference between ‘Total assets’ and ‘Total equity’. The ‘Debt issued’ considers only the debt issued as a certificate. The treasury investments are as reported in the Financial Statements of respective MDBs. The source of the data is from the Annual Report/Financial Report of respective MDB
Appendix A2: Historical TM with PCT
Table A2.1 demonstrates the TM employed in this study for the SO with Preferred Creditor Treatment (PCT) adjustments. Here the rating state ‘C’ represents those sovereigns which default to private creditors but do not go into non-accrual status with MDBs. The values in the row ‘C’ are based on historical observation of sovereign which go into default to private creditors and what is the status one year after the default (see Risk Control
(2024a) for further details).
Table A2.1: One Year Historical TM with PCT AAA AA+ AA AA- A+ A A- BBB+ BBB BBB- BB+ BB BB- B+ B B- CCC+ CCC CCC- CC C D AAA 97.10 2.81 0.08 0.00 0.00 - - - - - - - - - - - - - - - - 0.01 AA+ 6.65 86.22 6.86 0.21 0.00 0.00 - - - - - - - - - - - - - - 0.03 0.02 AA 0.19 6.85 85.71 6.93 0.23 0.00 0.00 - - - - - - - - - - - - - 0.05 0.03 AA- 0.00 0.23 7.78 84.31 7.21 0.34 0.00 0.00 - - - - - - - - - - - - 0.08 0.04 A+ 0.00 0.01 0.47 13.37 76.00 9.68 0.31 0.01 0.00 - - - - - - - - - - - 0.10 0.05 A - 0.00 0.01 0.85 13.18 78.86 6.66 0.24 0.01 0.00 - - - - - - - - - - 0.12 0.07 A- - - 0.00 0.02 0.75 11.85 79.30 7.35 0.48 0.01 0.00 - - - - - - - - - 0.14 0.09 BBB+ - - - 0.00 0.02 0.76 13.14 72.38 12.68 0.75 0.01 0.00 - - - - - - - - 0.16 0.10 BBB - - - - 0.00 0.03 1.14 16.74 70.17 11.20 0.42 0.01 0.00 - - - - - - - 0.16 0.14 BBB- - - - - - 0.00 0.04 1.32 14.83 75.94 7.16 0.38 0.01 0.00 - - - - - - 0.15 0.18 BB+ - - - - - - 0.00 0.06 1.54 19.91 67.55 9.83 0.59 0.02 0.00 - - - - - 0.30 0.21 BB - - - - - - - 0.00 0.06 1.61 14.88 70.79 11.25 0.71 0.03 0.00 - - - - 0.43 0.25 BB- - - - - - - - - 0.00 0.04 0.85 10.61 74.58 12.05 1.00 0.03 0.00 - - - 0.52 0.33 B+ - - - - - - - - - 0.00 0.02 0.59 10.67 70.47 15.66 0.88 0.02 0.00 - - 1.27 0.43 B - - - - - - - - - - 0.00 0.02 0.79 13.97 71.78 10.48 0.41 0.01 0.00 - 1.93 0.61 B- - - - - - - - - - - - 0.00 0.03 1.14 15.17 69.56 6.68 0.38 0.03 0.00 6.15 0.86 CCC+ - - - - - - - - - - - - 0.00 0.08 2.31 25.88 46.49 6.79 1.08 0.37 16.08 0.93 CCC - - - - - - - - - - - - - 0.00 0.06 1.41 6.55 29.63 10.11 6.98 43.57 1.69 CCC- - - - - - - - - - - - - - - 0.00 0.00 0.00 0.00 5.07 10.15 70.96 13.82 CC - - - - - - - - - - - - - - - 0.00 0.00 0.00 0.00 0.00 81.59 18.41 C - - - - - - - - - - - - - - 4.55 27.27 22.73 2.27 2.27 4.55 29.55 6.82 D - - - - - - - - - - - - - - 2.04 2.04 - 30.61 - - - 65.31 Note: All units are in percentage.
Risk Control 8 Golden Square London W1F 9HY +44 (0)20 3307 0730 www.riskcontrollimited.com
Notes
[1] Some MDBs does not have separate financial statement documents, the financial statements are appended to the annual report of the MDB.
[2] The collected data are shown in Table A1.1.
[3] Or equivalently in this perfectly granular case, the risk of individual LGDs is independent across loans and of other sources of risk.
[4] I.e., changes in the value of loans associated with rating transitions short of default do not contribute to total losses.
[5] Basel defines speculative unlisted equity exposures as those in “unlisted companies that are invested for short-term resale purposes or are considered venture capital or similar investments which are subject to price volatility and are acquired in anticipation of significant future capital gains”.
[6] To calculate the idiosyncratic risk weights for each region, we regress the individual country index returns on their corresponding region index return and obtain the regression coefficient βi for each country i. We use the country indices with over 70% data availability throughout the entire period. The idiosyncratic weights for each country are then calculated 2. Finally, we average over each region to calculate the regional idiosyncratic weights. as ηi = √1 −βi