

1. Introduction
Sovereign loans by Multilateral Development Banks (MDBs) are non-traded assets. MDBs set spreads on such loans without differentiating between the ratings of the sovereign borrower in question[1] and they do so in an administrative way influenced more by the MDB’s overhead costs than notions of return on risk.[2] Hence, MDBs are rarely concerned with the market value of their assets.
The fair pricing of MDB sovereign loans does become an issue, however, when MDBs seek to transfer risk on these assets. Then counterparties which may include private sector investors will wish to understand how the loans should be valued.
This paper devises and applies an approach to pricing MDB loans. Starting from data on US-dollardenominated sovereign bonds, we infer fair market spreads conditional on rating. Adjusting these spreads for the Preferred Creditor Treatment (PCT) of MDB loans, we obtain spreads conditional on ratings and tenor for MDB sovereign loans.
PCT is the term used to describe the de facto (extra-legal) seniority enjoyed by multilateral debt of MDBs and organisations including the International Monetary Fund (IMF) and Specialised Multilateral Insurers (SMIs)[3]. The defaults on claims of entities enjoying PCT are less frequent and result in lower Loss Given Default (LGD) rates than the claims say of commercial bondholders, banks and credit insurers.[4]
PCT is extensively mentioned by multilaterals themselves in commenting on their own financial standing and has been studied to a limited degree by academics seeking to understand the scope for development finance flows to be routed via multilaterals. References include xx
Since loans and insurance claims benefitting from PCT are not traded, one cannot value them using observed market prices. However, one can infer spreads for international sovereign bonds not subject to PCT and then adjust for the lower probabilities of default and LGDs implied by historical default and non-accrual data.
To accomplish this task, we estimate sovereign bond spreads per rating using a large data set of US-dollardenominated bond prices and characteristics. The spread estimation approach we employ provides as an intermediate output a ‘risk-adjusted transition matrix’. Fair market spreads for different tenors may be obtained by calculating the multi-year Expected Losses implied by this matrix plus a reasonable estimate of sovereign bond LGDs (for which we rely on Moody’s (2023)).
Our earlier study entitled “Quantifying MDB Sovereign Loan PCT by Rating” (Risk Control (2023)) presented estimates of 1-year sovereign Probabilities of Default to without-PCT entities (e.g., private sector bondholders) and with-PCT lenders (e.g., MDBs). To infer multiperiod PDs, one may embed a PCT-inclusive vector of ratingspecific PDs in a rating agency transition matrix. Risk Control (2024) showed how this may be done while retaining the transition probabilities between non-default ratings evident in historical ratings data. This involves distinguishing between moderate-severity sovereign defaults (in which the sovereign defaults to non- PCT institutions such as private sector bondholders) and extreme-severity defaults in which they default to PCT-enjoying institutions like MDBs as well.
In this study, we use the split of probability weight between the moderate and extreme-severity defaults found in the historical transition matrix to infer a split in risk adjusted probability weight between these two default states in the risk adjusted matrix and, thereby, to infer the appropriate magnitude of sovereign spreads for PCTinclusive claims.
The study is organised as follows. Section 2 explains the data and methodology employed in estimating sovereign spreads by rating for international, US-dollar-denominated sovereign bonds. Section 3 explains how to infer PCT-inclusive spreads. Section 4 applies the latter spreads in analysing the fair pricing of loan portfolios for four prominent MDBs, ADB, AfDB, IBRD and IDB. Section 4 concludes.
2. Risk-adjusted Spreads Without PCT
2.1 Introduction
In the subsection, we explain how we estimate a risk-adjusted Transition Matrix from sovereign bond price information.
2.2 Data
This section the data employed in calculating spread term structures for sovereign bonds starting from bond price and characteristic data. The spreads obtained in this way are exclusive of Preferred Creditor Treatment (PCT) since they reflect the pricing of public bonds held by international investors rather than the pricing of MDB loans to which we shall turn in subsequent sections.
The approach involves the estimation of a risk-adjusted transition matrix from the bond price data. From this one may deduce a term structure of spreads for each rating category for each date in the sample period which is November 2007 to October 2022.
The raw data used in this analysis were gathered by Risk Control and fall into two main categories:
(i) US dollar denominated sovereign bond data
(ii) Interest rate data
Appendix 1 provides an overview of the distribution of the data employed broken down by
• The end-of-sample sovereign ratings (as of 1st November 2022)
• The total number of bonds that have been considered
• The number of bonds that are still active at the end of the analysis period
The total number of active bonds at the end of the period is 474 compared to 724 total bonds that appear in the dataset at some point during the sample period. The dataset was filtered to exclude bond with yields that are either negative or exceed 40.0%.
Figure 2.1 shows the rating distribution of the active sovereign bonds at the end of the period The active bonds are concentrated in three rating grades namely (i) BBB, (ii) BB-, and (iii) B. These account for 40% of all the active bonds.
We adopted the Standard & Poor’s Equivalent Rating Levels as the raw rating basis for determining the unified, desired credit ratings for all the sovereign bond issuers. The Standard & Poor’s Equivalent Rating is an internal rating convention published by Thomson Ratings, which is widely accepted and employed in the market. The approach involves mapping the ratings issued by different rating agencies to their equivalent S&P ratings.
The Standard & Poor’s Equivalent Ratings range from 0 to 27 (inclusive), with valid ranks including 4 (the lowest), 7 – 25, and 27. Higher numbers represent better ratings. After conducting an analysis to assess the correlation between the S&P Equivalent Rating ranks and the typical credit ratings from the three primary rating agencies (Standard & Poor’s, Moody's, and Fitch) in our database, we devised a straightforward yet robust conversion algorithm for mapping the Standard & Poor’s Equivalent Rating ranks to Risk Control's internal credit rating levels that range from 1 to 17.
The algorithm may be summarised as follows: 1) A Standard & Poor’s Equivalent Rating rank of 27 is transformed into a Risk Control internal rating level 1, representing the AAA rating class. 2) The Standard & Poor’s Equivalent Rating ranks between 4 and 10 (inclusive) are treated as 17 internally, corresponding to the CCC/C rating class. 3) The remaining valid rating ranks R[0] (11 through 25) are converted into an internal rating level RI such that R[0] = 27 − RI. These are mapped to the rating classes from B- to AA+.
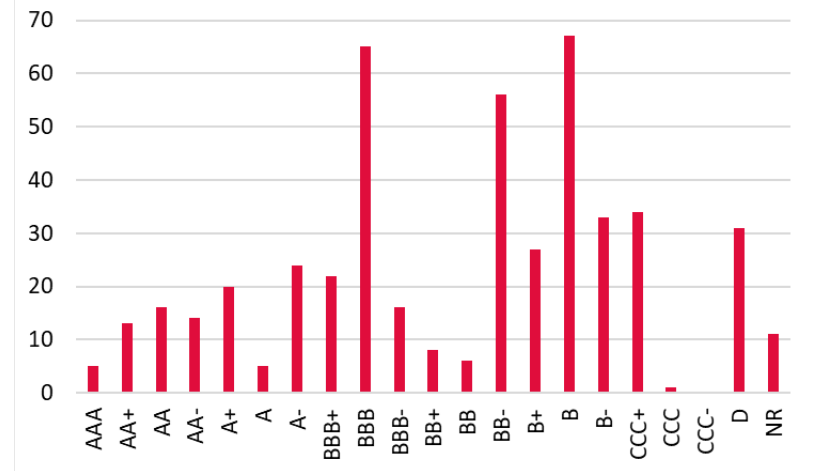
Note: The rating of the sovereign is based on the Standard & Poor’s rating on 1st November 2022. The vertical axis represents the number of active bonds.
2.3 Risk-adjusted TM (without PCT)
This section discusses the methodology employed in obtaining the sovereign bond data to estimate the riskadjusted TM.
For each calendar week within the analysis period, defined as the days between Wednesdays and the subsequent Wednesday, we first select from our bond universe a subset of valid sovereign bonds employed for this analysis. These selections are guided by the following criteria:
The selected bonds should possess complete and accurate information for key characteristics including maturity date, coupon rate, coupon payment frequency, bid and ask quotes, and the issuer's domicile. Consequently, bonds lacking data on any of these variables were eliminated from the analysis.
The remaining time-to-maturity of the selected bonds should be at least one calendar month (i.e., 30 days), but not exceed 30 years. Bonds falling outside this range were excluded from the dataset.
The credit rating information for the bond issuer need to be available in Risk Control’s database, and the update date for this information should not be later than the date of the observed market price for the corresponding bond. Bonds without any valid credit ratings for their issuers were thus excluded from the analysis.
With the selected set of valid sovereign bond data, we compiled a sovereign bond dataset with the essential bond characteristics required for subsequent analysis. These characteristics include: the maturity date, coupon rate, coupon payment frequency, issuer's credit rating, the domicile of the issuer, and the bid and ask quotes.
The variables obtained based on the directly extracted information, including the clean mid-price which is calculated as the average of the bid and ask quotes for the bond, and the bond yield calculated using the above key characteristics.
The subsequent phase of the analysis involved the computation of annual transition matrix using the clean bond prices, following the methodology outlined in the paper by Perraudin, Wu, and Harfush-Pardo (2011) (see Appendix 2 for further details). The calculated transition matrices were averaged out to derive the average spread-based risk-adjusted transition matrix of the sovereign bonds for the analysis period, which is presented in Table 2.1.
| AAA AA+ | AA | AA- A+ | A | A- | BBB+ | BBB | BBB- | BB+ BB | BB- B+ | B | B- | CCC/CC D | ||||||
|---|---|---|---|---|---|---|---|---|---|---|---|---|---|---|---|---|---|---|
| AAA | 89.28 | 7.91 | 1.10 | 0.58 | 0.07 | - | - | - | - | - | - | - | - | - | - | - | - | 1.06 |
| AA+ | 9.86 | 65.28 | 14.21 | 7.49 | 0.82 | 0.73 | - | - | - | - | - | - | - | - | - | - | - | 1.60 |
| AA | 3.30 | 5.52 | 58.30 | 19.20 | 6.00 | 2.71 | 3.00 | - | - | - | - | - | - | - | - | - | - | 1.98 |
| AA- | 0.27 | 0.44 | 1.79 | 48.10 | 8.05 | 3.78 | 32.13 | 3.21 | - | - | - | - | - | - | - | - | - | 2.23 |
| A+ | 0.10 | 0.03 | 0.06 | 0.79 | 34.67 | 5.87 | 44.07 | 8.74 | 3.21 | - | - | - | - | - | - | - | - | 2.44 |
| A | - | 0.00 | 0.00 | 0.00 | 0.22 | 33.21 | 45.43 | 11.09 | 5.34 | 2.19 | - | - | - | - | - | - | - | 2.51 |
| A- | - | - | 0.00 | 0.00 | 0.00 | 0.90 | 60.90 | 18.40 | 12.01 | 4.61 | 0.61 | - | - | - | - | - | - | 2.57 |
| BBB+ | - | - | - | 0.00 | 0.00 | 0.17 | 3.92 | 31.62 | 23.63 | 32.96 | 3.05 | 1.91 | - | - | - | - | - | 2.76 |
| BBB | - | - | - | - | 0.00 | 0.02 | 1.25 | 4.19 | 33.42 | 42.29 | 7.40 | 5.37 | 2.95 | - | - | - | - | 3.11 |
| BBB- | - | - | - | - | - | 0.00 | 0.25 | 1.20 | 3.03 | 50.11 | 13.06 | 17.28 | 9.44 | 2.01 | - | - | - | 3.64 |
| BB+ | - | - | - | - | - | - | 0.00 | 0.00 | 0.00 | 1.17 | 17.09 | 32.68 | 30.46 | 12.57 | 1.44 | - | - | 4.60 |
| BB | - | - | - | - | - | - | - | 0.00 | 0.00 | 0.00 | 0.00 | 33.57 | 37.23 | 20.44 | 3.40 | 0.37 | - | 4.98 |
| BB- | - | - | - | - | - | - | - | - | 0.00 | 0.00 | 0.00 | 0.00 | 43.73 | 38.22 | 9.53 | 2.84 | 0.08 | 5.60 |
| B+ | - | - | - | - | - | - | - | - | - | 0.00 | 0.00 | 0.00 | 0.04 | 52.07 | 21.16 | 18.70 | 1.49 | 6.54 |
| B | - | - | - | - | - | - | - | - | - | - | 0.00 | 0.00 | 0.00 | 0.01 | 32.84 | 49.82 | 9.13 | 8.20 |
| B- | - | - | - | - | - | - | - | - | - | - | - | 0.00 | 0.00 | 0.00 | 0.66 | 68.61 | 18.41 | 12.32 |
| CCC/CC | - | - | - | - | - | - | - | - | - | - | - | - | 0.00 | 0.00 | 0.00 | 0.02 | 49.66 | 50.32 |
| D | - | - | - | - | - | - | - | - | - | - | - | - | - | - | - | - | - | 100.00 |
Note: All entries are in per cent. The recovery rate assumed for the above TM is 50%.
3. PCT-Inclusive Spreads
3.1 Introduction
In the last section, we explained how to estimate a risk-adjusted Transition Matrix using historical sovereign bond prices data for ratings ‘AAA’ to ‘CCC/CC’ (with modifiers) and then use this to estimate rating-specific spreads. These latter spreads are exclusive of PCT as they are computed using market data on sovereign bonds, the holders of which do not enjoy PCT.
We now turn to estimating PCT-adjusted spreads that may be used for pricing MDB loans. The approach consists of several steps:
1. A historical sovereign transition matrix from the Standard & Poor’s (2023b) default study is used as an input to produce regularised Transition Matrix (TM) which has monotonic default probabilities by rating and transition probabilities.
2. The historical PDs using the MDBs non-accrual data is employed from Risk Control (2023) to estimate the historical TM with PCT.
3. The relationship between historical Probability of Default (PDs) without PCT and with PCT is used to infer the relationship between risk-adjusted PDs without PCT and with PCT.
4. The risk-adjusted PD is divided into two states one where it defaults to private creditors (DPC) and other where it defaults to a Multilateral Development Banks (MDBs)
The spread is then obtained using the estimated PD and assumed Loss Given Default (LGD) for the MDB.
3.2 Historical TM
A well-behaved Transition Matrix (TM) possesses the following properties:
• Monotonicity across PDs: The PDs increases as the rating deteriorates.
• Monotonicity across transition probabilities: The probability of transition from a given rating to a different rating drops as we move further away from the current rating (that is the probability of 1notch upgrade should be higher than the probability of 2-notch upgrade).
The historical transition matrix (TM) without PCT is obtained from the Standard & Poor’s (2023b) default study. The raw transition matrix obtained from Standard & Poor’s were missing default probabilities for higher rating grades (‘BBB’ and above) and is not a well-behaved TM.
We modified the raw TM with the following two steps:
1. The proxy default probabilities for the missing rating grades were calculated by log linear interpolation between the available default probability and by assuming the default probability of ‘AAA’ as 1 basis point.
2. The raw TM is transformed into a regular TM by employing a smoothening algorithm (see Appendix 3 for more details) to obtain a well-behaved TM.
The regularised TM has four non-zero terms on either side of the diagonal element, thus demonstrating the possibility of four notch upward or downward movement.
We employ the historical TM without PCT to estimate the historical TM with PCT by bifurcating the default column of the historical TM without PCT into columns (i) Default to Private Creditors (DPC) and (ii) Default (which indicates default to the MDBs). This adds an additional row (and column) to the TM just before the final row (and column), and increases the dimension of the TM to 19 x 19 (earlier it was 18 x 18).
The default column of the historical TM with the PCT is obtained from the PD adjusted with PCT estimate from Risk Control (2023).
We believe that the default to the MDBs is a severe default scenario by a sovereign which happens in a subset of cases when a sovereign defaults to a private creditor. Thus, the probability of sovereign to transition to the DPC state is the remained of the PD (without PCT) and PD (with PCT) for a given rating. This step populates the additional column added in the TM just before the TM.
The transition probabilities from a ‘DPC’ state to another rating grade is obtained from the re-emergence estimate of the historical sovereign defaults after a year in default by the rating agency (see Appendix A1.2). We found that out of 16 defaults which stated in default after a year, 3 transition to a MDB default. We use this estimate to complete the penultimate row of the transition matrix which represents the recovery of sovereigns from a default to private creditors.
| AAA | AA+ | AA | AA- | A+ A | A- | BBB+ | BBB | BBB- | BB+ | BB | BB- | B+ B | B- | CCC/CC | DPC D | ||||
|---|---|---|---|---|---|---|---|---|---|---|---|---|---|---|---|---|---|---|---|
| AAA | 97.10 | 2.81 | 0.08 | 0.00 | 0.00 | - | - | - | - | - | - | - | - | - | - | - | - | - | 0.01 |
| AA+ | 6.65 | 86.22 | 6.86 | 0.21 | 0.00 | 0.00 | - | - | - | - | - | - | - | - | - | - | - | 0.03 | 0.02 |
| AA | 0.19 | 6.85 | 85.71 | 6.93 | 0.23 | 0.00 | 0.00 | - | - | - | - | - | - | - | - | - | - | 0.05 | 0.03 |
| AA- | 0.00 | 0.23 | 7.78 | 84.31 | 7.21 | 0.34 | 0.00 | 0.00 | - | - | - | - | - | - | - | - | - | 0.08 | 0.04 |
| A+ | 0.00 | 0.01 | 0.47 | 13.37 | 76.00 | 9.68 | 0.31 | 0.01 | 0.00 | - | - | - | - | - | - | - | - | 0.10 | 0.05 |
| A | - | 0.00 | 0.01 | 0.85 | 13.18 | 78.86 | 6.66 | 0.24 | 0.01 | 0.00 | - | - | - | - | - | - | - | 0.12 | 0.07 |
| A- | - | - | 0.00 | 0.02 | 0.75 | 11.85 | 79.30 | 7.35 | 0.48 | 0.01 | 0.00 | - | - | - | - | - | - | 0.14 | 0.09 |
| BBB+ | - | - | - | 0.00 | 0.02 | 0.76 | 13.14 | 72.38 | 12.68 | 0.75 | 0.01 | 0.00 | - | - | - | - | - | 0.16 | 0.10 |
| BBB | - | - | - | - | 0.00 | 0.03 | 1.14 | 16.74 | 70.17 | 11.20 | 0.42 | 0.01 | 0.00 | - | - | - | - | 0.16 | 0.14 |
| BBB- | - | - | - | - | - | 0.00 | 0.04 | 1.32 | 14.83 | 75.94 | 7.16 | 0.38 | 0.01 | 0.00 | - | - | - | 0.15 | 0.18 |
| BB+ | - | - | - | - | - | - | 0.00 | 0.06 | 1.54 | 19.91 | 67.55 | 9.83 | 0.59 | 0.02 | 0.00 | - | - | 0.30 | 0.21 |
| BB | - | - | - | - | - | - | - | 0.00 | 0.06 | 1.61 | 14.88 | 70.79 | 11.25 | 0.71 | 0.03 | 0.00 | - | 0.43 | 0.25 |
| BB- | - | - | - | - | - | - | - | - | 0.00 | 0.04 | 0.85 | 10.61 | 74.58 | 12.05 | 1.00 | 0.03 | 0.00 | 0.52 | 0.33 |
| B+ | - | - | - | - | - | - | - | - | - | 0.00 | 0.02 | 0.59 | 10.67 | 70.47 | 15.66 | 0.88 | 0.02 | 1.27 | 0.43 |
| B | - | - | - | - | - | - | - | - | - | - | 0.00 | 0.02 | 0.79 | 13.97 | 71.78 | 10.48 | 0.42 | 1.93 | 0.61 |
| B- | - | - | - | - | - | - | - | - | - | - | - | 0.00 | 0.03 | 1.14 | 15.17 | 69.56 | 7.09 | 6.15 | 0.86 |
| CCC/CC | - | - | - | - | - | - | - | - | - | - | - | - | 0.00 | 0.00 | 0.11 | 1.91 | 52.95 | 43.24 | 1.78 |
| DPC | - | - | - | - | - | - | - | - | - | - | - | - | - | - | 4.55 | 27.27 | 31.82 | 29.55 | 6.82 |
| D | - | - | - | - | - | - | - | - | - | - | - | - | - | - | - | - | - | - | 100.00 |
Note: All entries are in per cent. Here DPC denotes Default to Private Creditors.
3.3 Risk-adjusted TM with PCT
We estimate the risk-adjusted TM (RATM) with PCT by starting with the Risk-adjusted TM without PCT of dimension 18×18 (17 rating grades + 1 default state). We postulate default to the private creditors is an extreme case when the sovereign defaults to the private creditors (that is to the capital market) is extended to defaults to the MDBs. Thereby the transition probabilities from one rating to another rating grade remains similar to the base case.
We bifurcate the default column of the base case into columns (i) Default to Private Creditors (DPC) and (ii) Default (which indicates default to the MDBs), for the risk-adjusted TM with PCT. This adds an additional row (and column) to the TM just before the final row (and column), and increases the dimension of the TM to 19 x 19 (earlier it was 18 x 18).
The ratio in which the default column of the base case is bifurcated is based on the average ratio of PD without PCT to PD with PCT (see Table 3.2) which is 4.25[5].
The transition probabilities from a ‘DPC’ state to another rating grade is obtained from the re-emergence estimate of the historical sovereign defaults after a year in default by the rating agency (see Appendix A1.2). We found that out of 16 defaults which stated in default after a year, 3 transition to a MDB default. We use this estimate to complete the penultimate row of the transition matrix which represents the recovery of sovereigns from a default to private creditors.
5 The PD with PCT is calculated as the PD without PCT divided by 4.25. The transition from a rating i to DPC is the difference between default probabilities without PCT and with PCT
Table 3.2 provides the PDs employed for the different TMs in this study
1. Historical TM without PCT (from Standard & Poor’s (2023b) default study, see Table A3.1)
2. Historical TM with PCT (from Risk Control (2023) study on PCT, see Table 3.1)
3. Risk-adjusted TM without PCT (using sovereign bond data, see Table 2.1)
4. Risk-adjusted TM with PCT (see Table 3.3)
| Historical | Risk-adjusted | |||
|---|---|---|---|---|
| Ratio | of | |||
| W/o | With w/o | PCT to | W/o With | |
| PCT PCT | with | PCT | PCT PCT | |
| AAA | 0.01 | 0.01 | 1.00 | 1.06 0.25 |
| AA+ | 0.05 | 0.02 | 2.15 | 1.60 0.38 |
| AA | 0.08 | 0.03 | 2.50 | 1.98 0.47 |
| AA- | 0.12 | 0.04 | 2.67 | 2.23 0.52 |
| A+ | 0.15 | 0.05 | 2.77 | 2.44 0.57 |
| A | 0.19 | 0.07 | 2.72 | 2.51 0.59 |
| A- | 0.22 | 0.09 | 2.62 | 2.57 0.60 |
| BBB+ | 0.26 | 0.10 | 2.50 | 2.76 0.65 |
| BBB | 0.29 | 0.14 | 2.17 | 3.11 0.73 |
| BBB- | 0.33 | 0.18 | 1.88 | 3.64 0.86 |
| BB+ | 0.50 | 0.21 | 2.45 | 4.60 1.08 |
| BB | 0.68 | 0.25 | 2.74 | 4.98 1.17 |
| BB- | 0.85 | 0.33 | 2.56 | 5.60 1.32 |
| B+ | 1.70 | 0.43 | 3.97 | 6.54 1.54 |
| B | 2.54 | 0.61 | 4.16 | 8.20 1.93 |
| B- | 7.01 | 0.86 | 8.14 | 12.32 2.90 |
| CCC/CC | 45.03 | 1.78 | 25.23 | 50.32 11.84 |
| Average | 4.25 |
Note: All PDs are in percent. The PD for CCC/CC is calculated as weighted average of the PDs for ‘CCC+’, ‘CCC’, ‘CCC-’ and ‘CC’ which is concentrated at ‘CCC’.
| AAA | AA+ | AA | AA- | A+ A | A- | BBB+ | BBB | BBB- | BB+ | BB | BB- | B+ B | B- | CCC/CC | DPC D | ||||
|---|---|---|---|---|---|---|---|---|---|---|---|---|---|---|---|---|---|---|---|
| AAA | 89.28 | 7.91 | 1.10 | 0.58 | 0.07 | - | - | - | - | - | - | - | - | - | - | - | - | 0.81 | 0.25 |
| AA+ | 9.86 | 65.28 | 14.21 | 7.49 | 0.82 | 0.73 | - | - | - | - | - | - | - | - | - | - | - | 1.22 | 0.38 |
| AA | 3.30 | 5.52 | 58.30 | 19.20 | 6.00 | 2.71 | 3.00 | - | - | - | - | - | - | - | - | - | - | 1.51 | 0.47 |
| AA- | 0.27 | 0.44 | 1.79 | 48.10 | 8.05 | 3.78 | 32.13 | 3.21 | - | - | - | - | - | - | - | - | - | 1.71 | 0.52 |
| A+ | 0.10 | 0.03 | 0.06 | 0.79 | 34.67 | 5.87 | 44.07 | 8.74 | 3.21 | - | - | - | - | - | - | - | - | 1.86 | 0.57 |
| A | - | 0.00 | 0.00 | 0.00 | 0.22 | 33.21 | 45.43 | 11.09 | 5.34 | 2.19 | - | - | - | - | - | - | - | 1.92 | 0.59 |
| A- | - | - | 0.00 | 0.00 | 0.00 | 0.90 | 60.90 | 18.40 | 12.01 | 4.61 | 0.61 | - | - | - | - | - | - | 1.96 | 0.60 |
| BBB+ | - | - | - | 0.00 | 0.00 | 0.17 | 3.92 | 31.62 | 23.63 | 32.96 | 3.05 | 1.91 | - | - | - | - | - | 2.11 | 0.65 |
| BBB | - | - | - | - | 0.00 | 0.02 | 1.25 | 4.19 | 33.42 | 42.29 | 7.40 | 5.37 | 2.95 | - | - | - | - | 2.38 | 0.73 |
| BBB- | - | - | - | - | - | 0.00 | 0.25 | 1.20 | 3.03 | 50.11 | 13.06 | 17.28 | 9.44 | 2.01 | - | - | - | 2.78 | 0.86 |
| BB+ | - | - | - | - | - | - | 0.00 | 0.00 | 0.00 | 1.17 | 17.09 | 32.68 | 30.46 | 12.57 | 1.44 | - | - | 3.52 | 1.08 |
| BB | - | - | - | - | - | - | - | 0.00 | 0.00 | 0.00 | 0.00 | 33.57 | 37.23 | 20.44 | 3.40 | 0.37 | - | 3.81 | 1.17 |
| BB- | - | - | - | - | - | - | - | - | 0.00 | 0.00 | 0.00 | 0.00 | 43.73 | 38.22 | 9.53 | 2.84 | 0.08 | 4.28 | 1.32 |
| B+ | - | - | - | - | - | - | - | - | - | 0.00 | 0.00 | 0.00 | 0.04 | 52.07 | 21.16 | 18.70 | 1.49 | 5.00 | 1.54 |
| B | - | - | - | - | - | - | - | - | - | - | 0.00 | 0.00 | 0.00 | 0.01 | 32.84 | 49.82 | 9.13 | 6.27 | 1.93 |
| B- | - | - | - | - | - | - | - | - | - | - | - | 0.00 | 0.00 | 0.00 | 0.66 | 68.61 | 18.41 | 9.42 | 2.90 |
| CCC/CC | - | - | - | - | - | - | - | - | - | - | - | - | 0.00 | 0.00 | 0.00 | 0.02 | 49.66 | 38.48 | 11.84 |
| DPC | - | - | - | - | - | - | - | - | - | - | - | - | - | - | 4.55 | 27.27 | 31.82 | 29.55 | 6.82 |
| D | - | - | - | - | - | - | - | - | - | - | - | - | - | - | - | - | - | - | 100.00 |
Note: All entries are in per cent. Here DPC denotes Default to Private Creditors. The recovery rate assumed for the above TM is 15%.
3.4 Spreads
The risk-adjusted spreads using the risk-adjusted TM is obtained by calculating the cumulative probability of defaults by taking the power of the TM and using the default column of the resulting matrix. The spreads are estimated using the cumulative PDs using the equation 3.2. Similarly, we estimate the risk-neutral term structure using the historical TM.
(3.2) s= − ln((1 −PDi) + PDi × (1 −LGD)) t
For conservative estimates, we employ an LGD of 15% which is higher than that of a commonly assumed MDB LGD of 10% see Risk Control (2022).
The obtained risk-adjusted spread-term structure (see Table 3.5) is monotonic across all rows, which represents higher spread as the rating downgrades. The spread term structure is not monotonic across all the columns, the spread monotonically increases for longer maturity for ratings ‘AAA’ to ‘B. It is only for the ‘B-’ and ‘CCC/CC’ the spreads are not strictly increasing with maturity (see Figure 3.1).
In the Figure 3.1, the risk-neutral spread term structure looks flat compared to risk-adjusted spread term structure. The significant difference in the shape of the term-structure between Panel a) and Panel b) of Figure 3.1 occurs for ‘CCC/CC’ rating grade. For the risk-neutral the curve is flatter compared to a downward sloping curve for the risk-adjusted.
The risk-neutral and risk-adjusted spread term structure without PCT is provided in Appendix A3.
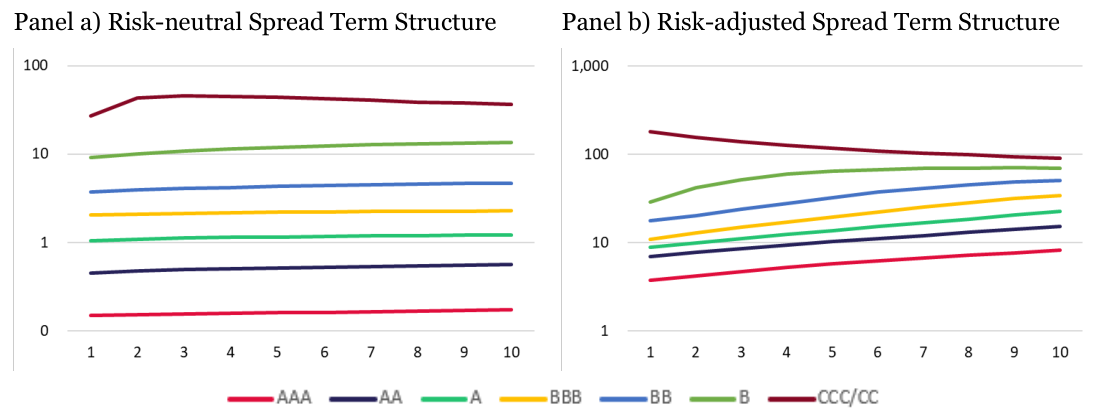
Note: The unit of spread is in basis point. Here the horizontal scale represents maturity (in years).
| AAA | AA+ | AA | AA- | A+ | A | A- | BBB+ BBB | BBB- | BB+ | BB | BB- | B+ | B | B- | CCC/CC | ||
|---|---|---|---|---|---|---|---|---|---|---|---|---|---|---|---|---|---|
| Rating | |||||||||||||||||
| 1 | 0.00 | 0.00 | 0.00 | 0.01 | 0.01 | 0.01 | 0.01 | 0.02 | 0.02 | 0.03 | 0.03 | 0.04 | 0.05 | 0.06 | 0.09 | 0.13 | 0.27 |
| 2 | 0.00 | 0.00 | 0.00 | 0.01 | 0.01 | 0.01 | 0.01 | 0.02 | 0.02 | 0.03 | 0.03 | 0.04 | 0.05 | 0.07 | 0.10 | 0.16 | 0.43 |
| 3 | 0.00 | 0.00 | 0.00 | 0.01 | 0.01 | 0.01 | 0.01 | 0.02 | 0.02 | 0.03 | 0.03 | 0.04 | 0.05 | 0.08 | 0.11 | 0.18 | 0.45 |
| 4 | 0.00 | 0.00 | 0.01 | 0.01 | 0.01 | 0.01 | 0.01 | 0.02 | 0.02 | 0.03 | 0.03 | 0.04 | 0.06 | 0.08 | 0.11 | 0.19 | 0.45 |
| 5 | 0.00 | 0.00 | 0.01 | 0.01 | 0.01 | 0.01 | 0.01 | 0.02 | 0.02 | 0.03 | 0.03 | 0.04 | 0.06 | 0.08 | 0.12 | 0.20 | 0.44 |
| 6 | 0.00 | 0.00 | 0.01 | 0.01 | 0.01 | 0.01 | 0.01 | 0.02 | 0.02 | 0.03 | 0.03 | 0.04 | 0.06 | 0.09 | 0.12 | 0.20 | 0.42 |
| 7 | 0.00 | 0.00 | 0.01 | 0.01 | 0.01 | 0.01 | 0.01 | 0.02 | 0.02 | 0.03 | 0.03 | 0.04 | 0.06 | 0.09 | 0.13 | 0.21 | 0.40 |
| 8 | 0.00 | 0.00 | 0.01 | 0.01 | 0.01 | 0.01 | 0.01 | 0.02 | 0.02 | 0.03 | 0.03 | 0.05 | 0.06 | 0.09 | 0.13 | 0.21 | 0.39 |
| 9 | 0.00 | 0.00 | 0.01 | 0.01 | 0.01 | 0.01 | 0.02 | 0.02 | 0.02 | 0.03 | 0.03 | 0.05 | 0.07 | 0.10 | 0.13 | 0.21 | 0.37 |
| 10 | 0.00 | 0.00 | 0.01 | 0.01 | 0.01 | 0.01 | 0.02 | 0.02 | 0.02 | 0.03 | 0.03 | 0.05 | 0.07 | 0.10 | 0.14 | 0.21 | 0.36 |
Note: All spreads are in per cent. The highlighted row is assumed as the average maturity of MDB sovereign loans.
| AAA | AA+ | AA | AA- | A+ | A | A- | BBB+ BBB | BBB- | BB+ | BB | BB- | B+ | B | B- | CCC/CC | ||
|---|---|---|---|---|---|---|---|---|---|---|---|---|---|---|---|---|---|
| /Rating | |||||||||||||||||
| 1 | 0.04 | 0.06 | 0.07 | 0.08 | 0.09 | 0.09 | 0.09 | 0.10 | 0.11 | 0.13 | 0.16 | 0.18 | 0.20 | 0.23 | 0.29 | 0.44 | 1.79 |
| 2 | 0.04 | 0.06 | 0.08 | 0.09 | 0.10 | 0.10 | 0.10 | 0.12 | 0.13 | 0.15 | 0.19 | 0.20 | 0.23 | 0.29 | 0.42 | 0.58 | 1.55 |
| 3 | 0.05 | 0.07 | 0.09 | 0.10 | 0.11 | 0.11 | 0.12 | 0.13 | 0.15 | 0.17 | 0.22 | 0.24 | 0.27 | 0.36 | 0.52 | 0.67 | 1.39 |
| 4 | 0.05 | 0.08 | 0.09 | 0.11 | 0.12 | 0.12 | 0.13 | 0.15 | 0.17 | 0.20 | 0.26 | 0.28 | 0.33 | 0.43 | 0.59 | 0.72 | 1.26 |
| 5 | 0.06 | 0.08 | 0.10 | 0.12 | 0.13 | 0.14 | 0.14 | 0.17 | 0.19 | 0.23 | 0.30 | 0.32 | 0.38 | 0.49 | 0.64 | 0.75 | 1.17 |
| 6 | 0.06 | 0.09 | 0.11 | 0.13 | 0.15 | 0.15 | 0.16 | 0.20 | 0.22 | 0.26 | 0.34 | 0.37 | 0.43 | 0.53 | 0.67 | 0.76 | 1.10 |
| 7 | 0.07 | 0.10 | 0.12 | 0.15 | 0.16 | 0.17 | 0.18 | 0.22 | 0.25 | 0.30 | 0.39 | 0.41 | 0.47 | 0.57 | 0.69 | 0.76 | 1.04 |
| 8 | 0.07 | 0.10 | 0.13 | 0.16 | 0.18 | 0.19 | 0.20 | 0.25 | 0.28 | 0.33 | 0.42 | 0.45 | 0.51 | 0.59 | 0.70 | 0.76 | 0.98 |
| 9 | 0.08 | 0.11 | 0.14 | 0.18 | 0.20 | 0.21 | 0.22 | 0.28 | 0.31 | 0.37 | 0.46 | 0.48 | 0.53 | 0.61 | 0.70 | 0.75 | 0.94 |
| 10 | 0.08 | 0.12 | 0.15 | 0.19 | 0.22 | 0.23 | 0.25 | 0.31 | 0.34 | 0.40 | 0.48 | 0.51 | 0.55 | 0.62 | 0.70 | 0.74 | 0.90 |
Note: All spreads are in per cent. The highlighted row is assumed as the average maturity of MDB sovereign loans.
4. Fair-value Price of MDB Portfolio
4.1 Risk-adjusted Spread of MDB Portfolio
In this section, we estimate the fair value price of the MDB Sovereign portfolio for the four regional banks (i) Asian Development Bank (ADB), (ii) African Development Bank (AfDB), (iii) International Bank for Reconstruction and Development (IBRD), and (iv) Inter-American Development Bank (IDB).
We use the public data issued by the MDBs in their annual financial statement to obtain sovereign outstanding loans by country for the four MDBs (see ADB (2023), AfDB (2023), IBRD (2022), IDB (2023)). The annual report is as of end of fiscal year 2022[6]. The sovereigns were assigned a credit rating based on the following agencies in the order of priority Standard & Poor’s, Moody’s, Fitch, and OECD[7].
The sovereign ratings distribution across the four MDBs is demonstrated in Figure 4.1 which shows ADB and IBRD have a wider diversity of sovereign borrowers from different ratings starting from ‘A+’ (China) compared to AfDB and IDB.
The cumulative distribution of sovereign loans (see Figure 4.2) shows ADB and IBRD have similar distribution of sovereign borrowers by ratings. AfDB has the higher proportion of sovereign loans in speculative grade compared to the other three MDBs. The sovereign loan distribution of IDB is between ADB and AfDB.
The weighted average of sovereign portfolio for an MDB ranges from 7 to 9 years. In this study we assume an average maturity of 9 years. Thus, we calculate the fair-price (risk-adjusted spread) inclusive of PCT for each sovereign loan using Table 3.5.
We assume that each MDB sovereign loans are a 9-year pure-discounted bond and calculate the annual EL for a given sovereign rating. We estimate the annual Expected Loss (EL) of the MDB portfolio by calculating weighted average spread of sovereign loans by outstanding sovereign loan amount. We utilize the following the four spread estimates to calculate the weighted average annual spread[8]:
(i) EL (risk-neutral spread) with PCT (see Table 3.4),
(ii) Fair-price (risk-adjusted spread) with PCT (see Table 3.5),
(iii) EL (risk-neutral spread) without PCT (see Table A4.2), and
(iv) Fair-price (risk-adjusted spread) without PCT (see Table A4.3).
Table 4.1 provides the weighted average spread for the four MDBs. The annualised EL (inclusive of PCT) ranges from 9 basis points (bps) to 16 bps, there is not a huge variation between the various MDBs. The fair-value price which is the risk-adjusted portfolio spread for the MDB ranges from 49 bps to 66 bps. The average fair value price is around 4.7 times the average annual EL.
Figure 4.3 shows that the for a ‘B+’ portfolio rating risk-neutral spread is flat compared to the risk-adjusted spread which has a positive slope. The risk-adjusted term structure starts to flatten after 8 years.
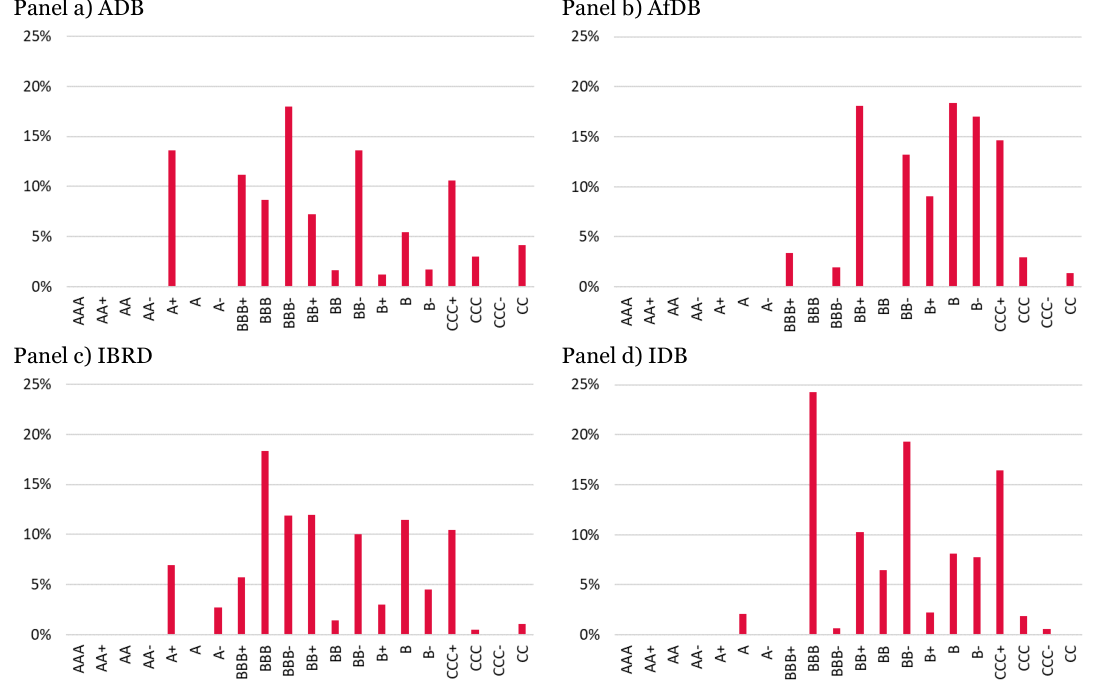
Note: Here OL denotes Outstanding Loan. The vertical axis represents percentage of OL. The ratings data is based on end of fiscal year 2022 determined on the priority of Standard & Poor’s, Moody’s, Fitch and Organisation for Economic Co- operation and Development (OECD).
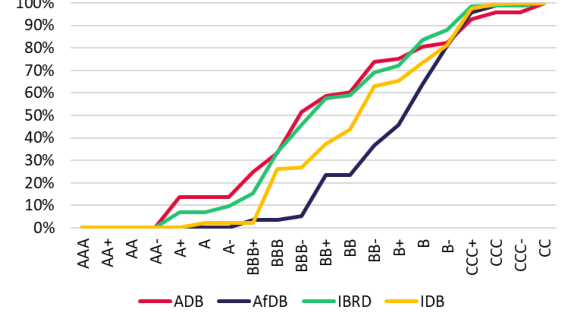
Note: Here OL denotes Outstanding Loan. The vertical axis represents cumulative percentage of OL. The ratings data is based on end of fiscal year 2022 determined on the priority of Standard & Poor’s, Moody’s, Fitch and Organisation for Economic Co-operation and Development (OECD).
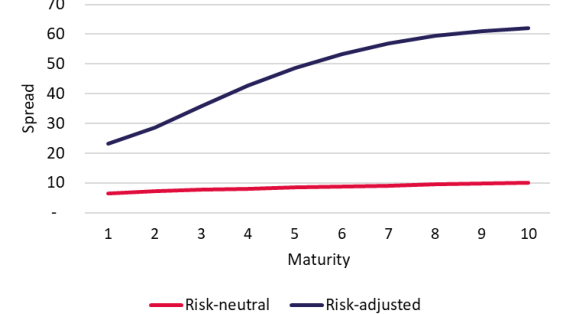
Note: The spread term structure for a weighted average MDB portfolio of rating ‘B+’ is shown. Here the spread is in basis points and maturity in years.
| With PCT | Without | PCT | |||
|---|---|---|---|---|---|
| EL | Fair- | EL | Fair- | ||
| (Annual) Price | (Annual) | Price | |||
| ADB | 0.10 | 0.49 | 1.61 | 4.41 | |
| AfDB | 0.16 | 0.66 | 2.47 | 5.95 | |
| IBRD | 0.09 | 0.50 | 1.40 | 4.55 | |
| IDB | 0.13 | 0.57 | 1.98 | 5.16 |
Note: All entries are in per cent. The spread is estimated based on an average maturity of 9 years. Here EL denoted Expected Loss. Both the EL and the fair-price is computed for a pure-discount bond of maturity of 9 years using equation 3.2.
4.2 MDB Lending Spreads
Here, we discuss the spread charged by the MDBs on its flexible sovereign loans. The four MDBs considered in this study have some similarities on the components considered in calculating the spread on flexible loan.
The spread depends on the following factors:
1. The currency of the loan disbursement
2. The base rate
3. The tenure of the loan
4. The contractual spread
5. The funding margin (cost of the borrowing compared to the benchmark rate)
MDBs charge additional front-end and commitment fees which are not allowed for in this study.
We compare the contractual spread charged by the MDBs to the borrowers with the fair-price estimated in this study in Figure 4.4. The figure demonstrates the contractual spread charged over the SOFR for a sovereign borrower by the four MDBs. The estimated fair-price is close to the contractual spread charged by the ADB and IBRD at 50 basis points. While we do estimate a higher fair-price for AfDB and IDB it is below 70 basis point lower than the 80 basis point charged by the MDBs.
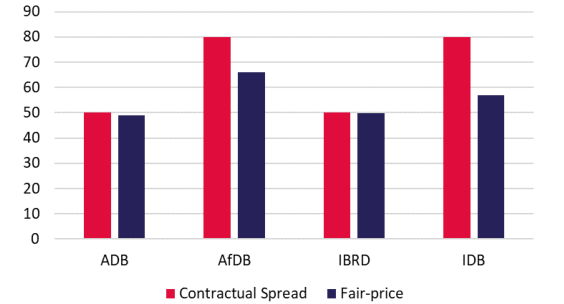
Note: The contractual spread (in basis points) is calculated for a country with a rating 'B-'. The lending terms are based on January 2024 from ADB (2024), AfDB (2024), IBRD (2024), and IDB (2024).
5. Conclusion
This study shows how one may value the loan portfolios of non-traded sovereign loans held by Multilateral Development Banks (MDBs). For the sovereign loan portfolios of four major MDBs, ADB, AfDB, and IBRD, we calculate hold-to maturity Expected Losses (Els), assuming durations of 9 years which closely resembles figures either provided by the banks or estimated by Risk Control.
The ELs are computed using (i) historical statistics, in which case, we obtain estimates relevant for provisioning, and (ii) risk-adjusted statistics, in which case the ELs, expressed in percentage terms, may be regarded as fair premiums for guarantees or credit insurance contracts or fair spreads for a funded bond or loan contract. The different ELs are calculated with and without PCT adjustments and, hence, are relevant for understanding the fair pricing of public bonds and commercial bank loans and or MDB loans.
Our primary conclusion is that the fair spread on MDB loans inclusive of PCT is between 49 and 66 basis points. The fair spread for these very same portfolios omitting PCT is between 441 and 595 basis points, approximately 10x higher.
References
African Development Bank (2023) “Financial Report 2022,” May, available at: https://www.afdb.org/en/documents/financial-report-2022.
African Development Bank (2024) “FFL Terms and Conditions,” February, available at: https://www.afdb.org/en/projects-operations-financial-products-african-development-bank-loans/ffl-termsand-conditions.
Asian Development Bank (2023) “Financial Report 2022,” March, available at: https://www.adb.org/sites/default/files/institutional-document/872636/adb-financial-report-2022.pdf.
Asian Development Bank (2024) “Lending Policies and Rates,” February, available at: https://www.adb.org/what-we-do/public-sector-financing/lending-policies-rates.
Harfush-Pardo, Mariam, William Perraudin and Shi Wu (2010) “The estimation of credit spread term structures,” November.
International Bank for Reconstruction and Development (2022) “Management’s Discussion & Analysis and Financial Statements June 30.2022,” available at: https://thedocs.worldbank.org/en/doc/16796f0d7a20087d312ec8634ace777c-0040012022/original/IBRD- Financial-Statements-June-2022.pdf.
International Bank for Reconstruction and Development (2024) “Lending Rates & Fees,” February, available at: https://treasury.worldbank.org/en/about/unit/treasury/ibrd-financial-products/lending-rates-and-fees.
Inter-American Development Bank (2023) “Annual Report 2022 Financial Statements,” available at: https://publications.iadb.org/en/inter-american-development-bank-annual-report-2022-financial-statements.
Inter-American Development Bank (2024) “Historic Loan Charges Flexible Financing Facility and Single Currency Facility – SOFR _ USD,” available at: https://www.iadb.org/document.cfm?id=EZSHARE- 1436601171-376.
Moody’s (2023) “Sovereign default and recovery rates, 1983-2022” available at: https://www.moodys.com/research/Sovereigns-Global-Sovereign-default-and-recovery-rates-1983-2022- Sector-In-Depth--PBC_1358913.
Standard & Poor’s (2023a) “Credit Trends: The Cost Of A Notch: Markets Brace For Impact Ahead Of Time,” available at: https://www.spglobal.com/ratings/en/research/articles/230627-credit-trends-the-cost-of-anotch-markets-brace-for-impact-ahead-of-time-12771262.
Standard & Poor’s (2023b) “Default, Transition, and Recovery: 2022 Annual Global Sovereign Default and Rating Transition Study,” April, available at: https://www.spglobal.com/ratings/en/research/articles/230428default-transition-and-recovery-2022-annual-global-sovereign-default-and-rating-transition-study-12695994.
Risk Control (2017) “Preferred Creditor Treatment and Risk Transfer,” December.
Risk Control (2022) “MDB Loan Credit Performance and PCT – Public Data Analysis,” December, available at: https://www.riskcontrollimited.com/wp-content/uploads/2023/05/MDB-Loan-Credit-Performance-and-PCT- Public-Data-Analysis-22-133a-12-12-22-v18.pdf.
Risk Control (2023) “Quantifying PCT by Rating Grade,” December.
Risk Control (2024) “Capital Adequacy Benchmarking for MDBs,” February.
Appendix 1: Sovereign Bond Data
A1.1: Distribution of Sovereign Bonds in the Sample by Rating Table A1: Sovereign Bond Distribution by Ratings
Rating AAA AA+ AA AA- A+ A A- BBB+ BBB BBB- BB+ BB BB- B+ B B- CCC+ CCC CCC- D NR
Total 74 67 19 20 30 11 28 26 78 18 21 7 62 34 78 39 53 1 0 42 16 Bonds
Active 5 13 16 14 20 5 24 22 65 16 8 6 56 27 67 33 34 1 0 31 11 Bonds Note: The rating of the sovereign is based on the Standard & Poor’s rating on 1st November 2022.
A1.2: Re-emergence Rating from Sovereign Defaults In this subsection we study the statistics of re-emergence rating of a Sovereign Default by Standard & Poor’s. Standard & Poor’s lists 49 countries in ‘Selective Default’ (SD)[9] in the Standard & Poor’s (2023b) (see Table 14) default study of sovereigns.
We obtain the Standard & Poor’s rating of the sovereign on the date of the re-emergence for each defaulted country and estimate the frequency of the rating to be assigned to different rating grades after default. Due to lack of ratings data of 5 countries when they re-emerged from default it is removed from the final table (see Appendix A1.3 for the dataset).
A sovereign re-emerges from default to primarily into three rating states namely: (i) ‘B-’, (ii) ‘CCC+’, and ‘D’ rating grades as seen Table A1.2. These three rating states accounts for 86% of all the default sovereign ratings data.
Majority of the countries which remained in default after a year of assigned rating ‘SD’ happened in recent time, 10 of the 16 observations were found in the last decade. We further observed that 3 of the 16 which remained in the default to the ‘Foreign Currency’ (FC) bonds, those sovereigns also defaulted to MDBs.
It is interesting to note that most of the sovereign’s default to private creditors had exposure to International Bank for Reconstruction and Development (IBRD) as seen in Table A1.1.
Table A1.2: Re-emergence Rating of Sovereign Defaults in 1 Year
Rating Count %
B 2 5%
B- 12 27%
CCC+ 10 23%
CCC 1 2%
CCC- 1 2%
CC 2 5%
D 16 36%
Total 44 100%
Table A1.3: Re-emergence Data
Selective Rating one Rating Time in SD,
Default Emergence Time year before three years Remergence less than 1 Outstanding Defaulted
Country Date Date in 'SD' 'SD' before 'SD' Rating year with IBRD to MDB
Russia, first default Jan. 27, 1999 Dec. 8, 2000 22 months BB- - B- No Yes No
Pakistan Jan. 29, 1999 Dec. 21, 1999 11 months B+ B+ B- Yes Yes No
Indonesia, first default Mar. 29, 1999 Mar. 30, 1999 One day B- BBB CCC+ Yes Yes No
Indonesia, second default§ Apr. 17, 2000 Oct. 2, 2000 Six months CCC+ BBB B- Yes Yes No
Argentina, first default Nov. 6, 2001 Jun. 01, 2005 54 months BB BB B- No Yes No
Indonesia, third default Apr. 22, 2002 Sep. 5, 2002 Four months B- CCC+ CCC+ Yes Yes No
Paraguay Feb. 13, 2003 Jul. 26, 2004 18 months B B B- No Yes No
Uruguay May 16, 2003 Jun. 02, 2003 One month BB- BBB- NA Yes Yes No
Grenada, first default Dec. 30, 2004 Nov. 18, 2005 11 months BB- - NA Yes Yes No
Venezuela, first default Jan. 18, 2005 Mar. 03, 2005 One month B- B B Yes Yes No
Dominican Republic Feb. 1, 2005 Jun. 29, 2005 Five months CCC BB- NA Yes Yes No
Belize, first default Dec. 7, 2006 Feb. 20, 2007 Three months CCC- B+ B Yes Yes No
Seychelles* Aug. 7, 2008 - - B - NA No Yes No
Ecuador, first default Dec. 15, 2008 Jun. 15, 2009 Six months B- CCC+ CCC+ Yes Yes No
Jamaica, first default Jan. 14, 2010 Feb. 24, 2010 One month B B B- Yes Yes No
Greece, first default Feb. 27, 2012 May. 2, 2012 Two months BB+ A- CCC Yes No NA
Mali Mar. 31, 2012 - - - - NA No No NA
Belize, second default Aug. 21, 2012 Mar. 20, 2013 Seven months B- B B- Yes Yes No
Grenada, second default Oct. 8, 2012 Oct. 16, 2012 One week B- B- NA Yes Yes No
Greece, second default Dec. 5, 2012 Dec. 18, 2012 Two weeks CC A- B- Yes No NA
Jamaica, second default Feb. 12, 2013 Mar. 06, 2013 22 days B- SD CCC+ Yes Yes No
Grenada*, third default Mar. 12, 2013 - - B- B- NA No Yes No
Cyprus Jun. 28, 2013 Jul. 03, 2013 Five days BB+ A+ CCC+ Yes No NA
Argentina, second default Jul. 30, 2014 May 06, 2016 22 months B- B B- Yes Yes No
Ukraine, first default Sep. 25, 2015 Oct. 19, 2015 One month CCC B+ B- Yes Yes No
Mozambique, first default Apr. 01, 2016 April 15, 2016 15 days B B+ B- Yes Yes No
Congo-Brazzaville, first default Aug. 02, 2016 Aug. 09, 2016 One week B - B- Yes Yes No
Mozambique, second default Jan. 18, 2017 Nov. 22, 2019 34 months B- B+ CCC+ No Yes No
Belize, third default Mar. 17, 2017 Mar. 23, 2017 Six days B- B- B- Yes Yes No
El Salvador, first default Apr. 20, 2017 May 5, 2017 15 days B+ BB- CC Yes Yes No
Congo-Brazzaville, second default Aug. 01, 2017 Sept. 5, 2017 One month B- B+ CCC+ Yes Yes No
El Salvador, second default Oct. 02, 2017 Oct. 03, 2017 One day B+ BB- CCC+ Yes Yes No
Venezuela, second default Nov. 13, 2017 - - CCC CCC+ NA No Yes Yes
Barbados Jun. 06, 2018 Dec. 11, 2019 Eighteen months CCC+ B B- No Yes No
Argentina, third default Aug. 29, 2019 Aug. 30, 2019 One day B+ B- CCC- Yes Yes No
Argentina, fourth default§ Dec. 20, 2019 Dec. 30, 2019 Ten days B B- CC Yes Yes No
Lebanon Mar. 11, 2020 - - B- B- NA No Yes No
Argentina, fifth default Apr. 07, 2020 Sep. 07, 2020 Five months B B CCC+ Yes Yes No
Ecuador, second default Apr. 13, 2020 Sep. 01, 2020 Four months B- B B- Yes Yes No
Suriname, first default Jul. 13, 2020 Jul. 16, 2020 Three days B B NA Yes Yes No
Belize, fourth default Aug. 12, 2020 Aug. 21, 2020 Nine days B- B- CCC+ Yes Yes No
Zambia Oct. 21, 2020 - - CCC+ B NA No No NA
Suriname, second default Nov. 06, 2020 - - B B NA No Yes No
Belize, fifth default May 24, 2021 Nov. 09, 2021 Five months CCC B- B- Yes Yes No
Russia, second default Apr. 08, 2022 - - BBB- BBB- NA No Yes No
Sri Lanka Apr. 25, 2022 - - CCC+ B NA No Yes Yes
Belarus Aug. 03, 2022 - - B B NA No Yes Yes
Ukraine, second default Aug. 12, 2022 Aug. 19, 2022 Seven days B B- CCC+ Yes Yes No
Ghana Dec. 20, 2022 - - B- B NA No No NA Note: The first 6 columns of the table are reproduced from Standard & Poor’s (2023b).
Appendix A2: Bond Price to Transition Matrix Methodology
(r) i= 1,2, . . , N. Consider a set of bonds with ratings r= {1, 2, … , R} and prices Bi
Ji (A2.1) Bi = ∑j=1 ci,jexp[−(γτi,j + Sτ(r)i,j)τi,j]
where ci,j for j= 1,2, . . . , Ji are the cash flows of bond i. τi,j are the cash flows dates for j= 1,2, . . . , Ji. rτi,j is the government rate with maturityτi,j. Suppose that the τi,j dates are discretised so that τi,j are all integers and that ratings evolve according to a Markov chain with transition matrix M. The transition matrix has the following shape: ⋯ θ1,1 θ1,D ⋮ ⋱ ⋮ M= [ ] (A2.2) … θR,1 θR,D 0 ⋯ 1
where θi,j denotes the probability of a bond moving from rating i to rating j in one year. The last column of the
(j) be the right hand column of the jth power of M, transition matrix represents the probability of default. Let θD
(j) for i={1,2,…,R}. Given a time homogenous for j={1,…,30} and let θi,D(j) be the i-element of the vector θD transition matrix M, we can price a bond as:
Ji (j))(1 −γ)) (A2.3) B̃i = ∑j=1 ci,j exp[−rjj] (γ+ (1 −θi,D
where γ is the expected recovery rate (in this study we assume a recovery rate of 50% as observed by Moody’s
(2023) study), for simplicity, this is a constant across all rating categories; and rj is the Treasury zero-coupon interest rate for a bond with maturity J.
If M is parameterized in a suitable manner, M= M(θ̃), we can minimize the sum of squared differences between the estimated prices in equation (A2.3) and the observed prices over the vector θ̃. To enforce appropriate properties for M(θ̃), we parameterize it as follows.
⋯ Φ(θ̃1,2) Φ(θ̃1,D) 1 − Φ(θ̃1,2) −Φ(θ̃1,D) 2 2
Φ(θ̃2,1) 1 −Φ(θ̃2,1) −Φ(θ̃2,3) −∑Φ(θ̃i,D) ∑Φ(θ̃i,D) M (θ̃) = (A2.4)
i=1 i=1 ⋮ … ⋱ ⋮ [ 0 0 ⋯ 1 ]
Here, Φ(. )represents the cumulative standard normal distribution.
Once the optimization routine converges or the maximum number of 2,000 iterations is exceeded, we report the vector of parameters θ̃ such that the function is minimized.
Appendix A3: Transition Matrix Regularisation Methodology
We need a well-behaved 1-year Transition Matrix (TM) so we can infer it by using a TM for a shorter time step, for example monthly or quarterly time step. In this study we use a quarterly time step.
Starting with a quarterly transition matrix M, if M is parameterized in a suitable manner, M= M(θ̃), we can minimize the sum squared difference between the target 1-year TM and the 1-year TM implied from M(θ̃). To enforce appropriate properties for M(θ̃), we parameterize it as follows.
⋯ Φ(θ̃1,2) Φ(θ̃1,D) 1 − Φ(θ̃1,2) −Φ(θ̃1,D) 2 2
Φ(θ̃2,1) 1 −Φ(θ̃2,1) −Φ(θ̃2,3) −∑Φ(θ̃i,D) ∑Φ(θ̃i,D) (A3.1) M (θ̃) =
i=1 i=1 ⋮ … ⋱ ⋮ [ 0 0 ⋯ 1 ]
Here Φ(. ) represents the cumulative standard normal distribution.
We estimate the 1-year TM as follow.
1. We start off by guessing some value for θ̃ to obtain the initial monthly transition matrix. We choose to parameterize the triangular matrix shown above, by assuming that it is a monthly transition matrix.
2. We then calculate the annual transition matrix as:
Ma(θ̃) = (M(θ̃)) (A3.2)
3. We calculate the sum of squared differences between Ma(θ̃) and the target 1-year TM.
4. We minimize the sum of the squared differences to estimate the parameters.
Once the optimization routine converges, we report the vector of parameters such that the function is minimized. The estimated vector of parameters is substituted into equation (A3.1) to obtain the estimated quarterly TM. We then infer the 1-year TM from the quarterly TM by equation (A3.2).
Appendix A4: Sovereign Transition Matrix and Spreads without PCT
Table A4.1: Historical TM without PCT
AAA AA+ AA AA- A+ A A- BBB+ BBB BBB- BB+ BB BB- B+ B B- CCC/CC DPC D
AAA 97.10 2.81 0.08 0.00 0.00 - - - - - - - - - - - - - 0.01
AA+ 6.65 86.22 6.86 0.21 0.00 0.00 - - - - - - - - - - - - 0.05
AA 0.19 6.85 85.71 6.93 0.23 0.00 0.00 - - - - - - - - - - - 0.08
AA- 0.00 0.23 7.78 84.31 7.21 0.34 0.00 0.00 - - - - - - - - - - 0.12
A+ 0.00 0.01 0.47 13.37 76.00 9.68 0.31 0.01 0.00 - - - - - - - - - 0.15
A - 0.00 0.01 0.85 13.18 78.86 6.66 0.24 0.01 0.00 - - - - - - - - 0.19
A- - - 0.00 0.02 0.75 11.85 79.30 7.35 0.48 0.01 0.00 - - - - - - - 0.22
BBB+ - - - 0.00 0.02 0.76 13.14 72.38 12.68 0.75 0.01 0.00 - - - - - - 0.26
BBB - - - - 0.00 0.03 1.14 16.74 70.17 11.20 0.42 0.01 0.00 - - - - - 0.29
BBB- - - - - - 0.00 0.04 1.32 14.83 75.94 7.16 0.38 0.01 0.00 - - - - 0.33
BB+ - - - - - - 0.00 0.06 1.54 19.91 67.55 9.83 0.59 0.02 0.00 - - - 0.50
BB - - - - - - - 0.00 0.06 1.61 14.88 70.79 11.25 0.71 0.03 0.00 - - 0.68
BB- - - - - - - - - 0.00 0.04 0.85 10.61 74.58 12.05 1.00 0.03 0.00 - 0.85
B+ - - - - - - - - - 0.00 0.02 0.59 10.67 70.47 15.66 0.88 0.02 - 1.70
B - - - - - - - - - - 0.00 0.02 0.79 13.97 71.78 10.48 0.42 - 2.54
B- - - - - - - - - - - - 0.00 0.03 1.14 15.17 69.56 7.09 - 7.01
CCC/CC - - - - - - - - - - - - 0.00 0.00 0.11 1.91 52.95 - 45.03
DPC - - - - - - - - - - - - - - - - - 100.00 -
D - - - - - - - - - - - - - - - - - - 100.00 Note: All entries are in per cent. Here DPC denotes Default to Private Creditors.
Table A4.2: Risk-neutral Annual Spreads Without PCT
AAA AA+ AA AA- A+ A A- BBB+ BBB BBB- BB+ BB BB- B+ B B- CCC/CC
1 0.00 0.02 0.04 0.06 0.07 0.09 0.11 0.13 0.14 0.16 0.25 0.33 0.42 0.84 1.25 3.50 24.93
2 0.01 0.02 0.04 0.06 0.07 0.09 0.11 0.13 0.14 0.16 0.24 0.33 0.44 0.85 1.37 3.95 20.63
3 0.01 0.02 0.04 0.06 0.07 0.09 0.11 0.13 0.14 0.16 0.24 0.33 0.46 0.89 1.49 4.09 17.09
4 0.01 0.02 0.04 0.06 0.07 0.09 0.11 0.13 0.14 0.17 0.24 0.33 0.48 0.92 1.58 4.06 14.29
5 0.01 0.02 0.04 0.06 0.07 0.09 0.11 0.13 0.14 0.17 0.23 0.33 0.51 0.96 1.65 3.95 12.11
6 0.01 0.02 0.04 0.06 0.07 0.09 0.11 0.13 0.14 0.17 0.23 0.34 0.53 1.00 1.70 3.80 10.41
7 0.01 0.02 0.04 0.06 0.07 0.09 0.11 0.13 0.14 0.17 0.23 0.34 0.55 1.03 1.72 3.63 9.09
8 0.01 0.02 0.04 0.06 0.07 0.09 0.11 0.13 0.14 0.17 0.23 0.35 0.57 1.06 1.74 3.46 8.04
9 0.01 0.02 0.04 0.06 0.07 0.09 0.11 0.13 0.14 0.17 0.23 0.35 0.59 1.09 1.74 3.30 7.19
10 0.01 0.02 0.04 0.06 0.07 0.09 0.11 0.12 0.14 0.17 0.23 0.36 0.61 1.11 1.73 3.15 6.50 Note: All spreads are in per cent.
Table A4.3: Risk-adjusted Annual Spreads Without PCT
AAA AA+ AA AA- A+ A A- BBB+ BBB BBB- BB+ BB BB- B+ B B- CCC/CC
1 0.52 0.79 0.98 1.10 1.20 1.24 1.27 1.36 1.54 1.80 2.28 2.47 2.78 3.26 4.10 6.23 28.31
2 0.53 0.80 0.98 1.13 1.22 1.26 1.30 1.47 1.65 1.93 2.44 2.61 2.96 3.75 5.60 7.98 23.03
3 0.55 0.81 1.00 1.16 1.25 1.29 1.35 1.58 1.76 2.06 2.63 2.85 3.32 4.46 6.70 8.72 18.73
4 0.56 0.83 1.01 1.19 1.29 1.34 1.41 1.70 1.90 2.24 2.92 3.19 3.80 5.12 7.32 8.87 15.41
5 0.57 0.84 1.04 1.24 1.35 1.40 1.49 1.83 2.06 2.46 3.28 3.60 4.29 5.62 7.55 8.67 12.89
6 0.59 0.86 1.06 1.29 1.42 1.48 1.59 2.00 2.27 2.74 3.67 4.01 4.70 5.92 7.49 8.27 10.98
7 0.60 0.88 1.10 1.36 1.51 1.58 1.72 2.21 2.51 3.03 4.03 4.35 5.00 6.04 7.25 7.78 9.52
8 0.62 0.90 1.14 1.45 1.62 1.70 1.86 2.43 2.76 3.31 4.31 4.60 5.17 6.01 6.91 7.26 8.37
9 0.63 0.93 1.19 1.55 1.74 1.85 2.03 2.67 3.01 3.55 4.50 4.75 5.22 5.87 6.52 6.75 7.46
10 0.65 0.97 1.26 1.67 1.89 2.00 2.21 2.89 3.23 3.75 4.60 4.80 5.17 5.66 6.12 6.27 6.72 Note: All spreads are in per cent.
Risk Control 8 Golden Square London W1F 9HY +44(0)2033070730 www.riskcontrollimited.com
Notes
[1] Here IBRD and ADB classify countries based on per capita income, where countries which have lower income level than a threshold income specified the bank is eligible for exemptions in their maturity level. IBRD further have preferential treatment for sovereigns in fragile and conflict-affected situations (FCS).
[2] Since no dividends are paid on the equity capital of most MDBs, the institutions have wide latitude in deciding how to price their lending.
[3] SMIs include the World Bank’s Multilateral Investment Guarantee Agency (MIGA), the Islamic Corporation for Insurance of Investment and Export Credit (ICIEC) and the African Trade, Investment Development Insurance (ATIDI) and the Arab Investment and Trade Credit Guarantee Corporation (Dhaman).
[4] And, indeed, lower than those of bilateral lenders and national Export Credit Agencies and Eximbanks.
[6] The end of fiscal year for MDB is commonly 31st December, while in this study only IBRD has the end of fiscal year on 30 June.
[7] See Risk Control (2023) for mapping between OECD and credit rating agencies rating scale.
[8] For small spread values, the spread estimates are equivalent to Expected Loss. Note: Here ‘D’ indicates sovereign that have not re- emerged from ‘SD’ rating in a year[10].
[9] Standard & Poor’s assign SD rating to obligors who have defaulted selectively on a specific issue and not on all the obligations. Standard & Poor’s further believes the ‘SD’ rating sovereign would continue to service other obligations in timely manner.
[10] The ratings of the country which have been withdrawn after going into ‘SD’ state has been assumed to stay in default for a year.