

The Basel Committee’s response to the financial crisis was concluded in December 2017 by the publication of a final set of the regulatory changes (see BCBS 424). The measures in BCBS 424 introduce two major innovations. First, they revised the Risk Weights for credit risk exposures under the Standardised Approach (SA) and, second they impose floors on the capital of Internal Ratings Based (IRB) banks based on SA capital calculations. The Committee’s objective in implementing these changes has been to reduce the influence of internal models that advanced banks use to calculate capital and to change the relative capital burden across regulatory exposure classes. The impact of the changes is less transparent than that of some earlier post-crisis rule changes (such as changes in target ratios of the introduction of a leverage ratio). This paper analyses the impact of the measures for a particular national loan market, that of Switzerland. We chart the effects on Risk Weights, capital and lending rates of successive versions of the Basel Committee’s proposals and of the finally adopted reforms.
Executive summary
This paper analyses the impact on the Swiss loan market of the changes in capital rules adopted by the Basel Committee. These changes include (i) replacing the current Standardised Approach (SA) for calculating credit risk capital with a revised credit risk SA, and (ii) introducing a system of capital floors for banks employing the Internal Ratings-Based Approach (IRBA) derived from this revised SA.
On the revision to the credit risk SA, initial proposals were published by the Basel Committee in BCBS 307 in December 2014, modified in BCBS 347 a year later, and then published in final form in BCBS 424 in December 2017. On capital floors, initial proposals are contained in BCBS 306, again published in December 2014. Floors were mentioned in BCBS (2016) (also known as BCBS 362 which referred to a possible range of floors from 60% to 90%). The definitive approach to floors (which set the floor at 72.5%) appeared in BCBS 424.
On the revised credit risk SA, the Committee initially envisaged basing risk weights on obligorspecific financial ratios such as, in the case of corporate exposures, the borrower’s revenue and leverage (see BCBS 307). Such an approach is highly ambitious since such ratios vary across sectors and jurisdictions in ways unrelated to credit standing. The BCBS 307 calibration of financial ratio based risk weights implied big changes in relative risk weights and total capital.
The Committee subsequently retreated from its proposed reliance on financial ratios, restoring the dependence of risk weights on agency ratings (where available and when the jurisdiction permits their use). The proposals in BCBS 347, however, included changes to Credit Conversion Factors (CCFs) for uncommitted loan facilities that had important implications for relative risk weights as well as for total capital. In the final version of the rules presented in BCBS 424, the Committee adopted risk weights favouring Residential Mortgages and retreated from the aggressive changes in the CCF regime it had suggested in BCBS 347.
On the system of capital floors proposed in BCBS 306, Basel regulators were attempting to “tidy up” the prior situation in which capital floors have been implemented differently across regulatory jurisdictions. Confusion across countries in the approach taken to capital floors arose after the crisis when countries retained in different forms a transitional “Basel I capital floor”, originally designed to limit sudden changes when Basel II rules came into force. Imposed at a bank level, the Basel I floor omits important new components of bank capital, for example CVA-related capital. So, this floor has not acted as a binding constraint for most large banks (in some countries, banks were not even obliged to calculate it) and has played a limited role in pricing decisions.
The Basel Committee’s interest in capital floors is motivated not just by a desire to restore uniformity of capital rules across jurisdictions. The Committee also wishes to use floors to reduce variation across banks in IRBA risk weights and to increase risk weights for low default probability exposures. Other policy changes will contribute to achieving these goals, specifically, the Basel III Leverage Ratio and risk weight benchmarking and comparison exercises. But, floors are seen as another mechanism for enforcing uniformity. Following at times bitter negotiations between regulators from different countries, the final version of the floors regime, announced in BCBS 424, sets the floor level for a bank to 72.5% of its SA capital.
The key questions that arise in evaluating the BCBS proposals are (i) How will the proposed changes affect bank capital? (ii) What will be the effect on bank customers in the form of changes in loan spreads? This paper tackles these questions directly. Specifically, we forecast the impact of the proposed rule changes on the capital of the 37 Swiss banks that supply the large majority of lending in Switzerland. Our analysis identifies the effects for key sectors of the Swiss loan market: Bank Exposures, Corporate Loans, Commercial and Residential Mortgages and Specialised Lending. We forecast the effects of the rule changes on Risk Weights, capital and bank lending spreads. Distinguishing between asset classes is important because the Basel rule changes will have varying effects on different asset classes and categories of bank.
Our main findings are that the revised SA, together with the introduction of capital floors for IRB banks, will generate significant increases in capital for Corporates and Specialised Lending in the Swiss market and slight decreases in capital for Residential Mortgages. The increases in capital have been substantially mitigated compared to the BCBS 307 and BCBS 347 proposals. The main driver of the changes are capital floors and the calibration of Residential Mortgages adopted late in the development of the rule changes.
Despite the reduced magnitude of the capital changes in the final version of the reforms, it remains the case that under the new rules, total bank capital for Corporate exposures will be 28% higher and that for Specialised lending will be 42% higher.
Changes in capital are likely to lead to some increases in lending spreads in Swiss loan markets. Using a version of the Capital Asset Pricing Model (CAPM), we estimate the impact on loan spreads of the proposed changes in capital rules. We find that spreads for Corporate loans and Specialised Lending under the BCBS 424 rules would rise (by about 27 basis points) whereas spreads for Residential Mortgages could fall slightly (by around 9 basis points).
1. Introduction
In December 2017, the Basel Committee finally published the last component of its Basel 3 response to the financial crisis (see BCBS (2017) also known as BCBS 424). This last set of rule changes includes (i) a revision of the credit risk Standardised Approach (SA) and (ii) rules under which SA capital calculations will function as a floor for the capital of advanced banks that calculate their capital under the Internal Ratings Based Approach (IRBA).
These final rule changes have been debated over multiple years. Initially the Committee proposed (see BCBS (2014c), also known as BCBS 307) that risk weights for Bank, Corporate and Residential Mortgage exposures would depend on the values of risk indicators, specific to the exposure in question.[3] In 2015, the Committee issued a new version of its proposals retreating from the extensive use of risk indicators (see BCBS (2015), known as BCBS 347) but introducing a significant tightening of the rules on Credit Conversion Factors (CCFs) for undrawn loan facilities. The final BCBS 424 version of the rules included further reversals of earlier positions and, specifically, a watering down of the stringent CCFs.
Also in 2014, the Basel Committee published its initial thinking on capital floors (see BCBS (2014b), known as BCBS 306). In this, the authorities aimed to “tidy up” discrepancies across regulatory jurisdictions in the approach taken to capital floors. When the Basel II rules came into force, regulators applied a temporary capital floor equal to a declining fraction of Basel I capital levels. Following the crisis, this was retained in various forms in different jurisdictions. Since it is imposed at a bank level and is worked out excluding Basel III capital categories such as CVA, in practice, it does not bind many large banks and plays a limited role in pricing decisions.
Regulators regard capital floors as a way of enforcing greater uniformity of risk weight calculations across banks. The Basel Committee has, for some time, expressed dissatisfaction with the inconsistency across banks of capital calculated using internal models (including Internal Ratings- Based Approach (IRBA) credit risk capital calculations). BCBS (2013), for example, documents such inconsistencies, presenting banks’ IRBA risk weight calculations for a set of reference exposures.[4]
The authorities have engaged in other policy steps to reduce inconsistencies in capital calculations including an extensive set of evaluation exercises referred to as the Regulatory Consistency Assessment Programme (RCAP). The effectiveness of this and parallel industry benchmarking activities in improving consistency has yet to be established. But, the authorities have decided to push ahead by implementing systematically capital floors based on revised SA rules. The final version of the floors regime published in BCBS 424 imposes a floor on IRBA capital equal to 72.5% of the SA capital numbers.
While the Basel 3 rules on floors and the credit risk SA have attracted little attention outside risk and regulation specialists, the BCBS proposals may have significant implications for banks and the economies in which they operate.[5] In particular, the new rules are likely to shift capital (a) between
SA and IRB banks and (b) across asset classes. Understanding the nature of these shifts and the economic implications is an important topic of study.[6]
The Basel Committee organised an official Quantitative Impact Study (QIS) for the BCBS 306 and BCBS 307 versions of the proposed new rules but many banks found it difficult to obtain the data necessary to calculate capital accurately. So, the reliability of the QIS, the results of which are in any case confidential, is open to doubt. A new QIS took place following publication of BCBS 347 but the results are again confidential.
In this paper, we examine the implications of both the 2014, 2015 and 2017 versions of the proposals for a particular loan market, that of Switzerland. Using primarily public data, we investigate which banks and asset classes would attract higher or lower capital under the proposed changes. We then proceed to analyse how the changes in capital will affect lending rates. We focus on Swiss banks’ exposures to Banks, Corporates, Commercial and Residential Mortgage and Specialised Lending exposures located in Switzerland.
We study the effects of the proposals on the capital and lending rates of 37 group or individual banks. These include the main suppliers of loans in the Swiss market: two large IRBA banks, UBS and Credit Suisse; a large network SA bank, Raiffeisen (which is particularly active in residential mortgage lending); a group of Cantonal banks of varying size (that are all SA with one IRBA exception); and a group of other SA banks.[7]
We perform quantitative impact analysis of the proposals using data published by these 37 banks through their Pillar 3 disclosures and financial statements, calculating the implied changes in the capital individual banks apply to different asset classes. The private data we employ consists of estimates, supplied to us by UBS, of the distribution of its lending within Switzerland conditional on credit quality and the revised SA risk drivers.
Using the above information, we first perform top-down calculations of how one might expect individual banks’ risk weights for each of several asset classes to be affected by the introduction of the BCBS 307 and BCBS 347rules and the BCBS 306 capital floors regime. Second, we analyse the impact of the capital changes on the spreads that banks charge in different sectors of the Swiss loan market. Third, we calculate the immediate, direct monetary cost of the rule changes as the product of spread changes and current volumes. We do this in annual flow terms and also as a discounted sum of future costs.
To infer the impact of increased capital on spreads, we calculate the cost of bank equity employing the Capital Asset Pricing Model (CAPM) suggested by Kashyap, Stein and Hanson (2010) and subsequently used by Miles, Yang and Marcheggiano (2012) and Junge and Kugler (2013). This approach yields not just a calculation of the initial cost of equity but also an estimate of how that cost of equity may change as a bank increases its capital. In contrast to these other authors, we examine the impact of capital changes explicitly distinguishing between the costs of equity of individual banks.
Our most important finding is that the proposed changes in the capital rules would significantly boost the spreads that banks charge to Corporate and Specialised Lending borrowers and slightly lower those for Residential Mortgage lending. We also conclude that the changes would significantly improve the relatively competitive position of the Cantonal Banks vis-à-vis the two large Swiss banks.
One may note that the regulatory landscape for Swiss banks is evolving not just because of the rule changes discussed in this paper. Examples of other developments include the phased introduction of Basel leverage ratios, alterations in trading book regulations and the minimum Total Loss Absorbing Capacity (TLAC) rules. Here, we focus on the revised credit risk SA and its interaction with proposed capital floors since these changes have attracted relatively little attention and yet have the potential to alter substantially the distribution and level of bank capital.
This paper is a contribution to a substantial literature on the impact of alterations in regulatory capital rules on aggregate bank capital and the wider economy. Repullo and Suarez (2004) and Ruthenberg and Landskroner (2008) examine the effects of the introduction of the Basel II rules on lending rates, focussing on how a bank’s choices between SA and IRBA approaches would affect outcomes. Papers by Elliot (2009), King (2010), Kashyap, Stein and Hanson (2010), BCBS (2010a), Macroeconomic Assessment Group (2010), Institute of International Finance (2011), Cosimano and Hakura (2011), Slovik and Cournede (2011), Miles, Yang and Marcheggiano (2012), Junge and Kugler (2013), Baker and Wurgler (2013) and Basten and Koch (2014) study the economic effects of the increases in capital envisaged in Basel III.
Other studies have examined the dynamics of bank lending and capital econometrically. Early studies include Hancock, Laing, and Wilcox (1995), Peek and Rosengren (1995) and Ediz, Michael and Perraudin (1998). Other analyses include Mora and Logan (2010) Francis and Osborne (2012) and Peek and Rosengren (2011). For other relevant studiessee for example Bassett, Chosak, Driscoll and Zakrajŝek (2010), who examine how bank loan supply shocks feed through into real economic activity.
This study may also be viewed as a contribution to the literature on the Swiss banking market. This includes among other significant studies Neuberger and Schacht (2005), Dietrich (2009), Dietrich and Wanzenried (2009). Rochet (2014) discusses studies of the economic impact of capital rules in the context of Swiss bank regulation.
The paper is organised as follows. Section 2 describes the proposal changes in capital rules. Section 3 details how we map the Basel BCBS 306, 307, 347 and 424 proposals into estimates of changes in the capital individual banks will hold against exposures in different asset classes. Section 4 explains how we analyse the impact on spreads, again by bank and asset class. Section 5 presents the results of our calculations. Section 6 concludes. The Appendix contains information on how we estimate risk driver distribution for Swiss bank exposures to other Swiss banks in the context of BCBS 307 rules and the distribution of unrated loans that we employ in implementing BCBS 347 rules.
2. The revised SA and capital floors
Background
This paper examines the impact on the Swiss loan market of the proposed changes in bank capital rules set out in BCBS 306, 307, 347 and 424.[8] This involves calculating the impact on capital for different banks and asset classes and then analysing how this will affect the spreads at which banks lend. We begin by providing background to the Basel Committee’s proposals.
The existing credit risk SA is employed by banks that choose, subject to regulatory approval, to use less sophisticated approaches to calculating regulatory capital. The SA includes a set of asset-class specific risk weights that banks apply to their exposures to calculate their credit-related Risk Weighted Assets (RWAs). A bank’s required capital is then calculated by multiplying its total RWA by a capital target ratio.
Under Basel I and II rules, banks apply target ratios of 4% and 8%, respectively, to their RWAs to derive their required Tier I and Tier II capital. Under Basel III, the system of capital target ratios is more complex and includes elements based on a Capital Conservation Buffer and a Counter-Cyclical Buffer as well as additional percentages for Systemically Important Financial Institutions (SIFIs).
Risk weights in the existing credit risk SA are relatively insensitive to risk in that they vary across, but not within, broad asset classes. Exceptions are exposures to rated corporate, bank or sovereign borrowers for which risk weights are determined, based on the exposure’s credit rating, using look-up tables.
When Basel II was introduced, in order to prevent a possible, sudden reduction in capital levels for some institutions, a Basel I capital floor was included. Under this approach, a bank’s required capital equals the maximum of its Basel II level and a percentage of the Basel I level (see BCBS (2006) paragraph 45). The Basel Committee intended that the “Basel I” floor be temporary. It was planned that the percentage used in the floor definition would fall over time from 95% in 2007, to 90% in 2008 and then to 80% in 2009, after which the floor would be dropped.
Following the 2007 crisis, however, some jurisdictions decided to maintain the Basel I floor. For example, the European Union determined to retain an 80% Basel I floor, at least until 2017 (see Article 500 of the Credit Risk Regulation (CRR) in European Parliament (2013)).[9] Switzerland also retained the Basel I floor after 2009.
The fact that the Basel I floor operates on total bank capital and excludes important new Basel III capital components (such as CVA-related capital) means that for many large banks, the Basel I floor does not bind and plays a limited role in banks’ loan pricing decisions.
The BCBS 307 Risk Weights
Key elements of BCBS 307 that are material to our analysis are the risk weight look-up tables for exposures in individual asset classes. While the existing ‘Basel 2’ SA bases risk weights on agency ratings (where available) or employs simple undifferentiated risk weights for wide classes of exposures, under the revised SA, the Basel authorities propose in BCBS 307 to calculate risk weights on the basis of risk indicators consisting of financial ratios.
For Bank Exposures, the risk indicators are the Core Equity Tier 1 ratio of the counter-party bank and the ratio of Net Non-Performing Assets to total loans. Table 1 shows the risk weights, proposed in BCBS 307, for exposures that have CET1 and NNPA ratios in particular, specified ranges. One may observe that the risk weights range from 30% to 300%, a substantial “times 10” range from least to most risky banks.
If the data required for a bank to calculate capital for an exposure to another bank on this basis is not available (for example, because the obligor bank does not possess Basel III consistent RWA data and, hence, cannot publish a CET1 ratio), the default risk weight value is 300%. This approach contrasts with the current SA in which if a rating is not available, risk weights equal the Basel I level of 100%.
12% > 9.5% > 7% > 5.5% > CET1 ratio CET1 ratio CET1 ratio CET1 ratio CET1 ratio CET1 ratio ≥ 12% ≥9.5% ≥ 7% ≥ 5.5% ≥ 4.5% < 4.5% NNPA ratio ≤ 1% 30% 40% 60% 80% 100% 300% 1% < NNPA ratio ≤ 3% 45% 60% 80% 100% 120% 300% NNPA ratio > 3% 60% 60% 100% 120% 140% 300% Note: The table, reproduced from BCBS 307, shows the risk weights banks must use for exposures to other banks under the revised credit risk SA. The risk weights depend on the Common Equity Tier 1 (CET1) ratio and Net Non-Performing Asset (NNPA) ratio of the bank in question.
For Corporate Loans, the capital indicators proposed in BCBS 307 are Revenue and a Leverage ratio (defined as total assets over common equity). Table 2 shows the risk weights for different risk indicator ranges. In this case, proposed risk weights range from 60% to 300%, i.e., a “5 times” proportional variation. Leverage is a particularly controversial indicator to use since it varies so much across sectors without corresponding observed variation in default rates and loss given default.
| €5m < | €50m < | ||||
|---|---|---|---|---|---|
| Revenue | Revenue | Revenue | Revenue | ||
| ≤ €5m | ≤ €50m | ≤ €1bn | > 1bn | ||
| Leverage: | 1x-3x | 100% | 90% | 80% | 60% |
| Leverage: | 3x-5x | 110% | 100% | 90% | 70% |
| Leverage: | >5x | 130% | 120% | 110% | 90% |
| Negative | Equity (*) | 300% | 300% | 300% | 300% |
Note: The table, reproduced from BCBS 307, shows the risk weights banks must use for exposures to corporates under the revised credit risk SA. The risk weights depend on the obligor’s leverage (the total liabilities to equity ratio) and on gross revenue.

Note: The table, reproduced from BCBS 307, shows the risk weights banks must hold, under the revised credit risk SA against exposures to commercial mortgages. Risk weights depend on Loan to Value (LTV) ratios.
40% ≤ Ltv 60% ≤ ltv 80% ≤ ltv 90% ≤ ltv ltv < 40% < 60% < 80% < 90% < 100% 100% ≤ ltv
DSC ≤ 35% 25% 30% 40% 50% 60% 80% DSC > 35% 30% 40% 50% 70% 80% 100% Note: The table, reproduced from BCBS 307, shows the risk weights banks must hold, under the revised credit risk SA against exposures to residential mortgages. Risk weights depend on Loan to Value (LTV) and Debt Service Coverage (DSC) ratios.
Tables 3 and 4 show the risk weights, proposed by the Basel authorities, for exposures to Commercial and Residential Mortgages. The risk weights in both cases depend on Loan to Value (LTV) ratios while Residential Mortgage risk weights also depend on Debt Service Coverage ratios.
The revised SA further defines so called Specialised Lending exposures. These are exposure types deemed to be particularly risky and are subject to a conservative non-risk-differentiated risk weight. Among others, Income Producing Real Estate (IPRE), Commodity Trade Finance (CTF) and Land Acquisition (LA) given certain conditions might qualify as Specialised Lending exposures, receiving 120%, 120% and 150% risk weights, respectively.
BCBS 347 Risk Weights and CCF Rule Changes
In this section, we describe the changes that the Basel authorities made to their revised credit risk SA proposals in BCBS 347 following a hostile industry response to BCBS 307.
We begin with risk weights for exposures to Banks. As explained above, under the BCBS 307 proposals, banks determined risk weights for their exposures to other banks based on the obligor’s CET1 ratio and net non-performing assets (NNPA) ratio.
Most respondents to the Committee’s consultation accepted the use of the CET1 ratio but many argued the NNPA ratio was not comparable across different accounting regimes. Some thought that the tworisk driver approach was overly simplistic and would result in a loss of risk information and others pointed out the elimination of dependence on ratings was unnecessary and undesirable.
In its BCBS 347 revision, the Committee acknowledged the limitations of BCBS 307 and proposed that bank exposures be risk-weighted based on the following hierarchy.
a. External Credit Risk Assessment Approach (ECRA)
Banks incorporated in jurisdictions that allow the use of external ratings for regulatory purposes would assign to their rated bank exposures the corresponding “Base” risk weights depending upon the external ratings as shown in Table 1. Bank exposures with maturity of three months or less could be assigned a risk weight based on the second row in Table 5.
Banks incorporated in jurisdictions that allow the use of external ratings for regulatory purposes would classify their unrated bank exposures into one of three risk-weight buckets: Grades A, B and C, using an approach termed the Standardised Credit Risk Assessment Approach (SCRA). Banks incorporated in jurisdictions that do not permit use of external ratings for regulatory purposes would apply the SCRA approach to all their bank exposures.
We now turn to risk weights for Corporate exposures. In BCBS 307, as for Bank exposures, Corporateexposure risk weights are determined by a two-risk-driver approach, specifically revenue and leverage. Respondents to the Committee’s consultation deemed the use of leverage inappropriate without consideration of a corporate’s industry sector while the use of revenue was also criticised as it would penalise SMEs.
In response, in BCBS 347, the Committee proposes two approaches to apply the risk weights for corporate exposures.
a. For banks incorporated in jurisdictions that allow the use of external ratings for regulatory purposes, the risk weights of corporate exposures will be determined according to Table 7.
b. For banks incorporated in jurisdictions that don’t allow for external ratings for regulatory purposes, banks will apply an 75% risk weight to all “investment grade” corporate exposures and an 100% risk weight to all other corporate exposures.
For residential real estate, BCBS 307 proposed determining risk weights from two risk drivers: the loanto-value (LTV) ratio and the debt servicing coverage (DSC). The use of LTV ratio was generally supported by respondents to the Committee’s consultation but they expressed significant concerns on the use of the DSC ratio due to the challenges of defining the variable and calibrating its effect.
In BCBS 347, the Committee, therefore, decides to retain the LTV ratio as the risk driver but not to use the DSC ratio. The risk weights would vary based on the exposures’ LTV ratio and also would depend on whether repayment is materially dependent on cash flows generated by the property.
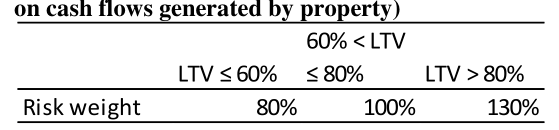
For commercial real estate exposures, to ensure consistency with residential real estate exposures, the Committee proposes in BCBS 347 to assign risk weights based on the LTV ratio and on whether repayment is materially dependent on cash flows generated by the property.
Last, for Specialised Lending exposures, BCBS 307 proposed to employ the following risk weights: a. 120% to exposures against project finance, object finance, commodities finance and incomeproducing real estate (IPRE) finance b. 150% to exposures against land acquisition, development and construction(ADC) finance
In BCBS 347, to be consistent with the reintroduction of external ratings for risk-weighting exposures to banks and corporate, the Committee proposes to permit use of issue-specific external ratings for project finance, object finance and commodities finance. The applicable risk weight would be determined by the same risk-weight look-up table that would apply to general corporate exposures.
The Committee also proposes to categorise IPRE exposures ADC exposures as real estate exposures. IPRE will be treated as real estate exposures with repayment materially dependent on cash flows generated by property. IPRE will either use risk weight look-up Table 10 or Table 11 depending on the sub-category to which it belongs.
ADC exposures would still be risk-weighted at 150% but now would include loans to companies and individuals that are made to finance the acquisition of finished property, where the repayment of the loan depends on the future uncertain sale of the property. (We do not reflect this definition change in our calculations.)
The BCBS 424 Risk Weights
In this section, we describe the changes that the Basel Committee’s made to credit risk SA in their finalisation of the Basel III framework BCBS 424 following the revisions made in BCBS 347.
For banks incorporated in jurisdictions that allow the use of external ratings for regulatory purposes, the risk weights of corporate exposures will be determined according to Table 14.
For banks incorporated in jurisdictions that don’t allow for external ratings for regulatory purposes, the approach applied to corporate exposures is the same as described in BCBS 347.
The risk weights for income-producing commercial real estate exposures are given in Table 15.
The risk weights applied to general commercial real estate exposures are the same as set out in BCBS 347. 50% ≤ 60% ≤ 80% ≤ 90% ≤ LTV < LTV < LTV < LTV < LTV < 100%≤ Criteria not LTV band 50% 60% 80% 90% 100% LTV met General residential real RW of estate RW 20% 25% 30% 40% 50% 70% counterparty Income producing residential real estate RW 30% 35% 45% 60% 75% 105% 150% Note: The risk weight treatment for income producing residential real estate is more granular than BCBS 347. The first two LTV bands have been redefined from <40% and 40% - 60% in BCBS 347 to <50% and 50% - 60% in BCBS 424. The overall risk weight for all LTV bands has been reduced dramatically as can be seen from table 8, table 9 and this table.
Off Balance Sheet Exposures in BSBC 307, BCBS 347 and BCBS 424
An important aspect of the rule changes proposed in the revised credit risk SA concerns the Credit Conversion Factors (CCFs) used for undrawn loan facilities. CCFs are used within the Basel system to convert off-balance sheet exposures of various types to exposures at default comparable to those of conventional drawn loans. BCBS 307 proposed to introduce a CCF of 10% for unconditionally cancellable loan commitments. Previously, they had carried a CCF of zero. For the asset classes we study in this paper, banks have generally regarded undrawn loan commitments as unconditionally cancellable (UCC). The BCBS 307 proposed change therefore represented a small but possibly significant increase in conservatism affecting SA banks directly and IRBA banks because of the proposed regime of SA-capital-based floors.
BCBS 347, however, proposes a much more important increase in conservatism in that “the Committee proposes to apply a reduced CCF between 10% and 20% only to retail commitments (e.g., credit cards). All other non-retail commitments that are currently categorised as UCC would be treated as general commitments.” These latter, which would include undrawn loan facilities in the asset classes we study in this paper, would be subject to a CCF of 50% to 75%, the precise calibration to be established in the future. Clearly, the impact of this change both directly for SA banks and, indirectly for IRBA banks via the proposed SA-capital-floors regime, would be substantial.
BCBS 424, proposed to use 10% for unconditionally cancellable loan commitments as in BCBS 307. All other commitments, except unconditionally cancellable, regardless maturities, would be subject of a CCF of 40%. The precise calibration will be established in the future.
The CCF rules in current SA, BCBS 307, BCBS 347 and BCBS 424 are summarized in table 17.
Certain transaction-related contingent items All 50% 50% 50% Short-term self-liquidating trade letters of credit arising from the movement of goods All 20% 20% 20%
| External rating of counterparty AAA to | AA- A+ | to A- BBB+ to | BBB- |
|---|---|---|---|
| "Base" risk weight | 20% | 50% | 50% |
| Risk weight for short-term exposures | 20% | 20% | 20% |
| Credit risk assessment of counterparty Grade | A |
|---|---|
| "Base" risk weight | 50% |
| Risk weight for short-term exposures | 20% |


Note: For residential real estate exposures to individuals with an LTV ratio higher than 100% the risk weight applied will be 75%. For residential real estate exposures to SMEs with an LTV ratio higher than 100% the risk weight applied will be 85%.
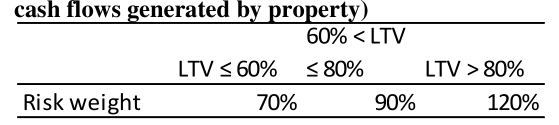

Note: For commercial real estate exposures to individuals with an LTV ratio higher than 60% the risk weight applied will be 75%. For commercial real estate exposures to SMEs with an LTV ratio higher than 60% the risk weight applied will be 85%.
| External rating AAA to AA- A+ to | A- BBB+ to BBB- BB+ to B- Below B- | Unrated |
|---|---|---|
| Risk weight 20% | 30% 50% 100% 150% | As for |
| Short-term exposures risk weight 20% | 20% 20% 50% 150% | As for |
Note: Risk weight for rating category A+ to A- has been reduced from 50% to 30%. Short-term exposures risk weight remains unchanged.
| Standardisd Credit Risk | |
|---|---|
| Assessment Approach (SCRA) Grade A Grade | B |
| frades | |
| Risk weight 40% | 75% |
| Short-term exposures risk weight 20% | 50% |
Note: Risk weights for grade A and grade B are reduced from 50% and 100% to 40% and 75% accordingly. Short-term exposures risk weight remains unchanged.

Note: Risk weight for rating category BBB+ to BBB- has been reduced from 100% to 75%. Unrated corporate SMEs would be assigned an 85% risk weight.

| Off-balance sheet exposure | Current | SA BCBS | 307 | BCBS 347 BCBS | 424 | |
|---|---|---|---|---|---|---|
| Commitments that are | unconditionally | |||||
| cancellable at any time | without prior | Retail | 0 | 10% | 10-20% | 10% |
| notice, or that effectively | provide | |||||
| automatic cancellation | due to deterioration | |||||
| in borrower’s creditworthiness | Non-retail | 0 | 10% | 50-75% | 10% | |
| Commitments, except | unconditionally | |||||
| cancellable | All | - | 75% | 50-75% | 40% | |
| Commitments with | maturity ≤ 1 year, | |||||
| except unconditionally | cancellable | All | 20% | - | - | |
| Commitments with | maturity > 1 year, | |||||
| except unconditionally | cancellable | All | 50% | - | - |
Note issuance facilities (NIFs) and revolving underwriting facilities (RUFs) All 50% 75% 50%
3. Capital impact analysis
Breakdown of the Swiss Loan Market
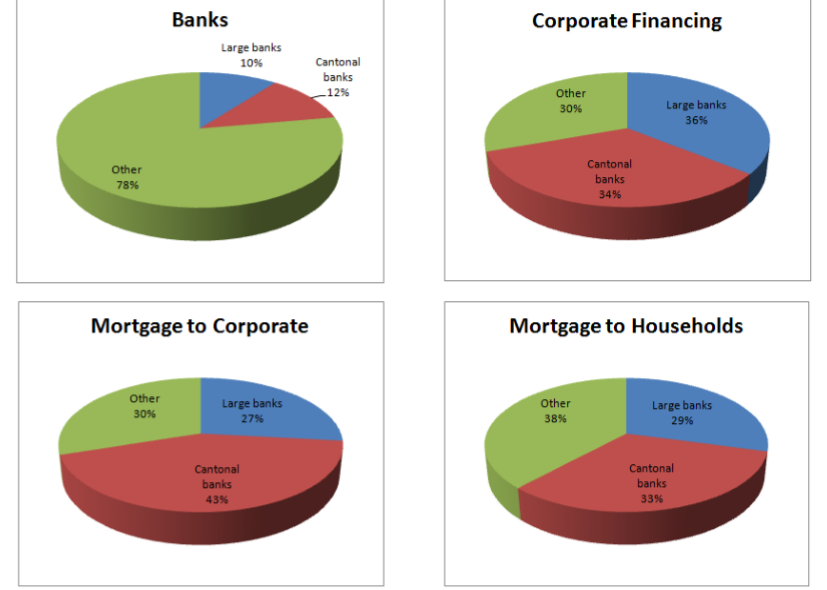
This section describes how we infer the impact of the proposed capital rule changes in BCBS 306, 307, 347 and 424 for different banks and asset classes. Table 18 shows the market shares that different categories of bank contribute to the main segments of the Swiss loan market. The pie charts that appear in Figure 1 exhibit the same data as Table 18.
One may observe that 70% of Corporate Financing is supplied by the two Large Banks and the Cantonal Banks, the two categories of bank providing roughly equal market shares. The Cantonal Banks have the largest share of the market in Mortgages to Corporates followed by the Other Banks. The largest share of Mortgages to Households is supplied by the Other Banks (which include Raiffeisen), followed by the Cantonal Banks.
We wish to analyse bank loan exposure data in a disaggregated way.[11] It is natural to work with the standard regulatory categories such as: Sovereign, Bank, Corporate, Other Wholesale, Retail Mortgage, Revolving Facilities and Other Retail. It is not practical, however, to examine all of these categories because of lack of data. We, therefore, focus our investigation on capital and spread impacts for the four key regulatory asset classes: Bank Exposures, Corporate Loans, Commercial Mortgages and Residential Mortgages. In the case of IRB banks, we will also provide results on the impacts of proposed rule changes on several categories of Specialised Lending.[12]
To obtain accurate estimates of impacts on capital, it is necessary to break the loan volumes down further, distinguishing loan exposure data based on (i) the approach the bank uses in calculating regulatory capital (IRBA, SA, SRW and Other) and (ii) default probabilities (in the case of IRBA loans) or risk weight bands (in the case of SA loans). We concentrate our analysis only on IRBA and SA loans.
While helpful in showing the overall breakdown of the Swiss loan market in a timely fashion (the data we exhibit is for end 2014), SNB data are not sufficiently disaggregated for us to employ directly in our analysis.[13] We, therefore, use individual bank data taken from the annual reports and Pillar 3 disclosures of individual banks.
The banks that we study (37 in number) are listed in Table 19. Of these, three are IRB banks, namely Credit Suisse, Banque Cantonale Vaudoise and UBS. Based on statements contained in either the bank’s annual report or Pillar 3 disclosures, we consider all other banks to be following the SA in calculating credit risk capital.[14]
Calculating BCBS 307 Revised Credit Risk SA Risk Weights
The data we obtain from annual reports and Pillar 3 disclosures pertains to end 2013.To bring the data up to date, we rescale[15] the exposure data so it is consistent with the more timely, end-2014 information in the SNB statistics displayed in Table 18.
The rescaled individual bank level loan volume data are displayed (in aggregated form) in Table 20. Because of the re-scaling, they, of course, differ from those published in the banks’ 2013 annual reports and Pillar 3 disclosures.
After rescaling, we decompose each bank’s asset-class-specific exposure data according to the PD or risk weight (if this is available) information contained in the bank’s Annual Report or Pillar 3 Disclosures. For banks that do not publish default probability or risk weight breakdowns, we assume that the breakdown by risk weights equals the weighted average risk weight breakdown of banks for which the information is available.[16]The right hand column of Table 6 shows whether or not we were obliged to make such risk weight assumptions about a given bank.
employ in our analysis of the capital impact of the revised credit risk SA. Figures are in CHF millions.
Using the decomposed data for each bank, we proceed to calculate capital requirements using the revised SA approach. The process involves the following steps.
1. For IRB banks, we infer default probabilities (PDs) from risk weights using the standard Basel formula assuming values of loss given default (LGD) and maturity (MT).
2. For SA banks, we infer ratings from RW according to the look-up tables in the current SA approach.
3. From the inferred ratings, we map the corresponding PD based on a default probability master scale table provided by UBS (see Table 20).
4. We devise two rating buckets: AAA to A- and BBB+ to default.
5. For each asset class that depends on two capital indicators, we estimate three joint distributions: one unconditional distribution and two conditional distributions for the above two rating buckets.
6. For each asset class, we associate to each of the exposure categories (broken down by credit quality) a distribution of the two capital indicators conditional on their credit quality.
7. Given the look-up table in the revised SA paper, the indicator distribution and the loan exposure at default, we calculate the risk weighted assets and capital requirement for the loan book.
In this process, the distribution of exposures by risk indicator plays a crucial role. One may reflect that, when risk weights depend on risk-indicator look up tables as used in BCBS 307, 347 and 424, a bank can calculate its revised SA capital without loan level information if it knows its total exposure in each regulatory loan class and the fractions of those total exposures that fall into each bucket defined by the risk indicator ranges specified in Tables 1, 2, 3 and 4.
To calculate the revised SA capital for each bank in each regulatory asset class, we, therefore, focus on estimating the distribution of loans in the Swiss market across the buckets defined in the BCBS 307, BCBS 347 and BCBS 424 tables.
In the case of Swiss bank exposures to other Swiss banks, we estimate this distribution based on a combination of public data and informed by guidance to us from an expert with experience of Swiss interbank exposures. This estimation is described in the Appendix. It leads to the distributions shown in Table 22. 12%> 9.5%> 7% > 5.5% > CET1 ratio CET1 ratio CET1 ratio CET1 ratio CET1 ratio CET1 ratio ≥12% ≥9.5% ≥7% ≥5.5% ≥4.5% <4.5% Large banks NNPA ratio≤1% 79.64% 1.25% 1.25% 0.00% 0.00% 0.00% 1%<NNPA ratio≤3% 13.21% 1.25% 0.00% 0.00% 0.00% 0.00% NNPA ratio>3% 2.14% 1.25% 0.00% 0.00% 0.00% 0.00% Cantonal banks NNPA ratio≤1% 81.52% 0.94% 0.94% 0.00% 0.00% 0.00% 1%<NNPA ratio≤3% 12.59% 0.94% 0.00% 0.00% 0.00% 0.00% NNPA ratio>3% 2.14% 0.94% 0.00% 0.00% 0.00% 0.00% Other banks NNPA ratio<=1% 83.39% 0.63% 0.63% 0.00% 0.00% 0.00% 1%<NNPA ratio<=3% 11.96% 0.63% 0.00% 0.00% 0.00% 0.00% NNPA ratio>3% 2.14% 0.63% 0.00% 0.00% 0.00% 0.00% Note: To calculate capital under the revised credit risk SA, for a given bank, we need the breakdown of its exposures according to the risk indicators specified in BCBS 307. For bank exposures, the relevant indicators are Common Equity Tier 1 and Net Non-Performing Asset ratios. This table displays the distributions we employed for estimating capital for bank exposures. The distributions differ for Large, Cantonal and Other banks. The methodology employed in estimating these distributions is described in the Appendix.
Almost all Swiss banks for which we have data fall into the highest CET1 bucket given in Table 1 and one may presume that NNPA ratios are very high. Given a judgment-based assumption of the distribution of Swiss bank lending to other Swiss banks, we infer the fractions that Swiss banks in the categories: Large Banks, Cantonal Banks and Other Banks, will have in each of the risk indicator buckets. These are displayed in Table 22.
To calculate the risk weights for individual banks implied by the revised SA, one must take the sum of the products of elements in the relevant block of Table 16 with the risk weights specified in Table 1. Let Nr and Nc be the number of categories corresponding to the row and column risk indicators in the table, then the risk weights for the itℎ bank are:
Nr Nc ∑ (1) RWi = ∑r=1 c=1 pr,c,i × rwr,c
Calculating BCBS 347 and BCBS 424 Revised Credit Risk SA Risk Weights
BCBS 347 and BCBS 424 make some use of risk indicators (in the case of mortgages) but much less so than BCBS 307. Here, we set out the assumptions we make in inferring bank risk weights and capital for Swiss banks under the BCBS 347 and BCBS 424 rules.
We made the following assumptions for unrated bank exposures:
• All large banks are rated
• 50% Cantonal banks and other banks are unrated
• All unrated Cantonal banks are in Grade A
• 70% unrated other banks are in Grade A and 30% unrated other banks are in Grade B
In BCBS 424, the rating category A+ to A- is assigned a risk weight 30%, while the risk weight for this category in BCCS 307 and BCBS 347 is 50%. The risk weight for rating category BBB+ to BBB- is 50% as well. Given the portfolio exposure data and the corresponding current SA risk weight, we don’t have information to identify the rating category for a 50% risk weighted exposure. To implement BCBS 424 based on the current SA framework, we assume half of the 50% risk weighted exposure is within rating category A+ to A- and will be assigned a risk weight of 30%. The other half remains unchanged.
We also made assumptions on interbank credit risk exposure distribution for different bank groups and derived the distribution of unrated bank exposures on bank group level as shown in Appendix 2. We classify corporate exposures with employee size less than 50 as SMEs. We derive the percentage from official SNB statistics report 3Ca.[17]
In the current SA, the risk weight for unrated exposures is 100%. But in the BCBS 347, the unrated exposures will be risk weighted as either 100% or 85% if they are SMEs. All other risk weighting categories remain the same. But in BCBS 424, the risk weight for rating category BBB+ to BBB- is reduced from 100% to 75%. In the current SA, risk weight for exposures fall into rating category BBB+ to BBB- and BB+ to BB- are 100%. We employ the same approach used for bank exposures to assume half of the 100% risk weighted and rated corporate exposures is within rating category BBB+ to BBBand keep the other half unchanged.
We derive the residential mortgage portfolio distribution and commercial mortgage portfolio mortgage distribution from UBS internal portfolio data and assume all banks follow the same distributions as UBS.
The results of this calculation are shown in Table 24. According to our calculation, the risk weights implied by the BCBS 307 revised SA for the different banks in Switzerland vary between 50% and 55%. The risk weights implied by the BCBS 347 revised SA for different bank groups vary between 45% and 50%. The risk weights implied by the BCBS 424 revised SA for the different banks in Switzerland vary between 35% and 40%.
Off-balance Sheet Exposure Rules
Inspection of SNB statistics indicates that all categories of Swiss banks have extended significant volumes of undrawn loan facilities to Corporate borrowers. Large banks have also provided significant undrawn facilities to Bank counter-parties.
On the basis of internal UBS data, we calculate the impacts on Corporate and Bank exposure amounts implied by the BCBS 307, BCBS 347 and BCBS 424 proposals for CCFs. In calculating BCBS 347, the effects lead to an approximate doubling of exposures to both Banks and Corporates. We, therefore, multiple the Corporate exposures of all banks by two and multiple the Bank exposures of the other large bank by two. The Commodity Trading Finance category of Specialised Lending is treated as Corporate category and is boosted by a factor of 2.6 which is derived from UBS actual portfolio data. For UBS, we use our actual estimate of the UBS exposure inclusive of the adjustment for the new CCF rates. For the CCF adjustment under BCBS 307, we follow a similar approach. The scaling factors to boost SA exposure amount are 1.11, 1.16 and 1.2 for Corporates, Banks and CTF respectively. To implement CCFs rules in BCBS 424, we adopted the same rescaling factors used in BCBS 307 as described above.
Implementing Swiss rules
Swiss banks are required to calculate minimum capital requirements based on using capital target Financial Market Supervisory Authority (FINMA) minimum capital ratios. These are equal to those specified in the Basel III framework plus additional percentages introduced as a so-called Swiss Finish[18]. FINMA minimum capital requirements depend on the size and complexity of banks, divided into 5 categories.
Table 25 lists the criteria that determine into which category an institution falls. The institution must meet at least three of the criteria listed to qualify for a given category. Table 26 shows the FINMA minimum capital ratio that banks in each category are required to employ[19].
In Switzerland, as of end 2014, only four banks have been classified by FINMA as systemically important financial institutions (SIFI) banks and allocated to category 1, and subject to higher minimum capital requirements.[20]These are UBS, Credit Suisse, Zurcher Kantonal bank (ZKB) and Raiffeisen. SIFIs banks have to hold 10% of total risk weighted assets in CET1 capital (comprising common shares, retained earnings and other comprehensive income net of regulatory filters and deductions).
In addition to CET1 minimum capital requirements, SIFIs have to hold contingent convertible bonds (CoCos) that convert into common equity contingent on the breach of a predetermined ratio of CET1 over total RWA. SIFIs are also required to hold a conservation buffer of 3% in form of high trigger CoCos[21], and a progressive component from 1% to 6% of low trigger CoCos.[22]
The amount of resolution CoCos a bank must hold depends on the systematic importance of the banks (including total exposure, market share in Switzerland and resolvability considerations). Because of lack of data, the remaining non-SIFI banks are allocated to the FINMA categories 2 to 5 based exclusively on the total asset criterion.
Using the assumptions and data described above, one may deduce the capital requirement for the itℎbankfor a given regulatory asset class j using the following equation:
target × EADi,j) , if bank i is a SIFI bank max(RWAtargeti,j × RWi,j × EADi,j , Li,j Ki,j = { target × RWi,j × EADi,j , otℎerwise (2) RWAi,j
target is the leverage ratio Here, RWAtargetis the risk weight target for the bank in question andLi target × 24% . target. Under Swiss regulations, Ltargeti,j is equal to RWAi,j
In what follows, we shall focus mainly on the impact of changes in the rules on CET1 capital although we present results below on total regulatory capital as well.
For each SIFI bank i, we adjust the capital by a convexity adjustment ratio which is calculated as follows: target target N N max (∑j=1RWAj×RWAj ,∑j=1EADj×LRDj ) (3) ConvexityAdji = ∑Nj=1max (RWAj×RWAjtarget,EADj×LRDjtarget)
Here, N is the number of asset classes. Such convexity adjustments are implemented in some banks and serve to ensure that the individual exposure class capital amounts add up to total capital once the effects on the latter of both regulatory capital and leverage ratio rules are allowed for.
Formula (2) may then be modified as follows
target × EADi,j) × ConvexityAdji , if bank i is a SIFI max(RWAtargeti,j × RWi,j × EADi,j , Li,j (4) Ki,j = { target × RWi,j × EADi,j , otℎerwise RWAi,j
Up to now, we have concentrated on capital for the exposures of Swiss banks to other Swiss banks. We employ similar approaches to deduce the effect of the revised SA on capital for other asset classes, notably Corporate Loans, Commercial and Residential Mortgages and Specialised Lending.
We deduce the corresponding risk weights using the weights for specific risk driver ranges appropriate to Corporate Loans, Commercial and Residential Mortgages, respectively, in Tables 2, 3 and 4. In so doing, we use risk factor distributions based on internal, confidential data supplied by UBS.[23]These distributions consist of the frequencies of loans for the different regulatory risk factor buckets with conditional default probability being in certain specified ranges.
It is sensible to condition on credit quality in this way because the distribution of loans across risk factors is likely to be very different for high and low credit quality loans. Since we possess data on the default probabilities of loans deduced either directly from IRBA default probabilities or inferred from SA risk weights, by conditioning as just described, we are able to obtain a more accurate estimate of the capital impact.
Note: For information on data definitions and sources, see notes to Table 18 and footnote 11.
| Banks | Financing | Corporate | Households | Mortgage | |
|---|---|---|---|---|---|
| Large banks | 9,167 | 48,112 | 59,211 | 197,369 | 256,580 |
| Cantonal banks | 10,360 | 45,274 | 95,645 | 220,358 | 316,003 |
| Other | 68,535 | 40,965 | 66,512 | 257,584 | 324,096 |
| All banks | 88,062 | 134,351 | 221,368 | 675,311 | 896,679 |
Note: Figures displayed are in CHF Million and pertain to the end of 2014. The data source is Swiss National Bank (SNB) reports.[10]
| Bank Names Bank | Groups RW | Unavailable |
|---|---|---|
| Credit Suisse Large | banks | NO |
| UBS Large | banks | NO |
| Raiffeisen | Other | NO |
| Aargauische Kantonalbank Cantonal | banks | NO |
| Appenzeller Kantonalbank Cantonal | banks | YES |
| Banca dello Stato del Cantone Ticino Cantonal | banks | NO |
| Banque Cantonale de Genève Cantonal | banks | NO |
| Banque Cantonale du Jura Cantonal | banks | YES |
| Banque Cantonale Neuchâteloise Cantonal | banks | NO |
| Banque Cantonale Vaudoise Cantonal | banks | NO |
| Basellandschaftliche Kantonalbank Cantonal | banks | NO |
| Basler Kantonalbank Cantonal | banks | NO |
| Berner Kantonalbank Cantonal | banks | NO |
| Freiburger Kantonalbank Cantonal | banks | NO |
| Glarner Kantonalbank Cantonal | banks | YES |
| Graubundner Kantonalbank Cantonal | banks | NO |
| Luzerner Kantonalbank Cantonal | banks | NO |
| Nidwaldner Kantonalbank Cantonal | banks | YES |
| Obwaldner Kantonalbank Cantonal | banks | YES |
| Schaffauser Kantonalbank Cantonal | banks | NO |
| Schwyzer Kantonalbank Cantonal | banks | NO |
| St. Galler Kantonalbank Cantonal | banks | NO |
| Thurgauer Kantonalbank Cantonal | banks | NO |
| Urner Kantonalbank Cantonal | banks | YES |
| Walliser Kantonalbank Cantonal | banks | NO |
| Zuger Kantonalbank Cantonal | banks | NO |
| Zurcher Kantonalbank Cantonal | banks | NO |
| Bank J. Safra Sarasin | Other | YES |
| Bank Linth | Other | NO |
| Cembra Money Bank | Other | YES |
| Clientis | Other | NO |
| Coop Bank | Other | NO |
| Julius Baer | Other | NO |
| Migros Bank | Other | NO |
| Neue Aargauer Bank | Other | YES |
| Valiant Holding | Other | NO |
| WIR Bank | Other | YES |
Note: The table displays the list of banks for which we analyse credit risk exposures to Bank, Corporate and Mortgage Borrowers. The banks are categorised as Large, Cantonal and Other. The right hand column provides information on whether the Pillar 3 Disclosures or Annual Report of the bank in question contains break downs of credit exposures by PDs or risk weights.
| Bank groups | Banks | Corporates | Cml. Mtg. | Res. Mtg. Total | Mtg. |
|---|---|---|---|---|---|
| Large banks | 9,167 | 48,112 | 72,837 | 183,743 | 256,580 |
| Cantonal banks | 10,360 | 45,274 | 59,575 | 256,428 | 316,003 |
| Other | 68,535 | 40,965 | 29,525 | 294,571 | 324,096 |
| All banks | 88,062 | 134,351 | 161,938 | 734,741 | 896,679 |
Note: Bank level data is only available for end 2013 except for the two large banks (for which end 2014 is available). We rescale data for all except the two large banks so that the aggregates are consistent with end 2014 aggregate data published by the SNB. The resulting rescaled, bank level data is what we
| Rating | PD | Rating | PD | Rating | PD |
|---|---|---|---|---|---|
| AAA | 0.02% | A- | 0.08% | BB- | 2.70% |
| AA+ | 0.04% | BBB+ | 0.17% | B+ | 4.60% |
| AA | 0.04% | BBB | 0.17% | B | 7.75% |
| AA- | 0.04% | BBB- | 0.35% | B- | 13.00% |
| A+ | 0.08% | BB+ | 0.63% | Cs | 22.00% |
| A | 0.08% | BB | 1.00% | Default | 1 |
Note: When a bank reports risk weights for a particular loan book, we infer the implied rating category using the existing SA rules and then deduce a corresponding default probability (PD) using the master scale shown in this table. The master scale was provided by UBS.
| Bank group SME | perc |
|---|---|
| Large banks | 76% |
| Cantonal banks | 50% |
| Other banks | 71% |
Note: This table shows the percentage of SMEs consisted in corporate exposures for each bank group. Companies with size less than 50 are classified as SMEs.
| Large | Cantonal | Other | ||
|---|---|---|---|---|
| banks | banks | banks | ||
| BCBS | 307 | 53% | 55% | 49% |
| BCBS | 347 | 48% | 51% | 46% |
| BCBS | 424 | 37% | 38% | 33% |
Note: This table shows estimates of Swiss banks’ risk weights for exposures to other Swiss banks.
| Assets under | Privileged | Required | |||
|---|---|---|---|---|---|
| Total assets | management | deposits | equity | ||
| Category | 1 | ≥ 250 | ≥ 1,000 | ≥ 30 | ≥ 20 |
| Category | 2 | ≥ 100 | ≥ 500 | ≥ 20 | ≥ 2 |
| Category | 3 | ≥ 15 | ≥ 20 | ≥ 0.5 | ≥ 0.25 |
| Category | 4 | ≥ 1 | ≥ 2 | ≥ 0.1 | ≥ 0.05 |
| Category | 5 | < 1 | < 2 | < 0.1 | < 0.05 |
Note: Swiss rules on capital target ratios differentiate banks based on 5 categories. To qualify for a particular category the scale of a bank’s activities as measured by at least three of four quantitative indicators must exceed specified thresholds. This table displays the thresholds expressed in CHF millions.
| ratio | ratio | ||
|---|---|---|---|
| Category | 1 | 10% | 14% - 19% |
| Category | 2 8.7% | - 9.2% 13.6 | -14.4% |
| Category | 3 | 7.80% | 12% |
| Category | 4 | 7.40% | 11.20% |
| Category | 5 | 7% | 10.50% |
Note: Swiss banks that fall into the categories listed in Table 25 are required to employ the capital target ratios shown in this table. We employ these ratios in our calculations of the capital impact of the revised credit risk SA for Bank and Corporate. For Commercial mortgage exposures and Residential Mortgages, we add an additional 2% reflecting the countercyclical capital buffer adopted by the Swiss authorities for such exposures.
4. Spread impact analysis
In this section, we describe how we investigate the spread impact, at an asset class level, for each bank. We assume that:
RSA EAD ∆spread= capitalnew × return on equitynew × Current SA EAD − capitalold × return on equityold (5)
Here the “capital level” is measured per Swiss franc of exposure. To estimate the return on equity, we use the Capital Asset Pricing Model (CAPM) employed in this context by Kashyap, Stein and Hanson
(2010) and by subsequent studies such as Miles, Yang and Marcheggiano (2012) and Junge and Kugler (2013).
This CAPM methodology allows for the possibility that the required return on equity that a bank faces is reduced if its total capital level increases. The required return on equity according to the CAPM equals the net premium on the equity market multiplied by the coefficient of the bank’s asset return in a regression on an appropriately selected market index. (This net premium on the equity market equals the expected return on the market index minus the return on a short-dated Treasury security.)
Thus, for asset class i belonging to bank j, the spread change ∆spreadi,j is calculated as:
RSA EAD SA × SA) × γ, constant cost of equity (Ki,jRSA × βj Current SA EAD −Ki,jSA × βj (6) ∆spreadi,j = { RSA EAD RSA × SA) × γ, varying cost of equity (Ki,jRSA × βj Current SA EAD −Ki,jSA × βj
(.) is the capital requirement per unit exposure amount expressed as: Here, Ki,j target) , if exposure i belongs to a SIFI bank max(RWAtargeti,j × RWi,j(.) , Li (.) = { (7) Ki,j (.) , otℎerwise RWAtargeti,j × RWi,j (.) is the average risk weight of asset class i in bank j, γ is the equity market risk premium and is RWi,j set to be 6% in our calculation.[24]βj is the bank’s equity market beta, the regression coefficient of the bank’s equity return (net of the safe rate) on a relevant (net) market index equity return. The capital (.) is then adjusted in the same manner as described in equations (3) and (4). Ki,j
We investigate the spread impact using either the CET1 capital target or the total capital target as RWAtarget in equation (7).
Several past studies have emphasised the possibility that when a bank increases its capital levels, its beta and hence cost of equity funding will fall. This “Modigliani-Miller effect”, while indisputably relevant, may be of greater or lesser magnitude and, hence, should be analysed empirically.[25]
According to a strict version of the Modigliani-Miller theory (in which banks are viewed as simple and transparent asset pools financed by debt and equity), the bank’s equity market beta should equal:
Equity Debt βAsset = βEquity × Assets + βDebt × Assets (8)
For simplicity, we suppose that the bank’s debt is close to riskless so that:βDebt = 0, and abstracts from tax effects. In this case, the bank’s equity beta will be proportional to the assets-to-equity or “leverage” ratio. Assets βEquity = βAssets × Equity (9)
The above reasoning depends on the absence of frictions such as (i) asymmetries of information between bank insiders and the market, (ii) agency effects in the running of the bank, (iii) asymmetries in the tax treatment of debt and equity. In this sense, it corresponds to an idealised, extreme case. To evaluate the empirical magnitude of Modigliani-Miller effects, we allow for a more general dependence of bank beta on leverage in that we suppose:
Assets βEquity = α[0] + α[1] × Equity (10)
Following other authors, we estimate the parameters α[0] and α[1] by (i) estimating betas for a set of banks in different time periods and then (ii) regressing these estimated betas on the leverage level that the relevant bank had at the start of the period in question.
There are several important choices that must be made in formulating such regressions. First, one must select an appropriate sample of banks, data frequency, equity index and window length for the beta estimation. Second, having estimated betas, one may choose whether to estimate the relationship between betas and leverage in a fully pooled way or whether to allow for period-specific or bank specific parameters. Since the regression of beta on leverage has a panel-data form, this latter choice amounts to deciding whether or not to use fixed effects.
Figure 2 shows the log prices of the Swiss banks we covered in regression while Figure 3 shows the Swiss market index. The share prices of the Large Banks and some of the Other Banks appear reasonably correlated with the Swiss equity market index. The Cantonal Bank equity prices on the other hand show little correlation and, indeed, exhibit relatively little volatility.
Tables 27 and 28 present results for a range of different equations. Our sample period stretches from 1999 to 2014. The banks included in the estimations are all from Switzerland, the Eurozone or the UK and are chosen on the basis that their assets exceed 10 billion national currency units at the end of the sample period.
In all cases, we employ weekly data to estimate the betas. This partly offsets concerns that the equity securities of some banks in the sample might be illiquid. We repeated the exercises using daily data and did not obtain appreciably different results. We estimate betas using data windows one year in length. Again, we verified that the results are not substantially different if a six month window length is employed.
The regressions for which we show results in Table 27 vary according to the group of banks analysed: we exhibit regressions for (a) Swiss banks alone, (b) UK banks alone, (c) Eurozone banks alone and
(d) all banks. In each of these four cases, we show results for regressions with no bank or year dummies, with year dummies alone, with banks dummies alone, and with both year and bank dummies.
Table 28 shows the same regressions but employing a single European index while the results shown in Table 27 correspond to regressions in which the betas for Swiss, UK and Eurozone banks are measured with respect to Swiss, UK or Eurozone indices, respectively.
In all the regressions, the right hand side variables, including the dummies, are demeaned prior to the performing the regression. Hence, the constant in the regression equals the unconditional mean of the left hand side variable in the regression. We will assume, in what follows, that the premium on the equity index is 6%. Since the return on equity equals the product of beta and the premium, we scale the left hand side variable in the regression by 6 so that the constant may be interpreted as the average return on equity across banks implied by the regression expressed in percent.
As one may observe, the average returns on equity implied by the regression constants are low, being 4.3, 7.7, 4.9 and 5.1 percent when national indices are used to estimate betas. Typical returns on equity employed within large European banks are closer to 10%. Inspection of betas for individual banks suggested that there was considerable variation across banks, justifying the use of bank specific dummies in the regression.
Examination of the estimates contained in Tables 27 and 28 shows that when bank-specific fixed effects are introduced, the value of the regression coefficient on leverage is significantly reduced. For example, in the case of Swiss banks using betas against a Swiss national index, the leverage coefficient drops from 0.20 to 0.07 when one compares regression 2 (which employs year dummies alone) to regression 4 (which uses both bank and year dummies).[26]
It appears likely that the reduction in the size of the leverage effect that occurs when bank dummies are introduced is a reflection of the fact that large banks tend to be more leveraged and have higher correlation with equity market indices. However, one might reasonably expect that the degree of variation in leverage for individual banks across the sample period should be enough to identify significant leverage effects in required returns on equity if they are present in the data.
In the exercises we report below, we will use the estimates corresponding to regression 4 (i.e., including year and bank dummies). This panel data approach seems to us the most defensible given the issues referred to in the last paragraph. The approach is also consistent with that employed in studies by Miles, Yang and Marcheggiano (2012) and Junge and Kugler (2013). We also choose to focus on Swiss banks and to use a Swiss national index. These assumptions appear most sensible given that our study relates to Swiss banks.
One might ask why do we find weaker leverage effects than Miles, Yang and Marcheggiano (2012) and Junge and Kugler (2013)? The latter study employs a log specification of regression. The theory, we would argue is more consistent with the linear specification that we use. In preferring the linear specification, we are consistent with Miles, Yang and Marcheggiano (2012). When we restrict our data to UK banks and the sample period of Miles, Yang and Marcheggiano (2012), we obtain results similar to theirs.
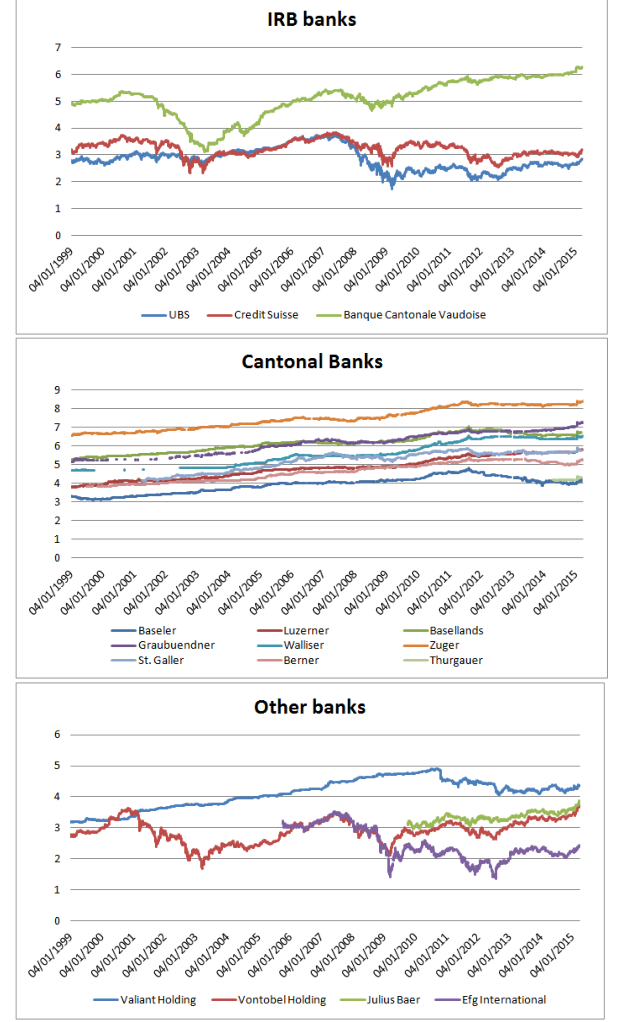
Note: The figure shows the log share prices of Swiss banks from 1999 to 2015 taken from Bloomberg. Cantonal bank share price time series (apart from that of Banque Cantonale Vaudoise) trend upwards with little volatility suggesting relatively low liquidity. Share prices for the two large banks appear less correlated with those of other banks.
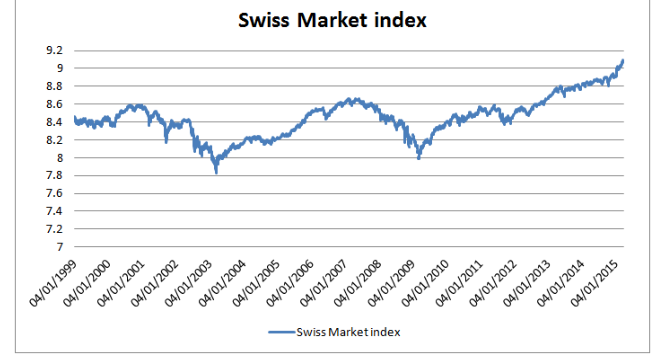
Note: The figure shows the Swiss stock market index from 1999 to 2015 taken from Bloomberg. The index appears correlated with the large bank share prices exhibited in Figure 2 until late in the sample period (post 2011) when the bank share prices under-perform the index.
| Swiss banks | UK banks | Euro | zone | banks | European | banks | ||||||||||
|---|---|---|---|---|---|---|---|---|---|---|---|---|---|---|---|---|
| Regression | 1 | 2 | 3 | 4 | 1 | 2 | 3 | 4 | 1 | 2 | 3 | 4 | 1 | 2 | 3 | 4 |
| Constant(%) | 4.32 | 4.32 | 4.32 | 4.32 | 7.71 | 7.71 | 7.71 | 7.71 | 4.93 | 4.93 | 4.93 | 4.93 | 5.08 | 5.08 | 5.08 | 5.08 |
| t-statistic | 15.34 | 14.86 | 24.49 | 24.55 | 26.79 | 36.54 | 27.69 | 41.20 | 35.85 | 39.92 | 44.05 | 56.63 | 42.53 | 45.42 | 54.70 | 66.74 |
| Leverage(%) | 0.19 | 0.20 | 0.08 | 0.07 | 0.13 | 0.08 | 0.16 | 0.01 | 0.12 | 0.13 | 0.04 | 0.06 | 0.13 | 0.14 | 0.05 | 0.04 |
| t-statistic | 8.80 | 8.23 | 2.64 | 2.28 | 3.24 | 2.23 | 2.86 | 0.16 | 8.34 | 9.88 | 1.79 | 2.82 | 11.34 | 12.52 | 2.78 | 2.44 |
| R-squared | 0.38 | 0.42 | 0.79 | 0.82 | 0.12 | 0.62 | 0.22 | 0.72 | 0.09 | 0.28 | 0.45 | 0.68 | 0.13 | 0.25 | 0.52 | 0.68 |
| WACC(%) | 0.55 | 0.44 | 2.84 | 2.90 | 5.22 | 6.22 | 4.63 | 7.52 | 2.43 | 2.21 | 4.01 | 3.74 | 2.32 | 2.15 | 4.11 | 4.34 |
| Observations | 129 | 129 | 129 | 129 | 80 | 80 | 80 | 80 | 680 | 680 | 680 | 680 | 889 | 889 | 889 | 889 |
Note: The regressions are defined as follows Regression 1: OLS Regression with no bank or year dummies; Regression 2: Fixed effect with year dummy: 2014 dropped; Regression 3: Fixed effect with bank dummy: Walliser Kantonal bank dropped for Swiss banks, Standard Chartered dropped for UK banks, Vseobecna Uverova Banka dropped for Eurozone Banks and European banks. Regression 4: Fixed effect with bank dummy and year dummy: 2014 dropped; Walliser Kantonal bank dropped for Swiss banks, Standard Chartered dropped for UK banks, Vseobecna Uverova Banka dropped for Eurozone Banks and European banks.
| Swiss banks | UK banks | Euro | zone | banks | European | banks | ||||||||||
|---|---|---|---|---|---|---|---|---|---|---|---|---|---|---|---|---|
| Regression | 1 | 2 | 3 | 4 | 1 | 2 | 3 | 4 | 1 | 2 | 3 | 4 | 1 | 2 | 3 | 4 |
| Constant(%) | 3.55 | 3.55 | 3.55 | 3.55 | 7.54 | 7.54 | 7.54 | 7.54 | 5.57 | 5.57 | 5.57 | 5.57 | 5.44 | 5.44 | 5.44 | 5.44 |
| t-statistic | 13.39 | 12.89 | 23.35 | 24.35 | 23.12 | 33.00 | 23.94 | 37.06 | 36.99 | 40.58 | 45.86 | 56.78 | 42.17 | 44.45 | 54.47 | 64.38 |
| Leverage(%) | 0.18 | 0.18 | 0.08 | 0.05 | 0.14 | 0.07 | 0.20 | 0.01 | 0.13 | 0.15 | 0.04 | 0.06 | 0.14 | 0.15 | 0.05 | 0.04 |
| t-statistic | 8.81 | 7.98 | 3.11 | 1.86 | 3.24 | 1.92 | 3.22 | 0.17 | 8.51 | 9.95 | 1.41 | 2.44 | 11.09 | 12.08 | 2.59 | 2.36 |
| R-squared | 0.38 | 0.41 | 0.82 | 0.86 | 0.12 | 0.65 | 0.22 | 0.74 | 0.10 | 0.27 | 0.46 | 0.66 | 0.12 | 0.22 | 0.52 | 0.66 |
| WACC(%) | 0.00 | -0.01 | 2.05 | 2.59 | 4.73 | 6.16 | 3.61 | 7.33 | 2.77 | 2.53 | 4.78 | 4.41 | 2.52 | 2.35 | 4.47 | 4.65 |
| Observations | 129 | 129 | 129 | 129 | 80 | 80 | 80 | 80 | 680 | 680 | 680 | 680 | 889 | 889 | 889 | 889 |
Note: The regressions are defined as follows Regression 1: OLS Regression with no bank or year dummies; Regression 2: Fixed effect with year dummy: 2014 dropped; Regression 3: Fixed effect with bank dummy: Walliser Kantonal bank dropped for Swiss banks, Standard Chartered dropped for UK banks, Vseobecna Uverova Banka dropped for Eurozone Banks and European banks. Regression 4: Fixed effect with bank dummy and year dummy: 2014 dropFped; Walliser Kantonal bank dropped for Swiss banks, Standard Chartered dropped for UK banks, Vseobecna Uverova Banka dropped for Eurozone Banks and European banks.
5. Results
In this section, we report the results of our capital and spread impact calculations. We begin by examining the effect of the switch from the current to the revised SA approach for SA banks. Table 29 presents the weighted average risk weights for different asset classes and categories of banks. The weighted averages are worked out using weights based on each individual bank’s share of the total exposure of the set of banks being considered.
One may observe from Table 29. that the existing weighted average risk weights for all SA banks are 19%, 66%, 92% and 39% for Bank, Corporate, Commercial Mortgage and Residential Mortgage exposures, respectively. There is little variation across the categories of Cantonal and Other SA banks.
Substituting the BCBS 307 revised SA for the existing SA, risk weights change substantially, rising to 120% for Corporate exposures (almost double the existing risk weight level). Bank risk weights are somewhat higher under the revised rather than the existing SA, and risk weights for Residential Mortgages are actually down from 39% to 37%. Risk weights for Commercial Mortgages drop from 92% to 87%.
Substituting the BCBS 347 revised SA for the existing SA, risk weights change much less than they do under the BCBS 307 proposals. As we mentioned in Section 2, for bank exposures and corporate exposures, in BCBS 347, only unrated exposures are treated differently compared to the current SA. Risk weights for Commercial Mortgages drop to 83% while Residential Mortgages increase to 43%.
Substituting the BCBS 424 revised SA for the existing SA, risk weights change much less than they do under the BCBS 307 proposals. As we mentioned in Section 2, for bank exposures and corporate exposures, in BCBS 347, only unrated exposures are treated differently compared to the current SA. Risk weights for Commercial Mortgages drop to 83% while Residential Mortgages increase to 43%.
Substituting the BCBS 424 revised SA for the existing SA, risk weights change substantially, reducing to 62% for Corporate exposures. Bank risk weights remain at the same level as under the existing SA, and risk weights for Residential Mortgages are actually down from 39% to 27%. Risk weights for Commercial Mortgages drop from 92% to 75%.
Figure 4 shows the key results from Table 29 in graphical form. Under BCBS 307, Corporate and Bank revised SA risk weights are respectively 82% and 73% higher than the existing SA risk weights, while Commercial Mortgage and Residential Mortgage risk weights are 6% and 4% lower. Under BCBS 347, Bank and Residential Mortgage risk weights are 3% and 11% higher, while Corporate and Commercial Mortgage risk weights are 6% and 10% lower. Under BCBS 424, Corporate, Commercial Mortgage and Residential Mortgage risk weights are 6% ,19% and 29% lower.
Table 30 shows the implied changes in capital that SA banks devote to different segments of the Swiss loan market. Under BCBS 307, the existing CHF 4.3 billion and CHF 1.3 billion capital that SA banks assign to Corporate and Bank lending rises to CHF 8.8 billion and CHF 2.1 billion after the introduction of the revised SA. This is offset by a fall of around CHF 0.22 billion in the capital that Swiss SA banks hold against Commercial and Residential Mortgage lending. Under BCBS 347, there is almost no change in Bank capital. The capital that SA banks hold against Corporate rises to CHF 8.2 billion, however, due to the significant increase in SA exposure amount. The BCBS 347 effects are largely the consequence of the proposal changes in CCF rules. Under BCBS 424, there is almost no change in Bank capital. The capital that SA banks hold against Corporate rises to CHF 8.1 billion. The capital that SA banks hold against Commercial and Residential Mortgage lending decrease from CHF 7.6 billion and CHF 22 billion to CHF 6.2 billion and CHF 15.5 billion.
Table 31 shows risk weight calculations results for IRB banks under different scenarios. We present risk weights for the different asset classes and aggregated using exposure-weighted averages (i) under the existing rules, (ii) assuming the revised SA is introduced, (iii) with the revised SA and with 60% exposure-level capital floors, (iv) as in (iii) but with asset-class level floors, and (v) as in (iii) but with a bank level floor. We then repeat scenarios (iii), (iv) and (v) assuming capital floors are imposed equal to 72.5% and 80% of the revised SA capital levels.
The introduction of the revised SA makes almost no direct difference to the IRB banks. (The only slight change evident in Corporate risk weights occurs because while predominantly applying the IRBA rules, these banks calculate capital for a small proportion of their Corporate exposures under SA rules.) The introduction of revised SA-capital-based floors has a very large impact, however, on the capital of the IRB banks.
Under the BCBS 307 revised SA, the 72.5% floor imposed at the bank level boosts IRB banks’ Corporate, Commercial Mortgage, Residential Mortgage and Specialized Lending risk weights from 43%, 17%, 11% and 29% to 89%, 61%, 27% and 88%, respectively.
Under BCBS 347 revised SA, the 72.5% floor imposed at the bank level boosts IRB banks’ Bank, Corporate, Commercial Mortgage , Residential Mortgage and Specialized Lending risk weights from 30%, 43%, 17%, 11% and 29% to 37%, 63%, 60% , 31% and 50%, respectively.
Under BCBS 424 revised SA, the 72.5% floor imposed at the bank level boosts IRB banks’ Bank, Corporate, Commercial Mortgage , Residential Mortgage and Specialized Lending risk weights from 30%, 43%, 17%, 11% and 29% to 32%, 63%, 55% , 20% and 40%, respectively.
Note that an exposure level floor is more conservative in its impact on capital than an asset class level floor which, in turn, is more conservative than a bank level floor. This intuitive finding results from the fact that there may be offsets when the floor is applied at a more aggregate level. However, imposing capital floors at the three different levels leads to broadly similar results in practice.
Figure 5 shows the overall risk weight impact by asset class with 72.5% bank level floors. Under BCBS 307, risk weights reduced by 17% for Bank exposures, rise 108% for Corporate exposures, 263% for Commercial Mortgages, 133% for Residential Mortgages and 202% for Specialized Lending. While under BCBS 347, risk weights rise by 25%, 49%, 259%, 172% and 72% for Banks, Corporates, Commercial Mortgages, Residential Mortgages and Specialized Lending respectively. Under BCBS 424, risk weights rise by 8%, 49%, 226%, 73% and 39% for Banks, Corporates, Commercial Mortgages, Residential Mortgages and Specialized Lending respectively.
Table 32 shows the impact on the capital of the IRB banks of the various scenarios so far considered. Overall (based on total capital across IRB banks and the five Swiss loan asset classes we consider), under BCBS 307, capital is 98% higher than current levels, if a bank level 72.5% floor is introduced. The increases for Corporate and Commercial Mortgage exposures are 187% and 181%, while capital held against Residential Mortgages rise by just 24%. In monetary terms, the capital that the three IRB banks hold against their Swiss lending rises from CHF 9.29 billion to CHF 18.41 billion, in this case. Under BCBS 347, the total capital is 107% higher than current levels, if a bank level 72.5% floor is applied. Capital held against Bank, Corporate, Commercial and Residential Mortgage exposures are 176%, 246%, 178% and 45% higher than the current levels. Under BCBS 424, the total capital is 38% higher than current levels, if a bank level 72.5% floor is applied. Capital held against Bank,
Corporate, Commercial and Residential Mortgage exposures are 26%, 94%, 136% and 2% higher than the current levels.
Table 33 shows the impact on the total capital that all banks hold against different asset classes. If a bank level 72.5% floor is introduced for IRB banks, under BCBS 307, the increases in capital for exposures to Banks, Corporates and Specialized Lending are 55%, 126% and 232%. Capital held against Commercial Mortgages and Residential Mortgages rises by just 14% and 2%, in the same case. Under BCBS 347, the increase in capital held against Bank, Corporate, Commercial Mortgage, Residential Mortgage and Specialised Lending exposures are 33%, 132%, 10%, 18% and 108% respectively. Under BCBS 424, the capital held against Bank, Corporate and Specialised Lending exposures increase by 4%, 28% and 42% respectively. While the capital held against Commercial Mortgage and Residential Mortgage dropped by 2% and 23%.
We now turn to the spread implications of the Basel Committee’s proposed BCBS 306, 307, 347 and 424 capital rule changes. We calculate the spread impact using equations (6) and (7) in Section 4. We multiply post-rule change risk weights by the relevant capital target to obtain the per-Swiss-franc capital level under the new rules. We adjust for the leverage ratio target if the bank is a SIFI as in equation (7) and impose the relevant floor if this is included in the scenario we are examining. We multiply the resulting per Swiss-franc capital by the required equity return. We subtract off the prerule-change capital multiplied by a pre-rule-change required return on equity.
Table 34 shows the resulting weighted average (across individual banks) spread impacts for SA banks, specifically for Cantonal and Other banks. We report spread impacts assuming that the capital rule changes reduce leverage and hence lead to a reduction in the cost of equity. The calculation of the reduction in cost of equity employs the Swiss bank regression 4 results (with both bank and year dummies) from Table 27.
The SA bank spread impacts shown in Table 34 are sizeable for exposures to Corporates under both BCBS 307, BCBS 347 and BCBS 424. Under BCBS 347, the spread for Corporates rises by 38 basis points for all SA banks when a CET1 capital target is employed and by 57 basis points when a total capital target is used. SA bank spreads for Commercial Mortgages drop by 12 basis when a total capital target ratio is employed under BCBS 347. Under BCBS 424, the spread for Corporates rises 2 basis points for all SA banks when a CET 1 capital target is employed and by 3 basis points when a total capital target is use. SA bank spreads for Commercial Mortgages drop by 19 basis points when a total capital target ratio is employed under BCBS 424. SA bank spreads for Residential Mortgages drop by 14 basis points when a total capital target ratio is employed under BCBS 424.
Table 35 shows the spread impact of introducing the revised SA and a bank level floor for weighted averages of IRB banks and IRB and SA banks combined for the different asset classes under assumptions of (i) CET1 and (ii) total capital target ratios and a reduced cost of equity through a Modigliani-Miller effect. Assuming (ii) rather than (i) boosts the impact substantially, as one might expect.
When the BCBS 307 rules are applied, applying a CET1 target ratio, one finds that IRB and SA banks’ Corporate spreads are 54 basis points higher with the 72.5% revised SA floor, while Commercial Mortgage, Residential Mortgage and Specialised Lending spreads are 12, 1 and 62 basis points higher. When the total capital target ratio is applied, the spread increases are 86, 19, 1 and 107 basis points. The weighted average across asset classes of spread impacts is 11 basis points for the CET1 target ratio and 18 basis points for the total capital target ratio.
When the BCBS 347 rules are applied, applying a CET1 target ratio, Bank, Corporate, Commercial Mortgages, Residential Mortgages and Specialised Lending spreads are 6, 58, 8, 6 and 35 basis points higher with the 72.5% revised SA floor. When the total capital target ratio is applied, the spread increases are 10, 95, 15, 9 and 60 basis points. The weighted average across asset classes of spread impacts is 13 basis points for the CET1 target ratio and 21 basis points for the total capital target ratio.
When the BCBS 424 rules are applied, applying a CET1 target ratio, Bank, Corporate, Commercial Mortgages, Residential Mortgages and Specialised Lending spreads are 1, 16, 3, -7 and 14 basis points higher with the 72.5% revised SA floor. When the total capital target ratio is applied, the spread increases are 2, 27, 7, -9 and 24basis points. The weighted average across asset classes of spread impacts is -2 basis points for the CET1 target ratio and -1basis points for the total capital target ratio. Figures 7 and 8 show the spread effects graphically.
Our results may be compared to those of studies that have examined the impact of capital rules changes on spreads in Swiss loan markets. Basten and Koch (2014) use panel data on mortgage offers to examine whether Swiss banks raised mortgage lending rates because of the introduction of the
Counter-Cyclical Buffer increase in capital target rates. (In February 2013, the Swiss authorities activated a Counter Cyclical Buffer requiring banks to increase CET1 capital by an amount equal to 1% of their risk-weighted domestic Residential Mortgages by September 2013.)
Basten and Koch find that, following the change, banks charged on average 17 to 18 basis points more while insurers charged on average 26 to 28 basis points more. The later finding suggests that banks are the marginal price setters and that insurers took the opportunity created by pressure on bank capital to raise their lending spreads significantly.
Table 36 contains annual flow costs of lending and discounted sums of future costs. One may observe that the costs are between CHF 0.95 billion and CHF 2.44 billion if BCBS 307 rules are applied and the costs are between CHF 1.14 billion and CHF 2.81 billion if BCBS 347 rules are applied. Under BCBS 424, the costs are negative for most cases.
Assuming a discount rate of 3%, we present estimates of the present discounted sum of future costs in 81 billion under BCBS 307, while the cost is between CHF 38 billion and CHF 94 billion under BCBS 347. The cost is between CHF -10.97 billion and CHF 4.7 billion under BCBS 424.
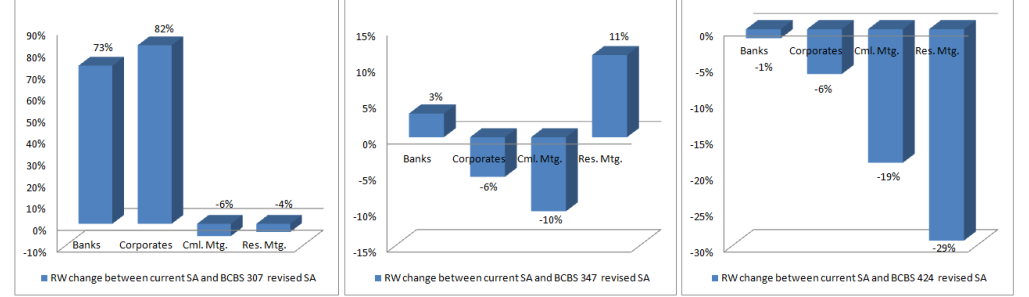
Note: The figure shows percentage changes in risk weights of Swiss SA banks (for selected exposure categories) implied by a switch from the current SA to the revised credit risk SA rules in BCBS 307, BCBS 347 and BCBS 424. The exposure categories shown are bank exposures, corporate loans, commercial mortgages and residential mortgages. The figure shows substantial increases in bank exposure and corporate loan risk weights and small declines in mortgage related risk weights.
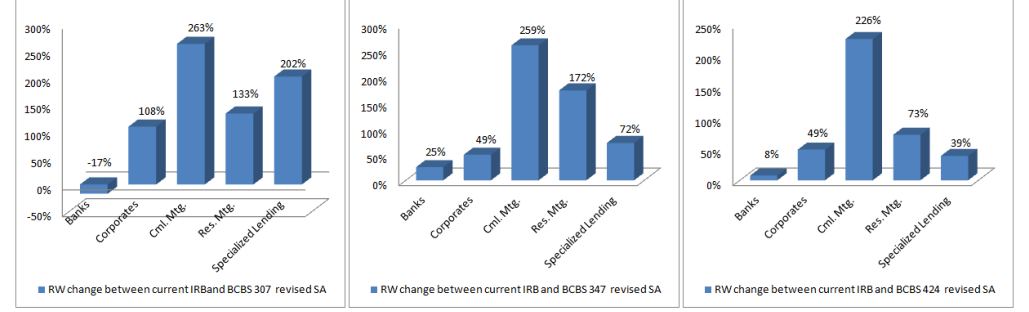
Note: The figure shows percentage changes in weighted average IRBA bank risk weights for four exposure categories: Bank Exposures, Corporate Loans and Commercial and Residential Mortgages and Specialized Lendings. The calculations are performed assuming bank level floor equal to 72.5% of the revised credit risk SA risk weights. All except bank exposure risk weights are substantially increased by the introduction of the revised credit SA risk weight floor.
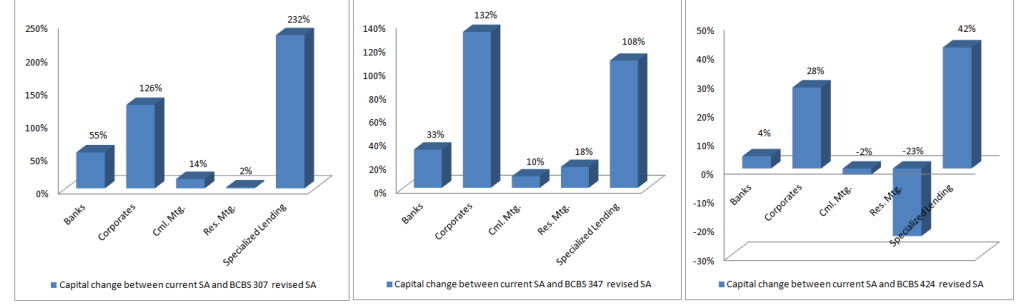
Note: The figure shows the percentage change in the total capital of Swiss banks, broken down by asset class, when the current rules are replaced with the revised credit risk SA and 72.5% bank level floors.
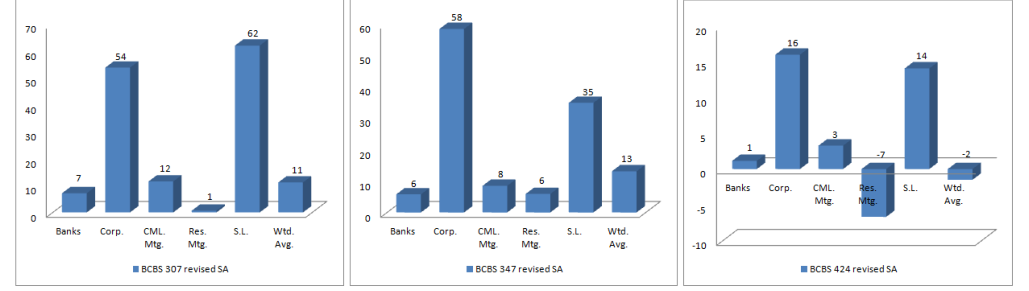
Note: The figure shows spread impacts (in basis points and allowing for endogenous cost of equity) for all banks. The spread impacts are weighted by banks’ relative exposure volumes and assume the revised credit risk SA is introduced with a bank level 72.5% IRBA risk weight floor and that the capital impact is based on the CET1 ratio.
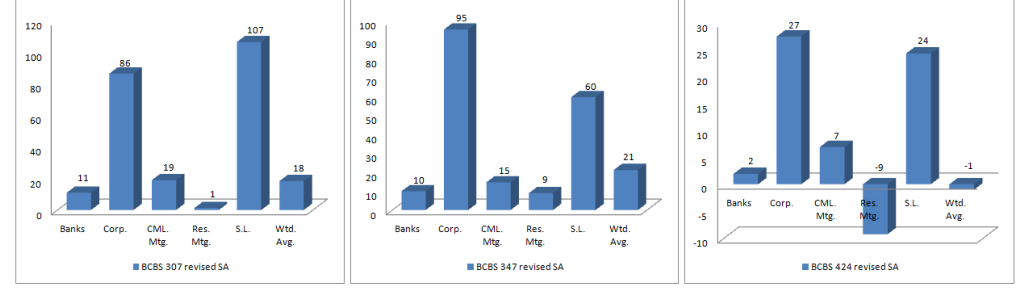
Note: The figure shows spread impacts (in basis points and allowing for endogenous cost of equity) for all banks. The spread impacts are weighted by banks’ relative exposure volumes and assume the revised credit risk SA is introduced with a bank level 72.5% IRBA risk weight floor and that the capital impact is based on the Total Capital.
| Bank groups | Banks | Corporates Cml. | Mtg. Res. | Mtg. Wtd. | Avg. | ||||
|---|---|---|---|---|---|---|---|---|---|
| Current | risk weights | ||||||||
| Cantonal | banks | 23% | 66% | 92% | 38% | 49% | |||
| Other | 19% | 65% | 94% | 39% | 42% | ||||
| All SA banks | 19% | 66% | 92% | 39% | 45% | ||||
| BCBS 307 revised | SA risk | weights | |||||||
| Cantonal | banks | 33% | 118% | 87% | 37% | 55% | |||
| Other | 33% | 121% | 87% | 37% | 49% | ||||
| All SA banks | 33% | 120% | 87% | 37% | 51% | ||||
| % change | between | RSA | and | SA | 73% | 82% | -6% | -4% | 12% |
| BCBS 347 revised | SA risk | weights | |||||||
| Cantonal | banks | 24% | 60% | 83% | 43% | 52% | |||
| Other | 19% | 64% | 83% | 43% | 46% | ||||
| All SA banks | 20% | 62% | 83% | 43% | 48% | ||||
| % change | between | RSA | and | SA | 3% | -6% | -10% | 11% | 7% |
| BCBS 424 Revised | SA risk | weights | |||||||
| Cantonal | banks | 21% | 59% | 75% | 27% | 38% | |||
| Other | 19% | 64% | 75% | 27% | 33% | ||||
| All SA banks | 19% | 62% | 75% | 27% | 35% | ||||
| % change | between | RSA | and | SA | -1% | -6% | -19% | -29% | -22% |
Note: The table shows the risk weights for SA banks under the current SA rules and under the revised credit risk SA rules set out in BCBS 307 BCBS 347 and BCBS 424. The aggregated risk weights for each bank category are the weighted average risk weights of individual banks within the category. Results are shown for exposures to counter- parties in Switzerland categorised by Bank exposures, Corporate exposures, Commercial Mortgages and Residential Mortgages.
| Bank groups | Banks | Corporates Cml. | Mtg. Res. | Mtg. | Total | ||||
|---|---|---|---|---|---|---|---|---|---|
| Current | capital | ||||||||
| Cantonal | banks | 204 | 2,156 | 4,802 | 9,379 | 16,542 | |||
| Other | 1,061 | 2,169 | 2,845 | 12,528 | 18,603 | ||||
| All SA banks | 1,266 | 4,326 | 7,646 | 21,907 | 35,145 | ||||
| BCBS 307 revised | SA | capital | |||||||
| Cantonal | banks | 272 | 4,294 | 4,584 | 9,182 | 18,334 | |||
| Other | 1,819 | 4,487 | 2,641 | 11,926 | 20,874 | ||||
| All SA banks | 2,091 | 8,782 | 7,226 | 21,109 | 39,208 | ||||
| % change | between | RSA | and | SA | 65% | 103% | -6% | -4% | 12% |
| BCBS 347 revised | SA | capital | |||||||
| Cantonal | banks | 207 | 3,908 | 4,355 | 10,618 | 19,088 | |||
| Other | 1,081 | 4,249 | 2,510 | 13,790 | 21,630 | ||||
| All SA banks | 1,288 | 8,157 | 6,865 | 24,407 | 40,717 | ||||
| % change | between | RSA | and | SA | 2% | 89% | -10% | 11% | 16% |
| BCBS 424 revised | SA | capital | |||||||
| Cantonal | banks | 199 | 2,114 | 3,950 | 6,726 | 12,989 | |||
| Other | 1,060 | 2,333 | 2,276 | 8,724 | 14,394 | ||||
| All SA banks | 1,260 | 4,447 | 6,226 | 15,450 | 27,383 | ||||
| % change | between | RSA | and | SA | 0% | 3% | -19% | -29% | -22% |
Note: This table shows the weighted average capital requirements for categories (Cantonal and Other) of Swiss SA banks under the current SA rule and the revised credit risk SA rules proposed in BCBS 307, BCBS 347 and BCBS 424. Figures are expressed in CHF Million.
| BCBS | 307 | revised SA | BCBS | 347 | revised SA | BCBS | 424 | revised SA | ||||||||||||
|---|---|---|---|---|---|---|---|---|---|---|---|---|---|---|---|---|---|---|---|---|
| Cml. | Res. | Wtd. | Cml. | Res. | Wtd. | Cml. | Res. | Wtd. | ||||||||||||
| Banks | Corp. | Mtg. | Mtg. | S.L. | Avg. | Banks | Corp. | Mtg. | Mtg. | S.L. | Avg. | Banks | Corp. | Mtg. | Mtg. | S.L. | Avg. | |||
| Current risk | weights | 30% | 43% | 17% | 11% | 29% | 19% | 30% | 43% | 17% | 11% | 29% | 19% | 30% | 43% | 17% | 11% | 29% | 19% | |
| Without | floor | 30% | 49% | 17% | 11% | 30% | 21% | 32% | 43% | 17% | 11% | 34% | 23% | 30% | 44% | 17% | 11% | 30% | 20% | |
| Exposure | level | 60% floor | 33% | 79% | 50% | 24% | 73% | 43% | 38% | 61% | 50% | 27% | 46% | 40% | 33% | 57% | 45% | 19% | 40% | 31% |
| Asset class | level | 60% floor | 30% | 75% | 50% | 22% | 72% | 41% | 35% | 53% | 50% | 26% | 44% | 37% | 31% | 53% | 45% | 16% | 35% | 28% |
| Bank level | 60% | floor | 21% | 75% | 50% | 22% | 72% | 41% | 31% | 53% | 50% | 26% | 41% | 37% | 27% | 53% | 45% | 16% | 33% | 28% |
| Exposure | level | 72.5% floor | 36% | 91% | 61% | 28% | 88% | 50% | 42% | 68% | 60% | 32% | 53% | 46% | 36% | 64% | 55% | 22% | 45% | 36% |
| Asset class | level | 72.5% floor | 30% | 89% | 61% | 27% | 88% | 49% | 39% | 63% | 60% | 31% | 51% | 44% | 34% | 63% | 55% | 20% | 41% | 34% |
| Bank level | 72.5% | floor | 25% | 89% | 61% | 27% | 88% | 49% | 37% | 63% | 60% | 31% | 50% | 44% | 32% | 63% | 55% | 20% | 40% | 34% |
| Exposure | level | 80% floor | 37% | 98% | 67% | 30% | 97% | 55% | 45% | 73% | 66% | 35% | 57% | 50% | 38% | 68% | 60% | 24% | 48% | 38% |
| Asset class | level | 80% floor | 31% | 97% | 67% | 29% | 97% | 54% | 42% | 69% | 66% | 35% | 55% | 49% | 37% | 70% | 60% | 22% | 44% | 37% |
| Bank level | 80% | floor | 27% | 97% | 67% | 29% | 97% | 54% | 41% | 69% | 66% | 35% | 55% | 49% | 35% | 70% | 60% | 22% | 44% | 37% |
Note: This table shows the weighted average risk weights of the three IRB banks we study, under existing rules and under the revised SA rules of BCBS 307, BCBS 347and BCBS 424. We present results under different assumptions about how IRBA risk weight floors would be linked to revised SA risk weights. Specifically, we suppose (i) that IRBA risk weight floors are set to different percentages (60%, 72.5% and 80%) of revised SA risk weights and (ii) that floors are imposed at individual exposure, asset class and overall bank level. We show results for exposures to banks, corporate loans, commercial mortgages, residential mortgages and specialized lendings.
| BCBS | 307 | revised SA | BCBS | 347 | revised SA | BCBS | 424 | revised SA | ||||||||||||
|---|---|---|---|---|---|---|---|---|---|---|---|---|---|---|---|---|---|---|---|---|
| Cml. | Res. | Cml. | Res. | Cml. | Res. | |||||||||||||||
| Banks | Corp. | Mtg. | Mtg. | S.L. | Total | Banks | Corp. | Mtg. | Mtg. | S.L. | Total | Banks | Corp. | Mtg. | Mtg. | S.L. | Total | |||
| Weighted | average | capital | requirement | (bn) | ||||||||||||||||
| Current | capital | 0.27 | 1.67 | 0.91 | 5.09 | 1.34 | 9.29 | 0.27 | 1.67 | 0.91 | 5.09 | 1.34 | 9.29 | 0.27 | 1.67 | 0.91 | 5.09 | 1.34 | 9.29 | |
| Without | floor | 0.31 | 2.30 | 0.89 | 4.95 | 1.36 | 9.80 | 0.54 | 3.17 | 0.85 | 4.74 | 1.66 | 10.96 | 0.31 | 2.05 | 0.89 | 4.95 | 1.36 | 9.55 | |
| Exposure | level | 60% floor | 0.37 | 4.17 | 2.10 | 5.79 | 3.66 | 16.10 | 0.77 | 5.57 | 2.10 | 6.48 | 2.58 | 17.50 | 0.36 | 3.09 | 1.76 | 5.17 | 1.87 | 12.24 |
| Asset class | level | 60% floor | 0.34 | 3.93 | 2.06 | 5.52 | 3.58 | 15.43 | 0.71 | 4.86 | 2.10 | 6.13 | 2.47 | 16.26 | 0.31 | 2.55 | 1.66 | 4.75 | 1.53 | 10.80 |
| Bank level | 60% | floor | 0.27 | 3.92 | 2.06 | 5.50 | 3.57 | 15.32 | 0.62 | 4.86 | 2.10 | 6.13 | 2.30 | 16.01 | 0.27 | 2.55 | 1.66 | 4.76 | 1.46 | 10.71 |
| Exposure | level | 72.5% floor | 0.41 | 4.93 | 2.57 | 6.59 | 4.45 | 18.95 | 0.83 | 6.08 | 2.45 | 7.40 | 2.86 | 19.62 | 0.40 | 3.61 | 2.24 | 5.50 | 2.21 | 13.95 |
| Asset class | level | 72.5% floor | 0.35 | 4.80 | 2.56 | 6.33 | 4.44 | 18.48 | 0.77 | 5.60 | 2.45 | 7.15 | 2.76 | 18.73 | 0.37 | 3.24 | 2.15 | 5.21 | 1.92 | 12.89 |
| Bank level | 72.5% | floor | 0.29 | 4.80 | 2.56 | 6.33 | 4.44 | 18.41 | 0.73 | 5.60 | 2.45 | 7.15 | 2.69 | 18.61 | 0.34 | 3.24 | 2.15 | 5.21 | 1.90 | 12.84 |
| Exposure | level | 80% floor | 0.43 | 5.34 | 2.83 | 7.20 | 4.91 | 20.71 | 0.90 | 6.67 | 2.80 | 8.36 | 3.16 | 21.89 | 0.44 | 3.96 | 2.53 | 5.71 | 2.41 | 15.05 |
| Asset class | level | 80% floor | 0.36 | 5.25 | 2.83 | 6.98 | 4.90 | 20.32 | 0.84 | 6.34 | 2.80 | 8.17 | 3.07 | 21.22 | 0.40 | 3.67 | 2.46 | 5.45 | 2.17 | 14.17 |
| Bank level | 80% | floor | 0.31 | 5.25 | 2.83 | 6.98 | 4.90 | 20.27 | 0.83 | 6.34 | 2.80 | 8.17 | 3.07 | 21.21 | 0.39 | 3.67 | 2.46 | 5.45 | 2.17 | 14.15 |
| Change | in | capital(%) | ||||||||||||||||||
| Exposure | level | 60% floor | 37 | 150 | 130 | 14 | 174 | 73 | 182 | 233 | 131 | 27 | 93 | 88 | 31 | 85 | 93 | 1 | 40 | 32 |
| Asset class | level | 60% floor | 24 | 135 | 126 | 8 | 168 | 66 | 160 | 190 | 130 | 20 | 85 | 75 | 15 | 52 | 81 | -7 | 14 | 16 |
| Bank level | 60% | floor | -2 | 134 | 125 | 8 | 167 | 65 | 128 | 190 | 130 | 20 | 72 | 72 | -1 | 53 | 82 | -6 | 10 | 15 |
| Exposure | level | 72.5% floor | 50 | 195 | 181 | 29 | 233 | 104 | 210 | 271 | 178 | 50 | 119 | 117 | 49 | 116 | 145 | 8 | 65 | 50 |
| Asset class | level | 72.5% floor | 28 | 187 | 181 | 24 | 232 | 99 | 190 | 246 | 178 | 45 | 112 | 108 | 35 | 94 | 136 | 2 | 44 | 39 |
| Bank level | 72.5% | floor | 5 | 187 | 181 | 24 | 232 | 98 | 176 | 246 | 178 | 45 | 108 | 107 | 26 | 94 | 136 | 2 | 42 | 38 |
| Exposure | level | 80% floor | 57 | 219 | 210 | 41 | 267 | 123 | 230 | 299 | 207 | 64 | 136 | 136 | 61 | 137 | 177 | 12 | 81 | 62 |
| Asset class | level | 80% floor | 32 | 214 | 210 | 37 | 266 | 119 | 208 | 279 | 207 | 60 | 130 | 128 | 49 | 120 | 170 | 7 | 63 | 53 |
| Bank level | 80% | floor | 16 | 214 | 210 | 37 | 266 | 118 | 204 | 279 | 207 | 60 | 130 | 128 | 44 | 120 | 170 | 7 | 63 | 52 |
Note: The upper panel show the capital requirements (in CHF millions) of the three Swiss IRB banks for individual asset classes under different scenarios. The lower panel shows the implied percentage changes in the three banks’ asset-class-specific capital compared to current capital levels. Under BCBS 307, for Corporate Loans and Commercial Mortgages, capital is 187% and 181% greater when a 72.5% bank level floor is introduced. Under BCBS 347, for Bank, Corporate and Commercial Mortgage exposures, capital is 176%, 246% and 178% greater when a 72.5% bank level floor is introduced. Under BCBS 424, for Bank, Corporate, Commercial Mortgage exposures are 26%, 94%, 136% higher than the current levels when a 72.5% bank level floor is introduced.
| Specialized | ||||||||
|---|---|---|---|---|---|---|---|---|
| Banks | Corporates | Cml. | Mtg. Res. | Mtg. | Lending | Total | ||
| Current | capital | 1,538 | 5,998 | 8,559 | 27,002 | 1,337 | 44,433 | |
| BCBS | 307 | revised | SA | |||||
| Revised | SA capital | 2,377 | 13,583 | 9,788 | 27,435 | 4,438 | 57,621 | |
| Change | in capital | 55% | 126% | 14% | 2% | 232% | 30% | |
| BCBS | 347 | revised | SA | |||||
| Revised | SA capital | 2,039 | 13,941 | 9,399 | 31,815 | 2,781 | 59,975 | |
| Change | in capital | 33% | 132% | 10% | 18% | 108% | 35% | |
| BCBS | 424 | revised | SA | |||||
| Revised | SA capital | 1,604 | 7,689 | 8,376 | 20,658 | 1,899 | 40,227 | |
| Change | in capital | 4% | 28% | -2% | -23% | 42% | -9% |
Note: The table shows current capital (broken down by asset class) for all banks and the capital implied by the revised credit risk SA and a 72.5% bank level floor for IRB banks. Under BCBS 307, total capital for Bank Exposure, Corporate Loans, Commercial and Residential Mortgages rises by 55%, 126%, 14% and 2%, respectively. Capital requirement figures are expressed in CHF million. While under BCBS 347, the figures are 38%, 132%, 10%, 18% and 108%. Under BCBS 424, the capital requirement changes are 5%, 28%, -2%, -23% and 42%.
| CML. | Res. | Wtd. | CML. | Res. | Wtd. | CML. | Res. | Wtd. | |||||||
|---|---|---|---|---|---|---|---|---|---|---|---|---|---|---|---|
| Banks | Corp. | Mtg. | Mtg. | Avg. | Banks | Corp. | Mtg. | Mtg. | Avg. | Banks | Corp. | Mtg. | Mtg. | Avg. | |
| CET 1 | capital | target | |||||||||||||
| Cantonal banks | 6 | 41 | -3 | -1 | 4 | 0.1 | 33 | -7 | 4 | 5 | -0.1 | 0 | -11 | -8 | -7 |
| Other | 8 | 47 | -7 | -2 | 4 | 0.0 | 42 | -11 | 4 | 6 | 0.2 | 4 | -17 | -12 | -9 |
| All SA banks | 8 | 44 | -5 | -1 | 4 | 0.0 | 38 | -9 | 4 | 6 | 0.1 | 2 | -13 | -10 | -8 |
| Total | capital | target | |||||||||||||
| Cantonal banks | 8 | 60 | -5 | -1 | 6 | 0.1 | 49 | -10 | 5 | 8 | -0.2 | 0 | -16 | -11 | -10 |
| Other | 13 | 72 | -10 | -3 | 6 | 0.1 | 64 | -16 | 5 | 9 | 0.3 | 6 | -24 | -17 | -13 |
| All SA banks | 12 | 67 | -7 | -2 | 6 | 0.1 | 57 | -12 | 5 | 8 | 0.2 | 3 | -19 | -14 | -12 |
Note: The table shows the impact on the spreads charged by Swiss SA banks of replacing current rules with the revised credit risk SA. Units are basis points. The upper panel shows results when the capital impact is based on CET1 capital targets alone, while the lower panel shows results when the capital change is based on the Total Capital target ratio. The spread impacts are calculated assuming equity returns that adjust endogenously as total bank capital levels change. Spreads on commercial and residential mortgages fall slightly while those on corporate loans increase by 44 and 67 basis points (depending on the capital target ratio employed) when the BCBS 307 revised credit risk SA is introduced. Under BCBS 347, the spread impact on Corporate is similar to the figure from BCBS 307, but the spread impact on Residential Mortgages increases by 4 and 5 base points rather than decreasing when BCBS 307 is applied. Under BCBS 424, the spread impact on Residential Mortgages decreases by 10 and 14 base points.
| CML. | Res. | Wtd. | CML. | Res. | Wtd. | CML. | Res. | Wtd. | |||||||||||||
|---|---|---|---|---|---|---|---|---|---|---|---|---|---|---|---|---|---|---|---|---|---|
| Banks | Corp. | Mtg. | Mtg. | S.L. | Avg. | Banks | Corp. | Mtg. | Mtg. | S.L. | Avg. | Banks | Corp. | Mtg. | Mtg. | S.L. | Avg. | ||||
| 60% | floor | ||||||||||||||||||||
| IRB | Banks | 0 | 51 | 34 | 2 | 46 | 19 | 36 | 73 | 35 | 5 | 24 | 21 | 2 | 26 | 28 | 2 | 7 | 9 | ||
| IRB | and SA | Banks | 7 | 47 | 7 | 0 | 46 | 9 | 4 | 51 | 5 | 4 | 24 | 10 | 0 | 11 | 0 | -7 | 7 | -3 | |
| CET 1 | 72.5% | floor | |||||||||||||||||||
| capital | IRB | Banks | 2 | 71 | 48 | 6 | 62 | 27 | 49 | 95 | 48 | 12 | 35 | 30 | 9 | 40 | 41 | 3 | 14 | 14 | |
| target | IRB | and SA | Banks | 7 | 54 | 12 | 1 | 62 | 11 | 6 | 58 | 8 | 6 | 35 | 13 | 1 | 16 | 3 | -7 | 14 | -2 |
| 80% | floor | ||||||||||||||||||||
| IRB | Banks | 4 | 81 | 56 | 9 | 71 | 33 | 56 | 107 | 55 | 16 | 41 | 36 | 12 | 49 | 48 | 3 | 18 | 16 | ||
| IRB | and SA | Banks | 7 | 58 | 14 | 2 | 71 | 13 | 7 | 63 | 11 | 7 | 41 | 15 | 2 | 19 | 6 | -7 | 18 | -1 | |
| 60% | floor | ||||||||||||||||||||
| IRB | Banks | 1 | 88 | 55 | 4 | 79 | 32 | 62 | 126 | 56 | 9 | 41 | 34 | 4 | 46 | 46 | 4 | 12 | 15 | ||
| IRB | and SA | Banks | 11 | 74 | 12 | 0 | 79 | 14 | 7 | 82 | 9 | 6 | 41 | 16 | 1 | 19 | 1 | -9 | 12 | -3 | |
| Total | 72.5% | floor | |||||||||||||||||||
| capital | IRB | Banks | 3 | 121 | 77 | 10 | 107 | 46 | 83 | 162 | 76 | 19 | 60 | 50 | 15 | 70 | 65 | 4 | 24 | 23 | |
| target | IRB | and SA | Banks | 11 | 86 | 19 | 1 | 107 | 18 | 10 | 95 | 15 | 9 | 60 | 21 | 2 | 27 | 7 | -9 | 24 | -1 |
| 80% | floor | ||||||||||||||||||||
| IRB | Banks | 8 | 139 | 89 | 15 | 122 | 55 | 96 | 184 | 88 | 25 | 71 | 60 | 21 | 84 | 77 | 5 | 32 | 27 | ||
| IRB | and SA | Banks | 12 | 93 | 23 | 3 | 122 | 21 | 11 | 103 | 18 | 11 | 71 | 24 | 3 | 33 | 10 | -9 | 32 | 0 |
Note: The table shows the weighted average impacts (in basis points) on the spreads charged by IRBA and SA Swiss banks of introducing the revised credit risk SA and 60%, 72.5% and 80%, bank level IRBA capital floors. Results are exhibited assuming the capital change is based on the CET1 capital target ratio or the Total Capital target ratio. Results are reported for Bank Exposures, Corporate Loans, Commercial Mortgages, Residential Mortgages and Specialized Lendings.
| BCBS 307 | revised SA | BCBS | 347 | revised SA | BCBS | 424 | revised SA | |||||||||||
|---|---|---|---|---|---|---|---|---|---|---|---|---|---|---|---|---|---|---|
| CML. | Res. | CML. | Res. | CML. | Res. | |||||||||||||
| Banks | Corp. Mtg. | Mtg. | S.L. | Total | Banks | Corp. | Mtg. | Mtg. S.L | Total | Banks | Corp. | Mtg. | Mtg. | S.L | Total | |||
| CET | 1 capital | target | ||||||||||||||||
| Exposure | level | 60% floor | 72 | 619 89 | 2 | 246 | 1,027 | 53 | 718 | 55 | 340 125 | 1,290 | 12 | 189 | -4 | -493 | 70 | -226 |
| Asset class | level | 60% floor | 69 | 596 88 | -17 | 243 | 978 | 47 | 640 | 55 | 307 114 | 1,162 | 9 | 138 | -6 | -499 | 43 | -315 |
| Bank level | 60% | floor | 62 | 591 85 | -23 | 239 | 953 | 38 | 640 | 55 | 307 98 | 1,139 | 4 | 137 | -6 | -500 | 35 | -329 |
| Exposure | level | 72.5% floor | 76 | 694 135 | 75 | 322 | 1,302 | 61 | 784 | 99 | 457 159 | 1,560 | 16 | 234 | 39 | -488 | 97 | -102 |
| Asset class | level | 72.5% floor | 69 | 680 135 | 49 | 322 | 1,254 | 55 | 738 | 99 | 435 150 | 1,477 | 13 | 202 | 38 | -492 | 75 | -165 |
| Bank level | 72.5% | floor | 63 | 680 135 | 49 | 322 | 1,248 | 51 | 738 | 99 | 435 145 | 1,468 | 10 | 202 | 38 | -492 | 73 | -169 |
| Exposure | level | 80% floor | 77 | 737 162 | 136 | 367 | 1,479 | 66 | 833 | 126 | 529 181 | 1,736 | 18 | 265 | 65 | -480 | 114 | -17 |
| Asset class | level | 80% floor | 70 | 727 162 | 114 | 367 | 1,440 | 60 | 797 | 126 | 511 173 | 1,667 | 16 | 240 | 65 | -488 | 95 | -73 |
| Bank level | 80% | floor | 66 | 727 162 | 114 | 367 | 1,436 | 59 | 797 | 126 | 511 173 | 1,666 | 14 | 240 | 65 | -488 | 95 | -74 |
| Total | capital | target | ||||||||||||||||
| Exposure | level | 60% floor | 112 | 987 148 | 16 | 423 | 1,686 | 91 | 1,168 | 100 | 505 213 | 2,077 | 21 | 325 | 14 | -683 | 121 | -203 |
| Asset class | level | 60% floor | 107 | 948 147 | -14 | 417 | 1,604 | 81 | 1,035 | 100 | 451 195 | 1,861 | 16 | 237 | 11 | -691 | 74 | -353 |
| Bank level | 60% | floor | 94 | 939 143 | -24 | 410 | 1,561 | 65 | 1,035 | 100 | 452 169 | 1,822 | 6 | 236 | 11 | -692 | 62 | -377 |
| Exposure | level | 72.5% floor | 118 | 1,115 222 | 134 | 553 | 2,142 | 104 | 1,282 | 171 | 692 272 | 2,521 | 27 | 401 | 83 | -676 | 167 | 1 |
| Asset class | level | 72.5% floor | 107 | 1,091 222 | 92 | 552 | 2,064 | 95 | 1,203 | 171 | 655 257 | 2,382 | 22 | 346 | 81 | -682 | 129 | -104 |
| Bank level | 72.5% | floor | 96 | 1,091 222 | 92 | 552 | 2,054 | 87 | 1,203 | 171 | 656 249 | 2,367 | 17 | 346 | 81 | -682 | 125 | -112 |
| Exposure | level | 80% floor | 121 | 1,189 265 | 232 | 631 | 2,437 | 114 | 1,366 | 213 | 807 311 | 2,811 | 31 | 455 | 124 | -663 | 195 | 142 |
| Asset class | level | 80% floor | 109 | 1,172 265 | 196 | 630 | 2,372 | 103 | 1,304 | 214 | 778 296 | 2,696 | 26 | 412 | 123 | -677 | 163 | 48 |
| Bank level | 80% | floor | 101 | 1,172 265 | 196 | 630 | 2,365 | 101 | 1,304 | 214 | 778 296 | 2,694 | 24 | 412 | 123 | -676 | 163 | 46 |
Note: The table shows the annual cost in CHF millions of introducing the revised credit risk SA and 60%, 72.5% and 80% risk weights floors for IRB banks. The cost is calculated by multiplying individual bank spread impacts by their exposure volumes in the relevant asset class.
| BCBS | 307 | revised | SA | BCBS | 347 | revised | SA | BCBS 424 | revised | SA | |||||||||
|---|---|---|---|---|---|---|---|---|---|---|---|---|---|---|---|---|---|---|---|
| CML. | Res. | CML. | Res. | CML. | Res. | ||||||||||||||
| Banks | Corp. | Mtg. | Mtg. | S.L. | Total | Banks | Corp. | Mtg. | Mtg. | S.L. | Total | Banks | Corp. | Mtg. | Mtg. | S.L. | Total | ||
| CET | 1 | capital | target | ||||||||||||||||
| Exp. | 60% | 2,409 | 20,626 | 2,953 | 52 | 8,199 | 34,240 | 1,767 | 23,919 | 1,824 | 11,344 | 4,151 | 43,005 | 409 | 6,301 | -124 | -16,438 | 2,332 | -7,519 |
| Asset | 60% | 2,297 | 19,859 | 2,926 | -579 | 8,086 | 32,589 | 1,559 | 21,326 | 1,827 | 10,222 | 3,799 | 38,734 | 306 | 4,589 | -183 | -16,626 | 1,425 | -10,490 |
| Bank | 60% | 2,054 | 19,689 | 2,842 | -782 | 7,955 | 31,758 | 1,263 | 21,334 | 1,834 | 10,249 | 3,283 | 37,962 | 121 | 4,582 | -190 | -16,655 | 1,178 | -10,965 |
| Exp. | 72.5% | 2,517 | 23,121 | 4,494 | 2,512 | 10,745 | 43,388 | 2,022 | 26,145 | 3,306 | 15,235 | 5,297 | 52,004 | 523 | 7,793 | 1,310 | -16,264 | 3,236 | -3,402 |
| Asset | 72.5% | 2,298 | 22,657 | 4,494 | 1,635 | 10,718 | 41,803 | 1,835 | 24,604 | 3,310 | 14,485 | 5,002 | 49,235 | 428 | 6,725 | 1,273 | -16,405 | 2,494 | -5,485 |
| Bank | 72.5% | 2,097 | 22,658 | 4,496 | 1,639 | 10,721 | 41,612 | 1,699 | 24,606 | 3,312 | 14,494 | 4,836 | 48,946 | 338 | 6,726 | 1,274 | -16,402 | 2,421 | -5,644 |
| Exp. | 80% | 2,581 | 24,555 | 5,388 | 4,539 | 12,249 | 49,312 | 2,203 | 27,764 | 4,195 | 17,645 | 6,044 | 57,851 | 611 | 8,848 | 2,179 | -15,998 | 3,785 | -574 |
| Asset | 80% | 2,335 | 24,231 | 5,390 | 3,806 | 12,232 | 47,994 | 2,001 | 26,570 | 4,198 | 17,039 | 5,767 | 55,575 | 522 | 8,012 | 2,150 | -16,281 | 3,163 | -2,434 |
| Bank | 80% | 2,196 | 24,232 | 5,390 | 3,809 | 12,234 | 47,861 | 1,960 | 26,570 | 4,199 | 17,040 | 5,767 | 55,536 | 472 | 8,013 | 2,151 | -16,280 | 3,163 | -2,482 |
| Total | capital | target | |||||||||||||||||
| Exp. | 60% | 3,745 | 32,906 | 4,935 | 527 | 14,084 | 56,197 | 3,042 | 38,929 | 3,332 | 16,822 | 7,110 | 69,235 | 694 | 10,817 | 468 | -22,768 | 4,027 | -6,762 |
| Asset | 60% | 3,554 | 31,594 | 4,896 | -478 | 13,894 | 53,461 | 2,687 | 34,496 | 3,338 | 15,018 | 6,508 | 62,048 | 521 | 7,883 | 380 | -23,027 | 2,475 | -11,768 |
| Bank | 60% | 3,139 | 31,296 | 4,759 | -810 | 13,665 | 52,048 | 2,169 | 34,508 | 3,349 | 15,062 | 5,630 | 60,718 | 197 | 7,872 | 369 | -23,073 | 2,054 | -12,581 |
| Exp. | 72.5% | 3,929 | 37,175 | 7,390 | 4,472 | 18,442 | 71,408 | 3,475 | 42,745 | 5,696 | 23,052 | 9,075 | 84,043 | 884 | 13,362 | 2,750 | -22,526 | 5,573 | 43 |
| Asset | 72.5% | 3,555 | 36,379 | 7,392 | 3,064 | 18,398 | 68,788 | 3,152 | 40,111 | 5,703 | 21,847 | 8,574 | 79,387 | 724 | 11,535 | 2,696 | -22,723 | 4,305 | -3,463 |
| Bank | 72.5% | 3,212 | 36,382 | 7,394 | 3,071 | 18,402 | 68,462 | 2,914 | 40,114 | 5,707 | 21,862 | 8,288 | 78,885 | 566 | 11,537 | 2,697 | -22,719 | 4,179 | -3,739 |
| Exp. | 80% | 4,039 | 39,637 | 8,818 | 7,719 | 21,021 | 81,234 | 3,784 | 45,520 | 7,115 | 26,912 | 10,354 | 93,684 | 1,033 | 15,164 | 4,132 | -22,116 | 6,511 | 4,723 |
| Asset | 80% | 3,617 | 39,081 | 8,821 | 6,544 | 20,994 | 79,056 | 3,434 | 43,479 | 7,121 | 25,940 | 9,881 | 89,854 | 881 | 13,735 | 4,090 | -22,551 | 5,447 | 1,602 |
| Bank | 80% | 3,380 | 39,082 | 8,822 | 6,548 | 20,997 | 78,830 | 3,361 | 43,479 | 7,121 | 25,942 | 9,882 | 89,785 | 792 | 13,736 | 4,091 | -22,549 | 5,448 | 1,518 |
Note: The table shows the present discounted cost in CHF millions of introducing the revised credit risk SA and 60%, 72.5% and 80% risk weights floors for IRB banks. The cost is calculated by assuming a perpetual annual cost as exhibited in Table 37 and discounting this by 3%.
6. Conclusions
This paper examines the impacts on the Swiss loan market of the capital rule changes proposed in BCBS 306, 307 and 347 and then adopted in BCBS 424. The rule changes include
a) the substitution of a risk-indicator-based, revised SA for the current SA (especially in the case of BCBS 307),
b) changes in the treatment of undrawn loan facilities(particularly important in the case of BCBS 347)
c) the imposition of capital floors for IRB capital based on a percentage of revised SA capital.
We study the effects of these changes on the risk weights and capital levels of 37 Swiss banks and banking groups including three IRB banks. We then examine how the capital changes could affect the lending rates of these banks in different segments of the Swiss loan market, specifically lending to (i) other Swiss banks, (ii) Corporates (iii) Commercial Mortgage borrowers and (iv) Residential Mortgage borrowers.
In several aspects of these changes, most notably the reliance of indicators and an initially aggressive approach to CCFs, the Basel authorities proposed radical approaches and then subsequently retreated. The implied risk weights have fluctuate substantially, therefore, through the sequence of proposals.
While the magnitude of the impacts is reduced in the final BCBS 424 rules, it remains the case that the changes in capital rules contained in BCBS 424 imply higher capital for Corporate lending and slightly lower for Residential Mortgage lending. The proposals also imply a major change in the relative capital burden with SA bank capital falling significantly (by 22%) and that of IRB banks increasing substantially (by 38%).
Note that some of the impact effects described in this paper may have been mitigated in practice (particularly in the case of IRB) by efforts banks took to reduce unused credit facilities through actively managing down the limit amount available to clients. These behavioral changes reflected the Risk
Weight inflation to which Swiss banks were subject in the post crisis period not simply to the changes described in this paper.
Leaving such credit portfolio management effects aside, assuming full “pass through” to borrowers and that the effect operates through the CET1 target rather than the total capital, a weighted average of lending rates on Corporate loans for all IRB and SA banks would rise by between 16 and 40 basis points.[27]
We calculate the monetary impacts of the spread changes on the Swiss economy by multiplying weighted averages (across banks) of the spread changes with the volumes of outstanding loans and an assumed pass through parameter of 100%.[28] The resulting estimates suggest that the annual cost of the BCBS 434 policy changes would actually be negative because the reduced capital burden on residntial mortgage lending exceeds that on the other loan categories.
References
1. Baker, M. and J. Wurgler (2013) “Would Stricter Capital Requirements Raise the Cost of Capital? Bank Capital Regulation and the Low Risk Anomaly,” NBER Working Paper Series, No. 19018.
2. Basel Committee on Banking Supervision (2006) “International Convergence of Capital Measurement and Capital Standards,” June. Available at: http://www.bis.org/publ/bcbs128b.pdf
3. Basel Committee on Banking Supervision (2009a) “Enhancements to the Basel II Framework,” Bank for International Settlements, July.
4. Basel Committee on Banking Supervision (2009b) “Revisions to the Basel II Market Risk Framework,” Bank for International Settlements, July.
5. Basel Committee on Banking Supervision (2010a) “An Assessment of the Long-Term Economic Impact of Stronger Capital and Liquidity Requirements,” Bank for International Settlements, August.
6. Basel Committee on Banking Supervision (2010b) “Basel III: A Global Framework for More Resilient Banks and Banking Systems,” Bank for International Settlements, December.
7. Basel Committee on Banking Supervision (2013) “Regulatory Consistency Assessment Programme (RCAP) - Analysis of risk-weighted assets for credit risk in the banking book,” Bank for International Settlements, July.
8. Basel Committee on Banking Supervision (2014a) “Reducing excessive variability in banks’ regulatory capital ratios - A report to the G20,” Bank for International Settlements, November.
9. Basel Committee on Banking Supervision (2014b) “Capital Floors: The Design of a Framework Based on Standardised Approaches,” Consultative Document, December (also known as BCBS 306).
10. Basel Committee on Banking Supervision (2015) “Revisions to the Standardised Approach for credit risk - second consultative document,” Consultative Document, December (also known as BCBS 347).
11. Basel Committee on Banking Supervision (2016) “Reducing variation in credit risk-weighted assets - constraints on the use of internal model approaches,” Consultative Document, March (also known as BCBS 362).
12. Basel Committee on Banking Supervision (2017) “Basel III: Finalising post-crisis reforms,” December (also known as BCBS 424).
13. Bassett, W.F., M.B. Chosak, J.C. Driscoll and E. Zakrajŝek (2010) “Identifying the Macroeconomic Effects of Bank Lending Supply Shocks,” Working Paper Series, Kansas City Federal Reserve.
14. Basten, C. and C. Koch (2014) “Higher Bank Capital Requirements and Mortgage Pricing: Evidence for the Counter-Cyclical Capital Buffer,” Working Paper Series, University of Zurich Department of Economics.
15. Borchgrevink, Henrik (2012) “The Basel I floor – transitional arrangement and backstop to the capital adequacy framework,” Norges Bank Economic Commentaries No. 8. Available at: http://www.norges-bank.no/pages/88777/Economic_Commentaries_2012_8.pdf
16. Bourassa, S., M. Hoesli and D. Scognamiglio (2013) “Housing Finance, Prices, and Tenure in Switzerland,” Munich Personal RePEc Archive, No. 45990.
17. Brown, M. and B. Guin (2013) “How Risky are Residential Mortgages in Switzerland?” Working Paper Series, Swiss Institute of Banking and Finance.
18. Brun, M., H. Fraisse and D. Thesmar (2013) “The Real Effects of Bank Capital Requirements,” Débats économiques et financiers, 8, 3-26.
19. Cecchin, I. (2011) “Mortgage Rate Pass-Through in Switzerland,” Swiss National Bank Working Papers, 2011(8).
20. Christen, A., F.A. Halter, N. Kammerlander, D. Künzi, M. Merki and T.M. Zellweger (2013), “Success Factors for Swiss SMEs Company Succession in Practice,” Credit Suisse Swiss Issues Economic Policy, June.
21. Cosimano, T. and D. S. Hakura (2011) “Bank Behaviour in Response to Basel III: A Cross- Country Analysis,” Working Paper Series, International Monetary Fund.
22. Dietrich, A. (2009) “Explaining Loan Rate Differentials between Small and Large Companies: Evidence from an Explorative Study in Switzerland,” Working Paper Series.
23. Dietrich, A. and G. Wanzenried (2010) “Determinants of Bank Profitability before and during the Crisis: Evidence from Switzerland,” Working Paper Series.
24. Duponcheele, Georges, William Perraudin and Daniel Totouom-Tangho (2014) “Reducing the Reliance of Securitisation Capital on Agency Ratings,” BNP Paribas mimeo, February, available at: http://www.riskcontrollimited.com/public/Reducing_the_Reliance.pdf
25. Ediz, T., I. Michael, and W. Perraudin (1998)“The impact of capital requirements on UK bank behaviour,” FRBNY Economic Policy Review, October, pp. 15-22.
26. Elliott, D.J. (2009) “Quantifying the Effects on Lending of Increased Capital Requirements,” Working Paper Series, The Brookings Institution.
27. European Parliament (2013) “‘Regulation (EU No 525/2013 of the European Parliament and of the Council of 26 June 2013 on prudential requirements for credit institutions and investment firms and amending Regulation (EU) No 648/2012,” Available at: http://eurlex.europa.eu/LexUriServ/LexUriServ.do?uri=OJ:L:2013:321:0006:0342:EN:PDF
28. Fernandez, P., P. Linares and I. Fernandez Acin (2014) “Market Risk Premium used in 88 countries in 2014: a survey with 8,228 answers,” IESE Business School mimeo, available at: http://ssrn.com/abstract=2450452.
29. Francis, W. and M. Osborne (2012) “Capital Requirements and Bank Behaviour in the UK: Are There Lessons for International Capital Standards?” Journal of Banking and Finance, 36, 803- 816.
30. Hancock, D, A. Laing, and J. Wilcox (1995)“Bank capital shocks: dynamic effects on securities, loans, and capital,” Journal of Banking and Finance, Vol. 19, pp. 661-77.
31. Institute of International Finance (2011) “The Cumulative Impact on the Global Economy of Changes in the Financial Regulatory Framework,” Institute of International Finance Report, September.
32. Junge, G. and P. Kugler (2013) “Quantifying the Impact of Higher Capital Requirements on the Swiss Economy,” Swiss Journal of Economics and Statistics, 149(3), 313-356.
33. Kashyap, A., J. Stein and S. Hanson (2010) “An Analysis of the Impact of Substantially Heightened Capital Requirements on Large Financial Institutions,” Working Paper Series.
34. King, M.R. (2010) “Mapping Capital and Liquidity Requirements to Bank Lending Spreads,” BIS Working Paper Series, No 324.
35. Le Leslé, V. and S. Avramova (2012) “Revisiting Risk-Weighted Assets,” IMF Working Paper Series, 12(90).
36. Macroeconomic Assessment Group (2010) “Assessing the Macroeconomic Impact of the Transition to Stronger Capital and Liquidity Requirements,” Final Report, Bank of International Settlements, December.
37. Miles, D., J. Yang and G. Marcheggiano (2012) “Optimal Bank Capital,” The Economic Journal,123(567), 1-37.
38. Modigliani, F. and H. Miller (1958) “The Cost of Capital, Corporation Finance and Theory of Investment,” American Economic Review, 48(3), 261-297.
39. Mora, N. and A. Logan (2010) “Shocks to Bank Capital: Evidence from UK Banks at Home and Away,” Bank of England Working Paper Series, No. 387.
40. Neuberger, D. and C. Schacht (2005) “The Number of Bank Relationships of SMEs: A Disaggregated Analysis for the Swiss Loan Market,” Thünen-Series of Applied Economic Theory, No. 52
41. OECD (2012) “OECD Economic Surveys: Switzerland 2011,” available at: http://dx.doi.org/10.1787/eco_surveys-che-2011-eu.
42. Peek, J and E.S. Rosengren (1995)“The capital crunch: neither a borrower nor a lender be,” Journal of Money, Credit, and Banking, Vol. 27, pp. 625-38.
43. Peek, J. and E.S. Rosengren and G.M.B. Tootell (2000) “Identifying the Macroeconomic Effect of Loan Supply Shocks,” Journal of Money, Credit and Banking, 35(6), 931-946.
44. Slovik, P. and B. Cournède (2011) “Macroeconomic Impact of Basel III,” OECD Economics Department Working Paper Series, No. 844.
45. Rochet, J-C. (2014) “The Extra Cost of Swiss Banking Regulation,” Swiss Finance Institute White Papers, February.
46. Swiss National Bank (2012) “Results from the Swiss National Bank’s Data Collection,” available at: http://www.snb.ch/en/mmr/reference/pre_20130620_2/source/pre_20130620_2.en.pdf
47. Swiss National Bank (2013) “Banks in Switzerland 2013,” available at: http://www.snb.ch/ext/stats/bankench/pdf/deen/Die_Banken_in_der_CH.book.pdf
Appendix 1: risk driver distribution for banks
This section describes how we estimate the distribution of risk drivers for exposures to banks.
Assumptions
• We classify the Swiss banks into 3 groups: Large Banks, Cantonal Banks and Other Banks. For each bank group, we assume the credit exposures to the three bank groups are distributed as Table A1.1. Large banks’ exposure is partially data driven and the rest is expert based.
• Table A1.2 shows the risk drivers (Net NPA (NNPA) ratios and CET1 ratios) for 48 Swiss banks. The risk drivers represented here are proxies rather than exact figures. These do not exactly match either the definition of CET1, or the definition of Net NPA ratio, as defined in the revised SA approach. The following assumptions are made to derive the required ratios: 1) Basel II Tier One Regulatory Capital ratio as proxy for CET1 2) Modified definition of NNPA ratio, namely (Non-Performing Loans – Loan Loss Reserve)/(Total Earning Assets – Total Securities) 3) Risk driver values taken from the 2013 End of year Financial statements
Table A1.1: Interbank credit risk exposure distribution for different bank groups Large Cantonal Other banks banks banks Large banks 0.3 0.3 0.4 Cantonal banks 0.4 0.3 0.3 Other banks 0.5 0.3 0.2 Note: This table shows the assumptions we make regarding the exposure shares that each individual bank (within one of the three groups of banks) has with respect to other Swiss banks in the three different categories we consider. Hence, we suppose that, for each of the two large Swiss banks, 30% of its reported exposure to Swiss banks is with respect to the other large bank and 30% is with respect to cantonal banks. The assumed percentages were provided to us by a banker closely familiar with the Swiss interbank market and are based on the judgments of that individual.
Each row represents the credit risk exposure distribution for that bank group. The number of banks in each bank group is given in Table A1.3.
Table A1.2: NNPA and CET1 ratios Classification with Classification with Bank Issuer Name respect to Net NPA respect to CET1 proxy group proxy Caisse d'Epargne d'Aubonne Net NPA <= 1% 12% <= CET1 O 12% <= CET1 CB Banque Cantonal du Jura 1% < Net NPA <= 3% Basellandschaftliche Kantonalbank 1% < Net NPA <= 3% 12% <= CET1 CB 12% <= CET1 CB Basler Kantonalbank Net NPA <= 1% Berner Kantonalbank Net NPA <= 1% 12% <= CET1 CB 12% <= CET1 CB Banque Cantonale du Valais 1% < Net NPA <= 3% Bank CIC (Schweiz) AG Net NPA <= 1% 12% <= CET1 O 12% <= CET1 O Bernerland Bank Net NPA <= 1% Leumi Private Bank Ltd. Net NPA <= 1% 12% <= CET1 O 12% <= CET1 O BSI SA Net NPA <= 1% Clientis AG Net NPA <= 1% 12% <= CET1 O 12% <= CET1 O Coutts & Co Ltd Net NPA <= 1% Credit Suisse Group AG Net NPA <= 1% 12% <= CET1 LB 12% <= CET1 CB Banque Cantonale Vaudoise Net NPA <= 1% EFG International Net NPA <= 1% 12% <= CET1 O 9.5% <= CET1 < 12% O Freie Gemeinschaftsbank BCL 1% < Net NPA <= 3% 12% <= CET1 CB Graubundner Kantonalbank Net NPA <= 1% Bank Coop AG Net NPA <= 1% 12% <= CET1 O 12% <= CET1 O Bank Hapoalim (Switzerland) Net NPA <= 1% Privatbank IHAG Zurich Net NPA <= 1% 12% <= CET1 O 12% <= CET1 O Julius Baer Group Ltd Net NPA <= 1% Bank Linth 1% < Net NPA <= 3% 12% <= CET1 O 12% <= CET1 CB Luzerner Kantonalbank Net NPA <= 1% Maerki Baumann & Co. AG Net NPA <= 1% 12% <= CET1 O 7% <= CET1 < 9.5% O Migrosbank AG Net NPA <= 1% Bank Morgan Stanley AG Net NPA <= 1% 12% <= CET1 O 12% <= CET1 O Neue Aargauer Bank Net NPA <= 1% Notenstein Private Bank Ltd Net NPA <= 1% 12% <= CET1 O 12% <= CET1 O Valartis Group AG Net NPA <= 1% BNP Paribas (Suisse) SA Net NPA > 3% 9.5% <= CET1 < 12% O 12% <= CET1 O Piguet Galland & Cie SA Net NPA <= 1% PKB Privatbank AG Net NPA <= 1% 12% <= CET1 O 12% <= CET1 O Regiobank Solothurn 1% < Net NPA <= 3% J. Safra Sarasin Holding AG Net NPA <= 1% 12% <= CET1 O 12% <= CET1 CB Schaffhauser Kantonalbank Net NPA > 3% Baloise Bank SoBa Net NPA <= 1% 9.5% <= CET1 < 12% O St. Galler Kantonalbank 1% < Net NPA <= 3% 12% <= CET1 CB 12% <= CET1 O Swissquote Group Holding Ltd. Net NPA <= 1% Acrevis Bank AG Net NPA <= 1% 12% <= CET1 O 12% <= CET1 CB Thurgauer Kantonalbank Net NPA <= 1% Banca Dello Stato Del Cantone Ticino 1% < Net NPA <= 3% 12% <= CET1 CB 12% <= CET1 O Union Bancaire Privee Net NPA <= 1% UBS AG Net NPA <= 1% 12% <= CET1 LB 12% <= CET1 O Vontobel Group Net NPA <= 1% Banca Zarattini & Co SA Net NPA <= 1% 12% <= CET1 O 12% <= CET1 O Raiffeisen Schweiz Genossenschaft Net NPA <= 1% Zuger Kantonalbank Net NPA <= 1% 12% <= CET1 CB 12% <= CET1 CB Zuercher Kantonalbank Net NPA <= 1% Note: The table shows the classification of a set of Swiss banks according to Net Non- Performing Asset and CET1 ratios and according to whether they are Large Banks, Cantonal Banks or Other Banks.
Table A1.3: Numbers of banks by group Large Cantonal Other banks banks banks Count 2 14 32 Note: The Table shows the numbers of banks in each of the three categories we study, Large, Cantonal and Other Banks.
Estimate distributions Given the interbank credit exposure distribution (Table A1.1) for each bank group and the risk drivers (Table A1.2), we can estimate the risk driver distributions for each bank group in a simplified approach. The estimation steps are given as following: Step 1: We classify each bank into the three bank groups. Step 2: For each bank, determine which CET1 and NNPA bucket it belongs to given its CET1 ratio and NNPA ratio. For g= 1: 3 (for each bank group) For j = 1: 3 (for each bank group) For i= 1: 48 (for each bank) Step 3: Calculate the itℎ bank’s weight as wi = wg,j/Njif bank i belongs to bank group j, where wg,j is the total weight of bank group j asshown in row g in table A1, Nj is the total number of banks in group j. End End N , where Step 4: Calculate the probability for CET1 and NNPA bucket k as: pk = ∑i=1 wi wi = wg,j/Nj if bank i belongs to CET1 and NNPA bucket k, otherwise wi = 0. End
The estimated distribution is given in Table A1.4.
Table A1.4: Generated joint distribution of CET1 and NNPA 12%> 9.5%> 7% > 5.5% > CET1 ratio CET1 ratio CET1 ratio CET1 ratio CET1 ratio CET1 ratio ≥12% ≥9.5% ≥7% ≥5.5% ≥4.5% <4.5% Large banks NNPA ratio≤1% 79.64% 1.25% 1.25% 0.00% 0.00% 0.00% 1%<NNPA ratio≤3% 13.21% 1.25% 0.00% 0.00% 0.00% 0.00% NNPA ratio>3% 2.14% 1.25% 0.00% 0.00% 0.00% 0.00% Cantonal banks NNPA ratio≤1% 81.52% 0.94% 0.94% 0.00% 0.00% 0.00% 1%<NNPA ratio≤3% 12.59% 0.94% 0.00% 0.00% 0.00% 0.00% NNPA ratio>3% 2.14% 0.94% 0.00% 0.00% 0.00% 0.00% Other banks NNPA ratio<=1% 83.39% 0.63% 0.63% 0.00% 0.00% 0.00% 1%<NNPA ratio<=3% 11.96% 0.63% 0.00% 0.00% 0.00% 0.00% NNPA ratio>3% 2.14% 0.63% 0.00% 0.00% 0.00% 0.00% Note: The table shows for individual banks in each of our three categories of banks the distributions (by Net Non-Performing Asset (NNPA) and Common Equity Tier 1 (CET1) ratios) of that bank’s exposures to other Swiss banks in the three categories.
Figure A1.1: Generated joint distribution of CET1 and NNPA
Note: The figure shows graphically the distributions contained in Table A1.4.
Appendix 2: distribution of unrated bank exposures
Table A2.1: Interbank credit risk exposure distribution for different bank groups Large Cantonal Other banks banks banks Large banks 0.3 0.4 0.3 Cantonal banks 0.4 0.3 0.3 Other banks 0.5 0.15 0.35
Based on the above assumptions we van estimate the distributions of unrated bank exposures as shown in Table A2.2.
Table A2.2: Distribution of unrated bank exposures Total Bank group Grade A Grade B Grade C unrated Large banks 30.5% 4.5% 0.0% 35.0% Cantonal banks 25.5% 4.5% 0.0% 30.0% Other banks 19.8% 5.3% 0.0% 25.0%
Notes
[1] Simone Bernardi is Head P&C / GWM Rating, LGD, RWA and Capital Planning at UBS. William Perraudin is Director of Risk Control. Peng Yang is a Senior Quantitative Analyst at Risk Control. The authors’ email addresses are simone.bernardi@ubs.com , william.perraudin@riskcontrollimited.com and peng.yang@riskcontrollimited.com.
[2] The authors thank Steve Hottiger and Enrico Piotto for their insights and UBS for its support. The views expressed are the authors’ own and not necessarily either those of UBS or individuals who have provided comments.
[3] For example, for residential mortgages, the risk indicators that the authorities propose to use as the basis for regulatory capital are Loan to Value (LTV) and Debt Service Coverage (DSC) ratios. More information on the risk indicators may be found in Section 2.
[4] Reportedly, some senior regulators from countries in which the crisis had little or no impact have worried about the low default probabilities that banks have estimated and, hence, the low IRBA risk weights that are currently being used.
[5] It is worth noting that, following the crisis, the Basel Committee adopted major changes to the Basel II (see BCBS (2006)) capital definitions and capital target ratios. But, aside from the area of trading book rules, these changes (see BCBS (2009a), (2009b) and (2010b)) involved relatively minor changes in the definitions of Risk Weighted Assets (RWAs). The changes proposed in BCBS 307 are the first major post-crisis reform in RWAs.
[6] One may also be concerned that basing regulatory capital on accounting-data-related risk indicators will shift capital between sectors and jurisdictions in ways that depend more on differences in accounting practice than risk. In some countries, difficulties in obtaining the data necessary to calculate the indicators will mean that capital defaults to punitive values.
[7] In our results, we aggregate Raiffeisen with the Other SA Banks.
[8] Basel rule changes like those proposed in BCBS 306 and 307 are rarely subjected to detailed, public analysis. The authorities’ current approach involves calibration efforts internal to the regulatory community followed by QIS exercises employing data provided by banks. But, the calibration exercises and the results of QIS analysis are rarely disclosed in any detail. Academics have analysed important packages of measures such as Basel III capital changes but their studies are typically performed long after decisions have been made.
[9] Even when jurisdictions operate a Basel I floor, they may do so in different ways. In the European CRR formulation of the floor (see European Parliament (2013), Basel II capital must exceed a percentage of Basel I capital. In contrast, BCBS (2006) envisages that Basel II risk weights exceed a percentage of Basel I risk weights. Borchgrevink (2012) shows, through examples, that floors based on capital levels are markedly less conservative than floors based on risk weights.
[10] The data sources for Table 18 are as follows: The total domestic credit volume in Switzerland, as of December 2014, is CHF 1,066,136 million. The data source is the SNB report: Credit volume statistics – domestic and foreign available at http://www.snb.ch/ext/stats/bstamon/pdf/deen/Kreditstatistik_IABG.pdf. Figures on Exposure to Banks come from the SNB report: http://www.snb.ch/ext/stats/bstamon/pdf/deen/Aktiven_I.pdf. Figures on Total Mortgages also come from this report. As this report presents statistics for the total domestic and foreign credit volumes, there is no breakdown by bank groups for domestic credit volume. We assume all foreign lending is performed by Large Banks. Figures on Corporate Financing and Mortgages to Corporate come from SNB report: Credit volume statistics – domestic, to companies, by company size and type of loan. http://www.snb.ch/ext/stats/bstamon/pdf/deen/Kreditstatistik_Betriebsgroessen.pdf. Figures on Mortgages to Households are calculated as the difference between Total Mortgages and Mortgages to Corporates.
[11] It is particularly interesting to look at the effects of capital requirements broken down by loan type. Brun, Fraisse and Thesmar (2013) go even further by using loan level data to examine the effects of capital regulations on lending. They find strong results of capital changes on lending.
[12] Lack of detailed data on Specialised Lending for Credit Suisse obliges us to make the simplifying assumptions that the bank’s exposure to the Specialised Lending category Income Producing Real Estate is the same as UBS, i.e., CHF 20billion.
[13] Aggregate statistics on the Swiss banking sector and loan markets may be found in Swiss National Bank (2012) and (2013).
[14] The approach used by Basler Kantonal bank is unclear but we assume it primarily uses the SA. We are aware that some other banks in Switzerland have IRB status at least for some aspects of their capital calculations. There do not appear to be public disclosures that would permit us to allow for this in our study and it may be that the banks in question do not use IRB approaches for the asset classes we consider here.
[15] We rescale the exposure amounts for banks other than the two largest banks (for which we have timely data) to yield totals for the Raiffeisen and Cantonal Banks that equal those reported for end 2014 by the SNB. For Raiffeisen, we aggregate the exposure amount for each asset class; we rescale the total exposure amount for each asset class to match the SNB figures in Table 5. We are only able to rescale mortgages at the level of total mortgages. Since our data on 37 banks does not cover all banks, we create two additional bank groups to represent cantonal banks and other banks which are not covered in the 37 banks. The exposure amounts for the additional cantonal banks group is calculated as the difference between the figures in Table 5 and the aggregated figures for each asset class for the cantonal banks among our 37 banks. We suppose that their risk weights equal the weighted average of those we derive for the cantonal banks among our 37 banks. For the Other Banks group, we create a group called additional other banks and follow the same logic as for cantonal banks so as to cover all remaining banks. Raiffeisen is grouped together with the Other Banks for the purpose of reporting results after all rescaling is complete.
[16] In the case of Banque Cantonale Vaudoise, a breakdown is provided only for the bank’s aggregated category: “banks, corporates and other institutions”. We, therefore, assume that the bank and corporate exposures of this bank have the same risk weight breakdown as the aggregate category.
[17] This is available at http://www.snb.ch/en/iabout/stat/statpub/bstamon/stats/bstamon.
[18] See FINMA Circular 2011/2.
[19] These measures are expressed as ratios of minimum required capital to total risk weighted assets.
[20] See the Swiss TBTF bank capital regulations.
[21] High trigger CoCos convert to common equity when a 7% ratio of CET1 to total RWA is breached.
[22] Low trigger CoCos convert to common equity when a 5% ratio of CET1 to total RWA is breached.
[23] Without access to some internal bank data, it would be extremely difficult to assess the impact of the revised SA as we do in this paper. To illustrate, even to estimate the distribution of revenue for Swiss SMEs that borrow from banks is very challenging. Summary survey data is available on the average, range and median revenues of such SMEs (CHF million 14, 0–1,450 and 4, respectively) from Christen et al (2013). But, deducing the joint distribution of revenue, leverage and credit quality without private bank data appears impossible. UBS is active throughout Switzerland and in all of the sectors on which we focus. There may be differences between the distribution of its loan book and that of other individual Swiss banks. We would, however, expect use of its data to give reasonably unbiased results when one aggregates across multiple banks as we do in our results sections. 24This is consistent with survey evidence from developed economies; see, for example, Fernandez, Linares and Fernandez Acin (2014). 25Within frictionless markets, the distribution of financing between debt and equity does not affect the discount rate a firm uses to value cash flows. See Modigliani and Miller (1958). For a bank, this implies that lending spreads will be unaffected by holding more equity. When frictions are present such as agency costs, incomplete information or tax differentials between debt and equity, loan spreads may be affected by changes in capital ratios.
[26] Baker and Wurgler (2013), like Kashyap, Stein and Hanson (2010), find strong a relationship between the leverage and equity market betas of US banks. When Baker and Wurgler look only at large institutions involved in investment banking, the results weaken significantly. If returns on investment banks (which tend to be more levered) are more correlated with market indices, then this would exaggerate the apparent relationship between leverage and market betas. Including bank-specific dummies would remove this effect.
[27] We do not try to infer a pass-through fraction for spreads changes consequent on changes in capital rules since (i) inferring such a pass-through percentage is difficult and arbitrary and (ii) even if not passed through, spread changes impose costs on bank shareholders. Illustrating the difficulty of inferring pass through percentages, Cecchin (2011) looks at the pass though of bank funding costs (due to changes in market interest rates) to floating and fixed rate Swiss mortgage lending rates. The results are complex suggesting different degrees of competition in the fixed and floating rate segments of the market and consequent upward and downward inflexibilities.
[28] We think it appropriate to perform these calculations assuming a 100% pass through as this gives a measure of the total cost on both borrowers and bank shareholders.