

Regulatory authorities in Europe may wish to reconsider the capital that banks and insurers hold against their securitisation exposures. Such a review is justified by the need for Europe to finance climate and digital transitions. Boosting investment will only be possible if the continent’s banks can create lending headroom through securitisation. This report sets out how insurer and bank securitisation capital charges could be aligned with the risk of these exposures. The report draws on three past studies: Perraudin and Qiu (2022), Duponcheele et al. (2013c), and Agarwal and Perraudin (2024). The calibrations proposed are based on data and analysis rather than representing incremental adjustments from the status quo. Past attempts by regulators to revive the European securitisation markets have taken such incremental approaches. We believe that the market will only return to a satisfactory state when capital rules are consistent with risk. Table of Contents
Key findings
- For Solvency II, the current calibration could be fixed easily if the calibration contained in Section 2 were adopted. The calibration is conservative and is backed by data, evidence and judgement. We recommend the following steps:
- For banks, the SEC-IRBA securitisation capital formula is beyond repair, and should be capped and floored. On the SEC-SA, the pool capital input to the formula should be scaled before it is introduced into the SSFA, with a scaling factor SF. We show the impact and benefit of introducing a scaling factor for different calibrations in Section 3.3, which provides a suitable starting point for the regulators to amend.
- For the Risk Weight Floor which primarily affects senior securitisation tranches, merely changing the value of the current floor (which is specified in absolute terms) will not revive the European securitisation market. We propose redesigning of the Risk Weight Floor to make it proportional to the risk of the underlying assets. Duponcheele et al. (2024a) provides a full discussion of this issue.
1 – Introduction
The European authorities are increasingly concerned about the continent’s economic performance and financial sovereignty. ECB (2024) states that Europe needs “massive private investments” to carry out the climate and digital transition. While equity markets can provide EU corporates with additional risk capacity, debt markets will have to provide the bulk of the investments needed. Much of this debt will have to come from the continent’s banks.
European banks are the key intermediators of surplus funds between European and international savers and ultimate investment spending. Banks could, in principle, meet Europe’s need for investible resources, but they are not profitable enough to raise substantial new equity. Without equity increases, banks can only lend more if they transfer risk to the capital markets through securitisation. In so doing, banks would generate ‘capital velocity’ in that they would be able to deploy their risk capacity more than once.[2]
Securitisation is the only highly scalable financing instrument through which banks can tap into capital markets. In Europe, this instrument has been underused, in part because of the prudential treatment of issuers and investors. This was recognised by the Governing Council of the European Central Bank in March 2024 (italic font added): “Ensuring that the EU securitisation market can play a role in transferring risks away from banks to enable them to provide more financing to the real economy, while creating opportunities for capital markets investors. This requires understanding the supply and demand factors relevant for the development of the securitisation market, including […] reviewing the prudential treatment of securitisation for banks and insurance companies and the reporting and due diligence requirements, while taking into account international standards […]” see ECB (2024).
It appears that the Eurogroup has begun to adopt these views which have been further developed in the Noyer (2024), Letta (2024) and Draghi (2024) reports. Some of the same points have been discussed by the European Economic and Social Committee (EESC). In response, the European Commission (EC) launched a ‘targeted consultation on the functioning of the EU Securitisation framework’ in October 2024 (see EC (2024)).
The consultation is unusual in the breadth of questions asked and the number of topics open for discussion. Both banking and insurance prudential treatments are considered, as well as securitisation regulation. Formal responsibility for these areas belongs to the European Banking Authority (EBA), the European Insurance and Occupational Pensions Authority (EIOPA) and the European Securities and Markets Authority (ESMA), respectively. The work on securitisation of these three authorities is coordinated by the Joint Committee of the European Supervisory Authorities (JC of the ESAs) which is without a stakeholder group.[3] The consultation asks in several contexts whether respondents consider the calibration appropriate, and, if not, what they consider to be appropriate calibrations.
This report sets out how, in our view, capital rules should be calibrated for insurers and banks. We agree with the points made above that securitisation, if reformed, could significantly help address Europe’s wider economic problems and the need to invest to accomplish climate and digital transitions.
The approach we develop here remains prudent, however, in that we suggest that capital for insurers and banks be aligned with actual risk. Following, the Global Financial Crisis (GFC), regulators competed to implement rules that penalised exposures and markets that were thought to have contributed to financial instability. Many of these adjustments were not based on the analysis of actual risk. Insufficient attention was paid either by the industry or by regulatory authorities (as far as one may judge from what is in the public domain) to generating evidence on the risk of securitisation exposures.
To assist decision-makers on a possible reset of securitisation capital rules, this report sets out results from two decades of research that we have conducted on these issues, working both for regulatory authorities and the industry. We consider two approaches.
1. When market prices are available, one can study the absolute and relative risk of different market segments and construct capital charges accordingly. The Solvency II prudential framework that applies to insurers investing in securitisation bonds (also called asset-backed securities or ABS) is based on a market risk calibration. This is discussed in Section 2. The assessment we present is made in absolute terms but is then used to adjust capital requirements relative to those for Covered Bonds (CBs). CBs have been granted regulatory privileges by the EC, EBA and EIOPA, and have been actively supported by the ECB during the GFC and the European Sovereign Crisis. They provide a key reference point for European capital rules.
2. When market prices are not available, as for example in the buy-and-hold securitisation market where only credit losses are relevant (such as in the Significant Risk Transfer (SRT) market), one can track risk using bottom-up analysis, exploiting the fact that the returns on buy-and-hold tranches depend on the risk of the underlying assets. There is a well-established set of theoretical and Monte Carlo models linking capital for tranched exposures to the risk of the underlying loans:
(i) Pykhtin and Dev (2002), a closed form analytical model;
(ii) Peretyatkin and Perraudin (2004), a flexible Monte Carlo approach;
(iii) Duponcheele, Perraudin and Totouom-Tangho (2013), (henceforth, Duponcheele et al. (2013c)), a generalisation of Pykhtin and Dev allowing tenors beyond the Value-at-Risk horizon. In our view, the methods developed in these papers should be the primary basis on which regulators calibrate regulatory capital. The models are rigorous and consistent with how bank regulators have understood risk in loan portfolios in past calibrations. The studies generalise approaches already accepted by regulators for calibrating loan portfolio capital to capital charges for tranched exposures.
The task now facing Europe’s insurance and banking regulators is to calibrate capital charges for insurers and banks. The Standard Formula Solvency II capital rules consist of a set of stresses for (a) high quality (Simple, Transparent and Standardised) securitisation and (b) other securitisation positions of different credit quality (as reflected by ratings), seniority (senior or not) and tenors (as reflected in modified duration). Insurers employ look-up tables of Solvency II securitisation stresses when they compute their regulatory capital.
Bank capital charges under the Basel III securitisation capital rules comprise three approaches, the Securitisation Standardised Approach (SEC-SA), the Securitisation Internal Ratings Based Approach (SEC-IRBA) and the Securitisation External Ratings Based Approach (SEC-ERBA[4]). In this study, we focus on the SEC-SA and SEC-IRBA. Both employ an expression termed the Simplified Supervisory Formula Approach (SSFA). This is an ad hoc ‘formula’ which depends on a parameter p which requires calibration. The calibration of p can only sensibly be performed with a risk model. An applicable model is presented in Section 3.
The SEC-SA and SEC-IRBA include a Risk Weight Floor which aims to constrain capital when direct application of the regulatory formula yields very low charges. This may be justified by the notion of Model Risk affecting the inputs to the formula. The Basel framework, as implemented in Europe, requires key inputs, including Probabilities of Default (PDs) and Loss Given Default Rates (LGDs) to be estimated allowing for Margins of Conservatism (MoCs). Hence, one may argue that Model Risk affecting such inputs is already allowed for.[5]
One may be concerned that loan credit risk correlations which lie behind any capital modelling calibration are not known with certainty and, hence, a floor should be included within the capital formula. The IRBA Risk Weight (RW) for loans also depends on correlations. In our view, the Basel calibration of these parameters is conservative in that the values appearing in the regulations are much higher than what one obtains using actual loan data. Securitisation capital, however, also depends on correlation parameters that affect the distribution of capital across junior, mezzanine and senior tranches. Section 4 quantifies Model Risk for securitisation attributable to this aspect of correlation and uses it as a basis for calibrating a Risk Weight Floor for senior tranches.
When capital calibration is not aligned with risk, we believe that the consequences are plain to see. Within Europe, the traditional securitisation market is not functioning as it should. Traditional funded securitisation placed with third-party investors remains moribund and synthetic securitisation of high-quality assets (such as prime residential mortgages) exhibits strikingly low volumes. Rectifying this situation would increase the capital velocity of European banks, helping the financing of the wider economy.
4 Associated with SEC-ERBA calibration is the Securitisation Internal Assessment Approach (SEC-IAA). 5 Risk Weight Floors are also embedded in the tables of SEC-ERBA and SEC-IAA.
It appears that the European Commission is now reviewing how securitisation capital charges have been calibrated. This paper aims to assist regulators in performing this review. We reach the following conclusions:
• For Solvency II, the current calibration could be fixed easily if the calibration contained in this paper was adopted. The calibration is conservative and is backed by data and evidence while embodying some limited degree of judgement.
• For banks, the SEC-IRBA securitisation capital formula is beyond repair. We have not attempted to suggest detailed revisions but simply propose that the p parameter (which in this case is a function of deal characteristics) be capped and floored. On the SEC-SA, we propose that the pool capital input to the formula should be scaled before it is introduced into the SSFA. This would introduce an additional ‘degree of freedom’ in allocating capital across different tranches without enforcing an unjustified capital surcharge. The capital treatment of non-senior tranches, which are the primary risk-bearing instruments in a securitisation, would be improved by this. In some cases, tranche capital would increase and in others it would fall.
• For the Risk Weight Floor, which primarily affects senior securitisation tranches, merely changing the value of the current floor (which is specified in absolute terms) will not revive the European securitisation market. What is needed is a redesign of the Risk Weight Floor, making it proportional to the risk of underlying assets. Duponcheele et al. (2024a) provide a detailed discussion of this issue. This reform would have a major impact on the European securitisation market, permitting securitisation of prime mortgage portfolios, which is not economically viable under the current rules.
To conclude, the European Commission has, unfortunately, omitted from its recent consultation the most important question: how can distortions in the European securitisation market be reduced? Unless political and regulatory leaders grasp the importance of this question and deploy technical expertise to understand the necessary measures, we will see another round of consultations five years from now and policymakers will find themselves asking why the 2025 reforms did not succeed as expected.
2 – Calibration of solvency II capital charges
European regulations for insurer securitisation capital charges have evolved over the last sixteen years as the authorities in Europe have devised rules and then repeatedly adjusted them. The design of the Solvency II Standard Formula (SF) is set out in Directive 2009/138/EC. The first methodology was a default-based methodology based on Standard & Poor’s AAA stress factors designed in 2010 by CEIOPS (the predecessor of EIOPA). The first calibration based on this methodology appeared in 2011. Aspects of this early calibration have survived in the current framework for the non-investment grade portion of the table labelled ‘Other securitisation.’
EIOPA proposed a modified calibration in 2013. This was reportedly based on ABS market price indices provided by Markit iBoxx and Bank of America. Published in 2014, it set out charges for two categories of securitisation, Type A and Type B. The calibration for Type B survives in the capital charges of the current framework for the investment grade portion of the table ‘Other securitisation.’
In 2014, Type 1 and Type 2 securitisations replaced Type A and Type B, with Type 1 being an investmentgrade-only predecessor of Simple, Transparent and Standardised (STS) (the latter is explained below). For Type 1, the EIOPA 2014 calibration is simply the EIOPA 2013 calibration of Type A, with stresses reduced by a factor of 2. The reduction appears to have been judgmental rather than based on data analysis. For the Delegated Act (2015), the European Commission capped the Type 1 calibration by implementing a ceiling set at the level of the calibration for Corporates. Type 2 inherited the calibration from Type B.
The final table for the market, including Type 1 and Type 2 stresses, was a patchwork assembly of different methodologies and calibration from different time horizons and different definitions of what a high-quality securitisation might be. This table became the official calibration for the Solvency II Delegated Act (2015) that came into force in 2016.
In 2018, the Simple, Transparent and Standardised (STS) label was officially introduced for traditional securitisations; it was originally designed as part of the banking rules, but its use was extended to insurance regulation. The 2015 calibration for Type 1 was revamped completely and a new calibration for Senior STS and for Non-senior STS was produced. This calibration appears more coherent in its treatment of rating and duration dependence. The 2013 Type B calibration became the 2018 ‘Other securitisation’ calibration.
Although the absolute level for STS capital charges still appears high, a giant cliff-effect of 1,150% was introduced between STS and ‘Other securitisation’, here labelled ‘Non-STS’. The cliff-effect (based on neither data nor other evidence) makes investment in STS difficult since loss of such status in many cases will necessitate disposing of a position.
In summary, today’s framework reflects a mixture of calibration methodologies going back to 2010. Though the framework was partially updated in 2013 and 2018, the changes were incoherent and have made it almost impossible for European insurance companies, subject to Standard Model Solvency II capital charges, to invest in securitisations on the asset side of their balance sheets. This explains why Honorary Governor Noyer states in his report: “The first priority should be to restore the investor base by correcting the prudential framework applicable to insurers and by extending eligibility to liquidity buffers for banks (LCR)” (italic font added) (see Noyer (2024).
A calibration based on data should be evaluated by asking whether it is fit for purpose. Specific issues that arise for the Solvency II calibration include whether the calibration should be based on data from a particular period (such as the GFC even if this is not relevant to today’s financial and regulatory environment), or should a calibration be forward looking to steer the market in a particular direction?
If the latter, the calibration must contain elements of judgment and should not be solely based on historical data. Clearly, STS did not exist before 2019, so the 2018 STS calibration relied on judgement. The Council of the European Union should provide the European Commission with clear political objectives for the calibration of Solvency II securitisation charges.
The process that led to the assembly of the tables in the Solvency II Delegated Act (2018) appears to have been a series of compromises and incremental adjustments. There has been a regrettable lack of governance arrangements for data and calibration of the sort that regulated financial institutions are expected to adopt for the calibration of their own internal models. In the same way, the authorities should consider a regular program of evidence collection and monitoring of regulatory calibrations.
As far as one can tell from public disclosures, evidence collection has de facto been devolved to the trade associations. In that context, Risk Control was engaged on two occasions by AFME to analyse the Solvency II calibrations. This led to two research reports, Kutas et al. (2016) and Perraudin and Qiu (2022).
• Kutas et al. (2016) aimed to generate a capital charge calibration more reasonable and prudent than that contained in the Solvency II Delegated Act (2015). The study used data going back to just before the GFC.
• Perraudin and Qiu (2022) aimed to recalibrate the tables in the Solvency II Delegated Act (2018) without changing the design of the rules. There is, thus, a proposed calibration for Senior STS, for Non-senior STS, and for ‘Other securitisation’ (i.e., Non-STS) which does not distinguish between Senior and Non-senior. And the exercise was performed based solely on past historical data, removing the non-relevant period that is the GFC, which occurred in a different regulatory regime. The study used data from 2012 to 2022.
In this paper, we will go one step further by asking, based on Kutas et al. (2016) and Perraudin and Qiu (2022): what would be a reasonable calibration that has a forward-looking component and could steer the market towards revival?
First, consider the results of Perraudin and Qiu (2022). When market prices are available, one can study the absolute and relative risk of different market segments and construct capital charges accordingly. Figure 2.1 shows the cumulative return of constructed cumulative return indices on which absolute Value at Risks (VaRs) and ratios of VaRs can be determined.[6] The data covers 2010 to June 2021. The indices were created by Risk Control specifically for the calibration purpose, using granular data on the quoted prices of all European securitisations and Covered Bonds for which information was publicly available.
The absolute VaRs and their ratios are provided in Table 2.1. From this, to calibrate the Senior STS table of stress, Perraudin and Qiu (2022) scale up the Solvency II Delegated Act (2015) Covered Bonds calibration using the ratio in table by a factor of 1.29. For Non-Senior STS, the scaling factor applied to Covered Bonds is 1.85.
The ABS stresses are calibrated by scaling up the CB stresses because the Solvency II stresses distinguish between modified duration ranges. Calibrating separately each range seems over-ambitious so they do not attempt it. On the other hand, CBs are a reference asset in the European context, benefitting as they do with favoured treatment by regulators in the light of their low-risk status. Rather than presenting them in the form of difficult to interpret tables of stress factors, we show the implied capital charges in Table 2.2 for STS (Senior (Panel a) and Non-Senior (Panel b)). The process is repeated for ‘Other securitisations’, i.e., Non-STS with a factor of 2.21. The results appear in panel c) of Table 2.2 for Non-STS, with no distinction between seniority and non-seniority, as per the Delegated Act (2018).
Calibrating capital charges appropriate for future periods solely based on past data entrenches the past regulatory environment. It makes no sense to include the GFC period in the data when the rules within which the market operates have clearly changed. While one can understand that the CEIOPS (2010) methodology used for a 2011 calibration was the starting point of the discussion, it should not be the main or sole source of calibration for the ‘Other securitisations’ Non-Investment Grade portion of the capital charges.
Note that the capital charges faced by a European insurer are adjusted for diversification. The adjustments depend on the asset positions of the insurer. Perraudin and Qiu (2022) presents results for capital charges before and after such adjustments for the case of a representative European life insurer.
One point one might consider is that even calibrations based on recent data are backward looking. Their use reinforces the privileges that have been granted in Europe to the CBs funding instrument and punishes the technique that is now needed for the European economy, i.e. securitisation, a financing instrument. In the recent reports of Noyer, Letta and Draghi, Europe has discovered funding is not enough and financing is also relevant.
And even before those reports, the European Parliament chose to give traditional securitisations a chance to thrive. The recent Solvency II draft agreement in Parliament 23/04/2024 Plenary, includes the recital (105) (italic font added): “It should be ensured that the prudential treatment of investments in securitisation, including simple, transparent and standardised securitisation, appropriately reflects the actual risks, and that capital requirements associated with such investments be risk-oriented. To this end, the Commission should assess the appropriateness of existing calibrations for investments in securitisations that are set out in the delegated acts adopted pursuant to Directive 2009/138/EC, taking into account available market data, and their consistency with capital requirements that are applicable to investments in other fixed-income securities. Based on such assessment, and where appropriate, the Commission should consider amending the delegated act setting capital requirements applicable to investments in securitisation. Such amendments, which should be risk-based and evidence-based, could consist of introducing a more granular set of risk factors depending on the ranking of the securitisation tranches, or of differentiating different types of non-simple, transparent and standardised securitisation depending on their risks.”
How can this be achieved? One can start from the quantitative analysis of Perraudin and Qiu (2022), adding judgmental elements that allow for a vision for the future: a thriving European securitisation market helping to finance the economy. The introduction of judgmental elements means that there is more than one way to calibrate.
We present here one such way. The following steps are as follows:
1. Align Senior STS capital charges to capital charges for Bonds & Loans. One could argue that for Credit Quality Step (CQS) 0 and CQS 1, the alignment should be with Covered Bonds, or a value between Covered Bonds and Bonds & Loans. One could also justify linking this to asset class in that Residential Mortgage-Backed Securities (RMBS) and Consumer securitisations should be aligned with Covered Bonds, and Corporate and wholesale assets should be aligned with Banks & Loans. As we mentioned, this is where judgement comes in, and such choices may not be dependent on data, but on the political vision for the future European securitisation market.
2. Scale up Senior STS by a factor of 1.3 to generate the calibration of Senior Non-STS. This would remove the cliff-effect which makes investment, even in STS, challenging since insurers are faced with the need to dispose of positions if STS status is lost.
3. Scale up Senior (for both STS and Non-STS) by a factor of 1.5 to generate the calibration of the Non- Senior (for both STS and Non-STS).
Tables 2.3 for STS and 2.4 for Non-STS show the results. The values are broadly compatible with the quantitative work in Perraudin & Qiu (2022). The current ratio of Bonds & Loans (2.7% for a 3-year duration) to Covered Bonds (2.1% for a 3-year duration) is 1.29. Therefore, a Non-Senior Non-STS would have a multiple of 2.5 (= 1.29 × 1.3 × 1.5) compared to Covered Bonds. The multiple for Non-Senior STS will be 1.9 (=1.29 × 1.5). The multiple for Senior Non-STS will be 1.7 (=1.29 × 1.3). The multiple for Senior STS will be 1.29.
Finally, as an additional safeguard, there should be no cases in which the senior tranche exceeds the capital requirement on the underlying assets. This may occur in Solvency II since the stresses on tranched positions are not linked to the those applied to underlying assets. A cap should be introduced to preclude such cases.
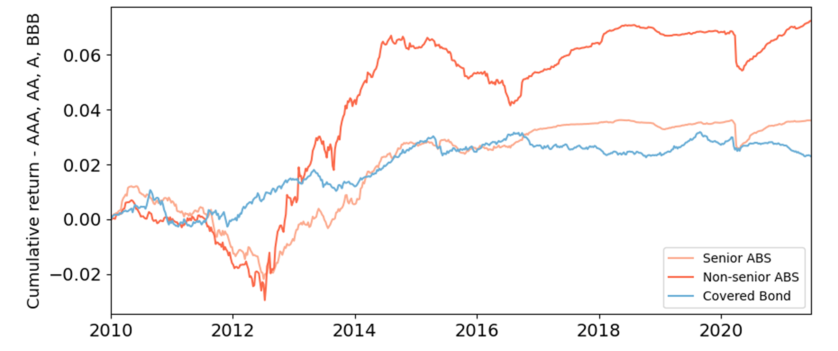
Source: Perraudin and Qiu (2022). Indices with bonds from countries France, Germany, Netherlands, Ireland, Spain, Italy and, United Kingdom.
| Country | Covered | Bond Senior | ABS | Non‐senior ABS Senior ABS VaR / CB | VaR | Non‐senior ABS VaR / CB | VaR |
|---|---|---|---|---|---|---|---|
| FR, DE, NL, | IE, ES, IT | 1.10% | 1.55% | 1.90% | 1.41 | 1.73 | |
| FR, DE, NL, | IE, ES, IT, GB | 1.09% | 1.40% | 2.00% | 1.29 | 1.85 | |
| Panel b) | Distinguishing STS | ||||||
| Value at Risk | Ratios | ||||||
| Country | Covered | bond Senior | STS ABS | Non‐senior STS ABS Non‐STS ABS | Non‐STS ABS VaR / CB | VaR | |
| FR, DE, NL, | IE, ES, IT, GB | 1.18% | 1.12% | 1.15% 2.61% | 2.21 |
Source: Perraudin and Qiu (2022). Here FR, DE, NL, IE, ES, IT and, GB denotes France, Germany, Netherlands, Ireland, Spain, Italy and, United Kingdom respectively.
| AAA | AA | A | BBB | BB | B | CCC | NR | AAA | AA | A | BBB | BB | B | CCC | NR | ||
|---|---|---|---|---|---|---|---|---|---|---|---|---|---|---|---|---|---|
| Ye | CQS | CQS | CQS | CQS | CQS | CQS | CQS | Ye | CQS | CQS | CQS | CQS | CQS | CQS | CQS | ||
| ar | 0 | 1 | 2 | 3 | 4 | 5 | 6 | NR | ar | 0 | 1 | 2 | 3 | 4 | 5 | 6 | NR |
| 1 | 0.9 | 1.2 | 1.8 | 3.2 | 5.8 | 9.7 | 9.7 | 3.9 | 1 | 1.3 | 1.7 | 2.6 | 4.6 | 8.3 | 13.8 | 13.8 | 5.5 |
| 2 | 1.8 | 2.4 | 3.6 | 6.4 | 11.6 | 19.4 | 19.4 | 7.8 | 2 | 2.6 | 3.4 | 5.2 | 9.2 | 16.6 | 27.6 | 27.6 | 11.0 |
| 3 | 2.7 | 3.6 | 5.4 | 9.6 | 17.4 | 29.1 | 29.1 | 11.7 | 3 | 3.9 | 5.1 | 7.8 | 13.8 | 24.9 | 41.4 | 41.4 | 16.5 |
| 4 | 3.6 | 4.8 | 7.2 | 12.8 | 23.2 | 38.8 | 38.8 | 15.6 | 4 | 5.2 | 6.8 | 10.4 | 18.4 | 33.2 | 55.2 | 55.2 | 22.0 |
| 5 | 4.5 | 6.0 | 9.0 | 16.0 | 29.0 | 48.5 | 48.5 | 19.5 | 5 | 6.5 | 8.5 | 13.0 | 23.0 | 41.5 | 69.0 | 69.0 | 27.5 |
| 6 | 5.1 | 6.6 | 9.9 | 17.9 | 32.2 | 53.9 | 53.9 | 21.7 | 6 | 7.4 | 9.4 | 14.3 | 25.8 | 46.1 | 76.8 | 76.8 | 30.6 |
| 7 | 5.7 | 7.2 | 10.8 | 19.8 | 35.4 | 59.3 | 59.3 | 23.9 | 7 | 8.3 | 10.3 | 15.6 | 28.6 | 50.7 | 84.6 | 84.6 | 33.7 |
| 8 | 6.3 | 7.8 | 11.7 | 21.7 | 38.6 | 64.7 | 64.7 | 26.1 | 8 | 9.2 | 11.2 | 16.9 | 31.4 | 55.3 | 92.4 | 92.4 | 36.8 |
| 9 | 6.9 | 8.4 | 12.6 | 23.6 | 41.8 | 70.1 | 70.1 | 28.3 | 9 | 10.1 | 12.1 | 18.2 | 34.2 | 59.9 | 100.0 | 100.0 | 39.9 |
| 10 | 7.5 | 9.0 | 13.5 | 25.5 | 45.0 | 75.5 | 75.5 | 30.5 | 10 | 11.0 | 13.0 | 19.5 | 37.0 | 64.5 | 100.0 | 100.0 | 43.0 |
| 11 | 8.1 | 9.6 | 14.1 | 26.8 | 47.3 | 76.1 | 76.1 | 32.1 | 11 | 11.9 | 13.9 | 20.4 | 38.8 | 67.8 | 100.0 | 100.0 | 45.2 |
| 12 | 8.7 | 10.2 | 14.7 | 28.1 | 49.6 | 76.7 | 76.7 | 33.7 | 12 | 12.8 | 14.8 | 21.3 | 40.6 | 71.1 | 100.0 | 100.0 | 47.4 |
| 13 | 9.3 | 10.8 | 15.3 | 29.4 | 51.9 | 77.3 | 77.3 | 35.3 | 13 | 13.7 | 15.7 | 22.2 | 42.4 | 74.4 | 100.0 | 100.0 | 49.6 |
| 14 | 9.9 | 11.4 | 15.9 | 30.7 | 54.2 | 77.9 | 77.9 | 36.9 | 14 | 14.6 | 16.6 | 23.1 | 44.2 | 77.7 | 100.0 | 100.0 | 51.8 |
| 15 | 10.5 | 12.0 | 16.5 | 32.0 | 56.5 | 78.5 | 78.5 | 38.5 | 15 | 15.5 | 17.5 | 24.0 | 46.0 | 81.0 | 100.0 | 100.0 | 54.0 |
| 16 | 11.1 | 12.6 | 17.1 | 33.3 | 57.1 | 79.1 | 79.1 | 40.1 | 16 | 16.4 | 18.4 | 24.9 | 47.8 | 81.9 | 100.0 | 100.0 | 56.2 |
| 17 | 11.7 | 13.2 | 17.7 | 34.6 | 57.7 | 79.7 | 79.7 | 41.7 | 17 | 17.3 | 19.3 | 25.8 | 49.6 | 82.8 | 100.0 | 100.0 | 58.4 |
| 18 | 12.3 | 13.8 | 18.3 | 35.9 | 58.3 | 80.3 | 80.3 | 43.3 | 18 | 18.2 | 20.2 | 26.7 | 51.4 | 83.7 | 100.0 | 100.0 | 60.6 |
| 19 | 12.9 | 14.4 | 18.9 | 37.2 | 58.9 | 80.9 | 80.9 | 44.9 | 19 | 19.1 | 21.1 | 27.6 | 53.2 | 84.6 | 100.0 | 100.0 | 62.8 |
| 20 | 13.5 | 15.0 | 19.5 | 38.5 | 59.5 | 81.5 | 81.5 | 46.5 | 20 | 20.0 | 22.0 | 28.5 | 55.0 | 85.5 | 100.0 | 100.0 | 65.0 |
| 21 | 14.1 | 15.6 | 20.1 | 39.1 | 60.1 | 82.1 | 82.1 | 47.1 | 21 | 20.9 | 22.9 | 29.4 | 55.9 | 86.4 | 100.0 | 100.0 | 65.9 |
| 22 | 14.7 | 16.2 | 20.7 | 39.7 | 60.7 | 82.7 | 82.7 | 47.7 | 22 | 21.8 | 23.8 | 30.3 | 56.8 | 87.3 | 100.0 | 100.0 | 66.8 |
| 23 | 15.3 | 16.8 | 21.3 | 40.3 | 61.3 | 83.3 | 83.3 | 48.3 | 23 | 22.7 | 24.7 | 31.2 | 57.7 | 88.2 | 100.0 | 100.0 | 67.7 |
| 24 | 15.9 | 17.4 | 21.9 | 40.9 | 61.9 | 83.9 | 83.9 | 48.9 | 24 | 23.6 | 25.6 | 32.1 | 58.6 | 89.1 | 100.0 | 100.0 | 68.6 |
| 25 | 16.5 | 18.0 | 22.5 | 41.5 | 62.5 | 84.5 | 84.5 | 49.5 | 25 | 24.5 | 26.5 | 33.0 | 59.5 | 90.0 | 100.0 | 100.0 | 69.5 |
| Panel | c) | Other | Securitisations | (Non-STS) | |||||||||||||
| Ye | AAA | AA | A | BBB | BB | B | CCC | NR | |||||||||
| ar | CQS | CQS | CQS | CQS | CQS | CQS | CQS | NR | |||||||||
| 1 | 1.5 | 2.0 | 3.1 | 5.5 | 9.9 | 16.6 | 16.6 | 6.6 | |||||||||
| 2 | 3.0 | 4.0 | 6.2 | 11.0 | 19.8 | 33.2 | 33.2 | 13.2 | |||||||||
| 3 | 4.5 | 6.0 | 9.3 | 16.5 | 29.7 | 49.8 | 49.8 | 19.8 | |||||||||
| 4 | 6.0 | 8.0 | 12.4 | 22.0 | 39.6 | 66.4 | 66.4 | 26.4 | |||||||||
| 5 | 7.5 | 10.0 | 15.5 | 27.5 | 49.5 | 83.0 | 83.0 | 33.0 | |||||||||
| 6 | 8.6 | 11.1 | 17.0 | 30.8 | 55.0 | 92.3 | 92.3 | 36.8 | |||||||||
| 7 | 9.7 | 12.2 | 18.5 | 34.1 | 60.5 | 100.0 | 100.0 | 40.6 | |||||||||
| 8 | 10.8 | 13.3 | 20.0 | 37.4 | 66.0 | 100.0 | 100.0 | 44.4 | |||||||||
| 9 | 11.9 | 14.4 | 21.5 | 40.7 | 71.5 | 100.0 | 100.0 | 48.2 | |||||||||
| 10 | 13.0 | 15.5 | 23.0 | 44.0 | 77.0 | 100.0 | 100.0 | 52.0 | |||||||||
| 11 | 14.1 | 16.6 | 24.1 | 46.2 | 81.0 | 100.0 | 100.0 | 54.6 | |||||||||
| 12 | 15.2 | 17.7 | 25.2 | 48.4 | 85.0 | 100.0 | 100.0 | 57.2 | |||||||||
| 13 | 16.3 | 18.8 | 26.3 | 50.6 | 89.0 | 100.0 | 100.0 | 59.8 | |||||||||
| 14 | 17.4 | 19.9 | 27.4 | 52.8 | 93.0 | 100.0 | 100.0 | 62.4 | |||||||||
| 15 | 18.5 | 21.0 | 28.5 | 55.0 | 97.0 | 100.0 | 100.0 | 65.0 | |||||||||
| 16 | 19.6 | 22.1 | 29.6 | 57.2 | 98.1 | 100.0 | 100.0 | 67.6 | |||||||||
| 17 | 20.7 | 23.2 | 30.7 | 59.4 | 99.2 | 100.0 | 100.0 | 70.2 | |||||||||
| 18 | 21.8 | 24.3 | 31.8 | 61.6 | 100.0 | 100.0 | 100.0 | 72.8 | |||||||||
| 19 | 22.9 | 25.4 | 32.9 | 63.8 | 100.0 | 100.0 | 100.0 | 75.4 | |||||||||
| 20 | 24.0 | 26.5 | 34.0 | 66.0 | 100.0 | 100.0 | 100.0 | 78.0 | |||||||||
| 21 | 25.1 | 27.6 | 35.1 | 67.1 | 100.0 | 100.0 | 100.0 | 79.1 | |||||||||
| 22 | 26.2 | 28.7 | 36.2 | 68.2 | 100.0 | 100.0 | 100.0 | 80.2 | |||||||||
| 23 | 27.3 | 29.8 | 37.3 | 69.3 | 100.0 | 100.0 | 100.0 | 81.3 | |||||||||
| 24 | 28.4 | 30.9 | 38.4 | 70.4 | 100.0 | 100.0 | 100.0 | 82.4 | |||||||||
| 25 | 29.5 | 32.0 | 39.5 | 71.5 | 100.0 | 100.0 | 100.0 | 83.5 |
Note: The proposed structure is based on Perraudin and Qiu (2022) results. All the values are in percentage. Here CQS denotes Credit Quality Step. Here darker grey cell represents relatively higher capital charges.
| AAA | AA | A | BBB | BB | B | CCC | NR | AAA | AA | A | BBB | BB | B | CCC | NR | ||
|---|---|---|---|---|---|---|---|---|---|---|---|---|---|---|---|---|---|
| Ye | CQS | CQS | CQS | CQS | CQS | CQS | CQS | Ye | CQS | CQS | CQS | CQS | CQS | CQS | CQS | ||
| ar | 0 | 1 | 2 | 3 | 4 | 5 | 6 | NR | ar | 0 | 1 | 2 | 3 | 4 | 5 | 6 | NR |
| 1 | 0.9 | 1.1 | 1.4 | 2.5 | 4.5 | 7.5 | 7.5 | 3.0 | 1 | 1.4 | 1.7 | 2.1 | 3.8 | 6.8 | 11.3 | 11.3 | 4.5 |
| 2 | 1.8 | 2.2 | 2.8 | 5.0 | 9.0 | 15.0 | 15.0 | 6.0 | 2 | 2.7 | 3.3 | 4.2 | 7.5 | 13.5 | 22.5 | 22.5 | 9.0 |
| 3 | 2.7 | 3.3 | 4.2 | 7.5 | 13.5 | 22.5 | 22.5 | 9.0 | 3 | 4.1 | 5.0 | 6.3 | 11.3 | 20.3 | 33.8 | 33.8 | 13.5 |
| 4 | 3.6 | 4.4 | 5.6 | 10.0 | 18.0 | 30.0 | 30.0 | 12.0 | 4 | 5.4 | 6.6 | 8.4 | 15.0 | 27.0 | 45.0 | 45.0 | 18.0 |
| 5 | 4.5 | 5.5 | 7.0 | 12.5 | 22.5 | 37.5 | 37.5 | 15.0 | 5 | 6.8 | 8.3 | 10.5 | 18.8 | 33.8 | 56.3 | 56.3 | 22.5 |
| 6 | 5.0 | 6.1 | 7.7 | 14.0 | 25.0 | 41.7 | 41.7 | 16.7 | 6 | 7.5 | 9.2 | 11.6 | 21.0 | 37.5 | 62.6 | 62.6 | 25.1 |
| 7 | 5.5 | 6.7 | 8.4 | 15.5 | 27.5 | 45.9 | 45.9 | 18.4 | 7 | 8.3 | 10.1 | 12.6 | 23.3 | 41.3 | 68.9 | 68.9 | 27.6 |
| 8 | 6.0 | 7.3 | 9.1 | 17.0 | 30.0 | 50.1 | 50.1 | 20.1 | 8 | 9.0 | 11.0 | 13.7 | 25.5 | 45.0 | 75.2 | 75.2 | 30.2 |
| 9 | 6.5 | 7.9 | 9.8 | 18.5 | 32.5 | 54.3 | 54.3 | 21.8 | 9 | 9.8 | 11.9 | 14.7 | 27.8 | 48.8 | 81.5 | 81.5 | 32.7 |
| 10 | 7.0 | 8.5 | 10.5 | 20.0 | 35.0 | 58.5 | 58.5 | 23.5 | 10 | 10.5 | 12.8 | 15.8 | 30.0 | 52.5 | 87.8 | 87.8 | 35.3 |
| 11 | 7.5 | 9.0 | 11.0 | 21.0 | 36.8 | 59.0 | 59.0 | 24.7 | 11 | 11.3 | 13.5 | 16.5 | 31.5 | 55.2 | 88.5 | 88.5 | 37.1 |
| 12 | 8.0 | 9.5 | 11.5 | 22.0 | 38.6 | 59.5 | 59.5 | 25.9 | 12 | 12.0 | 14.3 | 17.3 | 33.0 | 57.9 | 89.3 | 89.3 | 38.9 |
| 13 | 8.5 | 10.0 | 12.0 | 23.0 | 40.4 | 60.0 | 60.0 | 27.1 | 13 | 12.8 | 15.0 | 18.0 | 34.5 | 60.6 | 90.0 | 90.0 | 40.7 |
| 14 | 9.0 | 10.5 | 12.5 | 24.0 | 42.2 | 60.5 | 60.5 | 28.3 | 14 | 13.5 | 15.8 | 18.8 | 36.0 | 63.3 | 90.8 | 90.8 | 42.5 |
| 15 | 9.5 | 11.0 | 13.0 | 25.0 | 44.0 | 61.0 | 61.0 | 29.5 | 15 | 14.3 | 16.5 | 19.5 | 37.5 | 66.0 | 91.5 | 91.5 | 44.3 |
| 16 | 10.0 | 11.5 | 13.5 | 26.0 | 44.5 | 61.5 | 61.5 | 30.7 | 16 | 15.0 | 17.3 | 20.3 | 39.0 | 66.8 | 92.3 | 92.3 | 46.1 |
| 17 | 10.5 | 12.0 | 14.0 | 27.0 | 45.0 | 62.0 | 62.0 | 31.9 | 17 | 15.8 | 18.0 | 21.0 | 40.5 | 67.5 | 93.0 | 93.0 | 47.9 |
| 18 | 11.0 | 12.5 | 14.5 | 28.0 | 45.5 | 62.5 | 62.5 | 33.1 | 18 | 16.5 | 18.8 | 21.8 | 42.0 | 68.3 | 93.8 | 93.8 | 49.7 |
| 19 | 11.5 | 13.0 | 15.0 | 29.0 | 46.0 | 63.0 | 63.0 | 34.3 | 19 | 17.3 | 19.5 | 22.5 | 43.5 | 69.0 | 94.5 | 94.5 | 51.5 |
| 20 | 12.0 | 13.5 | 15.5 | 30.0 | 46.5 | 63.5 | 63.5 | 35.5 | 20 | 18.0 | 20.3 | 23.3 | 45.0 | 69.8 | 95.3 | 95.3 | 53.3 |
| 21 | 12.5 | 14.0 | 16.0 | 30.5 | 47.0 | 64.0 | 64.0 | 36.0 | 21 | 18.8 | 21.0 | 24.0 | 45.8 | 70.5 | 96.0 | 96.0 | 54.0 |
| 22 | 13.0 | 14.5 | 16.5 | 31.0 | 47.5 | 64.5 | 64.5 | 36.5 | 22 | 19.5 | 21.8 | 24.8 | 46.5 | 71.3 | 96.8 | 96.8 | 54.8 |
| 23 | 13.5 | 15.0 | 17.0 | 31.5 | 48.0 | 65.0 | 65.0 | 37.0 | 23 | 20.3 | 22.5 | 25.5 | 47.3 | 72.0 | 97.5 | 97.5 | 55.5 |
| 24 | 14.0 | 15.5 | 17.5 | 32.0 | 48.5 | 65.5 | 65.5 | 37.5 | 24 | 21.0 | 23.3 | 26.3 | 48.0 | 72.8 | 98.3 | 98.3 | 56.3 |
| 25 | 14.5 | 16.0 | 18.0 | 32.5 | 49.0 | 66.0 | 66.0 | 38.0 | 25 | 21.8 | 24.0 | 27.0 | 48.8 | 73.5 | 99.0 | 99.0 | 57.0 |
Note: All values are in percentage. Here CQS denotes Credit Quality Step. Here darker grey cell represents relatively higher capital charges.
| AAA | AA | A | BBB | BB | B | CCC | NR | AAA | AA | A | BBB | BB | B | CCC | NR | ||
|---|---|---|---|---|---|---|---|---|---|---|---|---|---|---|---|---|---|
| Ye | CQS | CQS | CQS | CQS | CQS | CQS | CQS | Ye | CQS | CQS | CQS | CQS | CQS | CQS | CQS | ||
| ar | 0 | 1 | 2 | 3 | 4 | 5 | 6 | NR | ar | 0 | 1 | 2 | 3 | 4 | 5 | 6 | NR |
| 1 | 1.2 | 1.4 | 1.8 | 3.3 | 5.9 | 9.8 | 9.8 | 3.9 | 1 | 1.8 | 2.1 | 2.7 | 5.0 | 8.9 | 14.7 | 14.7 | 5.9 |
| 2 | 2.3 | 2.9 | 3.6 | 6.5 | 11.7 | 19.5 | 19.5 | 7.8 | 2 | 3.5 | 4.4 | 5.4 | 9.8 | 17.6 | 29.3 | 29.3 | 11.7 |
| 3 | 3.5 | 4.3 | 5.5 | 9.8 | 17.6 | 29.3 | 29.3 | 11.7 | 3 | 5.3 | 6.5 | 8.3 | 14.7 | 26.4 | 44.0 | 44.0 | 17.6 |
| 4 | 4.7 | 5.7 | 7.3 | 13.0 | 23.4 | 39.0 | 39.0 | 15.6 | 4 | 7.1 | 8.6 | 11.0 | 19.5 | 35.1 | 58.5 | 58.5 | 23.4 |
| 5 | 5.9 | 7.2 | 9.1 | 16.3 | 29.3 | 48.8 | 48.8 | 19.5 | 5 | 8.9 | 10.8 | 13.7 | 24.5 | 44.0 | 73.2 | 73.2 | 29.3 |
| 6 | 6.5 | 7.9 | 10.0 | 18.2 | 32.5 | 54.2 | 54.2 | 21.7 | 6 | 9.8 | 11.9 | 15.0 | 27.3 | 48.8 | 81.3 | 81.3 | 32.6 |
| 7 | 7.2 | 8.7 | 10.9 | 20.2 | 35.8 | 59.7 | 59.7 | 23.9 | 7 | 10.8 | 13.1 | 16.4 | 30.3 | 53.7 | 89.6 | 89.6 | 35.9 |
| 8 | 7.8 | 9.5 | 11.8 | 22.1 | 39.0 | 65.1 | 65.1 | 26.1 | 8 | 11.7 | 14.3 | 17.7 | 33.2 | 58.5 | 97.7 | 97.7 | 39.2 |
| 9 | 8.5 | 10.3 | 12.7 | 24.1 | 42.3 | 70.6 | 70.6 | 28.3 | 9 | 12.8 | 15.5 | 19.1 | 36.2 | 63.5 | 100.0 | 100.0 | 42.5 |
| 10 | 9.1 | 11.1 | 13.7 | 26.0 | 45.5 | 76.1 | 76.1 | 30.6 | 10 | 13.7 | 16.7 | 20.6 | 39.0 | 68.3 | 100.0 | 100.0 | 45.9 |
| 11 | 9.8 | 11.7 | 14.3 | 27.3 | 47.8 | 76.7 | 76.7 | 32.1 | 11 | 14.7 | 17.6 | 21.5 | 41.0 | 71.7 | 100.0 | 100.0 | 48.2 |
| 12 | 10.4 | 12.4 | 15.0 | 28.6 | 50.2 | 77.4 | 77.4 | 33.7 | 12 | 15.6 | 18.6 | 22.5 | 42.9 | 75.3 | 100.0 | 100.0 | 50.6 |
| 13 | 11.1 | 13.0 | 15.6 | 29.9 | 52.5 | 78.0 | 78.0 | 35.2 | 13 | 16.7 | 19.5 | 23.4 | 44.9 | 78.8 | 100.0 | 100.0 | 52.8 |
| 14 | 11.7 | 13.7 | 16.3 | 31.2 | 54.9 | 78.7 | 78.7 | 36.8 | 14 | 17.6 | 20.6 | 24.5 | 46.8 | 82.4 | 100.0 | 100.0 | 55.2 |
| 15 | 12.4 | 14.3 | 16.9 | 32.5 | 57.2 | 79.3 | 79.3 | 38.4 | 15 | 18.6 | 21.5 | 25.4 | 48.8 | 85.8 | 100.0 | 100.0 | 57.6 |
| 16 | 13.0 | 15.0 | 17.6 | 33.8 | 57.9 | 80.0 | 80.0 | 39.9 | 16 | 19.5 | 22.5 | 26.4 | 50.7 | 86.9 | 100.0 | 100.0 | 59.9 |
| 17 | 13.7 | 15.6 | 18.2 | 35.1 | 58.5 | 80.6 | 80.6 | 41.5 | 17 | 20.6 | 23.4 | 27.3 | 52.7 | 87.8 | 100.0 | 100.0 | 62.3 |
| 18 | 14.3 | 16.3 | 18.9 | 36.4 | 59.2 | 81.3 | 81.3 | 43.0 | 18 | 21.5 | 24.5 | 28.4 | 54.6 | 88.8 | 100.0 | 100.0 | 64.5 |
| 19 | 15.0 | 16.9 | 19.5 | 37.7 | 59.8 | 81.9 | 81.9 | 44.6 | 19 | 22.5 | 25.4 | 29.3 | 56.6 | 89.7 | 100.0 | 100.0 | 66.9 |
| 20 | 15.6 | 17.6 | 20.2 | 39.0 | 60.5 | 82.6 | 82.6 | 46.2 | 20 | 23.4 | 26.4 | 30.3 | 58.5 | 90.8 | 100.0 | 100.0 | 69.3 |
| 21 | 16.3 | 18.2 | 20.8 | 39.7 | 61.1 | 83.2 | 83.2 | 46.8 | 21 | 24.5 | 27.3 | 31.2 | 59.6 | 91.7 | 100.0 | 100.0 | 70.2 |
| 22 | 16.9 | 18.9 | 21.5 | 40.3 | 61.8 | 83.9 | 83.9 | 47.5 | 22 | 25.4 | 28.4 | 32.3 | 60.5 | 92.7 | 100.0 | 100.0 | 71.3 |
| 23 | 17.6 | 19.5 | 22.1 | 41.0 | 62.4 | 84.5 | 84.5 | 48.1 | 23 | 26.4 | 29.3 | 33.2 | 61.5 | 93.6 | 100.0 | 100.0 | 72.2 |
| 24 | 18.2 | 20.2 | 22.8 | 41.6 | 63.1 | 85.2 | 85.2 | 48.8 | 24 | 27.3 | 30.3 | 34.2 | 62.4 | 94.7 | 100.0 | 100.0 | 73.2 |
| 25 | 18.9 | 20.8 | 23.4 | 42.3 | 63.7 | 85.8 | 85.8 | 49.4 | 25 | 28.4 | 31.2 | 35.1 | 63.5 | 95.6 | 100.0 | 100.0 | 74.1 |
Note: All values are in percentage. Here CQS denotes Credit Quality Step. Here darker grey cell represents relatively higher capital charges.
3 – Calibration of bank risk weights
3.1 The Current Regulatory Formula for Bank Securitisation Capital
In 2012, Basel regulators adopted a Risk Weight (RW) formula based on a simple formula called the Simplified Supervisory Formula Approach (SSFA). If K_{SA} is the weighted-average capital requirement under the Standardised Approach of the underlying exposures as a percentage of par value and w is the fraction of pool exposures that are non-performing or defaulted. One may define K_A as in equation (3.1).
(3.1) K_A =(1 −w) K_{SA} + 0.5 w
For a tranche attaching at A and detaching at D, for a threshold K_{1250}% set at K_A, let RW_{T,SSFA}(A, D) denote the risk weight of the tranche per unit of tranche par value under the Securitisation Standardised Approach (SEC- SA) is:

2. if A <K_{1250}% ≤D, then

(3.2a)
3. if K_{1250}% ≤A, the RW_{T,SSFA}(A, D)=K_{SSFA}(max{0,A −K1250%},D −K1250%)

(3.2b)

_−

The presentation in equation (3.2) is not the same as in the Basel documents or the European CRR. These latter introduce intermediate parameters which reduce the transparency of the formula. The regulatory formula using the Basel and CRR presentation is included in Appendix 1 which also explains the Securitisation Internal Ratings Based Approach (SEC-IRBA).
In equation (3.2), the factor p is a fixed parameter taking values of 0.5 or 1.0 for an STS or a Non-STS securitisation and 1.5 for a re-securitisation.
For capital purposes, a thick tranche for which D discretely exceeds A may be considered to be a portfolio of thin tranches with attachment points of A +i δ for integers i = 0,1,2, . . , N-1 and detachment points A +(i+ 1) δ where δ is a small value such that δ =(D−A)/N for large N.
The capital, per unit of par value, for a thin tranche (for small δ) for A <K_A equals unity, while for A >K_A the capital is[7]:

Figure 3.1 illustrates the regulatory formula graphically by plotting thin-tranche capital against the attachment points of the tranches. Here, the horizonal axis corresponds to the attachment point of thin tranche measured as a fraction of par value. The height of the curves shown in the figure equals the capital charge (to be multiplied by 12.5 to have a risk-weight equivalent). This starts at unity (i.e., 100% of par value) for thin junior tranche attaching at values close to zero on the horizontal axis. As the attachment point moves to the right (the thin tranche becomes more senior), the capital charge initially remains at unity until, at a certain point, it declines exponentially towards zero. The point at which capital ceases to be unity is the adjusted pool capital level K_A.
The sum of thin tranche capital values from A =K_A to A = 1 is the integral:[8]

The total capital for a bank that retains all the tranches (and without other regulatory overrides) would, therefore, be approximately (1 +p) K_A. In this sense, the parameter p gives a clear measure of the degree of non-neutrality of the securitisation capital framework in that (1 +p) is the ratio of (a) the capital required for holding all the tranches to (b) that required for holding the underlying assets.
For the SEC-IRBA, K_A is replaced by K_{IRB} and p is itself a function of several securitisation characteristics floored at 0.3 (the p-floor).[9]
In addition to the above calculations, regulators impose an override in the form of a tranche Risk Weight Floor (see Section 4) of 15% for Non-STS and 10% for STS securitisations. We do not include this floor in Figure 3.1 since it would barely appear in the figure, the height being 1.2% or 0.8% for the two cases, Non-STS and STS, respectively.
Much of the policy debate around securitisation capital may be traced to the geometry of the regulatory formula shown in Figure 3.1. Below, we introduce readers to some of the key issues, at each stage linking the discussion back to the forms of the curves appearing in Figure 3.1.
1. Non-neutrality versus cliff effects - As noted above, p determines the degree of non-neutrality of the framework. However, as one may see from the different curves in Figure 3.1, p also determines how flat the thin tranche capital curves are for different levels of seniority (i.e., attachment points A). If p is reduced to very low levels in the region of zero, the thin tranche capital curves take the form of a flat plateau for attachment points below K_A, a vertical cliff and then zero for higher attachment points, i.e., A >K_A.
The economic and regulatory implications of such a cliff can be serious. In the event of a crisis, as defaults accumulate in securitisation pools, w increases, and the capital a bank must hold against a mezzanine tranche attaching just above K_A can jump from a low number (here, based on the RW floor value) to 1 (i.e., 1250% RW). Managing a financial crisis both for senior bank managers and supervisors is much easier if regulatory capital is relatively stable. In the 2007-2010 crisis, the task of
European supervisors and commercial banks was substantially complicated by sharp fluctuations in bank capital caused by cliff effects in securitisation capital (and, also, by the policies of rating agencies in wholesale ratings reductions).
2. The origins of the formula - The flat plateau or requirement for capital deduction (or 1250% RW) for thin tranches attaching up to K_A may be traced back to regulatory concerns regarding capital arbitrage transactions made in the 1990s under the Basel I regulatory environment. In effect, this aspect of the rules is a regulatory overlay designed to prevent capital arbitrage as practiced 25 years ago when neither banks nor regulators were familiar with the true risks of securitisation exposures. As we shall see below when we present a rigorous model of securitisation tranche risk, the overlay is inconsistent with statistical analysis.
Borrowing from the world of gravity extreme sports, regulators have used the terminology ‘halfpipe design’ to describe the Basel formula (before the effect of a risk weight floor). The terminology suggests the formula is an assembly of two disparate models: ‘the flat table’ corresponds to the junior part of the securitisation structure, where a fixed value set at the maximum of 1 (i.e., 1250% RW) applies (the origins of which are to be found in the 1990s), and a second model that plays the role of the ‘transition’. This second model (the SSFA) is a decreasing exponential function with the pool capital as a variable and a parameter p (the ‘p-factor’).
The second model adds more capital, by the proportion p, when all the tranche portions above the threshold of capital deduction are added up. This leads to capital non-neutrality, and depending on how high the value of p is, to severe non-neutrality. This is why p is also associated with the ‘capital surcharge’. When p is set at 1.0 such as in SEC-SA, then the increase in the capital requirements (the ‘surcharge’) is 100%.
3. Calibration of the formula - For SA banks, the calibration by BCBS of the p-factor was initially set at 1.5 in the initial calibration in December 2012 and reduced in its final form at 1.0 in December 2013. For IRB banks, a linear interpolation of a mismatch of risk factors and a non-risk factor was taken calibrated on some data, using a methodology that cannot be replicated by outside researchers. This function called p_{IRBA} produces outcomes that can lead to an undercapitalisation of some mezzanine tranches, leading the BCBS to override it with a floor set at 0.3. The same function also produces abnormally high capital premiums especially for high quality assets (up to values in the range the 1.4- 1.6). The floored p_{IRBA} is the p used in SEC-IRBA. Figure 3.1 Panel a) shows the capital distribution with various levels of p, including the p-floor at 0.3 (which means that SEC-IRBA has a minimum of 30% of capital above the neutral level.)
In the light of the low default history of European assets, the European Commission, the EBA, the ECB and the Bank of England, sought to recalibrate the above formula by carving out a category of securitisations that could be regarded as ‘high quality’. This was the thinking behind the development of the STS framework in Europe. IOSCO helped to push for the adoption of this idea at the Basel level, leading to the equivalent Basel STC framework.
Unfortunately, it was not possible to reflect the key factors that drive securitisation risk in the STS/Non-STS distinction, namely regulatory asset class, seniority, granularity, pool capital, and pool loss given default. A pragmatic and political decision was made by the European authorities, for STS securitisations, to halve the p of this original opaque calibration, while unchanged values were retained to Non-STS. A minimum value of 0.3 (the p-floor) was maintained for STS to avoid cliff-effects. The same step of halving p for STS transaction was applied to SEC-SA, resulting in a capital surcharge of 50%. Since the US had unilaterally adopted a SEC-SA of p = 0.5 for all transactions, this meant Europe has set the calibration for its best assets to the level that the US applies to all its assets.
The halving of p for STS, does not solve the problems for Non-STS, however, which is still a very important component financing the European economy. Stakeholders that replied to the European Commission consultation on the functioning of the securitisation market in July 2021 expressed this view, as according to the JC of ESAs report (December 2022) (italic font added): “[They] emphasised that current capital charges for securitisations might be too prohibitive, relative to comparable asset classes, and insufficiently risk sensitive. Capital non-neutrality embedded in the framework (due to the current level of the p-factor and the risk weight floors) has been considered too high in relation to the lower agency and model risk featured by securitisations post the global financial crisis thanks to several supervisory (TRIM, SREP) and regulatory initiatives (EBA IRB repair, STS framework, SECR and output floors, though the latter are not yet in force).”
This non-neutrality of the capital measure for securitisation leads to a regulatory impasse, acknowledged by the JC of the ESAs, which highlights the need for an open discussion on the shape of the risk weight function (italic font added): “It is understood that legislators targeted different goals and effects with the formulabased approaches. First, to reduce cliff effects. Second, to ensure a deduction of capital as high as the capital before securitisation. Third, to avoid an unreasonable level of capital non-neutrality. This represents a conflict of objectives, as one can only achieve two out of these three goals within the current halfpipe design. All three goals cannot be reached simultaneously […] This finding of the conflicting three goals suggests for an open discussion on the shape of the RW function.”
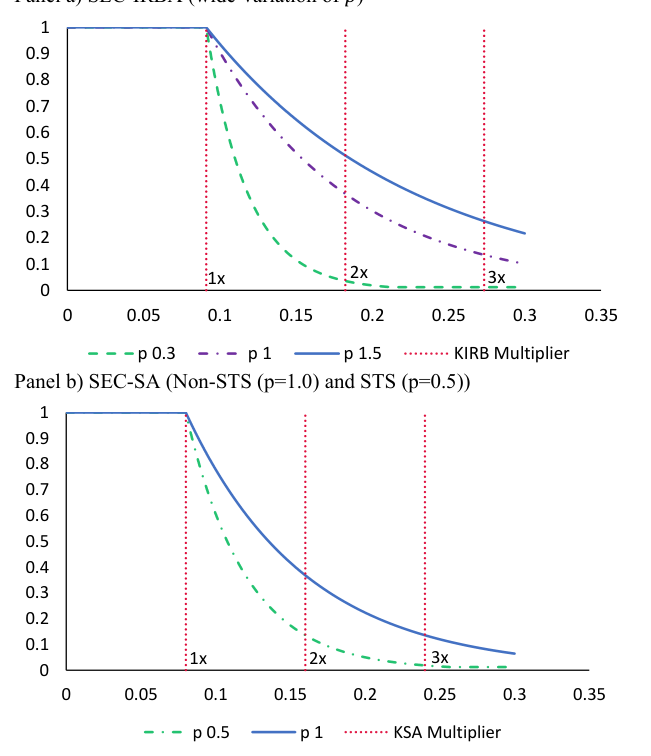
Note: The horizontal axis represents attachment point of the tranche. The KIRB in the panel a) is 9.11% and KSA in panel b) is 8%.
3.2 How the SSFA Might be Amended
Coming up with simple solutions for the calibration of p_{IRBA} is a hopeless task since the formula is beyond salvaging and requires a full re-consideration. The basic issue is that p_{IRBA} (which in this case is a function of deal characteristics) takes quite erratic values especially when applied to retail pools. Sensitivity to tranche maturity for retail assets (i.e., auto loans, SME retail, residential mortgages, credit cards) can lead to a capital surcharge per year of 24%. After 5 years, the capital surcharge sensitivity is, thus, of the order of 120%. For non-senior tranches, it is even higher at 135%.
In fact, tranche maturity is not even a risk factor in credit risk. It is included in the regulatory formula as a poor proxy for pool maturity. This sensitivity has never been justified by any published analysis. The only way to stop tranche maturity swamping the outcome is to cap it and we would recommend that regulators consider doing this. Setting such a cap must be done judgementally but such judgments may be informed by data as described in Duponcheele et al. (2013c).
More broadly, and the key point if one wishes to reconsider the p parameter employed in the SEC-SA, cutting the link between p and the degree of non-neutrality of the capital formula is essential if capital is to be spread appropriately across tranches without excessive conservatism. Any engineer will say hitting three goals with only one ‘control parameter’ is an impossible task. So, adjusting p alone to affect (i) the overall capital nonneutrality, (ii) the allocation of capital across tranches and (iii) financial stability is a vain hope. Consideration should be made to relatively minor modifications that would yield greater flexibility in how the formula aligns with risk.
When p is low (such as between 0 and 0.3), the cliff is vertical (0) or quasi-vertical (0.1) or very steep (0.2) and may affect financial stability, as banks retaining the risk of mezzanine tranches located just above the 1250% RW threshold are at risk of having insufficient capital in a financial crisis. When the p is too high (such as between 1.0 and 1.5), the capital surcharge is too high, the additional economic cost generated acts as a disincentive to securitise. When p is too low, the regulatory formula implies levels of capital for senior tranches that are lower than what a risk model (of the type presented in the next section) would imply.
The solution that cuts the link between p and the degree of capital non-neutrality is to introduce a scaling factor on the capital input to the SSFA as it appears in either the SEC-SA or the SEC-IRBA. Thus, Article 261.2 of the CRR defines K_A as in equation (3.1) above. All that is required to cut the link and introduce substantially more flexibility in the SEC-SA is to substitute equation (3.5) for equation (3.1)
(3.5)

Here, SF is a scaling factor or scalar parameter. This approach preserves the transparency of the SEC-SA in that the total capital for a bank holding all the tranches (if one ignores the effect of the RW floor) is SF ×(1 +p) instead of the righthand side of equation (3.4) plus 1, i.e., 1 +p (see Duponcheele and Perraudin (2022b)).
One might question whether Europe would want to introduce a parameter that is not currently included in the Basel framework. Historically, the European authorities have intervened at least twice to make the Basel framework better fit the nature of risks in European securitisation. The first time, occurred with STS when the
European authorities halved the p-factor.[10] On the second occasion, in 2023, the co-legislators, the European Parliament and the Council of the European Union adopted the “Boyer amendment”, again to halve the p-factor in SEC-SA temporarily for IRB banks only for the purpose of calculating SA capital for the Output floor (the value drops to 0.25 in SEC-SA for STS and to 0.5 for Non-STS).[11]
In the next section, we turn to how p and SF could be calibrated to improve the SEC-SA. We do not directly comment on the SEC-IRBA except to advocate the cap already mentioned.
3.3 Calibrating the Current Regulatory Formula
How should bank capital charges for securitisation exposures be calibrated? It is clear from the last section that the regulatory parameter p carries a heavy burden in the SSFA in that it determines (i) the capital surcharge post-securitisation, (ii) the allocation of capital between tranches, and (iii) the steepness of the cliff-effect.
• On (i), the capital surcharge post-securitisation is an important aspect of the securitisation capital design, requiring additional capital unrelated to the riskiness of the assets and, ultimately, acting to discourage securitisation issuances.
• On (ii), the allocation of capital between mezzanine and senior tranches is important in that, if it is unrelated to the risk profile, behaviour may be distorted, and market participants may take on positions without holding the capital that regulators would wish. Only through analysis with a risk model can one understand what the allocation should be.
• On (iii), the steepness of the cliff effect in the region of subordination just above total pool regulatory capital is relevant for financial stability: if the cliff is too steep, in the event of a financial crisis, the increased level of losses in the pool may lead to a jump in required capital from close to zero to full deduction for some mezzanine tranches. Banks retaining this risk are in danger of having insufficient capital should a financial crisis occur.
To provide perspectives on what adjustments are needed either in p or in other aspects of the SSFA, one may consider the implications of a risk model. A set of models exists that may be used to understand what capital a bank should hold against tranched exposures to pools of loans. These originate in studies written more than two decades ago, namely Pykhtin and Dev (2002) and Peretyatkin and Perraudin (2004).
Of these Pykhtin and Dev (2002) describes a generalisation to tranche exposures of the very model that is used as the basis for the Basel IRBA formula for loans. In the latter, a bank is assumed to hold granular loans with a correlation in credit quality that is attributable to a single risk factor. The bank exhausts its capital when this risk factor exceeds its 99.9% confidence level. The capital consumption of a single loan may be computed as the expected loss of the loan conditional on the factor equalling this quantile level. Pykhtin and Dev show under the same stylised assumptions of a perfectly granular portfolios and a single common factor driving the bank’s portfolio that capital for a tranched position equals a relatively simple closed form expression.
Peretyatkin and Perraudin (2004) employ Monte Carlo methods to analyse capital for portfolios containing both loans and securitisation tranches. This approach is applicable under more general assumptions than the Pykhtin and Dev but yields the same results when the stylised assumptions of the latter study are adopted. The models described in Peretyatkin and Perraudin (2004) were used to calibrate the Ratings Based Approach (RBA), which was the most widely used regulatory approach within the Basel II securitisation capital framework.
Box 1: A Model of Capital Charges for Thin Tranches
Consider a perfectly granular portfolio of 1-period loans with probabilities of default p_0. Suppose that whether a given loan defaults over the 1-period horizon is determined by the outcome of a Gaussian random factor and that the correlation between the factors corresponding to any two loans is ρ. These assumptions correspond to those of the Basel IRBA formula. Capital for each loan may be computed as the expected loss on the loan conditional on the common factor equalling its 99.9% quantile.
Now, suppose a bank also holds an exposure to a thin tranche of a securitisation made up loans as just described. The exposure must be small compared to the bank’s portfolio (so the latter remains granular). Assume that the factors driving defaults in the pool loans have pairwise correlations ρ_{pool} which are higher than ρ in that there is a parameter ρ∗ > 0 such that ρ∗ = (ρ_{pool} −ρ)/1 −ρ. These correspond to the assumptions of Pykhtin and Dev (2002). One may show that the capital for a thin tranche is as shown in equation (B1.1).

Here, N() represents the cumulative Gaussian function, A represents the attachment point of the thin tranche, P_1 represents the 1-year pool loan default probability, ρ represents the wider bank portfolio correlation, ρ_{pool} represents securitisation pool correlation, ρ∗ represents the factor by which the pool correlation is greater than wider bank’s portfolio correlation, P_{1,α} denotes 1-year pool probability default at confidence level of α and Capital_{1,α} denotes 1-year capital charge for a thin tranche with a confidence level of α.
This is the main finding of Pykhtin and Dev (2002). Having obtained the capital for a thin tranche, that for a thick tranche may be obtained by integration.
Duponcheele et al. (2013c) extends the 1-period model to M-period model, this model includes the maturity effect on the capital charge for the thin tranches. The modified thin-tranche Capital_{M,α} for a pool with a maturity of M years is shown in equation (B1.3)):

∗ = (B1.4)

Here, M represents the maturity of the securitisation pool in years, P_M is the M-year default probability of pool ∗ is the default probability of M-year maturity assets inclusive of risk premium for years 1 to M, and γ loans, P_M is a per-period risk premium[12] (We use a value for γ of 0.4 as suggested in BCBS (2013).) ρ_M∗ , P_{M,α} and Capital_{M,α} are the M-year equivalent of the three terms ρ∗, P_{1,α}, and Capital_{1,α} described in equation (B1.1).
To ensure neutrality between on- and off-balance sheet capital (i.e., to ensure that total deal capital equals the

IRBA capital charge for the pool assets) P_{M,α} may be set equal to _{LGD} rather than being defined as in (B1.6). Here, K_{IRB} denotes the capital charge of the underlying pool plus the 1-year Expected Loss (see Section 44.2 BCBS (2023)).
While having the advantages of a simple close-form analytical model, the Pykhtin-Dev model has the limitation that (i) it constrains the horizon of the Value at Risk/Capital computation to equal the maturity of the securitisation in question and (ii) it is a ‘default mode’ model in which losses only include those associated with loan defaults, i.e., risk associated with changes in value when ratings decline but no defaults occur are not included in the definition of losses. When these latter ‘transition risk events’ are included in losses, the approach is termed ‘economic loss mode’.
These two issues limit the applicability of the model for calibration purposes. Duponcheele, Perraudin and Totouom-Tangho (2013c), however, generalised the Pykhtin and Dev (2002) approach to economic loss mode capital calculations, permitting, for example, a 1-year horizon VaRs to be calculated for portfolios of long-lived securitisation exposures. While this generalisation was already possible within the Monte Carlo models of Peretyatkin and Perraudin (2004), the generalisation of Pykhtin and Dev (2002) extended its use for regulatory capital calibration purposes.
The key equations of the Pykhtin and Dev (2002) and Duponcheele, Perraudin and Totouom-Tangho (2013c) models are presented in Box 1.
The model is then used to perform thin tranche capital calculations, with the results being presented in
Figure 3.2. We employ representative parameters for European corporate loan pools. These are based on internal Risk Control empirical research or regulatory conventions. Appropriate for corporate loan pools, the values employed in preparing the figure are: P_1 = 1.59 %, ρ = 15.0 %, LGD = 45%, M = 3 years, γ = 0.40, α = 0.10 %. We compute the value of KIRB using the Basel’s IRBA formula which incorporates the Basel capital charge maturity adjustment. Using these values, we obtain the thin tranche capital charges shown in Figure 3.2.
Figure 3.2: Comparing Capital Charges Comparison with the Basel SSFA Model
in a capital surcharge of 30% in a capital surcharge of 15%
1 1 0.9 MVaR ρ⃰ 0.05 0.9 MVaR ρ⃰ 0.05 0.8 MVaR ρ⃰ 0.2 0.8 MVaR ρ⃰ 0.2 0.7 SF 0.65 and p 1.0 0.7 SF 0.767 and p 0.5 0.6 SF 1.0 and p 1.0 0.6 SF 1.0 and p 0.5 0.5 0.5
0.4 0.4
0.3 0.3
0.2 0.2
0.1 0.1
0 0 0 0.05 0.1 0.15 0.2 0.25 0.3 0 0.05 0.1 0.15 0.2 0.25 0.3
Panel c) Alternative STS: effect of SF=0.575 and p=1.0 Panel d) Undercapitalised STS: effect of SF=0.575 and resulting in a capital surcharge of 15% p=0.5, resulting in a negative capital surcharge
1 1 0.9 MVaR ρ⃰ 0.05 0.9 MVaR ρ⃰ 0.05 0.8 MVaR ρ⃰ 0.2 0.8 MVaR ρ⃰ 0.2 0.7 SF 0.575 and p 1.0 0.7 SF 0.575 and p 0.5 0.6 SF 1.0 and p 1.0 0.6 SF 1.0 and p 0.5 0.5 0.5
0.4 0.4
0.3 0.3
0.2 0.2
0.1 0.1
0 0 0 0.05 0.1 0.15 0.2 0.25 0.3 0 0.05 0.1 0.15 0.2 0.25 0.3
Note: Here, the horizontal axis represents attachment point and vertical axis represents capital charge.
Panel a) in Figure 3.2 shows Non-STS capital (computed as Marginal VaRs or ‘MVaRs’) for thin tranches using the model as the finely dotted red line. When a scaling factor of 0.65 and a p-factor of 1 are used, the regulatory capital charges more-or-less coincide with the model-implied MVaR curve. The non-neutrality implied by this combination of SF and p is 30%. Panel b) shows the same model-based MVaRs plotted with regulatory curves for a non-neutrality that might be more appropriate for STS, i.e., 15%. Here, we adopt an SF of 0.767 and p of 0.5.
A simple approach consists of selecting a desired level of non-neutrality and then selecting a combination of p and SF which delivers this non-neutrality while fitting the model implied capital charges reasonably well. If the p-factor is 1.0 (as under the Basel SEC-SA), if the scaling factor SF is set to 0.65, the capital surcharge is 30% (the same level as the p-floor in SEC-IRBA). This follows since:
Capital surcℎarge ≅ SF × (1 +p)− 1 = 0.65 × (1 + 1.0)− 1 = 0.3
When the STS regime was calibrated by the European authorities in 2015 (and adopted by Basel in 2016), the capital surcharge was halved from 100% to 50%, by halving the p-factor. A better way would have been to maintain the p-factor at 1.0 and determine a scaling factor SF of 0.575, which would have produced a capital surcharge of only 15%, reasonably close to capital neutrality, without creating a cliff-effect, in that:
Capital surcℎarge ≅ 0.575 × (1 + 1.0) – 1 = 0.15
However, the halving of the capital surcharge for STS was made by halving the p-factor, i.e., p = 0.5. If the pfactor were to be maintained at 0.5 for STS, as per the current legislation, then a scaling factor of 0.767 would be needed to result in a capital surcharge of 15%, in that:
Capital surcℎarge ≅ SF × (1 +p)− 1 = 0.767 × (1 + 0.5)− 1 = 0.15
Thus, one may regard use of the scaling factor SF as a technical fix that keeps the Basel ‘halfpipe design,’ but matches better the economic risk and the capital allocation and produces a capital surcharge of only 30% (corresponding to the same surcharge as what is produced with the existing p-floor of 0.3 in SEC-IRBA, but without undercapitalising mezzanine tranches).
This approach, if implemented in Europe, would have a substantial economic impact with minimal legislative changes. We set out in the Appendix what changes would be necessary in the legal wording of Article 255. These changes in wording have been kept to a minimum so that the result respects the ‘spirit of Basel III’, even though the ‘letter of Basel III’ would be slightly amended.[13]
One may argue that the capital surcharge for STS should be lower than for Non-STS. The political calibration for STS performed by the European authorities in 2016 consisted of halving the Non-STS capital surcharge. In this case, if 30% is considered an appropriate value for Non-STS, then 15% would be half of this. This would imply a scaling factor of 0.575 with a p of 1.0. Should a lower value be chosen, specifically a capital surcharge of 10%, then the scaling factor would be 0.55, while maintaining a p of 1.0. (Alternatively, if p is set at 0.5, then a scaling factor of 0.733 would also result in capital surcharge of 10%.)
Can the same scaling factors calibrated for SEC-SA be applied to SEC-IRBA? The answer is no, because of the way p_{IRBA} has been calibrated by BCBS. The latter produces aggressive values of p, especially for low quality assets (high risk weight assets). If p is already at the p-floor of 0.3, the introduction of a scaling factor would leave the curve steep and make non-neutrality as defined above negative. To solve these issues, SEC-IRBA needs a two-p calibration, or two scaling factors (see Duponcheele et al. (2014b)). The simplest intervention on SEC-IRBA is to cap and floor the outcomes.
4 – Calibrating the bank risk weight floor
The paper Duponcheele et al. (2024a), entitled ‘Rethinking the Securitisation Risk Weight Floor,’ provides a detailed history of the RW Floor.[14] The history shows that the RW Floor has evolved considerably as regulators have been influenced by different concepts and trade-offs between simplicity and calibration. Throughout, however, the floor has exhibited a significant deficiency in its design: the fact that it is a ‘fixed value’ insensitive to the riskiness of the underlying assets.
Imposing an ‘absolute-value’ RW Floor on securitisation tranche capital strongly affects which assets in which countries can be securitised synthetically. If the floor is high, then the retained senior tranche in typical securitisations becomes too costly in capital terms for the issuing bank. This is especially true when the underlying assets are low risk. For traditional, true-sale securitisations, a high absolute-value floor also affects the incentive for one originator bank to provide secured funding to another investor bank by buying the senior tranche in the former’s funded securitisation.
To take a specific example, residential mortgage loans in some European countries exhibit low RWs. For the 16 largest European banks, the average residential mortgage RW is 11.2%, with a wide dispersion between the banks (from 6.0% to 16.5%).[15] With the current fixed value RW Floor of 15% (and 10% for STS), securitisations that transfer residential mortgage risk to another bank is prohibitively expensive. The capital requirement of the senior tranche (typically AAA-rated) is higher than that of the unsecuritised assets. This financial incoherence freezes prime European residential mortgages on banks’ balance sheets.
BCBS had to implement a rule (Article 40.51) that explicitly states: “Where the risk weight cap results in a lower risk weight than the floor risk weight of 15%, the risk weight resulting from the cap should be used.” (see CRE 40, BCBS (2020)). This override highlights the problems created by a high fixed value of the RW Floor. In other words, when in a regulation a cap needs to override a floor, something is very wrong either in the calibration, the design, or both.
The December 2022 proposal of the JC of the ESAs (see EBA (2022)) only touches upon the calibration of a fixed value and does not address the design of the RW Floor. We think that the European Commission has an opportunity to address both.[16]
How can one think about the calibration of a floor proportional to pool RWs?[17] One issue is the variability or uncertainty concerning the inputs to a capital calculation. One might focus on variability in the RWA input to the capital formula. However, banks in Europe are now required to allow for model risk in Probabilities of Default and Loss Given Default (LGD) rates by adding conservative Margins of Conservatism (MoCs). Regulatory overrides based on uncertainty in PDs and LGDs appears to be double counting, therefore.
Capital formulae for tranched exposures depend on the default correlation of the underlying loans. As explained in earlier sections, the regulatory formula for post-securitisation capital is based on the SSFA. This is an ad hoc formula rather than an explicit solution from a rigorous capital model.
Within the multi-period version of the Pykhtin and Dev (2002) model developed by Duponcheele, Perraudin and Totouom-Tangho (2013a,b,c,d), as shown in Section 3, the parameter denoted ρ∗ determines the spreading of on-balance-sheet pool capital across the different tranches of a securitisation. This section employs the model risk surrounding this ρ∗ as the basis for calibrating the capital floor.
Agarwal and Perraudin (2024) estimate values for ρ (the correlation with a single common factor) and ρ∗ (conditional pool correlation) using a large dataset of individual securitisation pool loss rates by country and asset class. From this data, they estimate country-asset-class-specific default rate volatilities and average poolspecific default rate volatilities, again broken down by country and asset class. From these, they deduce ρ and ρ∗ values.
To calibrate a capital floor, one may calculate the total capital implied by the Pykhtin-Dev model for all the thin tranches that attach to the right of a multiple of pool capital which Agarwal-Perraudin denote K. The value of K may be deduced using the Basel IRBA capital formula for assumed values of the default probability and LGD and for the estimated value of ρ. The multiple of K beyond which they compute capital is γ ×K. They consider different possible values for the scalar γ including 1.0, 1.5 and 2.0.
Let K∗(ρ∗) denote the relation between total capital for tranches attaching beyond γ ×K, namely K∗, and ρ∗. ∗ denote the 95% From their estimation analysis, one may deduce the sampling distribution of ρ∗. Let ρ_{95}% quantile of this sampling distribution. The capital floor may be determined as shown in equation (5.1).

Capital floor = (5.1)

Agarwal and Perraudin estimate the capital requirement of thin tranches using the parameters for three different asset types, namely (i) Small and Medium Enterprises (SME), (ii) Low Risk Weight Residential Mortgages, and
(iii) Other Retail[18] using the parameters on European loan backed securitisation presented in Duponcheele et al. (2014a). They also perform calculations using data collected and analysed as part of Risk Control’s internal research for (i) SME, (ii) Residential Mortgage-Backed Securities, and (iii) Auto.
The capital K_{IRB} (Internal Ratings Based) required for the above risk parameters based on the Basel IRBA formula is estimated using Basel (CRE 31, BCBS (2020)). Agarwal and Perraudin estimate the capital floor using the risk parameters provided in Table 4.1, and for different γ values between 1.0 to 2.0 Table 4.2 shows implied capital floors for various γ values and asset classes. The capital floor is correlated with K_{IRB} in that, for lower K_{IRB}, we observe a lower capital floor.
Agarwal and Perraudin further observe that the average capital floor as a percentage of the K_{IRB} for the three asset classes is below 10% for γ of 1.5 and 2.0 using either the Risk Control Internal Research or the Calibration Data (see Table 4.3) parameter values. For SME loans with attachment point of 1.5 ×K_{IRB}, the capital floor is marginally above 10% but is reduced by half when γ is 2.0 (see Panel (b) of Table 4.3). Their findings suggest that for the asset cases we consider, a suitable floor is in the region of 10% of pool RWs.
Note that our analysis is based on results with granular pools. In the interests of conservatism, we suggest that higher values be set if the underlying pool is insufficiently granular or the attachment point is less than 1.5 times pool capital. Whether the factor of proportionality (here set at 10%) should be calibrated differently for STS and Non-STS becomes a question of regulatory judgement.
| Risk Control Internal Research | Calibration Data | |||||||||||||
|---|---|---|---|---|---|---|---|---|---|---|---|---|---|---|
| Asset Type | PD | ρ | ∗ ρ_{95}% | Basel ρ | PD | LGD | Basel ρ | |||||||
| SME | 1.59 | 15 | 20 | 17.41 | 0.94 | 45 | 19.50 | |||||||
| RMBS | 1.31 | 15 | 10 | 18.23 | 1.08 | 25 | 18.99 | |||||||
| Auto | 0.62 | 5 | 15 | 20.78 | 0.85 | 75 | 19.85 |
Note: All units are in percent. ‘Risk Control Internal Research’ calculations are based on data and simulations conducted as part of Risk Control market monitoring and model calibration activities. K_{IRB} denotes capital requirement based on Internal Ratings Based (IRB) approach. The parameters labelled ‘Calibration Data’ are based on Duponcheele et al. (2014a). Here PD denotes Probability of Default and LGD denotes Loss Given Default.
| Asset Type | γ x1.0 x1.5 x2.0 | K_{IRB} | ||||||
|---|---|---|---|---|---|---|---|---|
| SME | 1.98 | 0.94 | 0.42 | 7.06 | ||||
| RMBS | 0.58 | 0.16 | 0.04 | 3.65 | ||||
| Auto | 0.11 | 0.03 | 0.01 | 7.82 | ||||
| Average | 0.9 | 0.4 | 0.2 | |||||
| γ | ||||||||
| Asset Type | x1.0 | x1.5 | x2.0 K_{IRB} | |||||
| SME | 1.24 | 0.60 | 0.28 | 5.70 | ||||
| RMBS | 0.47 | 0.13 | 0.03 | 3.37 | ||||
| Auto | 0.15 | 0.04 | 0.01 | 9.08 | ||||
| Average | 0.6 | 0.3 | 0.1 |
Note: See the note to Table 4.1.
| Gamma | |||||||||||||
|---|---|---|---|---|---|---|---|---|---|---|---|---|---|
| Asset Type | x1.0 | x1.5 | x2.0 | K_{IRB} | |||||||||
| SME | 28.0 | 13.3 | 5.9 | 7.06 | |||||||||
| RMBS | 15.9 | 4.5 | 1.1 | 3.65 | |||||||||
| Auto | 1.3 | 0.3 | 0.1 | 7.82 | |||||||||
| Average | 15.1 | 6.1 | 2.4 | ||||||||||
| Gamma | |||||||||||||
| Asset Type | x1.0 | x1.5 | x2.0 K_{IRB} | ||||||||||
| SME | 21.8 | 10.6 | 4.9 | 5.70 | |||||||||
| RMBS | 13.9 | 3.9 | 0.9 | 3.37 | |||||||||
| Auto | 1.6 | 0.4 | 0.1 | 9.08 | |||||||||
| Average | 12.4 | 5.0 | 2.0 |
Note: See the note to Table 4.1.
5 – Conclusion
This paper set out how regulators could calibrate European securitisation capital charges for insurers and banks.
The calibration approaches employed are designed to be consistent with how regulators themselves have viewed risk in the context of past calibration exercises. Insurer capital charges are inferred from analysis of spread index time series using techniques like those we expect EIOPA would possibly employ in addressing these issues, while calibration of bank capital charges uses models closely related to those used in the design of the IRB Risk Weight formula that appears in Basel II and III rules.
In both cases, we show how these calibration techniques can be applied based on data and evidence. In this, we aim to persuade regulators to engage with evidence to make securitisation capital consistent with actual risk rather than adopting incremental adjustments to the current status quo.
The paper provides clear and analytically based suggestions for how regulatory capital charges for securitisation should be calibrated. By moving capital closer to actual risk, we believe appropriate use of securitisation will increase, boosting the funding that banks and insurers can provide to the European economy.
The specific suggestions in the paper may be summarised as follows:
• For Solvency II, the current calibration could be fixed easily if the calibration contained in Section 2 were adopted. The calibration is conservative and is backed by data, evidence and judgement. We recommend the following steps:
(i) Align Senior STS securitisation capital charges to those of Bonds & Loans.
(ii) Scale up Senior STS capital charges by a factor of 1.3 to obtain the charges for Senior Non- STS.
(iii) Scale up Senior capital charges by a factor of 1.5 to generate the charges for Non-Senior.
• For banks, the SEC-IRBA securitisation capital formula is beyond repair, and should be capped and floored. On the SEC-SA, the pool capital input to the formula should be scaled before it is introduced into the SSFA, with a scaling factor SF. We show the impact and benefit of introducing a scaling factor for different calibrations in Section 3.3, which provides a suitable starting point for the regulators to amend.
• For the Risk Weight Floor which primarily affects senior securitisation tranches, merely changing the value of the current floor (which is specified in absolute terms) will not revive the European securitisation market. We propose redesigning of the Risk Weight Floor to make it proportional to the risk of the underlying assets. Duponcheele et al. (2024a) provides a full discussion of this issue.
References
Agarwal, Swapnil and William Perraudin (2024) “Calibration of a Securitisation Capital Floor,” July. (Here)
Basel Committee on Banking Supervision (2012) “Revisions to the Basel Securitisation Framework,” December. (Here)
Basel Committee on Banking Supervision (2013) “Foundations of the Proposed Modified Supervisory Formula Approach,” January. (Here)
Basel Committee on Banking Supervision (2020) “Calculation of RWA for credit Risk,” March. CRE31 (Here) and CRE40 (Here)
Basel Committee on Banking Supervision (2023) “Securitisation: Internal ratings-based approach,” January. (Here)
Bohn, Jeffrey R. (2000) “An empirical assessment of a simple contingent-claims model for the valuation of risky debt.” (Here)
Committee of European Insurance and Occupational Pensions Supervisors (2010) “ CEIOPS Advice for Level 2 Implementing Measures on Solvency II: SCR Standard Formula Article 111b Calibration of Market Risk Module,” January, (also known as CEIOPS-DOC-66/10) (Here)
Draghi, Mario (2024) “The Future of European Competitiveness,” September. (Here)
Duponcheele, Georges, William Perraudin and Daniel Totouom-Tangho (2013a) “A Principles-Based Approach to Regulatory Capital for Securitisations,” BNP Paribas/Risk Control mimeo, April. (Here)
Duponcheele, Georges, William Perraudin and Daniel Totouom-Tangho (2013b) “The Simplified Arbitrage-Free Approach: Calculating Securitisation Capital based on Risk Weights Alone,” BNP Paribas/Risk Control mimeo, July. (Here)
Duponcheele, Georges, William Perraudin and Daniel Totouom-Tangho (2013c) “Maturity Effects in Securitisation Capital: Total Capital Levels and Dispersion Across Tranches,” BNP Paribas/Risk Control mimeo, September. (Here)
Duponcheele, Georges, William Perraudin, Alastair Pickett and Daniel Totouom-Tangho (2013d) “Granularity, Heterogeneity and Securitisation Capital,” BNP Paribas/Risk Control mimeo, September. (Here)
Duponcheele, Georges, Alexandre Linden, William Perraudin and Daniel Totouom-Tangho (2014a) “Calibration of the CMA and Regulatory Capital for Securitisations,” BNP Paribas/Risk Control mimeo, April. (Here)
Duponcheele, Georges, Alexandre Linden and William Perraudin (2014b) “How to Revive the European Securitisation Market: a Proposal for a European SSFA,” BNP Paribas/Risk Control mimeo, November. (Here)
Duponcheele, Georges and William Perraudin (2022a) “Impact of the SA Output Floor on the European Securitisation Market,” Research Report, AFME/Risk Control mimeo, November. (Here)
Duponcheele, Georges and William Perraudin (2022b) “Reviving Securitisation in Europe by Scaling Inputs to Capital Formulae,” Risk Control note, 22-113a, July. (Here)
Duponcheele, Georges, Marc Fayémi, Jérémy Hermant, William Perraudin and Frédéric Zana (2024a) “Rethinking the Securitisation Risk Weight Floor,” Report, May. (Here)
Duponcheele, Georges, Marc Fayémi, Fernando González Miranda, William Perraudin and Alessandro Tappi
(2024b) “European Competitiveness and Securitisation Regulations,” Report, August. (Here)
European Banking Authority (2022) “Joint Committee advice on the review of the securitisation prudential framework (Banking),” Joint Committee of the European Supervisory Authorities, December. (Here: JC 2022 66)
European Central Bank (2024) “Statement by the ECB Governing Council on advancing the Capital Markets Union”, European Central Bank, March 7. (Here)
European Commission (2015) “Commission Delegated Regulation (EU) 2015/35 of 10 October 2014 supplementing Directive 2009/138/EC of the European Parliament and of the Council on the taking-up and pursuit of the business of Insurance and Reinsurance (Solvency II),” January. Aka the “2015 Solvency II Delegated Act”. (Here)
European Commission (2018) “Commission Delegated Regulation (EU) 2018/2011 of 1 June 2018 amending Delegated Regulation (EU) 2015/35 as regards the calculation of regulatory capital requirements for securitisations and simple, transparent and standardised securitisations held by insurance and reinsurance undertakings”, June, (also known as EC/2018/2011). Aka the “2018 Solvency II Delegated Act”. (Here)
European Commission (2024) “Targeted consultation on the functioning of the EU Securitisation framework,” Directorate-General for Financial Stability, Financial Services and Capital Markets Union, October. (Here)
European Insurance and Occupational Pensions Authority (2013) “Technical Report on Standard Formula Design and Calibration for Certain Long-Term Investments,” December, (also known as EIOPA/13/513). (Here)
European Insurance and Occupational Pensions Authority (2014) “Technical Specification for the Preparatory Phase (Part I),” April, (also known as EIOPA-14/209). (Here)
European Parliament and Council (2013) “Regulation (EU) No 575/2013 of the European Parliament and of the Council of 26 June 2013 on prudential requirements for credit institutions and amending Regulation (EU) No 648/2012,” June. Aka the “2013 Capital Requirements Regulation – CRR”. (Here)
Kutas, Jozsef, William Perraudin and Yixin Qiu (2016) “Solvency II Capital Calibration for Securitisations,” Risk Control Limited, 7 July. (Here)
Letta, Enrico (2024) “Much More than a Market,” Proposals for a Savings and Investments Union, Report, April. (Here)
Noyer, Christian (2024) “Developing European Capital Markets to Finance the Future,” April. (Here)
Paris Europlace (2024) “How can securitisation contribute to the financing of the EU agenda? Concrete, targeted, proportionate, and prudent recommendations to accelerate the scale-up of the EU securitisation market, in line with recent policy statements,” Report, September. (Here)
Peretyatkin, Vladislav and William Perraudin (2004) “Capital for Structured Products,” Risk Control Limited
Perraudin, William and Yixin Qiu (2022) “ABS and Covered Bond Risk and Solvency II Capital Charges,” Risk Control, Research Note Number 21-161a, February. (Here)
Pykhtin, Michael and Ashish Dev (2002) “Credit Risk in Asset Securitisations: Analytical Model,” Risk, 15(5), S16-S20, May
Appendix 1: bank capital legislative text
A1.1 The generic form for the Simplified Supervisory Formula
Main risk factor:
• K_{pool}: capital requirement of the pool Main parameters:
• K_{1250}%: 1250% risk weight threshold
• The p-factor Tranche description:
• A is the attachment point of a thick tranche
• D is the detachment point of a thick tranche Other technical elements for the exponential smoothing function:
• The smoothing starts at K_{1250}%, thus, the lower boundary: l = max (0, A −K_{1250}%)
• The upper boundary for a tranche is, thus, u = max (0, D −K_{1250}%)
• The exponential smoothing coefficient ‘a’ is defined with the parameter ‘p’, also called the p-factor:
−1 a =
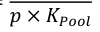
The exponential smoothing function K_{SSFA} is given by:
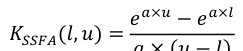
a ×(u−l)
Define RW_{T,SSFA}(A, D) to be the risk weight of the tranche as per the allocation function. Follow the three steps:


impacts mainly senior tranches (currently a fixed value but should be proportional to K_{Pool}.
Table A1.1: Generic Calibration for the p-factor (Basel 2013) SEC-SA (Standardised approach) SEC-IRBA p = 1.0 • Pool IRB regulatory framework (wholesale, retail)
• N: granularity
• LGD_{Pool}: weighted average loss-given default of the pool
• K_{IRB}: IRB capital requirement of the pool, including expected losses
• M_T: maturity of the tranche (this is definitely not a risk factor the risk factor is the pool maturity M_{Pool})
• Seniority of the tranche
K_{IRB} is used twice in SEC-IRBA, in the definition of the SSFA smoothing function, and in the p-factor. Thus there is a sensitivity to the K_{IRB}-squared.
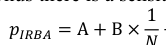
N + C × K_{IRB} + D ×LGD+ E × M_T
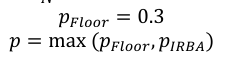
Table A1.2: Definition of the pool capital K_{pool} used as an input to the smoothing function SEC-SA (Standardised approach) SEC-IRBA Calibration: K_{IRB}: IRB capital requirement of the pool, including
• w: proportion of delinquent assets in the pool expected losses Pool capital requirement as input to the formula
• 625%: risk weight of the delinquent assets in

K_D = 8% × 625% = 0.5: capital requirement of the delinquent assets in the pool RW_{pool,SA}: SA risk weight of the non-delinquent assets in the pool K_{SA} = 8% × RW_{pool,SA}: capital requirement of the non-delinquent assets in the pool. Blended pool capital requirement:

Pool capital requirement as input to the formula
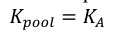
Table A1.3: Differentiation between STS and Non-STS SEC-SA SEC-IRBA For Non-STS For Non-STS The 1250% capital requirement threshold The 1250% capital requirement threshold

The exponential smoothing coefficient parameter The exponential smoothing coefficient parameter −1 −1 a = a =

For STS For STS The 1250% capital requirement threshold The 1250% capital requirement threshold

The exponential smoothing coefficient parameter The exponential smoothing coefficient parameter −1 −1 a = a =

Table A1.4: Proposal: Scaling Factor SF applied to K_{Pool} in SEC-SA Pool capital requirement as input to the formula

For Non-STS: SF_{Non−STS} = 0.65 and p = 1.0 The 1250% capital requirement threshold:

The exponential smoothing coefficient parameter −1 −1 a = =

Using Basel 2016 calibration Using Basel 2013 calibration For STS: SF_{STS} = 0.767 and p =0. 5 For STS: SF_{STS} = 0.575 and p =1. 0 The 1250% capital requirement threshold The 1250% capital requirement threshold

The exponential smoothing coefficient parameter The exponential smoothing coefficient parameter −1 −1 −1 −1 a = = a = =

Notes
[1] Dr. Georges Duponcheele is a Senior Credit Portfolio Manager at Great Lakes Insurance SE (part of Munich RE) and teaches the Securitisation module for the Executive Master in Asset Management from University Paris-Dauphine PSL and Ensae Paris in partnership with Lefebvre Dalloz. Dr. William Perraudin is the Managing Director of Risk Control Limited, a specialist analytics firm advising public financial institutions on risk management and valuation issues. Both authors may be contacted via LinkedIn. We accept full responsibility for any errors or omissions. The views expressed are the authors’ own and not necessarily those of their firms or of those with whom the authors had discussed this study or their firms.
[2] Covered Bonds (CBs), while valuable in times of bank funding shortages, are no substitute for securitisation when the scarce commodity is risk capacity. The loan pool covered by a CB remains on the issuing bank’s balance sheet so no additional capacity to make new loans is generated. Thus, a CB is a funding instrument whereas securitisation is a financing instrument.
[3] Our recommendations on the organisation of how Europe should organise regulatory decision-making are set out in the paper “European Competitiveness and Securitisation Regulations” (Duponcheele et al. (2024b)).
[6] The capital stresses in Solvency II are constructed as per year of modified duration. To obtain VaRs that are commensurate with this approach, we construct indices in which returns on individual securities are divided by modified duration and then combined to form a composite return. This approach is equivalent to considering the return on a portfolio in which the weights are proportional to the inverse of duration.
[7] A given tranche may be considered a portfolio of marginally thin tranches. Such a thin tranche may attach at A and detach at A +δ for small δ. The capital for such a thin tranche for A >K_A is then: dK_{SSFA}(A, D) lim ቤ ×δ=exp൬− 1 _δ→_0 dD _{D=A+δ} p (A/K_A − 1)൰
[8] This would equal p K_A if the integral was up to an infinite upper bound. Since the integral is to unity, the relation is approximate.
[9] BCBS (2013) calculates the p-factor for IRBA banks based on the function p_{IRBA} that is floored at p_{Floor} = 0.3, Here, N is effective number of loans, K_{IRB} is the pool capital charge under the IRB Approach, LGD is the Loss Given Default rate of the underlying pool, M_T is the maturity of the tranche, and parameters A, B, C, D, and E are provided differently based on three categories (i) exposure type (retail or wholesale), (ii) seniority and (iii) granularity (only applicable to wholesale exposure type). The look-up table is provided in BCBS (2023) Table 1. p_{IRBA} = A + B N + (C×K_{IRB})+ (D×LGD)+(E×M_T) p =max[p_{Floor}, p_{IRBA}]
[10] The regulatory securitisation models adopted under Basel III derive mainly from regulatory research performed in the US. While the models have been published and subject to academic scrutiny, the research that led to the Basel III calibration has never been published. For the label ‘Simple, Transparent and Standardised’ (STS), under the leadership of the ECB and the Bank of England, the European authorities slashed by a factor of 2 the output of an unpublished calibration, and this was later adopted by the BCBS for the label ‘Simple, Transparent and Comparable’ (STC).
[11] In this case, there is no Basel equivalence. As this is a post-Brexit implementation change by the EU, this measure was not adopted in the UK rules.
[12] This parameter could be set through calibration using the fact that expected losses implicit in bond market spreads represent expected losses plus a risk premium. In a similar fashion, BCBS (2013) bases a calibration of a risk premium parameter used in the MSFA on a study by Bohn (2000).
[13] A similar adjustment was made by European authorities in the past for SMEs. The 0.7619 Supporting Factor for European SMEs is equal to the ratio of 8% (Basel II capital ratio) to 10.5% (Basel III capital ratio). When this Supporting Factor is applied to the capital requirement, it neutralises the Basel III capital increase for SMEs.
[14] See Duponcheele et al. (2024a). The paper was written with the participation of the Paris Europlace Securitisation Committee Experts Group on Prudential Regulation.
[15] See Duponcheele and Perraudin (2022a), Table 10.3
[16] Ideally, a floor for securitisation should be designed as an add-on to a formula, but this is a minor issue compared to the fact that the market will not revive in Europe, unless the RW floor is made to be commensurate with risk i.e., a fraction of the underlying pool risk weight. And a factor of proportionality of the order of 10% is an appropriate level of calibration.
[17] The calibration of this level may be arrived at in different ways. With operational risk (Duponcheele et al. (2024a) and with correlation risk (Agarwal and Perraudin (2024)). This paper reproduces the methodology and results from the latter study.
[18] The other retail in this study is considered as auto loans.