

1. Introduction
This document provides comments on BCBS 307 which describes the Basel Committee’s proposals for a revised credit risk Standardised Approach (SA). Under the revised SA, the risk weights for exposures to banks, corporates and commercial and residential mortgages depend on risk indicators. Agency ratings which, when available, are the basis for corporate- and bank-exposure risk weights in the current SA would instead depend on these risk indicators.
While we see arguments in favour of reducing reliance on agency ratings in regulations and in increasing the risk sensitivity of the SA for exposures that are not rated, we are dubious that the proposed calibration, as it currently stands, represents a significant improvement on the current SA. We plan to investigate these issues of calibration in coming months but, in the meantime, we here provide some general comments and illustrative benchmarking exercises that underline contentious aspects of the current proposals.
2. Example analysis of bank risk weights
Since most large banks are rated, agency ratings play a dominant role in the determination of risk weights for exposures to banks in the current SA. Eliminating the role of ratings is a big step entailing major practical issues and problems acknowledged in BCBS 307, in particular the availability of CET1 ratios for banks from jurisdictions that are not Basel II compliant. We are somewhat unconvinced that the calibration briefly sketched in BCBS 307 is a dependable basis for exposures to banks.
We do not understand how the authorities could have obtained enough bank default observations to perform the type of statistical analysis briefly described unless the calibration employed data on small banks, the behaviour of which is unlikely to be representative for large internationally active banks. In general, we think that the Basel Committee should be more transparent in its calibrations, explaining in a much more precise way how it has arrived at risk weight sensitivities. BCBS 307 claims that the indicators it proposes perform better in predicting default by banks than ratings. This is a surprising claim and more details of the exercise that the authorities have performed would be welcome.
In general, we find it troubling that the ranking of capital for bank exposures implied by ratings under the current SA does not at all accord with that implied by the revised credit risk SA.
To illustrate this, we collected a data set for a set of 87 banks for which agency ratings and the two relevant revised SA risk indicators (the Common Equity Tier 1 ratio (CET1) and the Net Non-Performing Asset ratio (NNPA)) are available. We then calculated the capital implied the current and revised SA. Table 1 shows the risk weight banks for banks of different ratings under the current SA and the risk weights corresponding to risk indicator bands employed in the revised SA. Table 2 shows the implied risk weights under the two approaches.
Each cell in Table 2 shows the number of banks for which the risk weights take particular values under the current SA (shown by the row label) and under the revised SA (shown by the column label).
As one may observe from the table, exposures to lowly rated banks (that have 100% risk weights in the existing SA) have much lower risk weights under the revised SA, with their revised SA risk weights averaging 60%. Highly rated bank exposures which have 20% risk weights under the existing SA have average risk weights under the proposed new SA averaging 50%.
Conversely, the average risk weights implied by the current SA for banks in the risk weight bands employed in the revised SA, are not even monotonic in the revised SA band risk weights. (As one may see by reading down the right hand column of the table.)
These calculations do not demonstrate that the revised SA risk weights are inappropriate. But it is troubling that they are so inconsistent with those implied by agency ratings within the existing SA.
| Current | SA | (Option 1) | |||||
|---|---|---|---|---|---|---|---|
| BBB+ to | Cs and | ||||||
| AAA | to AA- | A+ | to A- | BBB- | BB+ to B- | Default | |
| 20% | 50% | 100% | 100% | 150% | |||
| Revised | SA | ||||||
| CET1 | |||||||
| ratio | 12%>CET1 | 9.5>CET1 | 7%>CET1 | 5.5>CET1 | CET1 | ||
| >=12% | ratio>=9.5% | ratio>=7% | ratio>=5.5% | ratio>=4.5% | ratio<4.5% | ||
| Net NPA | |||||||
| ratio<=1% | 30% | 40% | 60% | 80% | 100% | 300% | |
| 1% < | Net | ||||||
| NPA | ratio | ||||||
| <=3% | 45% | 60% | 80% | 100% | 120% | 300% | |
| Net NPA | |||||||
| ratio | >3% | 60% | 60% | 100% | 120% | 140% | 300% |
| Risk | ||||
|---|---|---|---|---|
| weights | 20% | 50% | 100% | Averages |
| 30% | 4 | 4 | 2 | 48% |
| 40% | 1 | 11 | 4 | 61% |
| 45% | 1 | 4 | 7 | 77% |
| 60% | 4 | 19 | 19 | 70% |
| 80% | 0 | 5 | 0 | 50% |
| 100% | 1 | 0 | 0 | 20% |
| 300% | 0 | 0 | 1 | 100% |
| Averages | 50% | 53% | 60% |
3. Comments on the corporate risk weight calibration
On capital for corporate exposures, our preliminary analyses suggest that the allocation of capital will also be substantially affected by the employment of risk indicators rather than ratings (where available) as the basis for capital. The proposed indicators for the revised corporate credit risk SA consist of revenue and leverage (defined as assets divided by common equity).
Table 3 shows the risk weight lookup table from BCBS 307 and the current ratings-specific risk weights. As may be observed, the revised SA risk weights vary from 300 for low revenue, highly levered firms to 60 for high revenue, unlevered firms.
We have not yet been able to analyse the appropriateness of the risk weights assigned to the different risk indicator buckets in BCBS 307. However, our understanding from analysis we have performed is that the new lookup tables are highly conservative compared to the existing SA risk weights at least for European corporate exposures with which we are most familiar.
Again, regrettably, BCBS 307 does no more that briefly sketch the approach to calibration that has been used in determining the revised SA corporate risk weights. Following the recent major crisis in which the credit performance of corporate exposures was notably good in many countries, it seems very surprising that the Basel Committee is significantly increasing rsk weights on corporate exposure. We wonder whether this is really intended or a consequence of preliminary and incomplete calibration exercise.
Another issue that we believe requires detailed exploration is whether a calibration that distinguishes neither between sector nor between jurisdiction is really sensible when risk indicators such as accounting ratios are employed as the basis for capital calculations.
In particular, leverage levels vary substantially across sectors in ways that tend to be negatively correlated with the inherent risk of the economic activities in those sectors. While higher leverage within a given sector might reliably signal higher risk, ignoring the context of the sector within which counterparties operate is a major implicit assumption.
| AAA to | AA- A+ to A- | BBB+ to BB- | Below BB- | Unrated | |
|---|---|---|---|---|---|
| 20% 50% | 100% | 150% | 100% | ||
| Revised SA | |||||
| Euros | 5mn < Euros | 50mn < | |||
| Revenue | <= Revenue | <= Revenue | <= Revenue | > | |
| Euros | 5mn Euros | 50mn Euros | 1bn Euros | 1bn | |
| Leverage | 1x - 3x | 100% | 90% | 80% | 60% |
| Leverage | 3x - 5x | 110% | 100% | 90% | 70% |
| Leverage > | 5x | 130% | 120% | 110% | 90% |
| Assets > | Liabilities | 300% | 300% | 300% | 300% |
4. Comments on the residential mortgage risk weight calibration
Lastly, we turn to the calibration or risk weights for residential mortgage exposures. Again, we intend to perform additional analysis but for the moment we can do no more than highlight issues on the basis of illustrative calculations.
The capital indicators that BCBS 307 proposes for residential mortgages are Loan to Value (LTV) and Debt Service Coverage (DSC) ratios. Table 4 shows the proposed indicator-dependent risk weight table suggested by the Basel authorities. One may be concerned that the calibration of this lookup table is inappropriate for particular markets. Variation in the inherent riskiness of mortgage markets across jurisdictions is great. Those markets operate with varying LTV and DSC ratios again as an endogenous reaction to the differing levels of risk in those markets so a calibration based on data from a single country is wholly inappropriate.
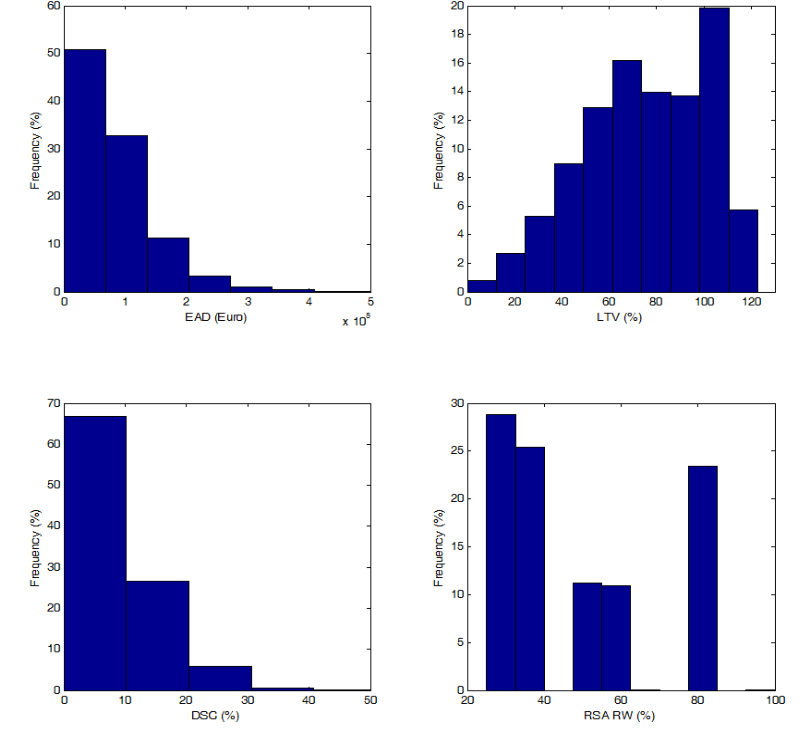
To illustrate, Figure 1 shows the EAD, LTV and DSC for a portfolio of high credit quality Dutch residential mortgages issued by a particular bank. The historical performance of the mortgages is exceptionally good in that, while the average origination date is September 2003, the cumulative default percentage is about 0.5%. The lower left hand histogram in Figure 1 shows relatively low DSC ratios with most mortgages having ratios of less than 20%. However, the LTVs are high (see the upper right hand histogram) with a significant fraction exhibiting ratios exceeding 100%. The lower right histogram in Figure 1 shows the frequency distribution of revised SA capital with about a quarter having high 80% risk weights.
We believe that a thorough and transparent statistical analysis of how mortgage exposures vary in performance across countries should be performed before final decisions are made on appropriate risk weights. Given that indicators of the type proposed by BCBS 307 vary substantially across markets, we believe that the authorities should consider the possibility of country specific calibrations.
| < 60% <= LTV | < 80% <= LTV | < 90% <= LTV | < |
|---|---|---|---|
| 80% | 90% | 100% | |
| 30% | 40% | 50% | 60% |
| 40% | 50% | 70% | 80% |
5. References
Basel Committee on Banking Supervision (2014) “Revisions to the Standardised Approach for Credit Risk,” Basel
Committee on Banking Consultative Document, December (also known as BCBS 307).
6. Contact
William Perraudin, Director
Tel: +44 (0)203 307 0731
Mob: +44 (0)7968 328459 Email: william.perraudin@riskcontrollimited.com
Risk Control Limited 13-14 Dean Street London W1D 3RS +44 (0)203 307 0730 www.riskcontrollimited.com