

This report analyses obstacles to the expansion of securitisation by Multilateral Development Banks (MDBs) that originate from within the banks themselves. The obstacles examined include: 1. The lack of transparent criteria that MDBs use in determining whether to engage in risk transfer including securitisation; 2. The organisation that needs to be put in place to boost MDB risk transfer activity; 3. The nature of MDB assets which many view as having relatively narrow spreads and non-standard features. After discussing these obstacles, the report demonstrates the benefits of MDB securitisation by showing how risk transfers can relax the constraints on the long-term corporate plans of a representative MDB balance sheet.
Key findings
- To adopt transparent measures of the costs and benefits of securitisation-based risk transfer.
- To reorganise internal operations to facilitate the Originate-To-Share business model.
- To close the gap between market perceptions of MDB loans and the reality.
- To include securitisation programs in corporate planning projections.
Executive Summary
This report analyses obstacles to the expansion of securitisation by Multilateral Development Banks (MDBs) that originate from within the banks themselves. The obstacles examined include:
1. The lack of transparent criteria that MDBs use in determining whether to engage in risk transfer including securitisation
2. The organisation that needs to be put in place to boost MDB risk transfer activity
3. The nature of MDB assets which many view as having relatively narrow spreads and non-standard features. After discussing these obstacles, the report demonstrates the benefits of MDB securitisation by showing how risk transfers can relax the constraints on the long-term corporate plans of a representative MDB balance sheet.
MDBs face calls to boost development in their borrower countries by expanding their lending (see Lankes and Prizzon (2023), World Bank Group (2023), (2024) and (2025), and G20 (2024a)). MDB balance sheets are constrained by the need to maintain the high ratings which give them access to cheap bond market financing (see G20 (2024b)). Fiscal stringency in MDB shareholder countries reduces the likelihood of large-scale general capital increases. So, credit risk transfer is becoming an increasingly important tool for MDBs seeking to increase their lending when further shareholder capital is constrained. It sits alongside other measures, including guarantees, portfolio sales, hybrid capital, retained earnings and shareholder capital, but offers the greatest potential for scale.
Credit risk transfer takes different forms, including traditional credit insurance, shareholder guarantees and securitisation. The last of these is the most scalable as it taps the risk capacity of extremely deep capital markets while matching investor risk appetite through the tranching mechanism (see Gonzalez and Morar Triandafil (2023), European Systemic Risk Board (2025) and Osberghaus and Schepens (2026)). Tranching splits credit risk on a pool of loans into different seniorities (senior, mezzanine and junior). Investors with varying level of risk appetites and expertise in the underlying loans can choose the exposure that suits them.
MDBs were encouraged by the G20 Toronto final statement to explore where they could use securitisation to create more lending headroom, though the G20 limited this recommendation to securitisation of Non- Sovereign Obligor (NSO) loans. The Independent CAF Panel Report of 2022 recommended that MDBs employ innovative financing and risk transfer instruments, including both NSO and Sovereign Obligor (SO) loan securitisation. Galizia, Perraudin, Powell and Turner (2021) considered the scope for MDBs to engage in risk transfer and discuss the obstacles and potential.
Responding to shareholder encouragement, as well as their own senior management determination, MDBs have begun what now appears to an accelerating set of securitisation programs. Up to now, ten MDB securitisations have been issued. The first of these was the pioneering Room2Run (R2R) (see Risk Control (2019)) deal by the African Development Bank (AfDB) in 2018. Several years passed before R2R was replicated but now the pace of issuance has quickened with five MDBs (including AfDB) now having issued securitisations and several reportedly planning regular issuance (see, for example, IDB Invest (2023), (2024a), (2024b) and (2024c)).
The main obstacles to further development in this market are (a) awareness among investors of the new emerging market, (b) the perceptions of MDB loan credit quality by rating agencies and how this perception is represented in the agencies’ structured finance rating methodologies, (c) constraints and issues in the internal organisation of MDBs themselves. (a) and (b) are examined, respectively, by the two companion studies, Risk Control (2026c) and (2026d), while the current report analyses (c).
The main recommendations of this report are:
• MDBs should consider adopting Risk Adjusted Return on Capital (RAROC) criteria for assessing the economic value added of risk transfers. RAROC criteria guide commercial banks in Balance Sheet Optimisation, clarifying and facilitating BSO decision-making. In this, MDBs should identify target Returns on Equity (RoE) consistent with their long-term financial plans.
• MDBs should organise their business activities to facilitate the distribution of loans and develop loan origination that will serve as an input to securitisation programs. This includes the organisation of high-quality internal loan data, contract standardisation and the creation of a Portfolio Management Unit for dealing with structuring and placement.
• MDBs should ensure non-concessional lending is exactly that and then work to persuade investors and rating agencies that the loan pricing is in line with prospective credit performance.
• MDBs should explicitly introduce securitisation programs into their corporate planning to make transparent the contribution the transactions make to lending headroom and capital accumulation, permitting future growth in lending with less reliance on general capital increases.
Two companion reports, Risk Control (2026c) and (2026d), analyse market views on MDB securitisation and obstacles to MDB securitisation attributable to investor and rating agency views of MDB loan credit quality.
1. Introduction
This report is an output of a project on ‘Multilateral Development Bank (MDB) Balance Sheet Re-cycling’ by Risk Control for the MOBILIST program of United Kingdom’s Foreign, Commonwealth and Development Office (FCDO) and the Swiss government’s State Secretariat for Economic Affairs (SECO)[1]. The same Risk Control team that worked on this report also produced two companion reports which
(a) Examine market awareness of MDB securitisation presenting the findings of a survey of market participants, interviews and market sentiment analysis (see Risk Control (2026c)).
(b) Look at the implications for MDB securitisation of rating agency views of MDB loan credit quality (see Risk Control (2026d)).
The report, aimed at senior decision-makers within MDBs and representatives of their shareholders among MDB Executive Directors and Governors,
(i) Examines internal challenges that MDBs face in expanding their use of securitisation, and
(ii) Shows, through multi-year balance sheet projections, how programmatic securitisation issues can relax constraints from rating agency criteria on MDBs and permit higher Returns on Equity (RoE).[2]
What are the internal challenges to MDBs that limit their use of securitisation?
1.1 The objectives of MDB securitisation may be ill-defined
In contrast, commercial banks employ transparent approaches to determining whether a given risk transfer operation (such as a securitisation) increases the Economic Value of the institution. Such approaches build on Risk Adjusted Return on Capital (RAROC) techniques that are also used by commercial banks in pricing loans.
Most MDBs that make loans to Non-Sovereign Obligors (NSO) borrowers employ RAROC techniques for pricing but they do not generally use them (there is one exception of which we are aware) as the basis for decisions on risk transfer or Balance Sheet Optimisation (as is done by commercial banks). MDBs performing risk transfer have instead used a less transparent measure of efficiency commonly referred to as a Benefit to Cost (BTC) ratio.
This BTC measure, equal to the percentage of Risk Weighted Assets saved through the transaction to the percentage of spread income given up, provides an ordinal ranking of transactions but does not show whether a given deal contributes positively to Economic Value (except in a special case that we discuss in Appendix 1).
We advocate the more direct application of RAROC principles in the financial management of MDBs, including in their risk transfer activities. This would reveal the Economic Value created by securitisations and, hence, make the use of this technique at an appropriate scale more widely accepted in development finance circles.
As well as economic benefits, MDBs view securitisation as an innovative approach to boosting mobilisation (see Gregory (2023)). By mobilisation, MDBs mean the volume of financing that their activities elicit from other lenders or investors including other Development Finance Institutions (DFIs) and, more importantly, private sector organisations. MDBs collect statistics on their success in generating mobilisation and regard it as an important part of their development impact and, hence, key to satisfying their central mandate (see MDB Task Force on Mobilization (2026b)).
Securitisation offers additional mobilisation potential because it permits investors with different risk appetites to supply financing at different seniority levels. In this, it is more flexible than syndication by MDBs which allows investors possibilities of taking exposure pari passu with the MDB. Especially, when low-income countries are concerned, persuading advanced economy investors t0 participate on a pari passu basis is difficult.
As is true of the Economic Value created by securitisation, MDBs currently lack the tools to measure the mobilisation benefits of securitisation. A working group of MDBs has worked on criteria and methods for
MDB securitisation to contribute to standardised mobilisation statistics that MDBs collectively compute. But the approaches currently proposed appear opaque and hard to apply consistently across institutions.
1.2 Practical and organisational steps for supporting programmatic securitisation
Adopting a business model requires practical and organisational steps that facilitate and coordinate the new activities involved. Public banks like MDBs that have followed a Hold-To-Maturity lending must adopt significant changes if they wish to engage in an Originate-to-Share (OTS) approach. These steps include:
• The creation of a central Treasury function (labelled a Portfolio Management Unit) that can organise and implement securitisation transactions with limited reliance on costly, external investment bank advice, has expertise in the supranational and Structured Finance ratings that strongly influence the success or otherwise of transactions and can build relationships with potential investors.
• The implementation of steps to collect and clean historical data, and to modify and standardise loan products and legal documentation.
• The reconsideration and expansion of origination programs to generate higher volumes of lending and, possibly, to emphasise loan products that are suitable for programmatic securitisation.
1.3 The narrow spreads at which MDBs lend
MDBs view their own narrow spreads as an impediment to securitising their loans as the resources available to meet the costs of credit protection are relatively low. If MDB loan spreads (over reference rates) were actuarially fair, remunerating the MDB for its own funding cost, overheads, Expected Loss (EL), and Unexpected Loss (UL) (i.e., risk), then narrow spreads would not be an impediment to securitisation as long as investors, credit protection providers and the rating agencies could be convinced of the quality of MDB loans. So, this third challenge may be reduced to two issues:
(i) Are MDB loans concessional, i.e., ‘priced below market’?
(ii) If the answer is ‘no’, can market participants be persuaded that this is true?
MDBs certainly aim not to undercut private sector lenders but the nature of their businesses with low recorded RoE and no requirement to pay dividends creates some lack of transparency on these points. Risk Control (2024c) examines the fair pricing of MDB sovereign loans, concluding that the spreads charged although low, are actuarially fair, because of the strong effects of Preferred Creditor Treatment (PCT). The pricing of MDB Non-Sovereign Obligor (NSO) loans has not been systematically investigated statistically as far as we are aware but MDBs commonly patriciate in syndicated lending with private sector lenders. Some capital market investors remain to be convinced that MDB loans are fairly priced despite the best efforts of MDBs and the GEMs consortium through which MDBs have collectively compiled data and published reports on the historical credit performance of MDB loans.
Having discussed these obstacles and how they may be addressed, we turn to analysis of the benefits for MDBs of programmatic securitisation. We do this by showing for a representative MDB balance sheet how long-term corporate plans may be enhanced with expanded lending and higher RoE if a program of securitisation is introduced. Demonstrating this exemplifies our fourth recommendation: that MDBs explicitly include securitisation programs within their corporate planning exercises.
The rest of this report is organised as follows. Sections 2, 3 and 4 discusses internal MDB obstacles to securitisation, namely the lack of clarity of objectives (Section 2), the need to re-organise to support an Originate to Share business model (Section 3) and the challenges created by narrow loan spreads (Section 4). Section 5 shows how a program of securitisation may be integrated in corporate planning, creating transparency for management and Boards of Directors in deciding how to use securitisation tools to manage MDB balance sheets.
2. Clarity of Objectives
MDBs have two different high-level objectives when they implement securitisations. First, such transactions generate direct economic gains to the MDB itself and, second, as we shall discuss below, they mobilise financing from other financial institutions, especially from the private sector.
The economic gains that MDBs may obtain from engaging in securitisation include multiple ‘goods’, such as releasing lending capacity, generating funding, reducing leverage, lowering portfolio concentration and boosting Returns on Equity (RoE). These would probably all be viewed individually as benefits by MDB senior management and Boards of Directors. But it is helpful for those running MDBs to have a single, unified way of evaluating if they should engage in risk transfers in general and securitisations in particular and, if so, on what scale?
In this regard, it is instructive to examine how commercial banks evaluate risk transfers. For such banks, as purely commercial organisations, risk transfers are viewed favourably only if the transaction adds Economic Value. In principle, if a bank is quoted on a stock exchange, the Economic Value associated with any policy action may be measured as the change in the bank’s equity market value that results.
For day-to-day operations, how an action affects the bank’s market capitalisation is not directly observable, however. So, banks have instituted internal systems to mimic such an evaluation, in the form of Risk Adjusted Return on Capital (RAROC) systems. These compute the net monetary return from a transaction adjusted for the cost of (expensive) equity financing that has been saved.
Many MDBs employ RAROC approaches for the specific purpose of pricing Non-Sovereign Obligor (NSO) loans. However, it is less common for MDBs to use RAROC in evaluating Balance Sheet Optimisation activities, such as securitisation. Instead, MDBs have employed efficiency measures, such as the Benefit to Cost (BTC) ratio analysed below, which consists of the percentage reduction in Risk Weighted Assets (RWAs) divided by the percentage of loan spread income given up.
BTC measures have the advantage that they avoid specifying what is the cost of equity financing. While MDBs obviously monitor their realised RoE, they rarely employ enterprise-wide RoE targets. As public bodies with a focus on the development of borrower countries, maximising equity returns may be frowned upon.
We show in Appendix 1 that, under certain assumptions, selecting risk transfer deals that imply BTC ratios that exceed a given threshold is equivalent to choosing transactions that have a positive RAROC. So, one might argue that BTC ratios are all one needs to assess the Economic Value of a risk transfer deal. But the assumptions necessary for this equivalence may be questioned and, in any case, being clear about target equity returns is part of stewarding appropriately the balance sheet of a financial institution.
Earning a RoE and making it central to decisions on risk transfer should not be embarrassing to MDBs especially in this period of relative scarcity in donor provision of General Capital Increases and grants for MDB concessional activities (to pay for zero interest rate loans and grants). MDBs should be explicit about what RoE they aim for and how this will contribute over time to a growing Total Equity (supporting a larger volume of lending) or to grants to borrower countries.
The second high-level objective for MDBs engaging in securitisation is mobilisation. Mobilisation is important for MDBs because it serves to magnify the development impact of their own operations (see Attridge and Svenstrup (2026)). More generally, it is clear that the scale of financing necessary to achieve such development objectives as the United Nations 2030 Sustainable Development Goals (SDGs) (see United Nations (2015)) or the financing required for EMDEs responding to climate change (see Falduto, Jachnik and Noels (2024)), greatly exceed what multilateral or bilateral Development Finance Institutions (DFIs) could supply.
Two influential approaches to measuring mobilisation by DFIs have been developed. The first (see World Bank (2018)), known as ‘the MDB approach’, has been devised by a group of MDBs and European DFIs. The second, proposed by the OECD, is described in OECD (2020), with recent data in OECD (2025) and (2026). While the two methodologies have similarities, the MDB approach separately measures ‘direct mobilisation’ in which a DFI has played an active role and ‘indirect mobilisation’ in which no DFI played an active and direct role.[3][4]
An independent organisation, Publish What You Fund, has proposed (see PWYF (2024)) that mobilisation measures should include
(a) balance sheet optimisation (such as purchases by private sector investors of DFI liabilities) and
(b) private capital mobilisation (meaning DFI disposals of existing assets to private sector investors).
Mobilisation, as currently measured by MDBs, totals up the principal value of co-financing provided by other organisations without regard to the riskiness of the exposure that these other organisations take on. No difference is made between a case in which, say a private sector investor takes a very senior position that has minimal risk and another in which the investor’s exposure is to a risky equity investment.
This failure to distinguish exposures has obvious drawbacks when it comes to securitisations since tranching permits securitisation sponsors to create zero-risk investments starting from risky loan pools. If the low-risk senior tranches are held by external investors, one might question whether the mobilisation has really occurred. On the other hand, if senior tranches are retained by the sponsor (as is typical in synthetic securitisations) and some combination of mezzanine and junior tranches are distributed to private sector investors, one might argue that mobilisation measures that record the par value of those mezzanine and junior tranches only, underestimating the true amount of mobilisation.
Recently, the DFIs behind the ‘MDB approach’ have taken up the challenge of reflecting balance sheet optimisation and private capital mobilisation in recorded mobilisation statistics. A recent guide (see MDB Task Force on Mobilization (2026a)) has been prepared, setting out some proposals that include a distinction between mobilisation and ‘generation’, the latter being a category in which private sector investment into MDB liabilities, such as hybrid capital, would be included.
The proposals for including securitisations by MDBs in mobilisation measures reportedly lack detail on the one hand while introducing significant new dimensions such as Risk Weighted Assets, on the other, with little explanation or justification. (Current mobilisation measures revolve around notional value and do not risk weight different types of financing.)
Where the primary objective is risk transfer and the transaction is assessed mainly through the capital benefit achieved relative to the loss of spread income, a synthetic securitisation may be more suitable. The underlying loans remain on the MDB’s balance sheet, the senior tranche is usually retained and protection is obtained on a more limited risk layer. Earlier MDB transactions, including AfDB’s Room2Run and subsequent transactions by other MDBs, largely followed this approach. Their principal purpose was to release risk-bearing capacity rather than to obtain funding.
A funded true-sale transaction serves a broader set of objectives. By transferring loans or loan participations to a special-purpose vehicle (SPV) and issuing notes to investors, the MDB can obtain funding as well as transfer risk. A true sale may also reduce balance-sheet leverage, which can be relevant where leverage-based rating constraints are important. In addition, the placement of publicly issued notes can introduce mainstream institutional investors to MDB loan exposures and contribute to the creation of a new investable asset class.
IFC’s EMSP 2025-1 (see Risk Control (2026b))reflects this broader combination of objectives. The transaction was intended not only to release balance-sheet capacity, but also to mobilise private investment and establish a continuing programme of MDB-loan-backed CLO issuance. Its significance therefore extends beyond the immediate capital and income effects of a single transaction. The involvement of mainstream CLO investors and the intention to undertake repeat issuance are part of a wider market-building strategy.
The distinction between these objectives is important because different transaction structures serve different purposes. Where risk transfer and the BTC ratio are the principal considerations, synthetic approaches may be preferable. By contrast, funded CLO structures can also raise funding, support mobilisation and generate demonstration effects by introducing a wider group of investors to MDB loan exposures. An inaugural transaction may therefore be justified partly by its contribution to market development, even where its pricing is expected to improve as investors become more familiar with the asset class.
Mobilisation and demonstration effects are difficult to incorporate directly into the financial assessment of a transaction. The treatment of securitisation and significant risk transfer within MDB mobilisation statistics remains under development, particularly because the additional balance-sheet capacity released may exceed the nominal amount of private protection provided (Joint Report (2025)). Demonstration effects are similarly difficult to express in monetary terms, although they may encourage replication and influence investor perceptions.
For these reasons, the primary objectives of the transaction should be established before the structure is selected. Without a clear hierarchy of objectives, it becomes difficult to determine the appropriate benchmark of the transaction.
Recommendation 1: For both of the primary objectives for MDBs for engaging in securitisation discussed above, we would argue there is a lack of accepted, transparent approaches for decision-making. Current experimentation with securitisation by different MDBs should be replaced by systematic programs of issuance justified and guided by rigorous measurement of Economic Value creation on the one hand and mobilisation on the other.
3. Internal Organisation
This section explains the business model changes necessary to support change from a traditional Hold To Maturity (HTM) MDB business model to an OTS approach. Most recent discussions of OTS have emphasised the advantages or disadvantages of the approach (see Bord and Santos (2012), Purnanandam (2011) and, Hildebrand, Puri and Rocholl (2010)) without focussing, as we do here, on how an MDB may ‘get from A to B.’ Exceptions are BII (2023) which briefly describes the changes necessary to institute OTS in a Development Finance Institution as ‘the requirements of the transition’ and Risk Control (2024b) which discusses the nature and requirements of OTS platforms.[5]
Risk Control (2024b) states that moving from a traditional Hold-to-Maturity (HTM) model to an Originate-to- Share (OTS) approach requires business model changes rather than simply executing individual transactions. The report argues that single OTS deals are more costly and bring fewer benefits than arrangements that permit a flow of repeat deals, and that developing an OTS strategy requires instituting suitable tools and performing appropriate studies and analyses.
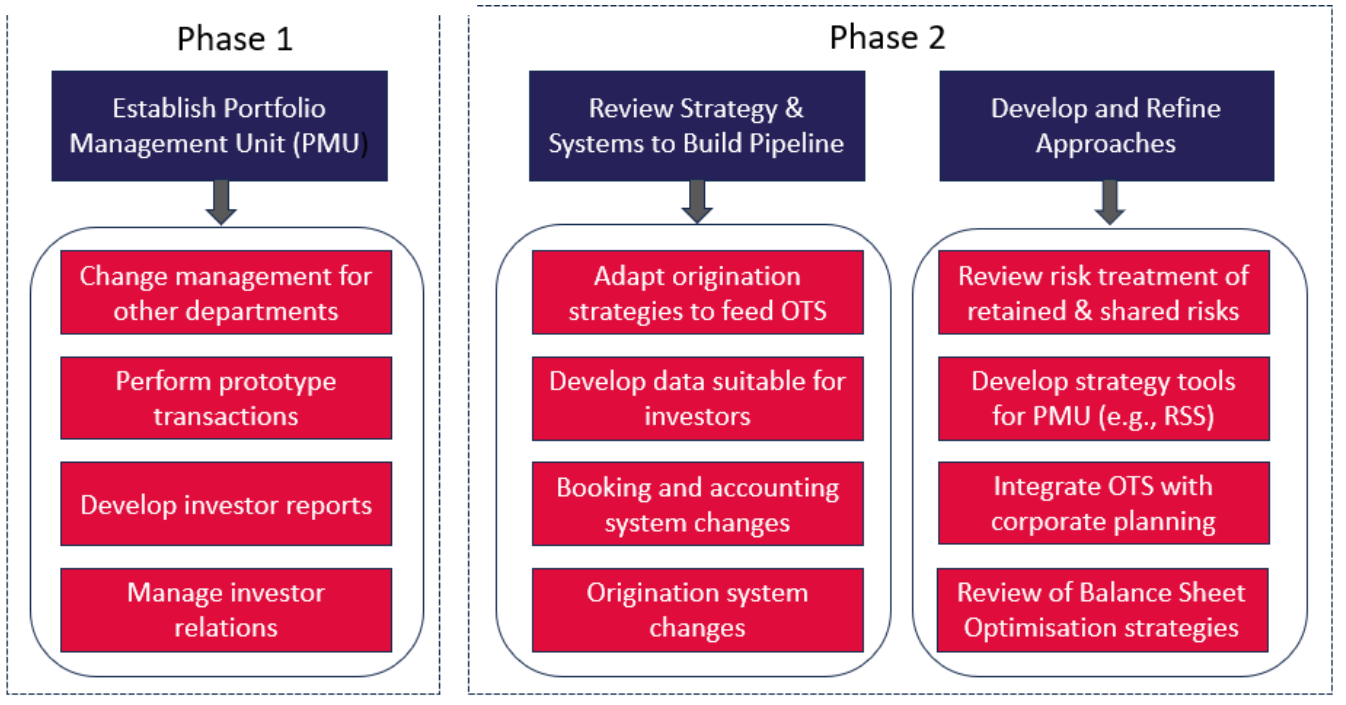
It recommends an agile first phase involving establishing a Portfolio Management Unit (PMU) and pushing ahead with an initial transaction. As OTS activity grows, the PMU would become a central function within the bank, designing transactions in close communication with business, strategy, risk and finance functions and interacting with investors and arrangers.
Risk Control (2025a) further states that a second phase should support a program of expanded origination, integrated with OTS activities and aligned with long-term plans for the Bank’s balance sheet, profitability, risk management, ratings and mobilisation. The paper identifies key steps including adapting origination strategies, developing data templates and historical databases to suit investors’ needs, and making appropriate changes in booking, accounting and origination systems. It also states that the strategy should be embedded within corporate planning and current risk management, including the treatment of retained senior and junior tranches, rating scenario analysis, and a wider review of Balance Sheet Optimisation techniques.
Some elements of the changes described above may have been implemented already by MDBs since many have already been active in using commercial credit insurance in recent years. The complexity of dealing with portfolio risk transfer and the increased scale of the risk transfer activities are likely to necessitate significant additional efforts, however.
Figure 3.1 depicts steps required for an MDB to go from HTM to OTS on a significant scale. The figure displays what is necessary for an MDB in which a Portfolio Management Unit (PMU) implements an initial prototype transaction. The use of a prototype transaction assists a bank in understanding the requirements of OTS and assists in building consensus that the strategy can be adopted on a larger scale.
Phase 1, as depicted in Figure 3.1, includes the activities undertaken by a newly established PMU to pioneer an initial prototype transaction. MDBs that have been active in the use of credit insurance may involve in prototype securitisations the same insurers with which they have already developed close working relations. The focus on a portfolio and tranched transaction will likely require engaging with different teams in those counterparties.
Additional non-insurer participants in prototype deals may include specialised funds. The PMU should be closely involved in developing relations with these investors and protection providers and supplying the data and reporting needs of the counterparties. In parallel to completing the deal, the PMU should identify areas in which other department of the MDB may need to change their practices, systems or policies to accommodate the prototype transaction.
Phase 2 as shown in Figure 3.1 Figure 3.1sets out the steps that MDBs may wish to take to build a significant pipeline of transactions and reinforce other aspects of their activities (planning and risk management) to integrate the new ways of working. The key issues here are adapting origination strategies to suit the opportunities offered by systematic risk transfer, developing data templates and historical databases to suit investors’ needs, making appropriate changes in booking, accounting and origination systems.
The operating model of the PMU should be made explicit. The unit will need clear authority over asset selection, the internal allocation of the capital benefits generated by transactions, the management of borrower relationships affected by transfers, amendments and waivers, investor engagement, reporting and workouts. The practical shift is from individual teams managing individual loans to the institution managing its assets and capital at portfolio level.
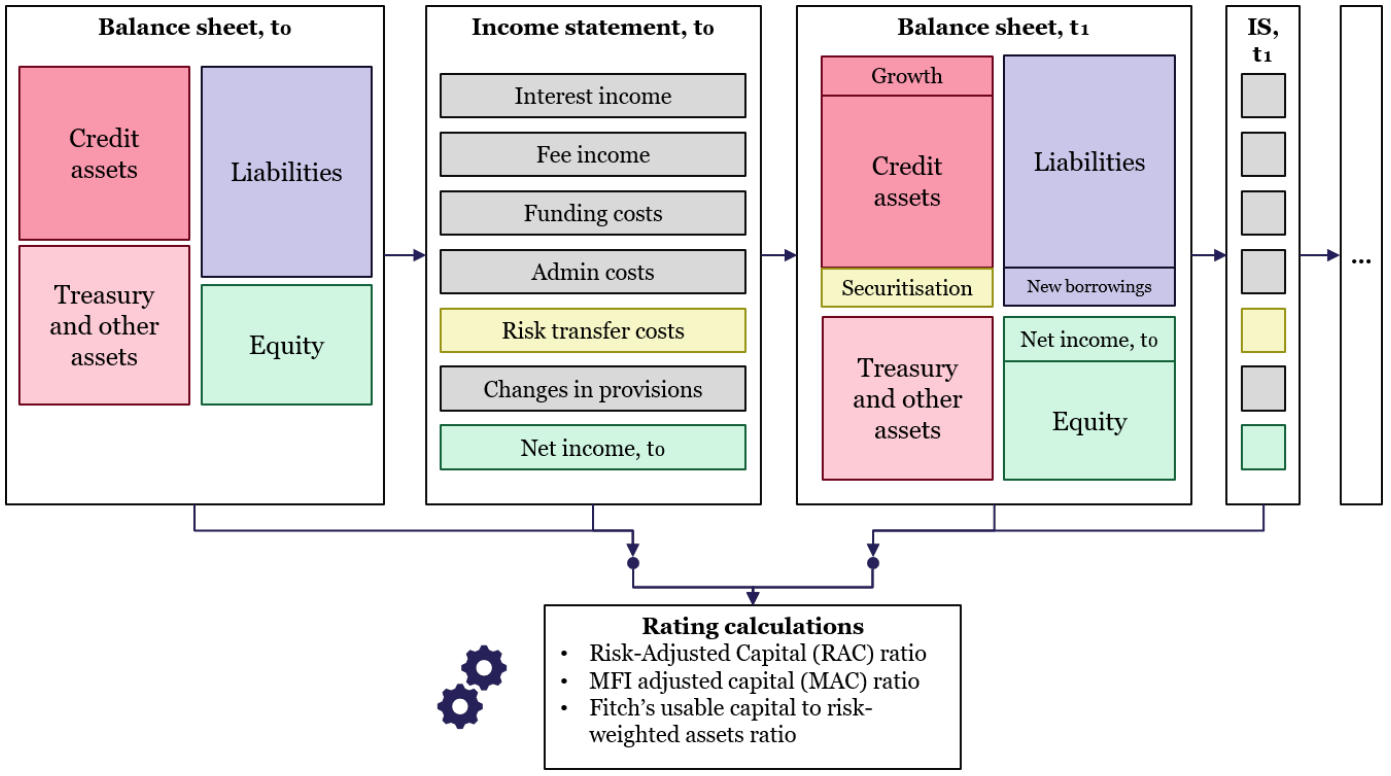
In addition, MDBs should seek to embed the new strategy within their corporate planning and current risk management. An illustrative exercise along these lines is provided in Section 5. For a stylised MDB balance sheet, a corporate planning exercise is shown there in which granular exposure data is projected forward along with analysis of the Return on Equity and rating agency capital adequacy metrics.
The Economic Capital treatment of retained senior and junior tranches also requires consideration. How the programme of securitisation transactions and other forms of risk transfer fits in with the MDB’s long-term capital needs requires careful consideration. To assist the PMU to determine appropriate steps, enhancing the analytics available to it through Rating Scenario and Economic Capital Systems is advisable.
The credibility of the OTS model with investors also depends on safeguards that investors typically look for. These include assurance that the same underwriting standards apply to retained and transferred loans, that assets are selected for transfer in a way that neither passes weaker loans to investors nor concentrates stronger loans in transferred pools at the expense of the retained portfolio, and that the MDB remains accountable for servicing and workouts. Retention by the MDB of a significant share of the risk on securitised loans helps to align its incentives with those of investors. Setting out these safeguards explicitly would strengthen the credibility of MDB securitisation programs with the investor base they seek to attract.
Recommendation 2: MDBs should organise their business activities to facilitate the distribution of loans and develop loan origination that will serve as input to securitisation programs. This includes organisation of highquality internal loan data, contract standardisation and creation of a Portfolio Management Unit for dealing with structuring and placement.
Note: Here RSS denotes Rating Scenario System.
4. Narrow Spreads and Loan Performance
MDB loan portfolios are commonly characterised by relatively fine lending margins. This creates a challenge for securitisation because the additional risk capacity generated by a transaction must be weighed against the spread income that is transferred to investors or protection providers. If loan spreads are narrow then the cost of protection may exceed what the MDB earns as spread income.
The challenge is particularly significant in funded securitisations, where the income from the underlying loans must support several layers of liabilities. In EMSP 2025-1, for example, the underlying portfolio had a weighted-average spread of 3.02% over SOFR and a weighted-average life of 3.3 years. The Class A notes paid three-month SOFR plus 130 basis points, while the Class B notes paid SOFR plus 220 basis points. The Preference Shares received only the residual income remaining after payments on the senior and mezzanine notes and other transaction expenses.[6]
MDB-loan-backed securitisations remain a relatively unfamiliar asset class, and investors may initially price the notes by reference to established CLO instruments rather than fully reflecting the historical credit performance of MDB loans (see Prudential Global Investment Management (2026)). When EMSP 2025-1 was launched, the average spread on US broadly syndicated loan AAA CLO tranches was approximately 130 basis points over SOFR, closely matching the spread paid on the Class A notes. AAA CLO spreads have generally ranged from approximately 100 to 250 basis points, while AA- and A-rated tranches have typically required spreads of around 150 to 400 basis points. BBB spreads have ranged more widely, at approximately 250 to 700 basis points, while BB spreads have varied from around 600 basis points in stable markets to 1,600–1,800 basis points during stressed periods.
Low asset spreads therefore leave relatively little room for transaction costs, market risk premia and conservative structuring assumptions. The viability of the transaction depends on the relationship between the underlying loan spread, the pricing of the issued tranches, the amount of risk retained and the capital benefit recognised by the rating agencies.
One may argue that the challenge for MDBs is not that spreads are narrow but instead the difficulty of aligning market perceptions of MDB loans with their actual credit performance. Although MDBs have taken steps to publicise historical Probabilities of Default (PDs) and Loss Given Default (LGD) rates of their loans through the reports of the Global Emerging Markets (GEMs) consortium database, they still need to make the case to rating agencies and investors that the loan credit quality merits favourable treatment when the loans are included in securitisation transactions.
In general, if MDB loans are priced in an actuarially fair manner (allowing for funding, Expected Loss (EL), overheads and Unexpected Loss multiplied by the cost of equity (as a measure of the cost of risk)), then, in principle, there should be no basic impediment to implementing risk transfers. It could be that the MDB’s pricing of risk is below that of counterparties but this should not be the case as MDBs operate with low risk tolerance and aim for high ratings (AAA). MDBs aim to price in line the market for NSO loans and view the low spreads they charge on SO loans as a fair recompense for Preferred Creditor Treatment, the de facto seniority with which sovereign borrowers treat their MDB loans.
It is useful to distinguish between the fair pricing of an MDB loan and whether the loan spread is sufficient to support a securitisation at the liability spreads investors require. A loan may be fairly priced from the MDB’s perspective yet generate too little spread to cover transaction costs, liquidity premia, mezzanine pricing and an acceptable return on a retained junior position. Problems of this kind arise in two circumstances: (i) the MDB lends below market rates, for example because it is not required to pay dividends to its shareholders, or (ii) the MDB understands the risk of its loans but the securitisation market and the rating agencies do not. The first calls for MDBs to lend at actuarially fair rates, checked using RAROC approaches. The second calls for MDBs to demonstrate the quality of their loans to the market. Where both conditions are met, disposing of loans to the market, whether through securitisation or through loans participations, should be viable.
But some investors and rating agencies remain unclear about the credit quality of MDB loans. The calibration that ratings agencies apply to MDB loans included in securitisation pools as is discussed in our companion study Risk Control (2026d). A leading investment bank expert in securitisation interviewed as part of this project said “If it’s funded and rated, it becomes much more accessible.” So, the views of rating agencies are key to wider investor acceptance.
More broadly, developing transparency around their underwriting standards, legal documentation, management of delinquencies and other operating approaches is what investors and the wider market expect of new issuers like MDBs. An investment banker experienced in global commercial bank securitisation and in advising MDBs said: “There’s so many legal inhibitions from being able to do a true sale transfer of these loans.” “You have very unusual features or payment holidays… highly tailored exposures.”
MDBs need to assist not just investors but also key market participants such as arrangers and asset managers in providing evidence of the quality of MDB loans. A senior portfolio manager involved in recent MDB transactions said “We spent so much time educating our investors about what was a multilateral development bank… and what is the track record and performance.”
Many MDBs believe that the GEMs data provides most of the data that the market requires. But this ignores the fact that MDBs are heterogeneous in their underwriting standards, procedures for handling delinquent assets and, hence, in loan credit quality. Once a securitisation is in preparation, detailed data for the MDB in question must, therefore, be provided. An MDB securitisation specialist involved in a recent transaction with investors and rating agencies said: “We gave them historical performance, so that meant the fall, the vintages, recoveries… historical defaults,” But then continued: “The data was not as extensive probably as a global bank would give.”
Ratings agencies require substantial data. A senior staff member of leading rating agency said: “There will be a need for us to map the assets from their internal rating scale to ours.” “We need to go on site, visit their data room, interview their credit analysts, the risk managers… look at fair number of files.” A senior staff member of a global insurer involved in credit insurance of MDB loans and taking exposure to recent MDB securitisations commented: “We always ask them to be granular and get the details of the exact size of their experience, number of contracts, everything.”
These comments underline the greater degree of transparency that investors strongly prefer if they are to invest on favourable terms. This is not provided by GEMs and even with consortium data provided by GEMs detailed analytical studies are preferable to simple reports of historical averages.
Recommendation 3: MDBs should ensure that non-concessional lending is exactly that and then work to persuade investors and rating agencies that the loan pricing is in line with prospective credit performance.
5. Integrating Programmatic Securitisation with Corporate Plans
Under a traditional HTM business model, an MDB’s lending capacity is constrained by the amount of capital available to support the loans that remain on its balance sheet. An OTS model changes this relationship by allowing part of the credit risk associated with existing lending to be transferred to investors. The capital released can then be redeployed to support new lending, allowing the same initial equity base to support a larger volume of business over time.
Securitisation releases capital but also reduces the income retained by the MDB. The economic question is therefore whether the additional income that can be generated by redeploying the released capacity is sufficient to compensate for the income given up through the transaction.
This trade-off can be viewed at two complementary levels.
1. RAC measures the MDB’s capital adequacy by assessing the amount of risk-adjusted capital available relative to its risk-weighted exposure, and therefore captures the extent to which securitisation strengthens the institution’s capital position.
2. RoE considers the effect at the level of the institution as a whole, measuring the net income generated by the MDB relative to its equity base. This is particularly important in a multi-period setting because retained earnings increase the MDB’s equity and, in turn, its capacity to support future lending.
Comparing RAC and RoE under HTM and OTS strategies therefore allows us to examine whether the immediate capital release from securitisation ultimately translates into a sustained improvement in the MDB’s financial capacity and ability to expand lending.
To examine these effects, we construct a synthetic portfolio for an imaginary but representative MDB and project its financial position under otherwise comparable scenarios with and without securitisation. The analysis is performed at a granular, instrument level rather than by applying top-down growth and profitability ratios to an aggregate balance sheet. Individual assets and liabilities are represented with their own characteristics, including exposure amount, maturity, pricing, credit quality and contractual cash-flow schedules.
This granular approach is useful because the consequences of securitisation depend on more than the amount of assets transferred: they also depend on when principal and interest are received, the funding required to support the remaining balance sheet, the credit risk of the assets, and the income and capital released by the transaction. These effects can therefore flow through the projection consistently rather than being imposed as separate assumptions.
The resulting deal-level books are used to construct multi-period balance sheets and income statements, including funding costs, credit-loss provisions, and the evolution of retained earnings and equity. The analysis considers three cases. In the Base case, portfolio growth is calibrated to maintain a broadly stable RAC ratio and no securitisation is undertaken. In the Portfolio Expansion case, the portfolio expands without securitisation. In the Portfolio Expansion with Securitisation case, the same expansion is combined with part of the portfolio being securitised.
The projected financial statements and risk measures then provide the inputs needed to calculate and compare the MDB’s RAC and RoE under the three approaches. Importantly, the comparison is dynamic. Since annual profits feed into retained earnings and, hence, future equity, the model captures not only the immediate income and capital effects of a securitisation, but also how these differences accumulate over time and affect the MDB’s capacity to support future business.
To estimate the potential gains from a risk transfer, we implement a financial model. The starting point of the model is the balance sheet of an MDB that has not previously engaged in securitisation. We then project the MDB’s financial position over time, assuming that it initiates and subsequently implements a risk transfer programme. Under this approach, we track the institution’s capital adequacy metrics, as assessed by the rating agencies, together with its return on equity.
1. The initial balance sheet represents an MDB whose lending is directed primarily at non-sovereign operations (NSOs). Assets are built up at instrument level across cash, trading investments, loans, equity investments and debt securities, and are funded by market borrowing and equity, so that the starting position is that of an established MDB that has not previously undertaken risk transfer.
2. Net income is calculated at the end of each year as the yield earned on the existing credit portfolio, less the funding costs applicable to a AAA-rated MDB, changes in provisions and, where a risk transfer transaction is assumed, the associated cost of credit protection. The cost of protection therefore reduces income in every year in which the programme is active, and the analysis turns on whether the lending supported by the capital released more than offsets that cost.
3. To project the portfolio forward, new credit assets are originated in each period. The volume of new assets is determined by the modelling assumptions. Their credit characteristics — rating distribution, pricing, tenor and amortisation profile — are assumed to be consistent with those of the existing portfolio, so that the risk profile of the book remains stable over the projection and differences between the HTM and OTS cases are not driven by changes in asset quality.
4. The MDB’s equity is adjusted at the beginning of each period to reflect the net income generated in the preceding period, so that retained earnings accumulate and progressively enlarge the capital base available to support future lending. Assets and liabilities are subsequently rebalanced to maintain balance-sheet consistency, with funding adjusted to match the projected asset side.
5. At the end of each period, the projected assets, liabilities, balance sheet and income statement are used to calculate the relevant rating-agency capital adequacy metrics, together with RoE. Comparing these measures across the HTM and OTS projections shows how much rating headroom a programme of securitisations creates and whether that headroom is translated into higher returns for the institution.
6. The risk transfer modelled in this analysis is a securitisation referencing 10% of the credit portfolio. The securitised pool is tranched at attachment points of 5% and 20%, giving a first-loss tranche covering losses up to 5%, a mezzanine tranche covering losses between 5% and 20%, and a senior tranche above 20%. Only the mezzanine tranche is ceded to protection providers, at a fee of three-month SOFR (S3M) plus 300 basis points; the first-loss and senior tranches are retained by the MDB, so the capital benefit recognised in the projection reflects protection on the mezzanine layer alone. The transaction is assumed to be programmatic rather than one-off: at the end of each projected period the model securitises 10% of the portfolio then outstanding, so that risk transfer is renewed as the portfolio amortises and new assets are originated.
We consider three scenarios for the MDB (Appendix 2 provides details). In the first (baseline) scenario, portfolio growth and equity accumulation from retained earnings are balanced in the sense that the level of the S&P Risk Adjusted Capital (RAC) ratio remains flat over the horizon from year end 2025 to year end 2030 (see Figure 5.2). In the second scenario, the MDB’s loan portfolio is assumed to expand significantly. This boosts the MDB’s Return on Equity (RoE) relative to the base case (see Figure 5.3) but pushes the RAC ratio below 23% (the threshold for dropping out of the highest category for this key capital adequacy indicator) by 2029 (see Figure 5.2 and Figure 5.4). While the decline in the RAC ratio is not enough to lower the Standard & Poor’s rating which remains AAA throughout the projection horizon, the expansion in lending does push the MDB’s Moody’s rating from Aaa to Aa1 in 2028. The latter exhibited some vulnerability in any case since, even in the base case, the Moody’s solvency assessment declined although the issuer rating did not change (see Figure 5.5).
We finally investigate a third scenario in which the expansion in lending is accompanied by a securitisation program in which the MDB completes a Significant Risk Transfer (SRT) each year. This mitigates the decrease in the Standard & Poor’s RAC ratio (see Figure 5.2). The cost of credit protection reduces the MDB’s RoE relative to the expansion scenario levels but they remain above those in the base case (see Figure 5.3). The combination of portfolio expansion and a securitisation program bolsters the MDB’s ratings relative to the expansion scenario so that both Standard & Poor’s and Moody’s issuer ratings remain at the triple A level throughout the projection period (see Figure 5.4 for the Standard & Poor’s rating results and Figure 5.5 for the Moody’s issuer rating).
The exercise shown above is illustrative (i) of how securitisation programs by MDBs may permit greater loan growth without weakness in their issuer ratings and (ii) how the programs may be represented within corporate planning projections to provide transparency for MDB management and boards. Understanding the interaction of such deals not just on capital adequacy indicators and ratings but also on the MDB’s financial performance as represented by its RoE are essential for appropriate decision-making. Overly costly credit protection can even erode RoE and, hence, over time reduce the headroom that an MDB has to expand lending before its rating begins to look vulnerable to downgrade.
Recommendation 4: MDBs should explicitly introduce securitisation programs into their corporate planning to make transparent the contribution the transactions make to lending headroom and capital accumulation, permitting future growth in lending with less reliance on general capital increases.
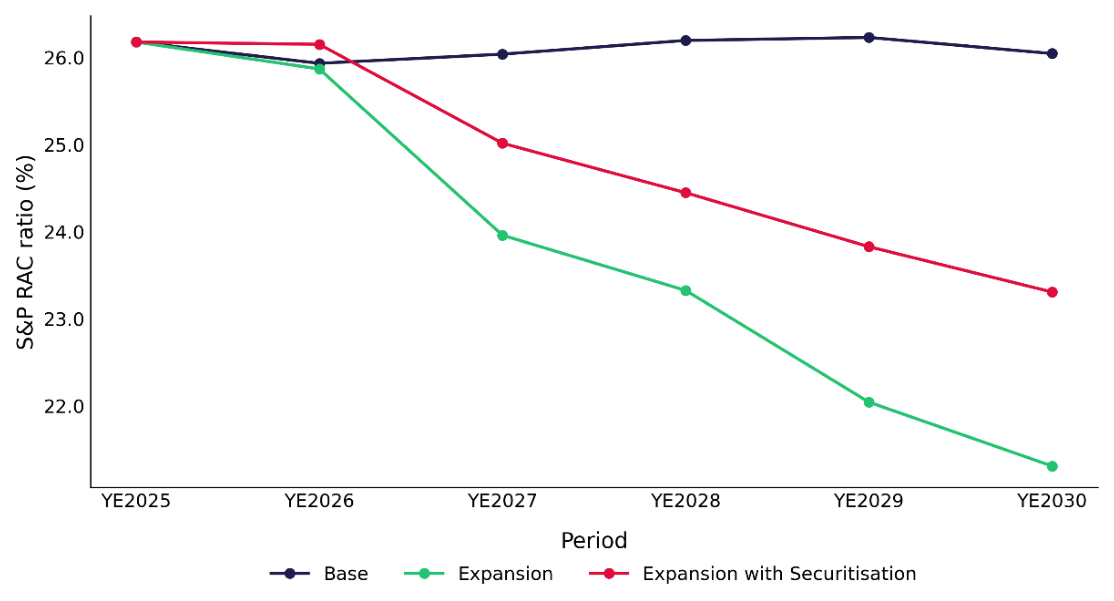
Note: The RAC ratio equals total equity divided by Risk Weighted Assets after adjustment for diversification and concentration.
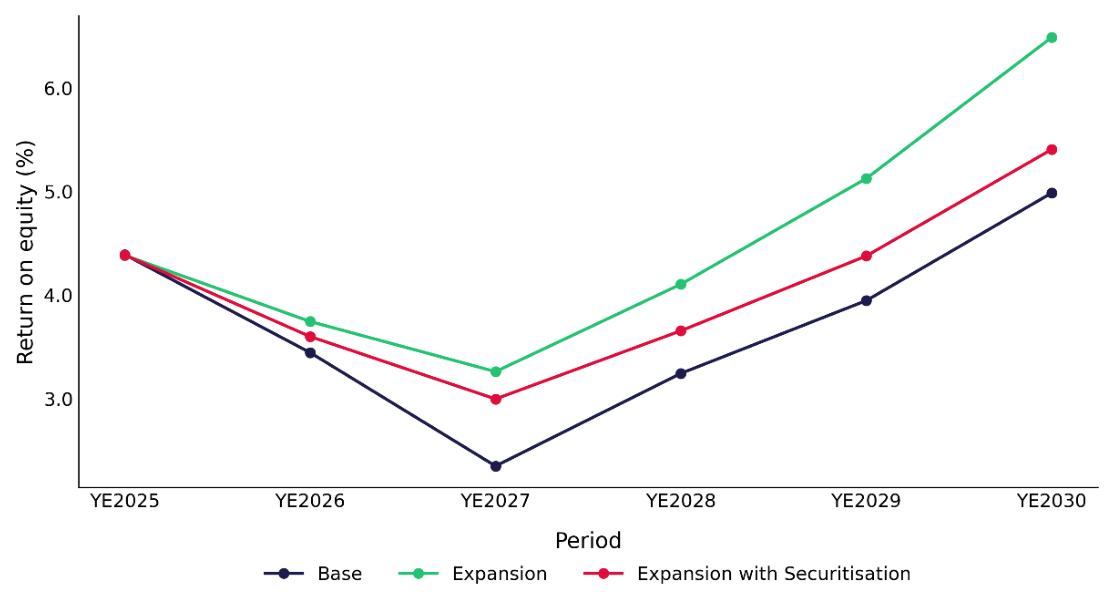
Note: The figure shows Return on Equity defined as contributed net income divided by average equity.
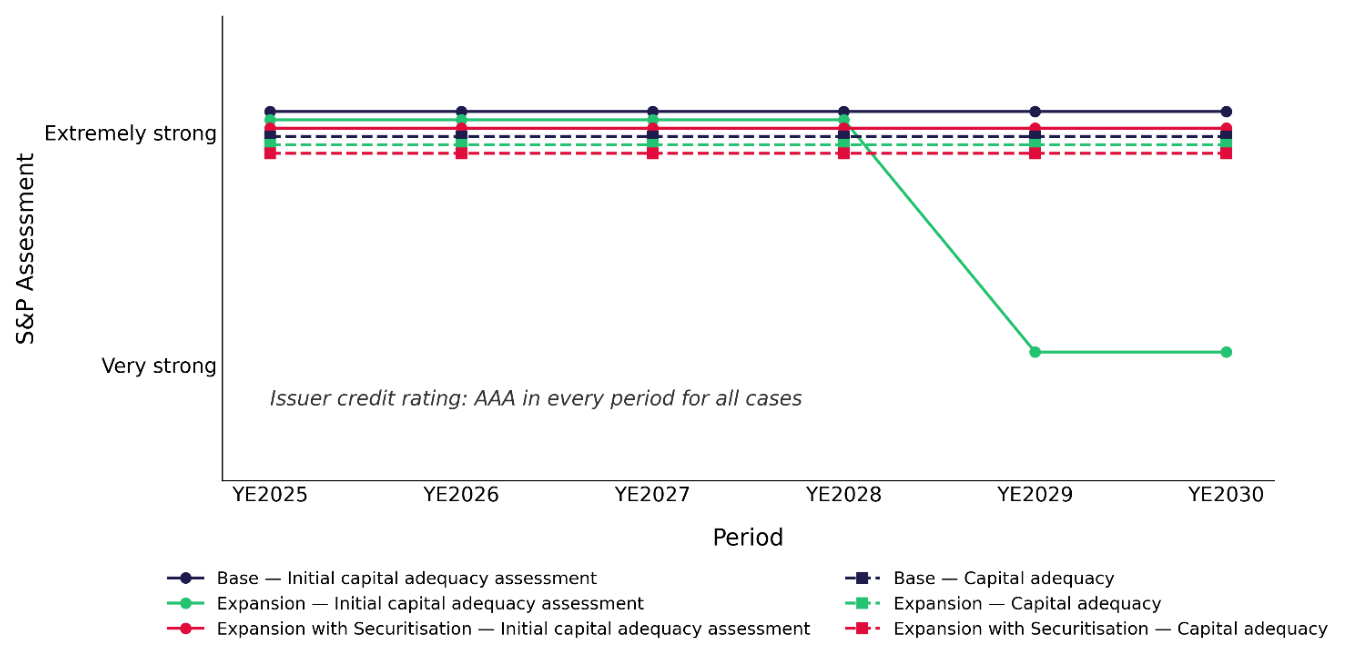
Note: The figure shows that the Standard & Poor’s Initial Capital Assessment slips to Very Strong in 2029 in the Expansion case. Introducing the securitisation keeps the final score at Extremely strong, protecting the rating.
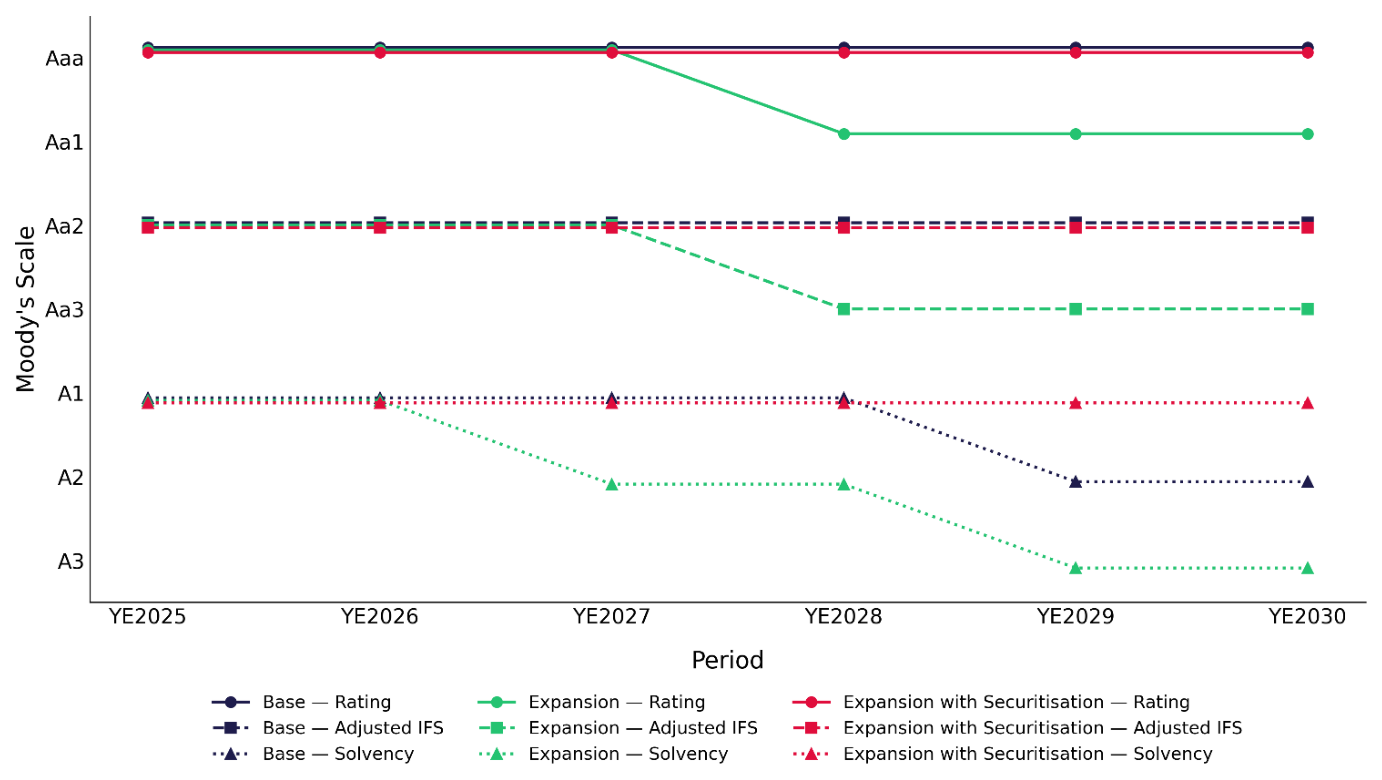
Note: The Moody’s rating declines from Aaa to Aa1 in 2028 as solvency weakness in the Expansion case, whereas the rating remains at Aaa throughout the projection period in the with Securitisation case.
6. Conclusion
This report provides analysis of steps that MDBs need to take to institute programmatic securitisation as part of their balance sheet management. Specifically, we focus on the need:
• To adopt transparent measures of the costs and benefits of securitisation-based risk transfer.
• To reorganise internal operations to facilitate the Originate-To-Share business model.
• To close the gap between market perceptions of MDB loans and the reality.
• To include securitisation programs in corporate planning projections.
The main recommendations of the report are:
1. MDBs should consider adopting Risk Adjusted Return on Capital (RAROC) criteria for assessing the economic value added of risk transfers. RAROC criteria guide commercial banks in Balance Sheet Optimisation, clarifying and facilitating BSO decision-making. In this, MDBs should identify target Returns on Equity (RoE) consistent with their long-term financial plans.
2. MDBs should organise their business activities to facilitate the distribution of loans and develop loan origination that will serve as input to securitisation programs. This includes organisation of highquality internal loan data, contract standardisation and creation of a Portfolio Management Unit for dealing with structuring and placement.
3. MDBs should ensure non-concessional lending is exactly that and then work to persuade investors and rating agencies that the loan pricing is in line with prospective credit performance.
4. MDBs should explicitly introduce securitisation programs into their corporate planning to make transparent the contribution the transactions make to lending headroom and capital accumulation, permitting future growth in lending with less reliance on general capital increases.
Two companion reports, Risk Control (2026c) and (2026d), analyse market views on MDB securitisation and obstacles to MDB securitisation attributable to investor and rating agency views of MDB loan credit quality.
The research in this and the companion studies supports the objectives of FCDO’s MOBILIST program (sponsored by FCDO and SECO) by identifying practical approaches through which MDBs and other development finance institutions can broaden institutional investor participation and establish securitisation as a more regular balance sheet management and mobilisation tool.
References
Attridge, Samantha and Mary Svenstrup (2026) “Breaking the Bottlenecks: G20 Priorities for Private Capital Mobilization,” April, available at: https://www.cgdev.org/publication/breaking-bottlenecks-g20-prioritiesprivate-capital-mobilization
British International Investment (2023) “Driving mobilisation,” August, available at: https://assets.bii.co.uk/wp-content/uploads/2023/08/31163301/Driving-mobilisation_BII.pdf
Bord, Vitaly M. and João A. C. Santos (2012) “The Rise of the Originate-to-Distribute Model and the Role of Banks in Financial Intermediation,” FRBNY Economic Policy Review, July, available at: https://www.newyorkfed.org/medialibrary/media/research/epr/12v18n2/1207bord.pdf/1000
European Systemic Risk Board (2025) “Unveiling the impact of STS on-balance-sheet securitisation on EU financial stability,” May, available at: https://www.esrb.europa.eu/pub/pdf/reports/esrb.report202505_syntheticSTSsecuritisation.en.pd
Falduto, Chiara, Raphael Jachnik, and Jolien Noels (2024), “The New Collective Quantified Goal on climate finance”, OECD/IEA Climate Change Expert Group Papers, May, available at: https://www.oecdilibrary.org/environment/the-new-collective-quantified-goal-on-climate-finance_7b28309ben.
Galizia, Federico, William Perraudin, Andrew Powell and Timothy Turner (2021) “Risk Transfer for Multilateral Development Banks: Obstacles and Potential,” November, available at: https://www.riskcontrollimited.com/insights/risk-transfer-for-multilateral-development-banks-obstacles-andpotential/
Gonzalez, Fernando and Cristina Morar Triandafil (2023) “The European significant risk transfer securitisation market,” ESRB Occasional Paper Series No. 23, October, available at: https://www.esrb.europa.eu/pub/pdf/occasional/esrb.op23~07d5c3eef2.en.pdf
Gregory, Neil (2023) “Taking Stock of MDB and DFI Innovations for Mobilizing Private Capital for Development,” April, available at: https://www.cgdev.org/publication/taking-stock-mdb-and-dfi-innovationsmobilizing-private-capital-development
G20 Independent Experts Group (2023) “Strengthening Multilateral Development Banks: The Triple Agenda,” July, available at: https://www.cgdev.org/publication/strengthening-multilateral-development-banks-tripleagenda
G20 (2024a) “G20 Roadmap Towards Better, Bigger and More Effective MDBs,” October, available at: https://www.gov.br/g20/pt-br/trilhas/trilha-de-financas/arquitetura-financeira-internacional/7-g20roadmap-towards-better-bigger-and-more-effective-mdbs.pdf/@@download/file
G20 (2024b) “G20 Progress Report: Implementing the Recommendations of the G20 Independent Review of Multilateral Development Banks’ Capital Adequacy Frameworks,” July, available at: https://www.gov.br/g20/pt-br/trilhas/trilha-de-financas/arquitetura-financeira-internacional/9-g20-2024progress-report-implementing-the-recommendations-of-the-g20-independent-review-of-multilateraldevelopment-banks-capital-adequacy-frameworks.pdf/@@download/file
Heads of Multilateral Development Banks (2024) “Viewpoint Note: MDBs Working as a System for Impact and Scale,” April, available at: https://www.ndb.int/wp-content/uploads/2024/04/Heads-of-MDBs-Viewpoint- Note-20-April-2024.pd
Hildebrand, Thomas, Manju Puri and Jörg Rocholl (2010) “Skin in the Game in the Originate-to-Distribute Model: Evidence from the Online Social Lending Market,” April, available at: https://www.suomenpankki.fi/globalassets/bof/en//research/seminars-and-conferences/conferences-andworkshops/documents/cepr2010/cepr2010_hildebrandpurirocholl_paper.pdf
Inter-American Development Bank Invest (2023) “Governors Embrace Vision, Priorities and Plans for the IDB Group,” March, available at: https://idbinvest.org/en/news-media/governors-embrace-vision-priorities-andplans-idb-group-0
Inter-American Development Bank Invest (2024a) “Governors Approve Three Historic, Transformative Changes for the IDB Group to Support the Region,” March, available at: https://idbinvest.org/en/newsmedia/governors-approve-three-historic-transformative-changes-idb-group-support-region
Inter-American Development Bank Invest (2024b) “A New Business Model to Scale Impact in Latin America and the Caribbean,” October, available at: https://www.idbinvest.org/en/blog/financial-institutions/newbusiness-model-scale-impact-latin-america-and-caribbean
Inter-American Development Bank Invest (2024c) “IDB Invest Launches Landmark $1 Billion Securitization in Latin America and the Caribbean,” October, available at: https://idbinvest.org/en/news-media/idb-investlaunches-landmark-1-billion-securitization-latin-america-and-caribbean
Joint Report (2025) “Mobilization of Private Finance by Multilateral Development Banks and Development Finance Institutions,” February, available at: https://www.ifc.org/content/dam/ifc/doc/2025/2023-jointreport-mobilization-of-private-finance-by-mdbs-dfis.pdf#page=28.10
Lankes, Hans Peter and Annalisa Prizzon (2023) “Multilateral development bank reform can – and must – benefit both low- and middle-income countries,” ODI Global, April, available at: https://odi.org/en/insights/multilateral-development-bank-reform-can-and-must-benefit-both-low-andmiddle-income-countries/
MDB Task Force on Mobilization (2026a) “MDB Methodology for Private Investment Mobilization: Reference Guide,” 10th edition (final draft), June 2026
MDB Task Force on Mobilization (2026b) “Mobilization of Private Finance by Multilateral Development Banks and Development Finance Institutions 2024,” May, available at: https://www.ifc.org/content/dam/ifc/doc/2026/2024-joint-report-mobilization-of-private-finance-by-mdbsdfis.pdf
Organisation for Economic Cooperation and Development (2020), “DAC methodologies for measuring the amounts mobilised from the private sector by official development”, May, available at: https://www.oecd.org/dac/financing-sustainable-development/development-financestandards/DACMethodologies-on-Mobilisation.pdf.
Organisation of Economic Cooperation and Development (2025) “Tracking Private Finance Mobilisation: Latest Trends and Ways Forward,” available at: https://doi.org/10.1787/8d414cdb-en
Organisation for Economic Co-operation and Development (2026) “Private Finance Mobilisation Report 2026,” July, available at: https://doi.org/10.1787/a871a032-en
Osberghaus, Alex and Glenn Schepens (2026) “Synthetic, but how much risk transfer?,” ECB Working Paper Series No. 3210, March, available at: https://www.ecb.europa.eu/pub/pdf/scpwps/ecb.wp3210~e2dc529b33.en.pdf
Publish What You Fund (2024) “Crowding In: An advanced approach for measuring and disclosing private capital mobilisation,” April, available at: https://www.publishwhatyoufund.org/app/uploads/dlm_uploads/2024/04/Crowding-in-An-advancedapproach-for-measuring-and-disclosing-private-capital-mobilisation.pdf
Purnanandam, Amiyatosh (2011) “Originate-to-distribute Model and the Subprime Mortgage Crisis,” The Review of Financial Studies, Vol.24, No. 6, June, available at: https://doi.org/10.1093/rfs/hhq106
Prudential Global Investment Management (2026) “Senior CLO Liquidity: A Class of its Own,” March, available at: https://www.pgim.com/gb/en/intermediary/insights/thought-leadership/senior-clo-liquidity-class-of-itsown
Risk Control (2019) “Room2Run: the AfDB’s Approach to Sharing Risk with the Private Sector,” 19-73a, available at: https://www.newmarketcapital.com/wp-content/uploads/2021/11/Room-to-Run_Risk- Control.pdf
Risk Control (2024a) “Innovative Deals in Development Finance: Originate to Demonstrate,” Risk Control Report 24-66a, August, available at: https://www.riskcontrollimited.com/wpcontent/uploads/2024/09/Innovative-Deals-in-Development-Finance-O2D-24-66a-19-8-24-v73.pdf
Risk Control (2024b) “MDB Risk Transfer – Business Models and Data,” October, available at: https://www.riskcontrollimited.com/insights/mdb-risk-transfer-business-models-and-data/
Risk Control (2024c) “Fair Pricing of MDB Sovereign Loans,” 24-122a, available at: https://www.riskcontrollimited.com/insights/fair-pricing-of-mdb-sovereign-loans/
Risk Control (2025a) “Data Template for MDB Loans,” January, available at: https://www.riskcontrollimited.com/insights/data-template-for-mdb-loans/
Risk Control (2026a) “Ex Post Evaluation of Financial Demonstration Effects,” Research Report, May.
Risk Control (2026b) “IFC’s EMSP 2025-1: Implications for MDBs and Market Building,” Research Report, July.
Risk Control (2026c) “Market Awareness of MDB Securitisations,” Research Report, August.
Risk Control (2026d) “MDB Securitisation and the Rating Agencies,”26-48a, Research Report, August.
United Nations (2015) “Transforming Our World, the 2030 Agenda for Sustainable Development,” General Assembly Resolution, September, available at: https://sdgs.un.org/publications/transforming-our-world2030agenda-sustainable-development-17981.
World Bank (2018) “MDB Methodology for Private Investment Mobilization - Reference Guide,” available at: https://documents1.worldbank.org/curated/en/495061492543870701/pdf/114403-REVISED-June25- DocumentsPrivInvestMob-Draft-Ref-Guide-Master-June2018-v4.pdf .
World Bank Group (2023) “Ending Poverty on a Livable Planet: Report to Governors on World Bank Evolution,” September, available at: https://documents.worldbank.org/curated/en/099092823122522428/pdf/BOSIB-c8b6a4f2-ea78-49d9-b86e- 35c5e46c8414.pdf
World Bank Group (2024) “From Vision to Impact: Implementing the World Bank Group Evolution,” March, available at: https://www.devcommittee.org/content/dam/sites/devcommittee/doc/documents/2024/Final_DC2024- 0002.pdf
World Bank Group (2025) “Financing for Development: The World Bank Group’s Contribution to the International Financing for Development Agenda,” March, available at: https://documents1.worldbank.org/curated/en/099033125195015349/pdf/BOSIB-2767f77b-3270-4947-b360- 867a312b1c68.pdf
Appendix 1: Measures of MDB Securitisation Efficiency
Risk-transfer transactions release lending capacity but generally require the originating MDB to cede part of the income generated by the underlying portfolio. The economic assessment, therefore, involves comparing the reduction in required capital with the associated reduction in risk-adjusted income. Commercial banks commonly perform this comparison using a Risk-Adjusted Return on Capital (RAROC) framework. For MDBs, however, the appropriate cost of equity may be difficult to determine, while capital requirements may be driven by several internal and rating-agency methodologies. The BTC ratio provides an alternative way of presenting the same fundamental trade-off without initially requiring an explicit cost-of-equity assumption. Let denote the MDB’s pre-transaction net risk-adjusted income from the portfolio and let denote the capital required to support it. The income measure should be net of funding costs, expected losses, overheads and direct transaction costs. Let be the income ceded through the transaction and let be the capital released. Pre- and post-transaction RAROC are then:
In a RAROC calculation, the cost of risk in this context is calculated as the product of the marginal amount of Basel regulatory capital saved by the transaction multiplied by the bank’s assumed Cost of Equity. A commercial bank will determine whether a transaction adds economic value by calculating if its total benefits, including a reduction in the cost of risk offset the costs of the deal. Let denote the cost of equity. Releasing of capital saves a required return of , while the transaction reduces net income by . The transaction adds economic value when:
The BTC ratio is defined as the ratio of the percentage of Risk Weighted Assets (RWAs) saved to the percentage of spread income (over the bank’s margin) given up. Let denote pre-transaction RWAs and let denote the reduction produced by the transaction. The BTC ratio is defined as:
The natural BTC break-even condition is:
A BTC ratio above one means that the proportional RWA saving exceeds the proportional income reduction. A value of one is the break-even point for this relative efficiency measure, while a value below one means that income is being surrendered more quickly than RWAs are being reduced. To translate the RWA benefit into a capital benefit, suppose that the same capital ratio applies before and after the transaction:
Assume that the pre-transaction RAROC equals the cost of equity:
Accordingly, the RAROC and BTC criteria lead to the same transaction decision when two conditions hold:
(i) required capital remains proportional to RWAs, with the same proportionality factor applying before and after the transaction, and
(ii) the portfolio’s pre-transaction RAROC equals the MDB’s cost of equity.
The BTC break-even threshold is not necessarily one if Eq. (A1.8) does not hold. A generalised form of BTC based on the RAROC economic-value condition is:
If , the required BTC threshold is greater than one. If , the BTC threshold is below one. The simple rule should therefore be used as the RAROC break-even condition only when the assumption is reasonable.
Appendix 2: Programmatic Securitisation in Corporate Plans
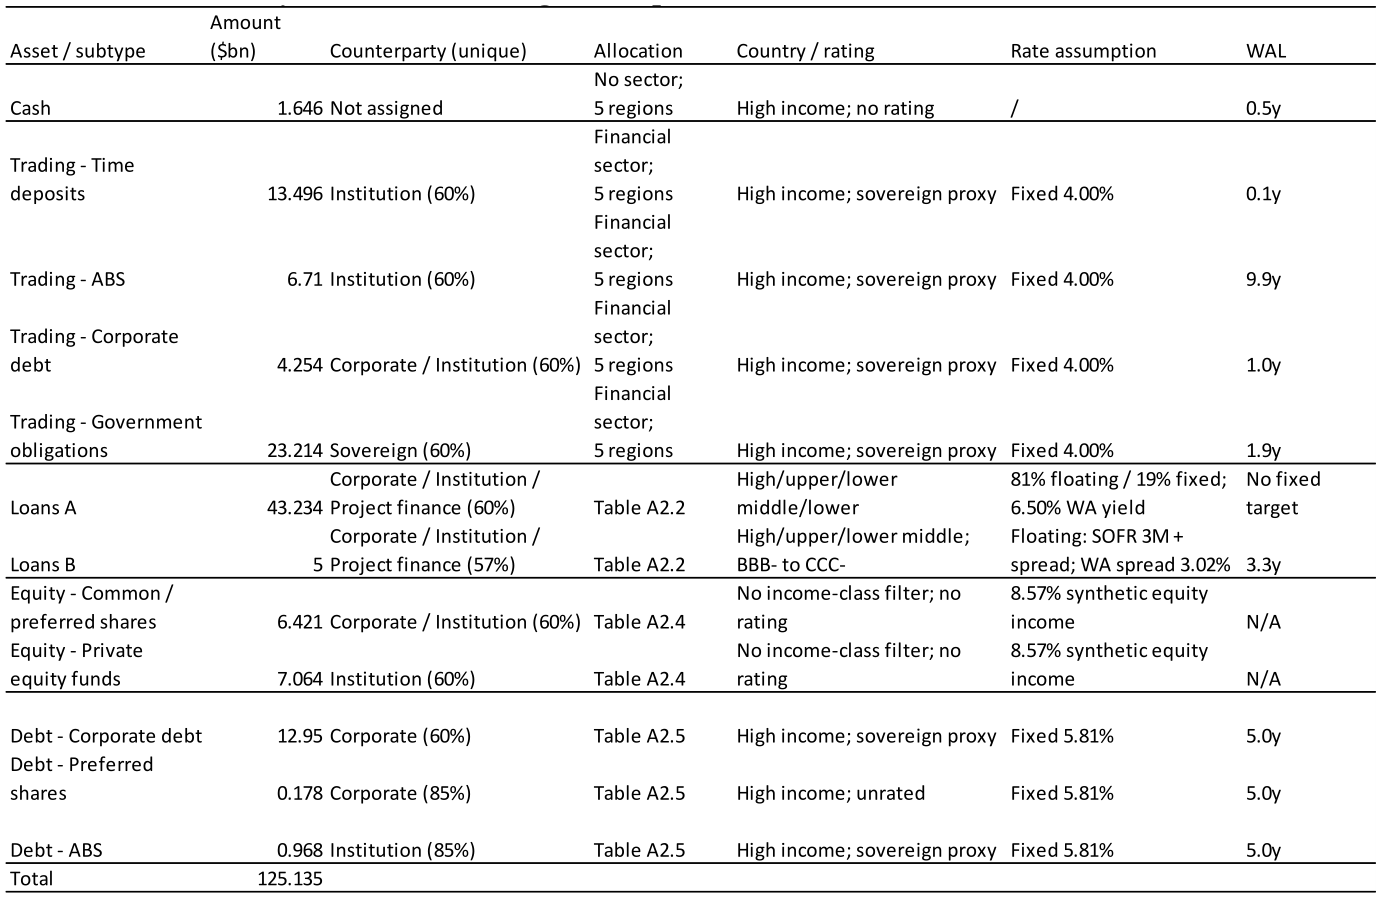
To implement the balance-sheet projection, we construct the starting asset side from the categories used in the financial model. The modelled asset book totals $125.135 billion and comprises cash, trading investments, loans, equity investments and debt securities. A detailed breakdown of the modelling assumptions is provided in Table A2.1. We will focus on discussing the construction of Loans A and Loans B, as the loan book is the principal portfolio through which the securitisation scenario affects the projected balance sheet.
The modelled loan book totals $48.234 billion, comprising $43.234 billion of Loans A and $5.0 billion of Loans B. Loans A represent the residual loan portfolio that remains on the MDB’s balance sheet, while Loans B represent the portfolio targeted for securitisation.
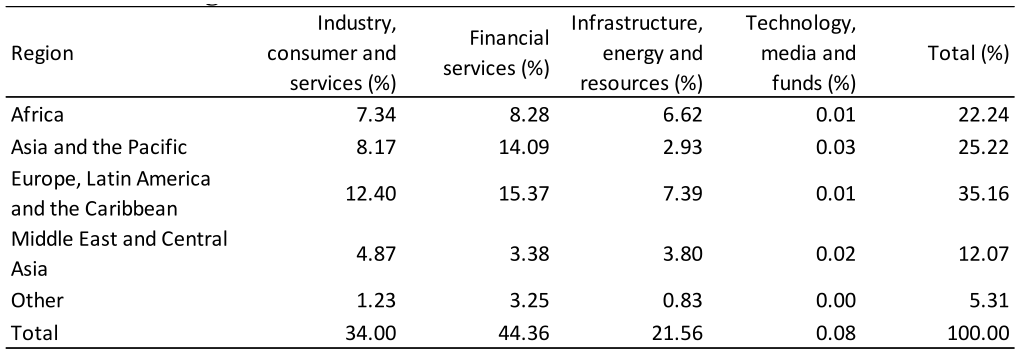
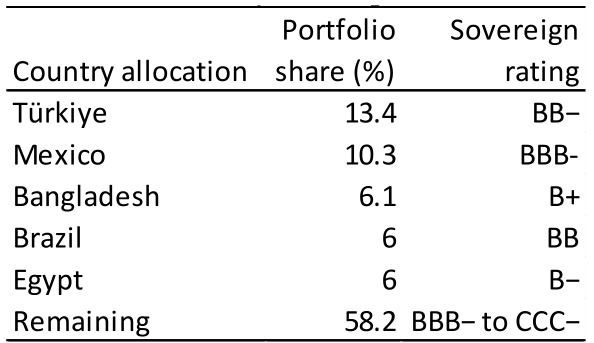
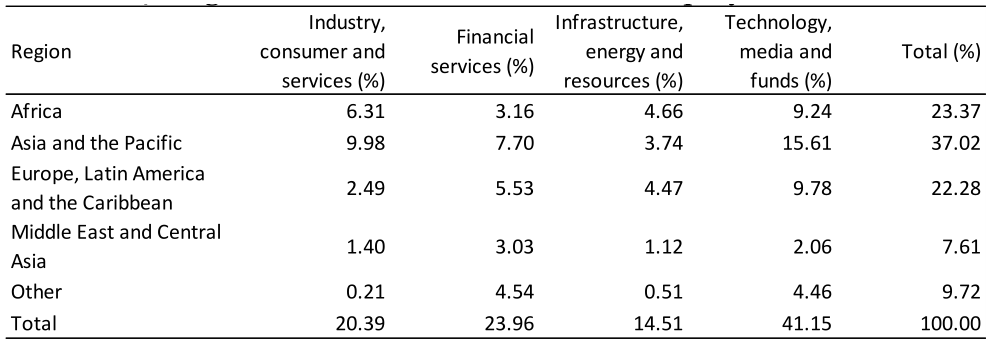
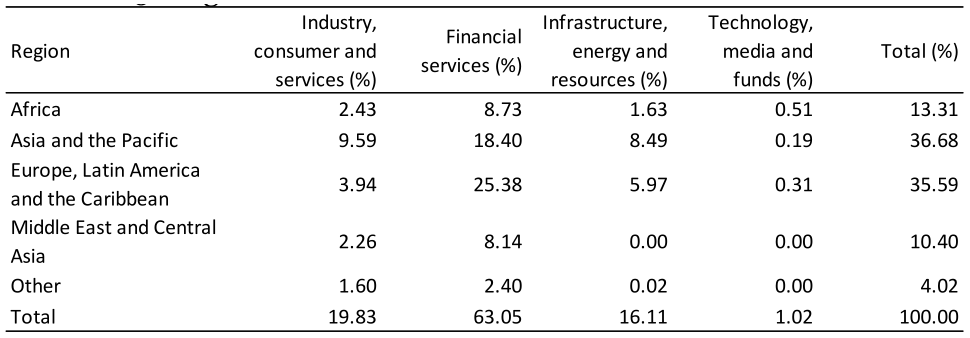
The region and broad-sector distribution in Table A2.2 applies to the total loan book. Loans B are constructed first using the separate portfolio assumptions in Table A2.3. The resulting Loans B exposures are then deducted from the region-sector targets in Table A2.2, and Loans A are generated to fill the remaining exposures.
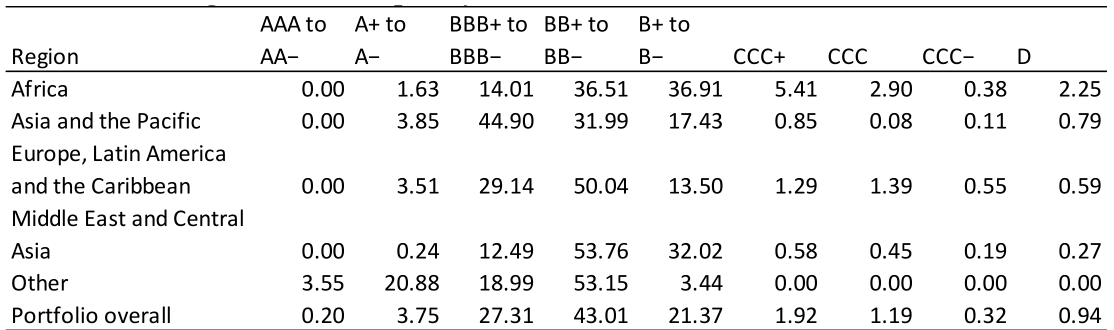
For Loans B, the selected country’s sovereign rating provides the starting point for the loan rating. Eligible sovereign ratings range from BBB− to CCC− is applied to obtain the individual loan rating. For Loans A, the regional rating distributions shown in Table A2.6 are applied to the residual portfolio. These are combined with the region-sector allocation above, so that each Loans A position is first assigned a region, sector and rating range. A country is then selected within that region, with its sovereign rating used as a constraint when assigning the exact loan rating within the required range.
The portfolios also allow multiple loans to the same borrower. Unique counterparties represent 60% of Loans A positions and 57% of Loans B positions, with counterparties classified as corporate, institutional or projectfinance borrowers.
Pricing assumptions differ between the two portfolios. Loans A comprise 81% floating-rate and 19% fixed-rate positions by number of assets. Floating-rate loans are priced over three-month SOFR, while fixed-rate loans use a 6.5% base rate. Spreads are calibrated so that the combined Loans A and Loans B portfolio achieves a 6.5% weighted-average yield. Loans B are entirely floating-rate, priced over three-month SOFR, with a portfolio weighted-average spread of 3.02%.
Loans A have staggered historical origination dates, original tenors of 10 to 12 years and annual straight-line principal amortisation beginning one year after origination. No separate WAL target is imposed on Loans A. Loans B also use staggered historical origination dates and equal annual principal repayments, but their repayment profiles are calibrated so that the portfolio has a 3.3-year weighted-average life at 31/12/2025, with between four and ten remaining principal payments.
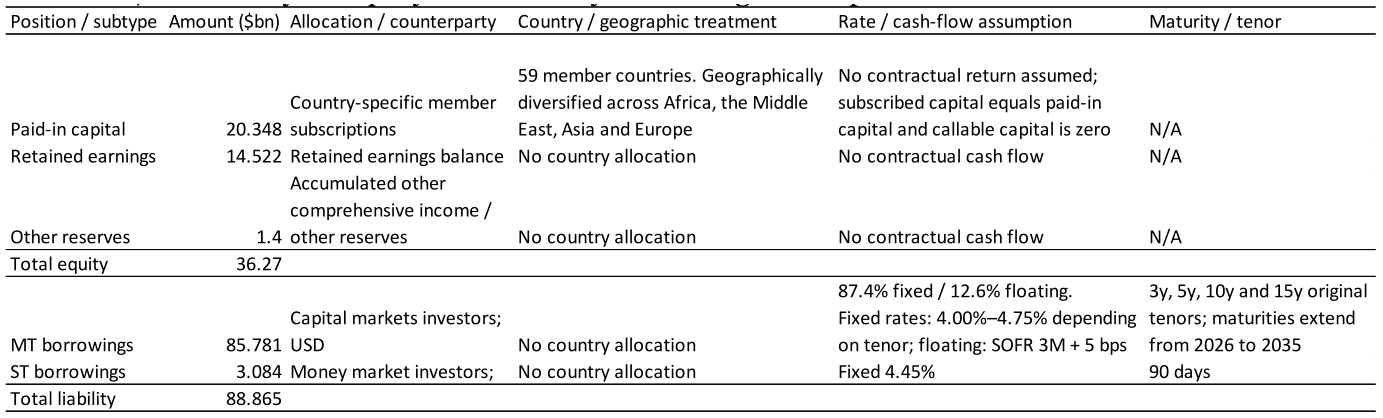
The other side of the starting balance sheet is constructed from the MDB’s equity base and market borrowings. Table A2.7 summarises the principal assumptions used for these positions. Equity comprises paid-in capital, retained earnings and other reserves, while liabilities are divided between medium- and short-term market borrowings.
The assumptions specify the composition of the equity base and the pricing, fixed/floating mix and maturity structure of the borrowing book. Together with the asset assumptions described above, these positions complete the initial $125.135 billion balance sheet and provide the funding and capital base from which the multi-period projection evolves.
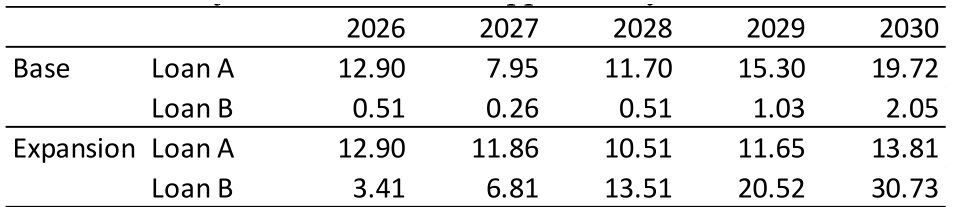
With the starting balance sheet established, the loan portfolio is projected forward by generating new Loans A and Loans B in each period. The initial annual approval amounts are based on the average level of approvals over the 3-year historical sample window, giving annual bases of USD 14.478 billion for Loans A and USD 1.704 billion for Loans B.
Scenario-specific growth assumptions are then applied to these amounts, with each subsequent year’s approvals determined relative to the preceding year. The resulting annual approval amounts used in the projections for the base case and the expansion case are shown in Table A2.8.
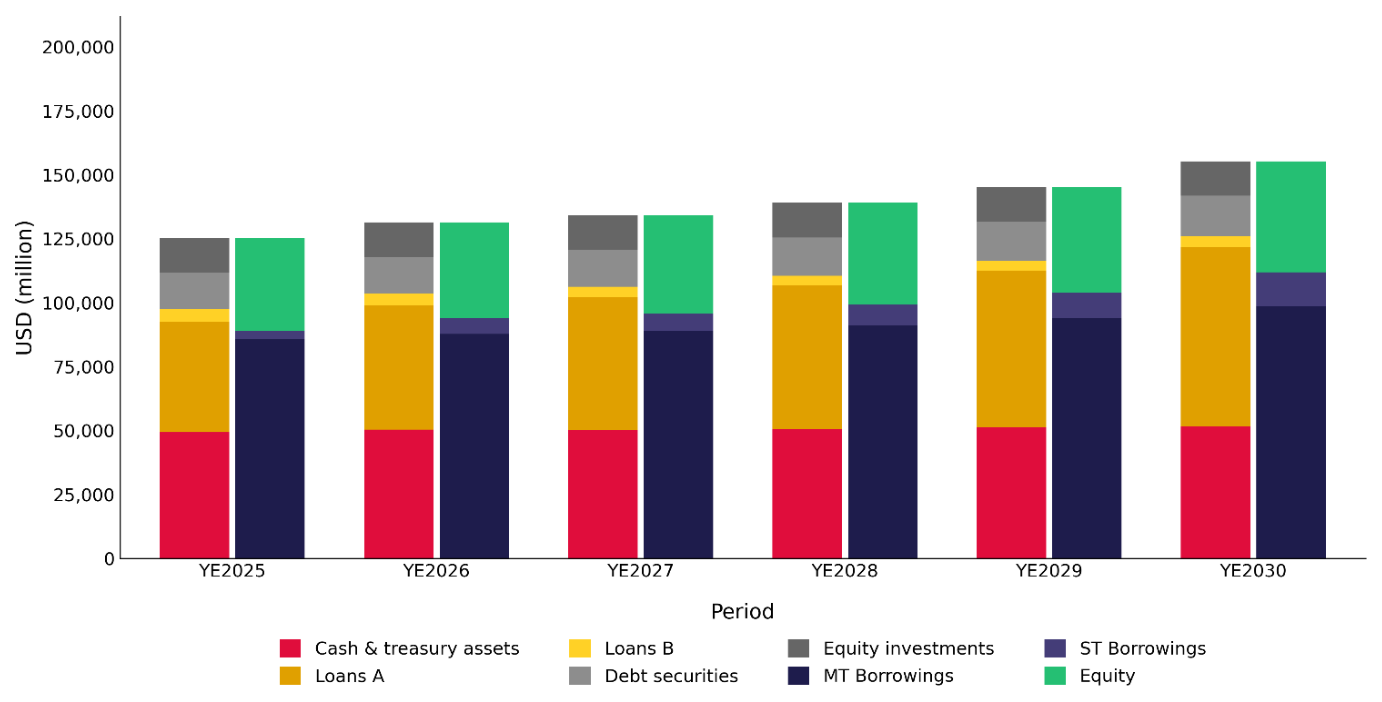
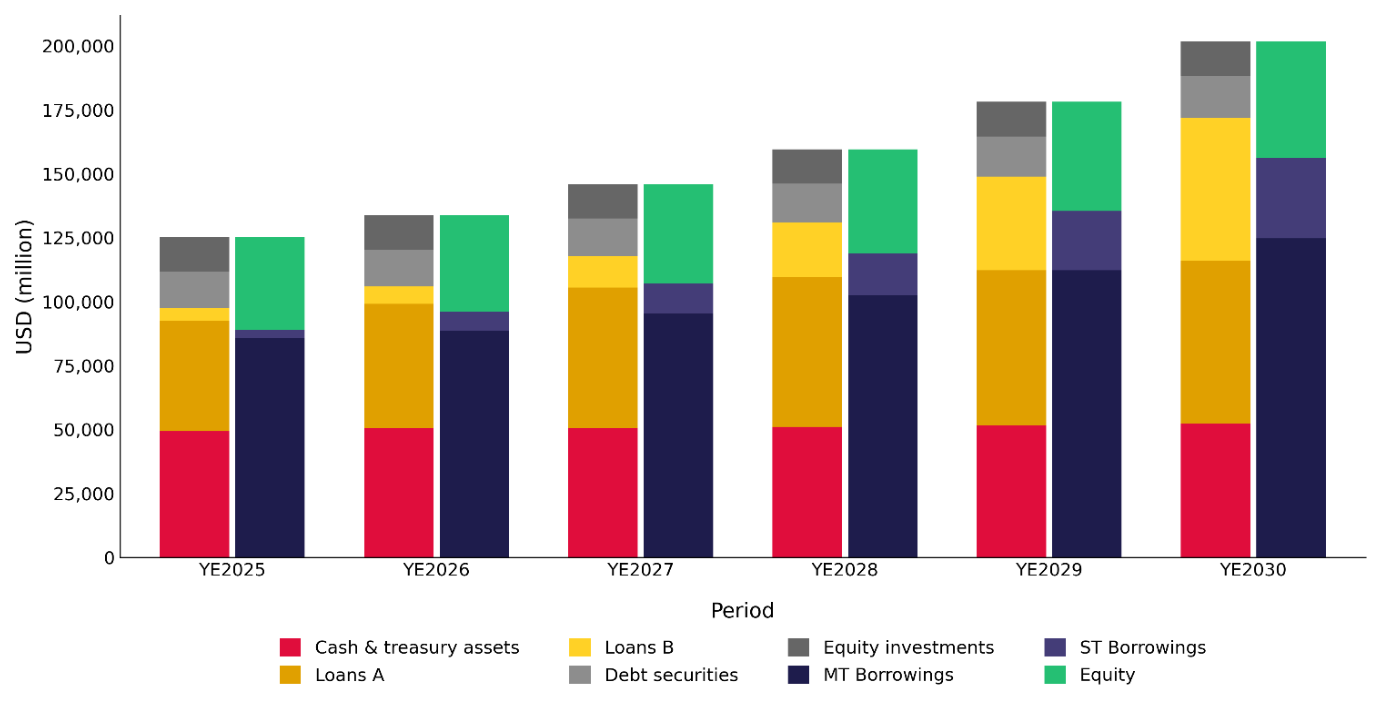
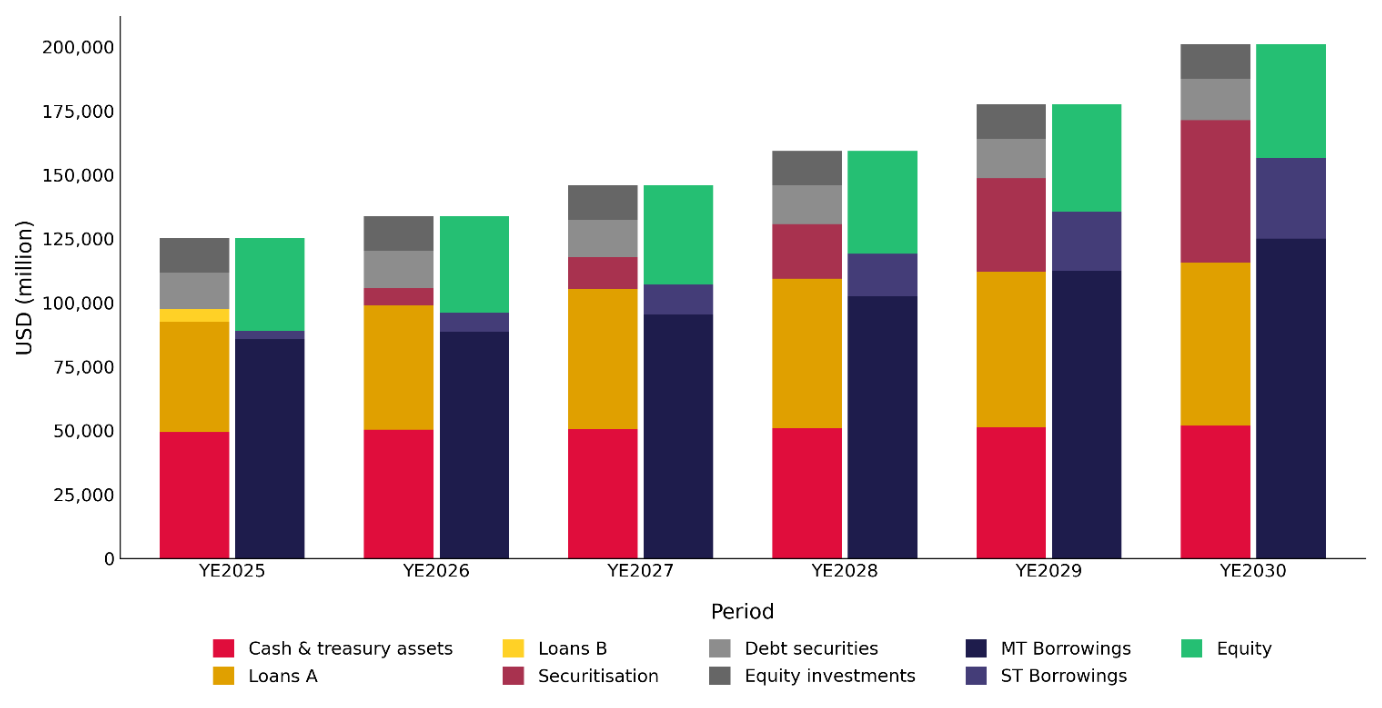
Figure A2.1, Figure A2.2, and Figure A2.3 show the evolution of the overall balance sheet under the HTM and OTS strategies. The three scenarios start from the same balance-sheet position at 31/12/2025. Thereafter, the introduction of securitisation under the Expansion strategy changes the composition of the balance sheet and creates additional capacity to support its subsequent growth.
To illustrate the mechanism underlying these differences, Figure A2.4 focuses on the treatment of the loan book. At 31/12/ 2025, Loans B remain in loan form in all three cases, as securitisation has not yet been implemented. In subsequent periods, Loans B remain as loans in the Base and Portfolio Expansion cases, whereas in the Portfolio Expansion with Securitisation case the relevant exposures are transformed into senior, mezzanine and junior securitisation positions.
Show as data
| Asset / subtype | Amount ($bn) | Counterparty (unique) | Allocation | Country / rating | Rate assumption | WAL |
|---|---|---|---|---|---|---|
| Cash | 1.646 | Not assigned | No sector; 5 regions | High income; no rating | / | 0.5y |
| Trading - Time deposits | 13.496 | Institution (60%) | Financial sector; 5 regions | High income; sovereign proxy | Fixed 4.00% | 0.1y |
| Trading - ABS | 6.71 | Institution (60%) | Financial sector; 5 regions | High income; sovereign proxy | Fixed 4.00% | 9.9y |
| Trading - Corporate debt | 4.254 | Corporate / Institution (60%) | Financial sector; 5 regions | High income; sovereign proxy | Fixed 4.00% | 1.0y |
| Trading - Government obligations | 23.214 | Sovereign (60%) | Financial sector; 5 regions | High income; sovereign proxy | Fixed 4.00% | 1.9y |
| Loans A | 43.234 | Corporate / Institution / Project finance (60%) | Table A2.2 | High/upper/lower middle/lower | 81% floating / 19% fixed; 6.50% WA yield | No fixed target |
| Loans B | 5 | Corporate / Institution / Project finance (57%) | Table A2.2 | High/upper/lower middle; BBB- to CCC- | Floating: SOFR 3M + spread; WA spread 3.02% | 3.3y |
| Equity - Common / preferred shares | 6.421 | Corporate / Institution (60%) | Table A2.4 | No income-class filter; no rating | 8.57% synthetic equity income | N/A |
| Equity - Private equity funds | 7.064 | Institution (60%) | Table A2.4 | No income-class filter; no rating | 8.57% synthetic equity income | N/A |
| Debt - Corporate debt | 12.95 | Corporate (60%) | Table A2.5 | High income; sovereign proxy | Fixed 5.81% | 5.0y |
| Debt - Preferred shares | 0.178 | Corporate (85%) | Table A2.5 | High income; unrated | Fixed 5.81% | 5.0y |
| Debt - ABS | 0.968 | Institution (85%) | Table A2.5 | High income; sovereign proxy | Fixed 5.81% | 5.0y |
| Total | 125.135 |
Show as data
| Region | Industry, consumer and services (%) | Financial services (%) | Infrastructure, energy and resources (%) | Technology, media and funds (%) | Total (%) |
|---|---|---|---|---|---|
| Africa | 7.34 | 8.28 | 6.62 | 0.01 | 22.24 |
| Asia and the Pacific | 8.17 | 14.09 | 2.93 | 0.03 | 25.22 |
| Europe, Latin America and the Caribbean | 12.40 | 15.37 | 7.39 | 0.01 | 35.16 |
| Middle East and Central Asia | 4.87 | 3.38 | 3.80 | 0.02 | 12.07 |
| Other | 1.23 | 3.25 | 0.83 | 0.00 | 5.31 |
| Total | 34.00 | 44.36 | 21.56 | 0.08 | 100.00 |
Show as data
| Country allocation | Portfolio share (%) | Sovereign rating |
|---|---|---|
| Türkiye | 13.4 | BB− |
| Mexico | 10.3 | BBB- |
| Bangladesh | 6.1 | B+ |
| Brazil | 6 | BB |
| Egypt | 6 | B− |
| Remaining | 58.2 | BBB− to CCC− |
Note: The Loans B portfolio comprises 28 countries in total. The remaining countries are drawn from eligible high-, upper-middle- and lower-middleincome countries within the permitted sovereignrating range.
Show as data
| Region | Industry, consumer and services (%) | Financial services (%) | Infrastructure, energy and resources (%) | Technology, media and funds (%) | Total (%) |
|---|---|---|---|---|---|
| Africa | 6.31 | 3.16 | 4.66 | 9.24 | 23.37 |
| Asia and the Pacific | 9.98 | 7.70 | 3.74 | 15.61 | 37.02 |
| Europe, Latin America and the Caribbean | 2.49 | 5.53 | 4.47 | 9.78 | 22.28 |
| Middle East and Central Asia | 1.40 | 3.03 | 1.12 | 2.06 | 7.61 |
| Other | 0.21 | 4.54 | 0.51 | 4.46 | 9.72 |
| Total | 20.39 | 23.96 | 14.51 | 41.15 | 100.00 |
Show as data
| Region | Industry, consumer and services (%) | Financial services (%) | Infrastructure, energy and resources (%) | Technology, media and funds (%) | Total (%) |
|---|---|---|---|---|---|
| Africa | 2.43 | 8.73 | 1.63 | 0.51 | 13.31 |
| Asia and the Pacific | 9.59 | 18.40 | 8.49 | 0.19 | 36.68 |
| Europe, Latin America and the Caribbean | 3.94 | 25.38 | 5.97 | 0.31 | 35.59 |
| Middle East and Central Asia | 2.26 | 8.14 | 0.00 | 0.00 | 10.40 |
| Other | 1.60 | 2.40 | 0.02 | 0.00 | 4.02 |
| Total | 19.83 | 63.05 | 16.11 | 1.02 | 100.00 |
Show as data
| Region | AAA to AA− | A+ to A− | BBB+ to BBB− | BB+ to BB− | B+ to B− | CCC+ | CCC | CCC− | D |
|---|---|---|---|---|---|---|---|---|---|
| Africa | 0.00 | 1.63 | 14.01 | 36.51 | 36.91 | 5.41 | 2.90 | 0.38 | 2.25 |
| Asia and the Pacific | 0.00 | 3.85 | 44.90 | 31.99 | 17.43 | 0.85 | 0.08 | 0.11 | 0.79 |
| Europe, Latin America and the Caribbean | 0.00 | 3.51 | 29.14 | 50.04 | 13.50 | 1.29 | 1.39 | 0.55 | 0.59 |
| Middle East and Central Asia | 0.00 | 0.24 | 12.49 | 53.76 | 32.02 | 0.58 | 0.45 | 0.19 | 0.27 |
| Other | 3.55 | 20.88 | 18.99 | 53.15 | 3.44 | 0.00 | 0.00 | 0.00 | 0.00 |
| Portfolio overall | 0.20 | 3.75 | 27.31 | 43.01 | 21.37 | 1.92 | 1.19 | 0.32 | 0.94 |
Note: Values are percentages.
Show as data
| Position / subtype | Amount ($bn) | Allocation / counterparty | Country / geographic treatment | Rate / cash-flow assumption | Maturity / tenor |
|---|---|---|---|---|---|
| Paid-in capital | 20.348 | Country-specific member subscriptions | 59 member countries. Geographically diversified across Africa, the Middle East, Asia and Europe | No contractual return assumed; subscribed capital equals paid-in capital and callable capital is zero | N/A |
| Retained earnings | 14.522 | Retained earnings balance | No country allocation | No contractual cash flow | N/A |
| Other reserves | 1.4 | Accumulated other comprehensive income / other reserves | No country allocation | No contractual cash flow | N/A |
| Total equity | 36.27 | ||||
| MT borrowings | 85.781 | Capital markets investors; USD | No country allocation | 87.4% fixed / 12.6% floating. Fixed rates: 4.00%–4.75% depending on tenor; floating: SOFR 3M + 5 bps | 3y, 5y, 10y and 15y original tenors; maturities extend from 2026 to 2035 |
| ST borrowings | 3.084 | Money market investors; | No country allocation | Fixed 4.45% | 90 days |
| Total liability | 88.865 |
Show as data
| 2026 | 2027 | 2028 | 2029 | 2030 | ||
|---|---|---|---|---|---|---|
| Base | Loan A | 12.90 | 7.95 | 11.70 | 15.30 | 19.72 |
| Loan B | 0.51 | 0.26 | 0.51 | 1.03 | 2.05 | |
| Expansion | Loan A | 12.90 | 11.86 | 10.51 | 11.65 | 13.81 |
| Loan B | 3.41 | 6.81 | 13.51 | 20.52 | 30.73 |
Note: Amounts in USD billions.
Note: Each period shows total assets (left bar) and total liabilities and equity (right bar).
Note: Each period shows total assets (left bar) and total liabilities and equity (right bar).
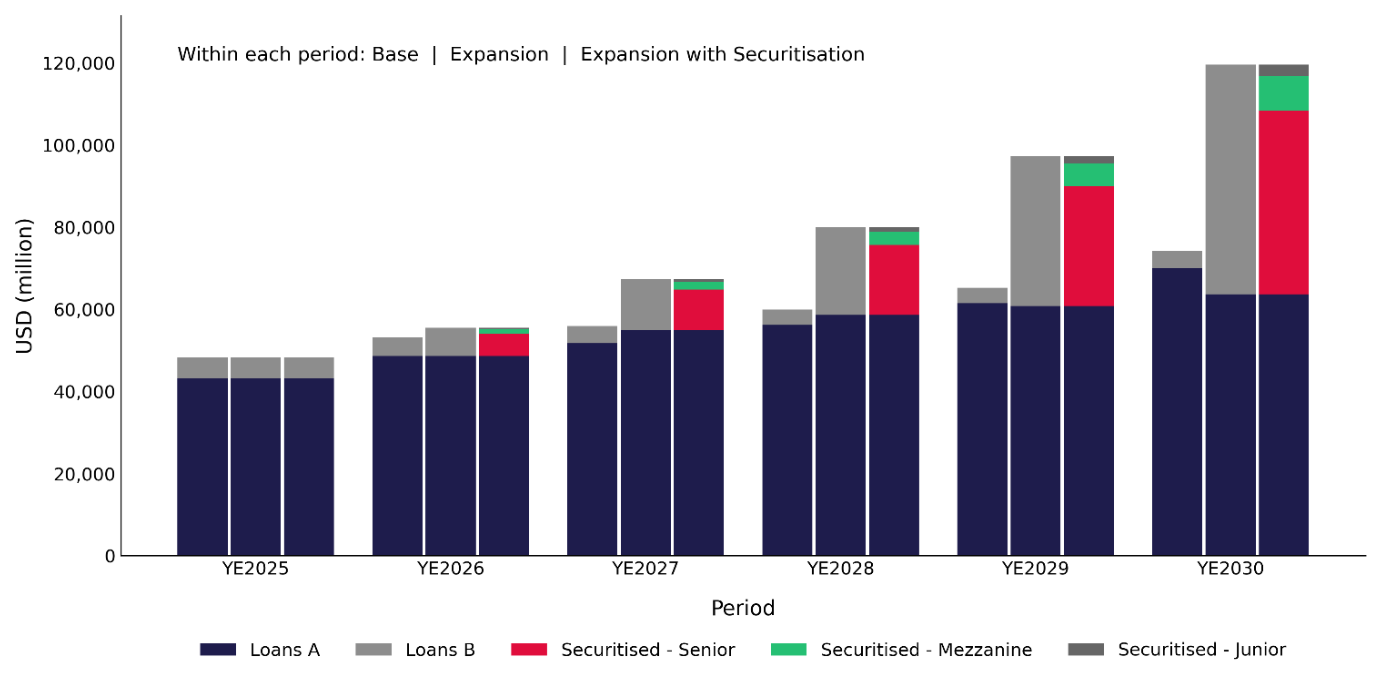
Note: Within each period, the bars from left to right represent the Base, Portfolio Expansion, and Portfolio Expansion with Securitisation cases. In the securitisation case, the relevant Loans B exposures are transformed into senior, mezzanine and junior securitisation positions.
Notes
[1] This study is an independent research paper prepared by Risk Control. The analysis and conclusions it contains do not necessarily represent the views of FCDO or SECO which commissioned the research.
[2] In turn, increased RoE can boost capital permitting greater lending or be deployed in concessional resources for borrower countries.
[3] Even the approaches proposed by PWYF omit private sector financing catalysed by DFIs but in which the DFIs are not directly involved. Giulia Lotti and Andrea Presbitero suggest the following: 1. An MDB’s presence in a particular country or sector can attract private financing by virtue of its presence signalling potential investment prospects. 2. The long-term engagement in a country or sector of MDBs can help foster macroeconomic stability, economic growth and an environment welcoming to investors, enticing private entities to lend in that region/sector. 3. MDBs can mobilise private resources by providing mitigation of political and credit risks.
[4] Risk Control (2024a) and Risk Control (2026a) argue that MDBs involved in innovative financial transactions can initiate follow on deals by demonstrating to private sector investors how obstacles can be overcome or that risk-return trade-offs are more favourable than they initially appear.
[5] The comments on transition in BII (2023) are mainly aimed at bilateral DFIs in that they emphasise the need to build financial and risk competence and to develop contacts with investors. While these are indeed part of the challenges MDBs face, multilateral banks typically already have sophisticated finance and risk activities and in deciding to pursue an OTS strategy do not have to build such approaches from scratch (although new activities are necessary).
[6] Initial costs, recurring servicing and trustee fees and the funding of an interest reserve further reduced the income available to the junior position.