

This report provides a unified summary of the outputs of a project completed by Risk Control on behalf of the MOBILIST programme of the United Kingdom’s Foreign, Commonwealth and Development Office (FCDO). The objective of the project is to develop a scoring approach for evaluating the demonstration effects of development finance transactions in which FCDO engages. These transactions generate direct development impact through the financing FCDO provides and mobilisation impact through investment by private-sector entities.
Executive Summary
This report provides a unified summary of the outputs of a project completed by Risk Control on behalf of the MOBILIST programme of the United Kingdom’s Foreign, Commonwealth and Development Office (FCDO). The objective of the project is to develop a scoring approach for evaluating the demonstration effects of development finance transactions in which FCDO engages. These transactions generate direct development impact through the financing FCDO provides and mobilisation impact through investment by private-sector entities.
A third development-impact contribution that FCDO wishes to assess is the ‘demonstration effect’ of supported transactions. This captures whether, and to what extent, transactions involving FCDO or other Development Finance Institutions (DFIs) are replicated by other organisations, leading to additional financial activity that occurs independently of DFI participation. Demonstration effects of innovative approaches to development finance could represent a powerful channel for FCDO or other DFIs to advance their development agenda without requiring their own continuing financial participation.
An earlier study by Risk Control on behalf of FCDO (see Risk Control (2024)) developed the notion of financial demonstration effects and described how they were reflected in a set of innovative transactions. Risk Control (2024), in turn, built on an earlier paper by MOBILIST (2023) which discussed the idea of Originate to Demonstrate (OTD). The example transactions considered in Risk Control (2024) included both development finance transactions involving DFIs and purely private-market transactions in developed markets which, through striking innovations, had succeeded (or in some cases failed) to create significant new volumes of financing.
To organise thinking about demonstration effects and to make the analysis of such effects operational, Risk Control (2024) proposed an ex-ante scoring approach that a DFI could use to rank different transactions for the degree to which they could be expected to generate financing volumes entirely through demonstration effects. The ex-ante scoring, implemented through a structured decision tree reminiscent of rating agency credit rating methodologies, was intended for use when transactions are under initial consideration. Inputs to the scoring approach, therefore, consisted of information available before a transaction closes.
Complementary to such ex-ante scoring is an ex-post approach in which transactions are assessed based on the degree to which they create follow-on development finance activity. Ex post scoring is based on realised outcomes rather than indicators available before deal closing. The most obvious such ex-post scoring inputs are realised financing volumes (adjusted to reflect the extent to which the initial transaction caused subsequent financing volumes). The development quality of the transaction should also be reflected in the assessment. In addition, market awareness of the transaction should be included as a separate and potentially quantifiable factor since the volume impact of a deal will be reinforced and magnified by the creation of widely disseminated information.
This study sets out the ex-post demonstration effect scorecard we propose. It consists of a structured decision tree combining quantitative and qualitative elements. The methodology is use to score a subset of the transactions considered in Risk Control (2024). Comparisons are presented between the ex-ante and ex-post scores obtained by these transactions using the scoring frameworks we have proposed. The study also provides a user guide to the scoring approach and suggested reporting formats.
The primary quantitative elements in the ex-post scoring are: (a) data on follow-on deal volumes and the development quality (the degree to which follow-on activity expands access to finance in lower-income and underserved markets) of the follow-on deals and (b) the output of an artificial intelligence (AI) tool constructed by Risk Control for assessing the market awareness and sentiment vis-à-vis development finance transactions for the purpose of ex-post demonstration effect scoring.
Note that the ex-ante and ex-post scoring approaches differ in the sense that the ex-post framework serves to evaluate observable outcomes sometime after the initial transaction has been completed, whereas the ex-ante approach serves to rank transactions based on factors that are predictive of future realised outcomes. Hence, while the two approaches stem from a common intellectual understanding of demonstration effects, they employ different variables and indicators.
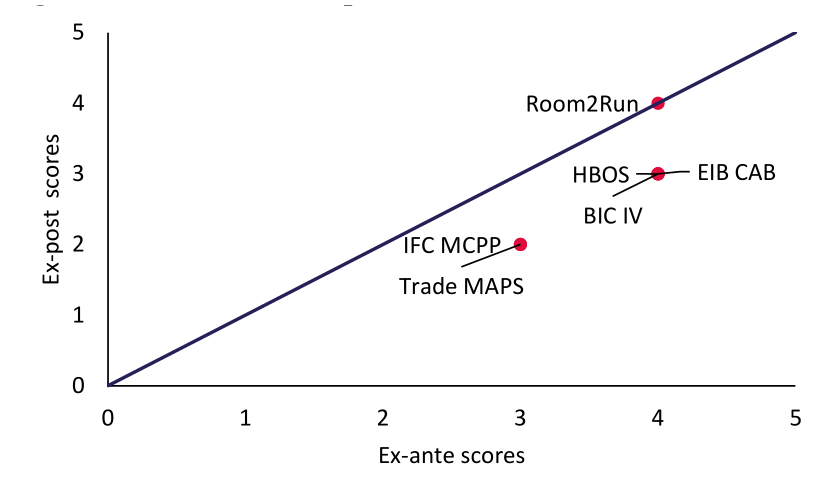
Applying the ex-post scorecard to the six case studies yields a score of 4 for Room2Run (2018), 3 for the HBOS structured covered bond programme (2003), the EIB Climate Awareness Bond (2007) and Bayfront Infrastructure Capital IV (2023), and 2 for IFC’s MCPP (2013) and Trade MAPS (2013) (see Figure ES1.1).
The principal methodological conclusion is that ex-ante scores exceed ex-post scores for most of the sample. The divergence arises largely because ex-ante scoring credits a transaction’s full potential follow-on activity, whereas ex-post scoring discounts realised volumes by the estimated causal contribution of the reference deal. Bringing the counterfactual test that anchors the ex-post causality adjustment into the ex-ante stage is the most direct remedy.
The scorecard is intended to inform ex-post evaluation and external reporting of completed transactions, and to provide a feedback loop that calibrates the ex-ante scoring used in selection and, where relevant, pricing decisions. It also supports monitoring within the observation window, since interim scores identify where a transaction’s demonstration effect may still be strengthened. It is not intended to serve as a stand-alone investment criterion.
Several limitations bear on that use. The sample of six transactions is too small to calibrate ex-ante against expost scores. Causality is judged against a counterfactual that cannot be observed, and no transactor was found to have cited a reference deal as its reason for acting. The awareness measure relies on documents retrievable through public search engines, so it understates coverage of older transactions. Several sub-indicators are binary, so transactions with very different levels of recognition score alike. Bayfront Infrastructure Capital IV also remains inside the observation window, so its score is provisional.
1. Introduction
Development finance institutions (DFIs), both bilateral and multilateral, have long been expected to play a role that goes beyond providing capital to individual projects. Their broader development rationale is increasingly tied to the ability of their transactions to mobilise private finance, reduce market frictions, and support the growth of sectors, firms, and markets that might otherwise remain underfunded. In this context, a central concept in the DFI literature is the demonstration effect.
Demonstration effects arise when a DFI-backed transaction reduces informational barriers and encourages follow-on transactions that replicate the original approach without the DFI being directly involved (MOBILIST (2023)). They are important because they capture a wider market response to catalytic finance, not merely the output of the original deal.[1]
The demonstration effects examined in this study are the consequence of innovative financial transactions that led to follow on deals by other market participants. They should be distinguished from the broader set of demonstration effects relevant for development, such as the use of new technologies or innovative forms of economic organisation or activity.
Consistent with the ex-ante and ex-post frameworks developed in this study, demonstration effects are assessed across three dimensions: financing volume (the extent of replication and capital mobilisation), development quality (the degree to which follow-on activity expands access to finance in lower-income and underserved markets), and market awareness (the visibility, credibility, and signalling value generated through market recognition, ratings, publications, listings, and industry awards).
The idea that a transaction can have effects beyond its immediate participants is not new. The wider economics literature has long recognised that investments can generate behavioural and informational spillovers, following the classic contribution of Shackle and Duesenberry (1951). The concept has since been tested empirically across several literatures. Cox and Stark (1994) formalise it in household behaviour, while Barry, Görg and Strobl (2003) and Fang et al (2023) examine whether foreign direct investment generates demonstration effects on domestic firms in host economies. Mitrut and Wolff (2009) provide a causal test of the theory.
In development finance, DFIs have also referred to demonstration effects for many years as part of the impact they aim to create, including in multilateral development bank practice (Multilateral Development Banks (2017)).
However, while the concept is widely used, the way it is measured and evaluated has remained uneven. Some DFIs focus primarily on direct development outcomes, others on additionality, and others on mobilisation, with demonstration effects often discussed more as an aspiration than as a systematically assessed outcome. Mobilisation itself is now measured on a common basis, through the DAC methodologies (OECD (2020, 2023)) and the joint MDB reporting on private finance mobilised (Multilateral Development Banks (2023)), and Publish What You Fund (2024) proposes a more granular disclosure standard. Broccolini et al (2019) and Lotti and Presbitero (2019) estimate the mobilisation effects of MDB syndicated lending empirically, and Inderst
(2021) reviews the institutional investor side. Demonstration effects have no comparable measurement standard, which is the gap this paper addresses.
Several studies have examined demonstration effects in the context of how multilateral development banks evaluate projects. Massa (2011), in a study of MDB financing at country and sector level, reviews the project evaluation approaches used by several DFIs and notes that only the European Investment Bank (EIB) explicitly includes demonstration effects as one of seven sub-categories of economic performance.
This is significant because it suggests that, even where demonstration effects are recognised conceptually, they are not always given a distinct or measurable place within evaluation frameworks. Arvanitis, Stampini and Vencatachellum (2015) provide another useful perspective by examining how an MDB may combine credit risk and development impact in assessing projects.
Their analysis of 121 non-sovereign guaranteed projects under the African Development Bank’s Additionality and Development Outcomes Assessment (ADOA) framework between 2008 and 2013 shows that the framework is focused on development impact and additionality, but it also raises questions about how far such systems capture broader market or replication effects.
The World Bank Group's Independent Evaluation Group reached a similar conclusion in its review of Bank Group approaches to mobilising private capital, finding that catalytic effects are asserted more often than they are measured (WBG-IEG (2020)). Hetherington et al (2019) evaluate FCDO's own private finance programmes specifically through the lens of demonstration effects.
Taken together, these studies indicate that demonstration effects are recognised within MDB practice, yet the mechanisms for identifying them remain limited and not fully standardised.
The IFC offers a more developed example of how an MDB gives demonstration effects an explicit place within an impact measurement framework. IFC’s Anticipated Impact Measurement and Monitoring system (AIMM; IFC (2026b)) assigns ratings and scores to projects across two dimensions: project outcomes and market outcomes, adjusted for risk. Within this, IFC defines demonstration effects as a channel through which innovative aspects of a project translate into wider market effects. In other words, when an IFC-backed project introduces an innovation, it may encourage other market players to replicate it, particularly where it brings international standards, good practice, or efficiency gains.
The strength of such effects is tied to scalability, which IFC links to the innovation's visibility in the market alongside enabling conditions such as low barriers to entry, customer demand, and local capacity to adopt it. Thus, while the mechanisms for identifying demonstration effects across MDBs remain limited and not fully standardised, IFC is among the institutions that have moved toward defining and assessing them in a relatively explicit way.
More recent contributions have strengthened the case for treating demonstration effects as a more central part of DFI impact. Carter (2021) argues that investments can have economy-wide effects when they generate knowledge that other firms can adopt, leading to further investment. He also notes that DFIs often refer to this process as a demonstration effect, particularly when their involvement helps establish standards in areas such as business integrity and environmental, social and governance (ESG) practice.
MOBILIST (2023) develops this argument further by linking demonstration effects to informational gains in listed markets. It suggests that development finance transactions in listed markets can create durable public information streams about risks and returns in emerging and developing economies, helping to correct investor misperceptions and information asymmetries. In this way, demonstration transactions may trigger follow-on commercial investment without requiring additional official sector capital to remain tied up in the market.
Recently, there has been considerable innovation in risk transfer transactions by multilateral development banks (MDBs). In some cases, these transactions employ listed securities (see recent Collateralised Loan Obligations (CLOs) issued by IFC). In other cases, including the Room2Run deal of the African Development Bank (AfDB), the transactions employ private markets. The objective of these MDBs, apart from their own riskmanagement or direct-mobilisation aims, has been to create an asset class of MDB loans and to encourage a wider set of investors to bear EMDE risk. Hence, demonstration effects have certainly been an objective, whether stated explicitly or inferred from transaction objectives, of these MDBs.
Gregory (2023) takes stock of these innovations across MDBs and DFIs, and the GPEDC MDB working group
(2019) sets out the private sector engagement principles under which they operate. IFC (2017) describes the institutional investor demand these structures are intended to reach.
The growing emphasis on demonstration effects creates a methodological challenge: how should they be assessed after the fact? DFIs increasingly need to show not only whether a project was financed and implemented, but also whether it changed market behaviour, encouraged replication, or attracted later private capital. Yet most DFIs do not publish a common retrospective framework for assessing such effects, and the methods that do exist remain institution specific. As a result, demonstration effects are often acknowledged in principle but are not consistently captured in practice. This creates a gap between the language of catalytic impact and the tools available to measure it.
This paper addresses that gap by examining how a retrospective framework for demonstration effects might be structured using existing DFI practice and evaluation principles. The demonstration-effects channel within IFC’s AIMM system is one relevant example. IFC does not publish a separate name for its post-transaction assessment of demonstration effects; the approach is set out in the AIMM guidance note (see IFC (2026b)).
It can be understood as a mechanism for assessing whether IFC-backed transactions generated observable market validation, reduced perceived risk, and catalysed follow-on private capital. Rather than relying on a single summary score, it focuses on tracing evidence of follow-on investment, learning effects, and whether the original transaction helped validate a business model or market segment (see Castalia Strategic Advisors (2011)). This makes it useful as a reference point for retrospective analysis because it connects project-level intervention to wider market outcomes.
The purpose of this paper is therefore to develop an approach that can translate the logic of catalytic DFI transactions into a retrospective evaluation framework. The paper is motivated by the need to move beyond simple mobilisation counts or direct project outputs and toward a more complete assessment of whether DFI interventions generate durable market effects. In doing so, it aims to connect institutional practice, evaluation theory, and the specific needs of FCDO for a framework that can be applied consistently across transactions. The paper contributes to the literature by bringing together the concepts of demonstration, additionality, mobilisation, and ex-post evaluation within a single analytical structure.
The paper addresses four research questions. First, on replication, to what extent did each reference transaction give rise to follow-on and neighbourhood financing activity undertaken without the original transactor? Second, on attribution, how much of that activity can plausibly be attributed to the reference transaction rather than to market developments that would have occurred in any event? Third, on development quality, where did the resulting activity occur and how much credit risk did private participants assume? Fourth, on market awareness, what visibility, recognition and sentiment did the transaction generate, and did that visibility persist beyond the issuance period?
The report is organised as follows. Section 2 sets out the conceptual framework for assessing demonstration effects, reviewing the ex-ante methodology developed previously and introducing the ex-post scorecard proposed in this study. Section 3 provides guidance on the data collection and analytical processes required to implement the framework. Section 4 applies the framework to a set of transaction case studies and presents evidence on their realised demonstration effects. Section 5 compares ex-ante expectations with ex-post outcomes and evaluates the performance of the scoring approach. Section 6 presents the proposed reporting architecture, including the Excel-based scorecard and dashboard tools. Section 7 concludes and discusses the implications for future demonstration-effect assessment.
2. Scoring Methodology
2.1 Introduction
This section sets out the methodology developed for ex-post scoring of demonstration effects and explains how this relates to the ex-ante scorecard described in Risk Control (2024). The ex-ante and ex-post approaches, while closely related, differ in a key aspect. The ex-post view seeks to quantify realised follow-on financing volumes and their quality in several dimensions. It also includes some measures of market awareness since these are central to the growth in financing volumes attributable to demonstration effects. In contrast, the exante scoring evaluates factors that are thought to be predictive of subsequent realised demonstration effects.
Before describing the scoring approaches developed in this study, it is helpful to review general considerations on scoring approaches proposed by regulators. Regulatory guidance on scoring approaches that combine quantitative and judgmental (or qualitative) elements emphasises the importance of employing carefully structured rules typically in the form of a decision tree. Credit-assessment by rating agencies increasingly uses this type of approach to ensure that two analysts performing the same scoring exercise are likely to arrive at the same qualitative rating grade.
The scoring framework applied in this assessment draws on the principle of structured supervisory judgement, as codified and practised by the European Central Bank (ECB) in its Supervisory Review and Evaluation Process (SREP). The SREP seeks to ensure consistency across supervisory assessments while requiring supervisors to exercise judgement and account for the characteristics and complexity of individual institutions. Accordingly, the methodology follows the principle of constrained judgement, whereby assessments are anchored in a common set of quantitative and qualitative indicators but allow informed judgement to reflect transaction-specific circumstances. In this way, the framework balances consistency and comparability with the flexibility required to assess heterogeneous transactions (see ECB (2025)).
Below, we (i) briefly review the ex-ante scorecard from Risk Control (2024), (ii) describe the ex-post scorecard developed in this study, (iii) explain the weighting scheme used in combining subsidiary scores as one moves through the decision tree, and (iv) provide guidance on the qualitative choices that an analyst employing the scorecard must consider.
Consistent with the principle of constrained judgement, each element of the scorecard serves as a structured assessment anchor while allowing analyst judgement to reflect transaction-specific evidence. The framework combines quantitative measures, such as financing volumes and defined scoring thresholds, with qualitative assessments of causality, development quality and market context. This approach seeks to balance consistency and comparability across transactions with the flexibility needed to assess heterogeneous financial structures.
The ex-post score is intended to support four uses. It provides a structured basis for the ex-post evaluation of completed transactions and for external reporting of their demonstration effects. It supports monitoring within the observation window, since interim scores identify the dimensions on which a transaction's demonstration effect might still be strengthened. It provides a feedback loop into the ex-ante framework, since paired ex-ante and ex-post scores reveal which predictive assumptions prove over-optimistic and allow the ex-ante guidance to be refined. And, through that feedback loop, it informs the selection and, where relevant, the pricing decisions in which the ex-ante score is used. The ex-post score is not intended to serve as a stand-alone investment criterion, and it is not a measure of a transaction's overall development impact, which the direct and mobilisation channels capture separately.
2.2 Ex-ante demonstration effect scoring
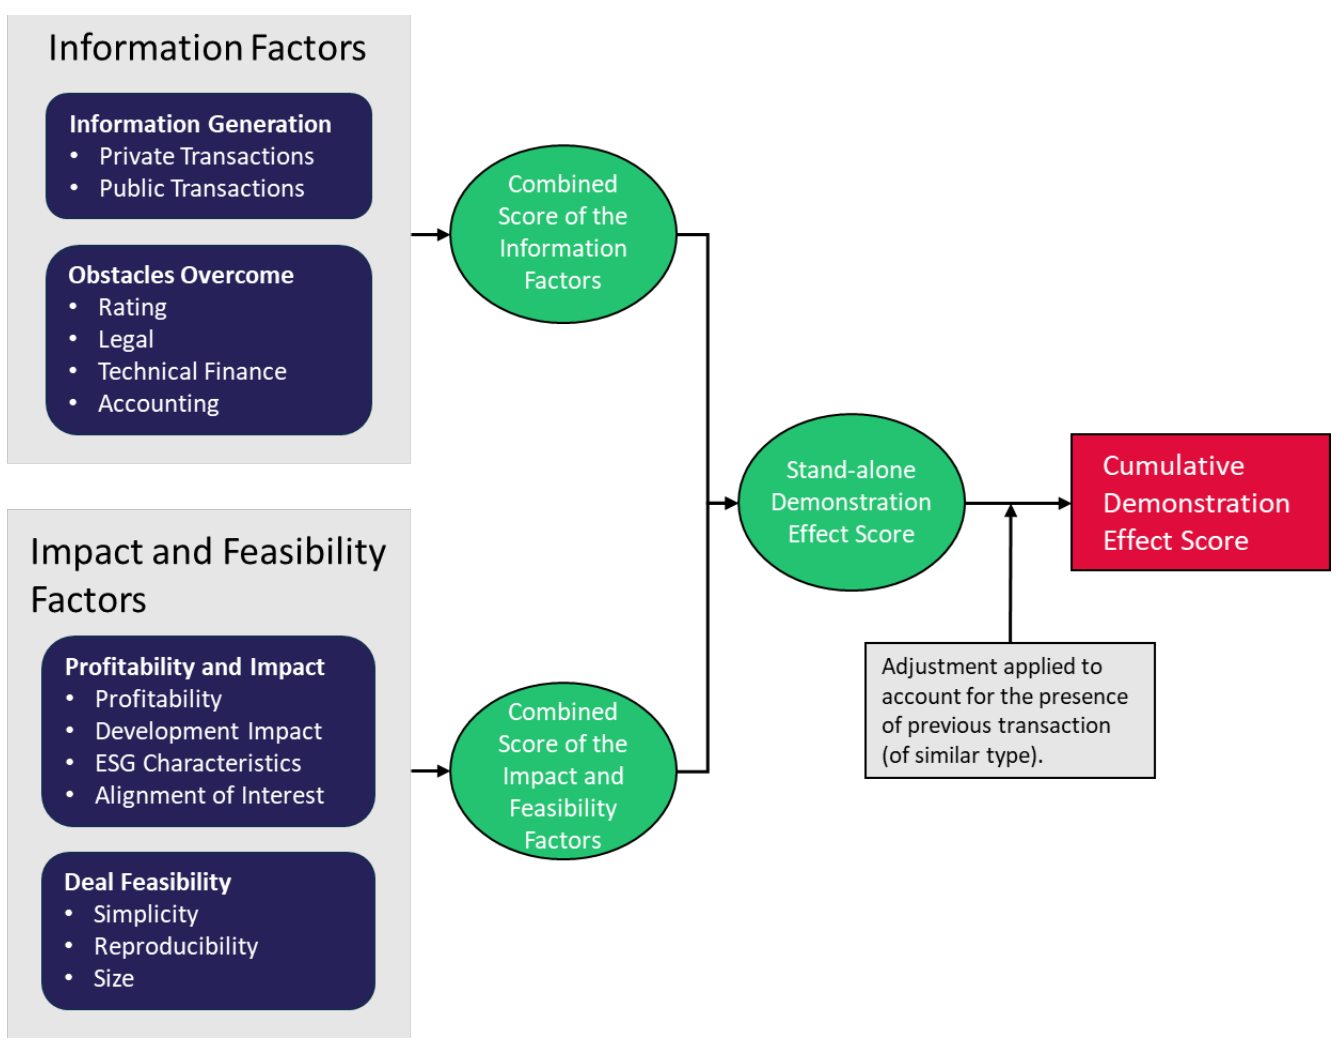
Prior work by Risk Control (2024) developed a structured ex-ante scorecard (see Figure 2.1) to assess whether a transaction is likely to generate meaningful demonstration effects before execution. The framework evaluates two core dimensions:
1. The extent to which the transaction generates new market information and overcomes identifiable barriers (dimensions: information generation, obstacles overcome).
2. Its commercial viability, development impact, and replicability (dimensions: profitability and impact, deal feasibility).
These elements are combined into a cumulative demonstration effect score and then reduced where comparable transactions preceded the deal under assessment, to reflect cumulative market learning. The staging rule used to apply this adjustment is set out in Section 2.3.
The ex-ante scorecard is designed to assess, before a transaction is committed, whether it is likely to generate a strong demonstration effect and influence future follow-on activity. Its purpose is predictive rather than descriptive: it identifies the deal features that make replication, market learning, and information spillovers more likely. The scorecard is built around four dimensions: information generation, obstacles overcome, profitability and impact, and deal feasibility (Risk Control (2024)). Together, these dimensions capture whether the transaction can create useful market information, resolve barriers that previously constrained similar deals, deliver a credible risk-return and development proposition, and be sufficiently simple for others to reproduce.
The first dimension, information generation, reflects the idea that demonstration effects depend on the extent to which a transaction creates or reveals useful information to other market participants (Risk Control (2024)). A transaction that is opaque, poorly communicated, or confined to a narrow set of actors is unlikely to have much broader effect, whereas one that disseminates credible information can help reduce uncertainty and encourage imitation. In this sense, information generation is the most direct channel through which a transaction may influence future behaviour. It is especially important in public transactions, where listing, underwriting, and market-making can widen the audience for the transaction and increase its visibility. In private transactions, the same function is captured through transaction size, investor participation, dissemination of documentation, the involvement of influential investors, and the signal sent by credit ratings.
The second dimension, obstacles overcome, acknowledges transactions do not merely communicate information; they can also solve practical constraints that previously made similar deals difficult or impossible (Risk Control (2024)). Such obstacles may be rating-based, legal, technical, or accounting-related. A transaction that succeeds in reaching agreement with rating agencies, creating a workable legal structure, developing a reliable pricing or valuation approach, or securing an acceptable accounting treatment can lower the transaction costs of repetition for others. In that sense, obstacle removal is not only a sign of success in the deal itself, but also a form of market preparation, since it creates a pathway that future actors may follow more easily (Risk Control (2024)).
The third dimension, profitability and impact, captures whether the transaction is commercially viable and developmentally meaningful (Risk Control (2024)). For a demonstration effect to be credible, the transaction must do more than rely on heavy subsidy or exceptional one-off support (Risk Control (2024)). It should show that the underlying structure can generate an acceptable risk-return profile for investors, a meaningful level of development finance for DFIs, and, where relevant, a strong ESG or SDG contribution. This dimension therefore reflects both market attractiveness and public-value relevance. A transaction that aligns investor interests with development objectives is more likely to be repeated, because it suggests that private capital can participate without sacrificing financial discipline or development ambition.
The fourth dimension, deal feasibility, asks whether the transaction is simple enough, transparent enough, and sufficiently standardisable for others to reproduce it (Risk Control (2024)). A transaction may be innovative and valuable but still fail to demonstrate much if it is too complex, bespoke, or institution-specific to be copied (Risk Control (2024)). Deal feasibility therefore captures whether the structure can be understood, adapted, and implemented by other institutions without requiring exceptional expertise or unusual market conditions. The size of the transaction also matters here, because a large transaction may indicate market confidence and provide a more visible template, while a small transaction may be harder to interpret as a scalable model.
Taken together, these four ex-ante dimensions are intended to predict the three outcome categories assessed in the ex-post framework. The first is financing effects, which capture the scale and pace of follow-on and related transactions generated by the original deal. The second is quality effects, which capture the development quality of those transactions and the extent to which they mobilise private risk capital toward development objectives. The third is awareness effects, which capture the extent to which the transaction generates market visibility, recognition, and signalling value. The ex-ante framework therefore seeks to anticipate the financing, quality, and awareness effects that may subsequently emerge and be measured through ex-post evaluation.
2.3 An ex-post scorecard for demonstration effects
Demonstration effects become observable after a transaction has had time to influence the broader market. Some transactions are inherently more likely than others to generate demonstration effects. Features such as transaction structure, target asset class, and use-of-proceeds design can make it easier for other market participants to understand, replicate, and scale the approach, increasing the likelihood of follow-on activity.
The ex-ante scoring approach is built on the premise that certain transaction characteristics influence the likelihood that a deal will generate demonstration effects. It therefore assesses, at the point of investment, whether a transaction possesses features associated with subsequent replication and wider market adoption.
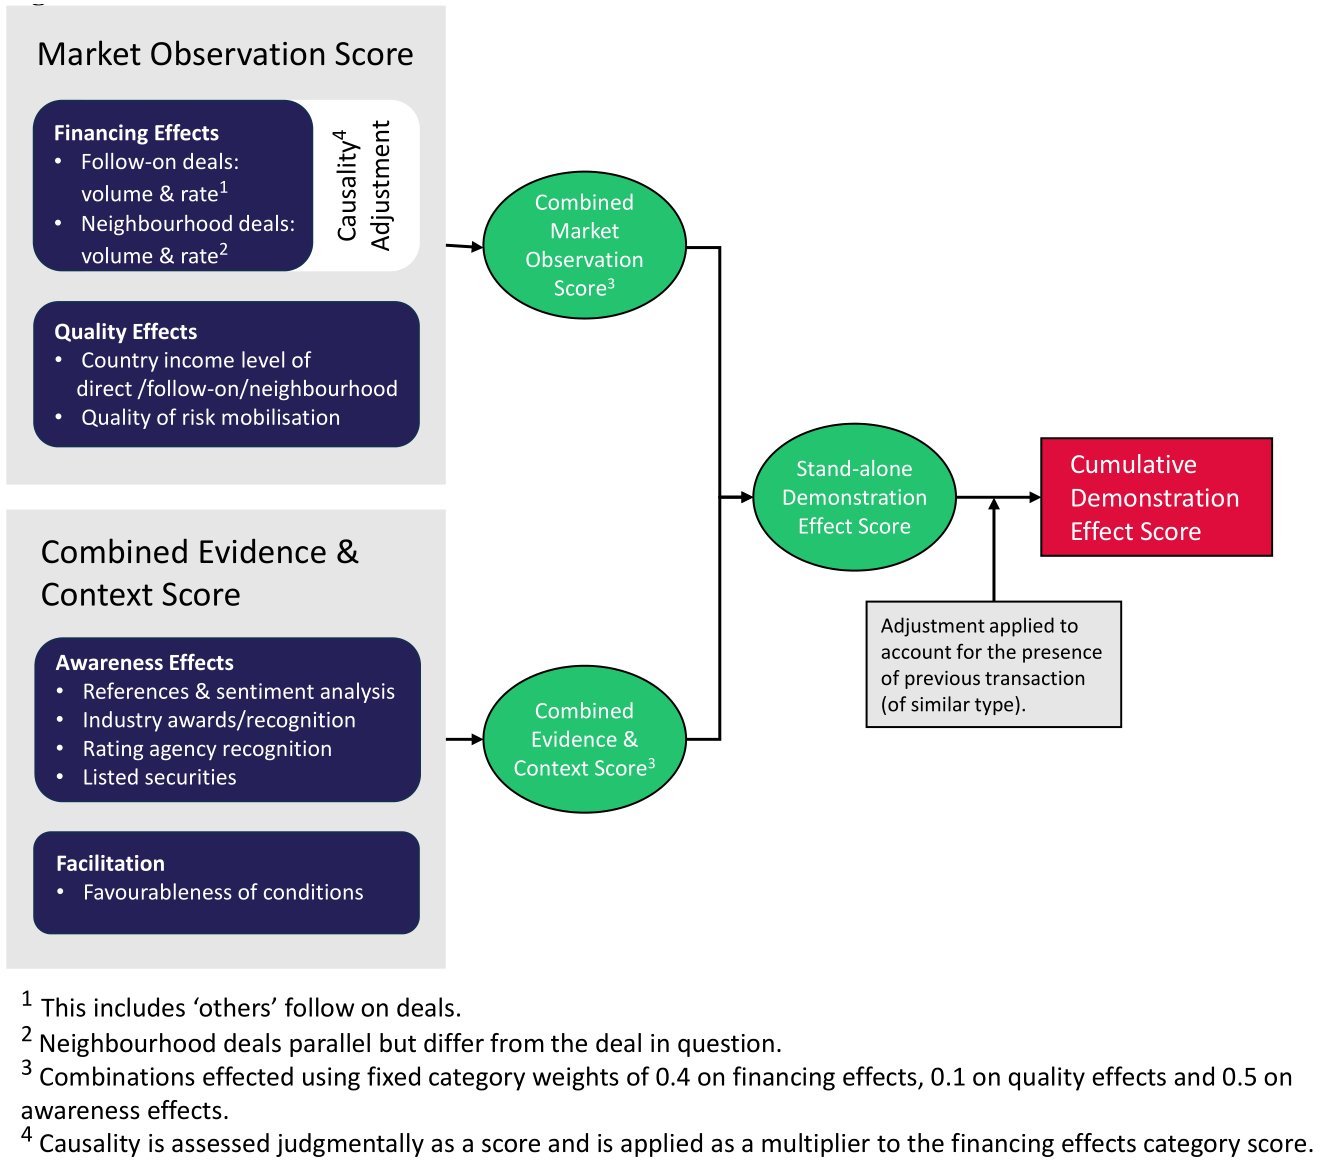
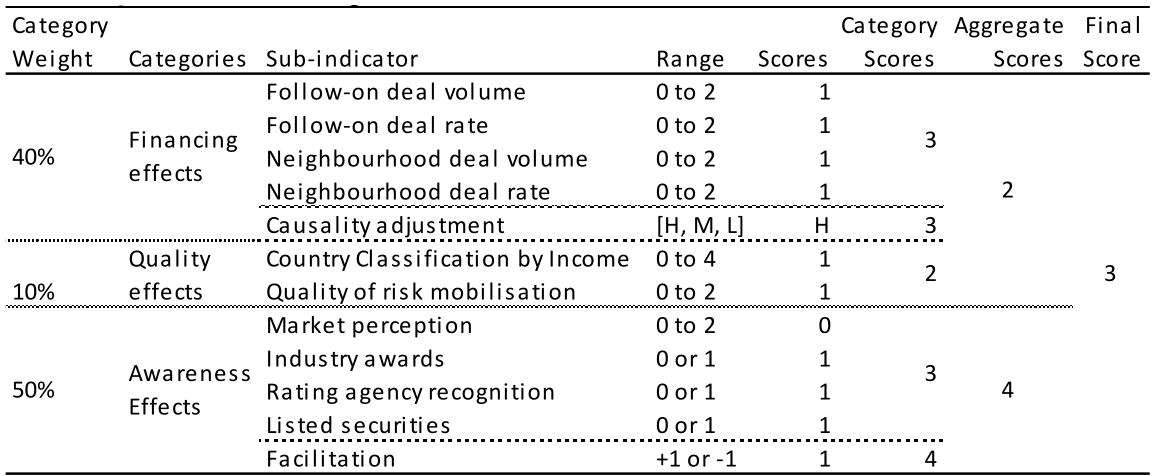
The ex-post framework tests these expectations against observed evidence. Whereas ex-ante scoring is forwardlooking and predictive, ex-post scoring evaluates realised outcomes by measuring the scale and pace of replication and the quality and credibility of the resulting market effects. The ex-post scorecard therefore relies on indicators that become observable after a transaction has closed and distinguishes between observed market outcomes and the evidence used to assess whether those outcomes can plausibly be attributed to the reference transaction. Figure 2.2 presents the decision tree used in this assessment.
The two primary inputs are quantitative information about volume of financing generated by the transaction in question and indicators of market awareness and sentiment regarding the transaction. These measures may be assessed at different points in time following transaction closing. The framework assumes that assessment of demonstration effects begins once a transaction has closed and continues over a defined observation period. During this period, ex-post scores may be assigned or updated as evidence on follow-on activity, development quality, and market awareness emerges. We assume an observation window of eight years[2], after which a transaction's demonstration effects are considered substantially realised and a final ex-post demonstration effect score can be assigned.
We base analysis of financing deal volume on what we term ‘follow-on’ deals. These are transactions undertaken without the involvement of the original transacting institution and which replicate the key innovative features of the reference transaction. Examples of such features include a common transaction structure, asset class, use-of-proceeds logic, or risk-transfer mechanism. Some judgement is required in determining whether a subsequent transaction should be classified as a follow-on deal.[3]
3 Combinations effected using fixed category weights of 0.4 on financing effects, 0.1 on quality effects and 0.5 on awareness effects. 4 Causality is assessed judgmentally as a score and is applied as a multiplier to the financing effects category score.
Notes: On the data employed, lists of follow-on deals are collected which include characteristics (e.g., country, timing, own/others’/neighbourhood breakdown). Where deal information is scarce, one may use market volume information if this is available.
Transactions that exhibit a less direct connection to the original transaction may instead be classified as neighbourhood deals.[4] Further guidance on these classifications is provided in the user guide. In calculating total financing effects, the neighbourhood deal volume and rate scores enter at half the weight of the corresponding follow-on scores. The discount applies to the banded sub-indicator scores rather than to the underlying deal volumes, and it covers the rate measure as well as the volume measure. The half weight is a judgmental convention, not an estimated parameter. It reflects the view that a neighbourhood deal represents partial rather than complete adoption of the reference innovation, and it avoids the two extremes of counting such deals in full or excluding them entirely[5].
Causality is assessed on a three-category classification of estimated causal contribution (High, Moderate and Low), applied as multipliers of 100%, 50% and 25% to the financing effects category score. The rating measures how much of the follow-on market is attributed to the reference transaction.
The assessment rests on a counterfactual: absent the reference transaction, would the market have developed the same interest in, and capacity for, the structure? Since this cannot be observed, the analyst identifies the binding constraint on the market and asks whether the transaction removed it or merely arrived ahead of its removal. The judgement draws on the timing and density of follow-on activity, citation of the transaction as a precedent, and whether comparable structures were already emerging independently. Where the evidence cannot separate two adjacent categories, the analyst adopts the lower.
High: HBOS (2003). The constraint was proof that a covered bond could be created contractually, without enabling legislation. The transaction supplied it: UK issuers adopted the template within two years, and statutory rules followed only in 2008. Covered bonds were long established in Europe, but the concept was never the obstacle. Absent a precedent, issuance would plausibly have waited on legislation.
Low: EIB green bond (2007). The constraint was the absence of common standards and a mandated investor base, which the transaction did not remove. Issuance stayed negligible until the Green Bond Principles appeared in 2014. The structure did supply reporting features that later frameworks drew on, hence Low rather than nil, but comparable instruments would likely have emerged by around 2012 regardless.
Both are analyst judgements against a stated counterfactual, not established facts, and each is documented with its supporting evidence. The resulting discount attributes follow-on volumes only to the extent of the causal link that survives this test.
The development quality dimension is based on the per capita income levels of the countries to which financing is exposed. Depending on the evidence available, this is measured from the countries directly affected by the reference transaction, from those affected by follow-on transactions, or from those affected by neighbourhood transactions. Where the reference transaction has no defined portfolio, the issuer's lending in the year of issuance is used. Information on the income data source and the averaging methodology can be found in the user guide.
The dimension is included because demonstration-effect scoring should weight a transaction by where its financing lands: exposure to low-income markets delivers greater development value than the same volume confined to high-income markets. Per capita income is used as the basis because it underpins the World Bank's country income classifications, which group economies as low, lower-middle, upper-middle or high income on the basis of GNI per capita (see World Bank (2026)) and in turn govern eligibility for concessional financing and official development assistance, making it the conventional proxy for development need across the development finance community.
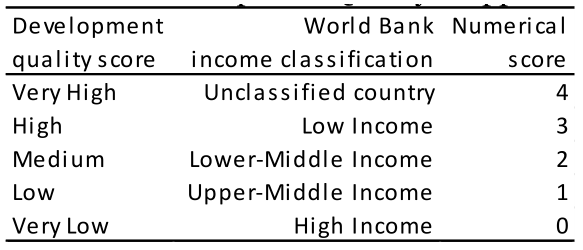
The weighted-average income classification is converted into a five-level development quality assessment, scored 0 to 4, as set out in Table 2.1. The mapping runs inversely to income: exposure concentrated in highincome countries scores Very Low, or 0, and the assessment rises by one level at each step down the World Bank income classification, reaching High, or 3, for low-income countries.
Countries not covered by the World Bank classification receive the highest assessment, Very High, or 4. The World Bank classifies economies on GNI per capita, so a country is absent from the classification principally because it lacks the statistical infrastructure to report a standardised GNI estimate. In practice that describes frontier, conflict-affected and fragile states, which are the markets in which financing is scarcest and its development value greatest. Placing them above low-income countries therefore follows the same logic that orders the rest of the scale. No exposure in the six case studies falls into this category.
The quality of risk mobilisation is scored Low, Moderate or High, taking values of 0, 1 and 2. The scale measures the credit risk actually borne by private participants in reference transaction, assessed on the specific exposure held. The question is whether private capital takes on exposure to the credit performance of the underlying assets, or simply provides funding against a claim that remains insulated from loss.
A Low score applies where participation is senior and highly rated, protected by dual recourse, a guarantee or substantial credit enhancement, so that one high grade holding is substituted for another. Moderate applies where participants take unwrapped exposure but remain senior to a retained or publicly held loss piece. High applies where they absorb losses that would otherwise have stayed with the originator or a public balance sheet, through mezzanine or first-loss positions or direct unprotected portfolio exposure.
The scale applies to any instrument type, not only securitisations. The analyst scores each transaction on its structure: seniority and attachment point, recourse to the originator, any guarantee or credit enhancement and its provider, and credit quality at issuance. The score reflects the risk taken, not the amount invested, which the volume measures capture separately.
A Low score does not mean the transaction lacked market impact, only that the mobilisation achieved was of funding rather than risk.
The market awareness indicators employed in the ex-post scoring are as follows:[6]
1. References in specialist publications
2. Industry awards/recognition
3. Recognition in rating agency treatments
4. Public market visibility for listed securities
The references in specialist publications are processed using an AI tool developed to obtain the normalised number of references over the period following the transaction and the average sentiment score for these publications. Details are provided in the user guide section of this document.
The market environment over the assessment window, termed facilitation, is classified as either Favourable or Unfavourable. The indicators supporting the classification include issuance conditions and market risk appetite proxies relevant to the asset class. Unfavourable conditions notch the Market Awareness score up by one and Favourable conditions notch it down by one. The notch is added to the sum of the four awareness subindicators, and the result is floored at zero and capped at the category maximum of five, so the adjustment cannot take the category outside its range. Neither bound is reached in the present sample.
The adjustment applies to awareness rather than to observed financing because financing volumes are already discounted for causality, so a second adjustment there would double count the market environment. It applies to a component rather than to the final score so that the source of the adjustment remains visible.
The normative logic is that visibility achieved in a hostile market is stronger evidence of a demonstration effect than the same visibility achieved in a buoyant one. In the sample scored in Section 5.3, HBOS (2003) and the EIB Climate Awareness Bond (2007) are classified Favourable and notched down by one, while the four later transactions are classified Unfavourable and notched up by one (see Table 5.2).
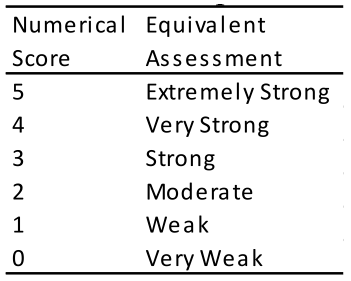
The final score would be in the range of zero to five and can be interpreted as shown in Table 2.2.
required for volume/rate measures and quality measures.
2. Collect and catalogue awareness evidence, including references in specialist publications, awards, rating-agency materials, and any available survey/interview evidence relevant to replication behaviour.
3. Score each indicator according to the documented rules, produce category scores for financing, quality and, awareness effects, applying the causality multiplier to financing and the facilitation notch to awareness, and then compute the two combined market observation score and the combined evidence and context score.
Table 2.3 represents the scorecard template. The aggregation rules are as follows. Financing Effects combines four sub-indicators; each scored from 0 to 2. The follow-on deal volume and rate scores enter in full and the neighbourhood deal volume and rate scores enter at half weight, which is the 50% discount described above, giving a category maximum of 6. The result is then multiplied by the causality factor of 100%, 50% or 25% for High, Moderate and Low respectively. Quality Effects is the sum of country income classification, scored 0 to 4, and quality of risk mobilisation, scored 0 to 2, giving a maximum of 6. Awareness Effects is the sum of market perception, scored 0 to 2, and industry awards, rating agency recognition and listed securities, each scored 0 or 1, giving a maximum of 5. The facilitation notch of plus or minus one is then added to that sum, and the total is floored at zero and capped at 5, so the notch cannot take the category outside its range.
The category scores are combined using fixed weights: 0.4 on Financing Effects, 0.1 on Quality Effects and 0.5 on Awareness Effects. The combination proceeds in two stages. Financing and Quality are each divided by their maxima, weighted 0.4 and 0.1, rescaled onto a 0 to 5 range and rounded to the nearest integer, giving the Combined Market Observation Score. Awareness is divided by its maximum, rescaled to 0 to 5 and rounded to the nearest integer, giving the Combined Evidence and Context Score. The two are then averaged, since financing and quality together carry a weight of 0.5 and awareness carries 0.5, and the result is rounded to the nearest integer to give the demonstration effect score on the 0 to 5 scale of Table 2.2.
The score produced by this calculation is the stand-alone demonstration effect score. It is then adjusted for the presence of previous transactions to give the cumulative score shown in Figure 2.2. A previous transaction is any earlier deal in the same market that shares the core innovative feature of the deal under assessment, that is its structure, asset class, use-of-proceeds logic or risk-transfer mechanism. Transactions by other institutions count alongside the issuer's own, since what the adjustment measures is what the market has already seen rather than what any single institution has done.
Transactions classified as follow-on or neighbourhood deals of the reference transaction are excluded, since they are evidence of its demonstration effect and cannot also constitute prior market learning.
The adjustment is applied by stage, determined by the position of the deal in the sequence of comparable transactions. The first five fall in Stage 1 and receive no adjustment, since early issuance establishes the framework and the market takes time to recognise and learn from it. The sixth to eighth fall in Stage 2, where the stand-alone score is halved and rounded to the nearest integer. The ninth and any subsequent transaction falls in Stage 3 and receives a cumulative score of zero, on the basis that the structure is by then established and further issuance demonstrates little that is new.
All six case studies fall in Stage 1, so the cumulative score equals the stand-alone score throughout and Table 5.2 reports a single figure. BIC IV is the fourth comparable transaction in its class, following the three earlier Bayfront issuances; the Bauhinia transaction that priced four months earlier is excluded, since Section 4.7 treats the Bauhinia platform as a replication of the BIC model.
The stage is determined by the transactions that closed before the deal under assessment and does not change at later scoring runs, since subsequent issuance is evidence of the transaction's demonstration effect rather than of prior market learning.
Two features of this construction bear on how the scores should be read. Market awareness carries half the weight of the final score and quality effects only one tenth, so the ranking is driven mainly by awareness and by realised financing volumes. And because the two intermediate scores are rounded before being averaged, a final score can turn on the rounding convention.
Show as data
| Development quality score | World Bank income classification | Numerical score |
|---|---|---|
| Very High | Unclassified country | 4 |
| High | Low Income | 3 |
| Medium | Lower-Middle Income | 2 |
| Low | Upper-Middle Income | 1 |
| Very Low | High Income | 0 |
Show as data
| Numerical Score | Equivalent Assessment |
|---|---|
| 5 | Extremely Strong |
| 4 | Very Strong |
| 3 | Strong |
| 2 | Moderate |
| 1 | Weak |
| 0 | Very Weak |
Show as data
| Category Weight | Categories | Sub-indicator | Range | Scores | Category Scores | Aggregate Scores | Final Score |
|---|---|---|---|---|---|---|---|
| 40% | Financing effects | Follow-on deal volume | 0 to 2 | 1 | |||
| Follow-on deal rate | 0 to 2 | 1 | |||||
| Neighbourhood deal volume | 0 to 2 | 1 | 3 | ||||
| Neighbourhood deal rate | 0 to 2 | 1 | 2 | ||||
| Causality adjustment | [H, M, L] | H | 3 | ||||
| 10% | Quality effects | Country Classification by Income | 0 to 4 | 1 | 2 | 3 | |
| Quality of risk mobilisation | 0 to 2 | 1 | |||||
| 50% | Awareness Effects | Market perception | 0 to 2 | 0 | |||
| Industry awards | 0 or 1 | 1 | |||||
| Rating agency recognition | 0 or 1 | 1 | 3 | 4 | |||
| Listed securities | 0 or 1 | 1 | |||||
| Facilitation | +1 or -1 | 1 | 4 |
Note: Here the scoring is shown for the case study on BIC IV.
3. User Guide
3.1 Introduction
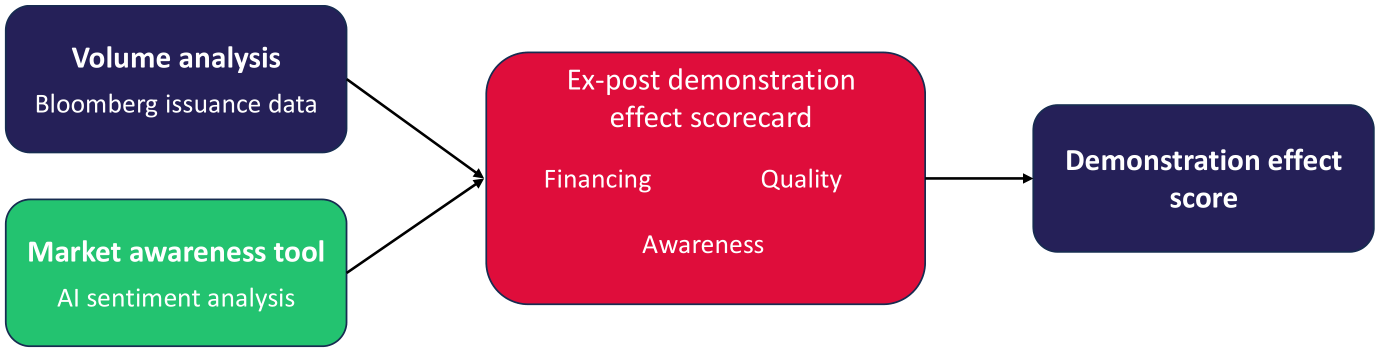
Figure 3.1 illustrates the high-level data flow underpinning the ex-post Demonstration Effect scoring framework. Two parallel data collection streams serve as the primary inputs to the scorecard. Volume analysis draws on Bloomberg issuance data to assess the scale and pace of follow-on and neighbourhood transactions generated by the reference deal.
The market awareness tool, developed by Risk Control, processes a corpus of external documents using AIpowered sentiment analysis to produce a market perception score reflecting the breadth and tone of independent commentary on the transaction. These two streams, together with evidence on facilitation conditions, feed into the ex-post demonstration effect scorecard. The scorecard assesses each transaction across three categories: financing effects, quality effects and, awareness effects. The category scores are then combined to generate an overall demonstration effect score.
This guide is written for an analyst carrying out an ex-post evaluation, working under the review of a senior analyst who signs off the final score. It assumes familiarity with securitisation and bond market structures, with rating agency new-issue reports, and with the World Bank income classifications. The volume analysis requires access to a Bloomberg Professional terminal, and scoring requires the market awareness tool, an API key for the language model it calls, and the ex-post scoring workbook described in Section 6.2.
Scores are not fixed at the point of first assignment. A transaction is re-scored at least every two years within the eight-year observation window, and immediately on any of the following triggers: the closing of a follow-on or neighbourhood transaction; industry recognition of, or a rating action on, the reference transaction; or the emergence of evidence that changes the causality classification. Each scoring run is appended as a new entry to the transaction's record document and saved alongside a dated version of the workbook, so that the score history of a transaction can be reconstructed.
The workbook records the scores but not the reasoning behind them. At the first scoring of a transaction the analyst therefore opens a record document, setting out the date of scoring, the date of the underlying data extraction, the analyst and reviewer, the date of review sign-off, and the score assigned to each sub-indicator with the reasoning for it and the source of the evidence relied on. The causality and facilitation classifications carry the greatest weight of judgement and are recorded in most detail, setting out the counterfactual assessed and the evidence on both sides of it. At each later scoring the analyst appends a new entry to the same document in the same format, rather than amending the entries already there. The document travels with the transaction, so whoever scores it next continues the same record and the full scoring history can be read in date order.
The evidence supporting each score is retained so that the assessment can be reproduced and audited. For each transaction this comprises the Bloomberg extract underlying the volume analysis, including the screening fields, filters and extraction date; the full corpus of PDF documents collected for the market awareness analysis together with the CSV log produced by the tool; and the transaction documentation used to score risk mobilisation. These materials are stored with the dated version of the workbook to which they relate and retained for the life of the observation window and for five years thereafter.
3.2 Volume analysis
In this section we review the steps to retrieve volume data associated with a transaction. We start by understanding the transaction and gathering information on the types of follow-on deals that occurred. Dealby-deal data are gathered where follow-on activity is too limited to constitute a new market (for example, the deals following the BIC IV transaction). Otherwise, we gather the annual issuance for the market created after the transaction (for example the covered bond market for the HBOS transaction). Market-level data are used only where two conditions hold: the asset class can be isolated by a classification field or instrument flag from the data provider used, whether Bloomberg, Refinitiv or another commercial or public issuance source, and at least ten transactions by issuers other than the original transactor have been identified in that class after the reference deal. Where either test fails, deal-by-deal data are used and any market-level series is reported as context only.
The first step is to understand whether the deal generated a new asset type in which various investors entered the market to issue instruments. If the transaction created a new asset type, the analyst should gather annual issuance-volume data using Bloomberg.
In the second step, the analyst needs to search for the transaction’s International Securities Identification Number (ISIN) on Bloomberg and find which fields uniquely identify the asset class.
In the last step, the unique field can be used to generate either annual volume issuance data for a given asset class or search for follow-on/neighbourhood deals. A sense check shall be performed on the data obtained, including asset start dates and issuance amounts, since it should be zero before the case study transaction and rise in volume thereafter, where applicable. Treat this as a diagnostic, not a universal requirement, as some cases have precedents.
The fields and filters used in the extraction cannot be specified in general terms, because the classification that isolates an asset class differs by instrument and by market. The method set out above is what transfers between cases: the analyst locates the reference transaction by its ISIN, identifies the fields and flags that distinguish its asset class, and uses those to build the issuance screen. The screen for the HBOS analysis, for example, rests on the Bloomberg Level 4 classification together with the covered bond flag, neither of which is relevant to the green bond or MDB securitisation cases. The source may also differ, since Bloomberg, Refinitiv and public issuance registers each cover some asset classes better than others. For each transaction, the source used, the fields retained and the screen applied are recorded with the extract, so that the analysis can be checked as performed rather than reconstructed from a general rule.
3.3 Market awareness analysis
Market awareness data are collected using a purpose-built AI-powered sentiment analysis tool developed by Risk Control. The tool processes a corpus of PDF documents, encompassing research papers, industry reports, regulatory publications, press releases, and opinion pieces, and classifies each document according to its expressed stance toward the reference transaction. The primary quantitative input to the market perception score described in Section 5.3 is derived directly from the counts of supportive, critical, and neutral documents identified by this tool across each transaction. Full technical details of the tool, including the document collection process, the analytical prompt, and the structure of the output, are set out in Risk Control’s (2026) user guide document.
For each transaction, documents are collected by performing keyword searches on Google and Google Scholar. Google Search surfaces general commentary, news articles, and industry reports, while Google Scholar provides access to peer-reviewed academic papers and working papers. Search queries combine the transaction name and common aliases with evaluative terms such as "review", "critique", "assessment", and "outlook", and are run across the full post-transaction period. All retrieved documents are saved as PDFs and organised by transaction into dedicated input folders, which are then passed to the analysis tool. For more information on how the documents related to each transaction were collected for the market awareness analysis, refer to Appendix 1.
The tool submits each PDF to Google's Gemini Large Language Model (LLM) (gemini-2.5-flash-lite) via an API, together with a structured analytical prompt. The model is instructed to classify the document's sentiment as Supportive, Critical, or Neutral; to assign a numeric score between –1.0 and +1.0; to extract the publication year and source type (academic, industry, issuer and regulator). The results are written row-by-row to a CSV log file, one row per PDF, which is then used to construct the market perception figures and tables presented in Section
4. Documents identified as having been issued by the transaction entity are reported separately in order to distinguish independent commentary from issuer-generated material, as illustrated in the market perception panels for each case study.
3.4 Scorecard analysis
The scorecard analysis provides a structured and transparent framework for assessing transactions based on realised volume indicators, observed characteristics, and market perception. It translates qualitative and quantitative data into a consistent rating output, enabling DFIs to identify the key drivers of demonstration effects and compare transactions on a like-for-like basis.
Following the collection of available volume data, transaction characteristics (such as awards received and public listing status), and the completion of the market awareness analysis, each transaction is assessed across defined scorecard categories. Each category is assigned a score according to the relevant criteria and the available transaction information. Analysts are required to assign sub-category scores using the ex-post scoring framework described in Section 2.3.
Section 5.3 presents the rationale for each sub-category score assigned to the six case study transactions considered in this study. This is intended to provide practical guidance for analysts when scoring new transactions. In addition, Risk Control has produced a dashboard that enables users to review the ex-post and ex-ante scoring outcomes for the selected case studies.
The dashboard allows users to review individual transactions, adjust assumptions, test sensitivities, and immediately observe the impact on the overall rating. This supports transparent discussion, review, and explanation of the ratings, while still allowing for the application of expert judgement where appropriate.
4. Transaction Case Studies
4.1 Introduction
To assess ex-post demonstration effects, we examine the volume generated through follow-on and neighbourhood transactions, together with transaction-specific evidence and market awareness analysis. The selected transactions were all considered, on an ex-ante basis, to have the potential to generate positive demonstration effects within their respective markets.
The sample includes several transactions undertaken entirely by private-sector institutions, including the introduction of structured covered bonds by HBOS in 2003. This transaction established a new covered bond market in the UK, with similar issuances by other UK banks following shortly thereafter. It also influenced international markets, many of which subsequently developed their own structured covered bond structures. Another private-sector transaction included in the analysis is the Trade MAPS initiative by Citigroup and Santander. In contrast to the HBOS transaction, however, this initiative was less successful, as it did not lead to the development of a significant market for securitised trade receivables, despite strong expectations among market participants at the time.
The remaining four transactions presented in Figure 4.1 involve participation by DFIs. These transactions cover a diverse range of financing structures and sectors, including a climate-awareness bond issuance, a DFI-led colending programme, an equity investment in a securitised infrastructure loan portfolio, and a securitisation of part of the Non-Sovereign Obligor (NSO) portfolio of a Multilateral Development Bank (MDB).
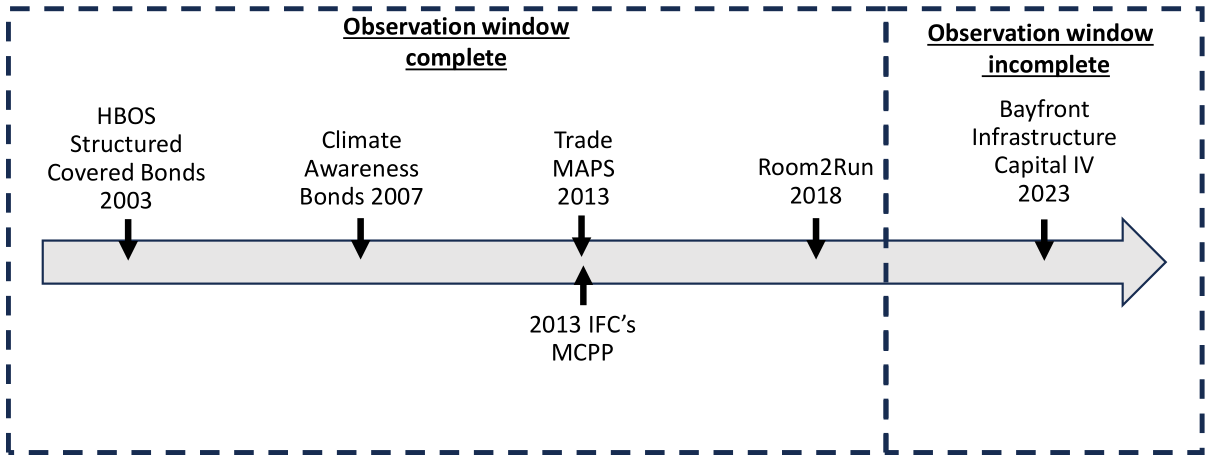
The following sections provide a detailed discussion of each transaction, focusing on their contribution to market creation, the development of new asset classes, and overall market perception (see Appendix 2 for detailed results and industry awards). Figure 4.1 presents the timeline of the sample transactions. As illustrated, Bayfront Infrastructure Capital IV (2023) is sufficiently recent that its full demonstration effects have yet to be observed.
The five earlier transactions have passed the eight-year observation window assumed in Section 2.3, which is the criterion applied here for treating the evidence as sufficient for a final assessment: HBOS (2003) and the EIB Climate Awareness Bond (2007) have more than fifteen years of subsequent evidence, IFC’s MCPP and Trade MAPS (both 2013) more than twelve, and Room2Run (2018) eight. Passing the window does not guarantee that the evidence is rich in every dimension. For Trade MAPS in particular the market awareness corpus is small and concentrated in the issuance period, and the assessment of that transaction rests on the absence of identified follow-on activity rather than on positive evidence of its causes.
4.2 HBOS Structured Covered Bonds (2003)
In July 2003, HBOS Treasury Services plc issued the first UK covered-bond programme and the first such issuance without a dedicated covered bond law (see HBOS Treasury Services (2003)). The initial issuance amounted to €3 billion, maturing in 2010, and was followed in October 2003 by a further €2 billion issue maturing in 2013 (see HBOS Treasury Services (2003)). Both tranches were issued under a new €14 billion structured covered bond programme established by HBOS in July 2003 (see HBOS Treasury Services (2003)). Because the UK did not yet have a specific covered bond legislative framework, the bonds were described as “structured covered bonds” and relied on contractual provisions in English law together with securitisation techniques to replicate the legal and economic features of traditional covered bonds (see HBOS Treasury Services (2003)).
The literature on this transaction highlights its importance in showing that covered bond structures could be created in jurisdictions without a specific legislative regime (see HBOS Treasury Services (2003)). HBOS’s programme allowed the issuer to achieve AAA/Aaa/AAA ratings from Fitch, Moody’s and S&P, while also providing lower-cost funding and diversification benefits (see HBOS Treasury Services (2003)). The bonds were backed by HBOS residential mortgages through a special-purpose group structure, in which HBOS Treasury Services plc issued the bonds, on-lent the proceeds to HBOS Covered Bonds LLP, and that entity acquired mortgages from within the HBOS group by equitable assignment (see HBOS Treasury Services (2003)).
HBOS Covered Bonds LLP then guaranteed the bonds and pledged the mortgages as security for bondholders, thereby recreating the protection associated with covered bonds through common law and contractual arrangements rather than statutory covered bond legislation (see HBOS Treasury Services (2003)). HBOS’s 2003 programme is therefore often discussed in the literature as an early and influential example of structured covered bonds in Europe (see HBOS Treasury Services (2003); Fitch Ratings (2005)).
It showed that issuers in the UK could access funding conditions similar to continental European covered bonds, particularly because the instruments were recognised by investors and rating agencies as highly rated financial institution bonds (see HBOS Treasury Services (2003); Fitch Ratings (2005)).
At the time, this allowed HBOS to benefit from lower funding costs than those available through UK residential mortgage-backed securities, while also broadening its investor base (see HBOS Treasury Services (2003); Fitch Ratings (2005)). For these reasons, the 2003 HBOS structured covered bond programme is treated as a significant innovation in the development of the UK covered bond market and, more broadly, in the evolution of European bond market structures (see HBOS Treasury Services (2003); Fitch Ratings (2005)).
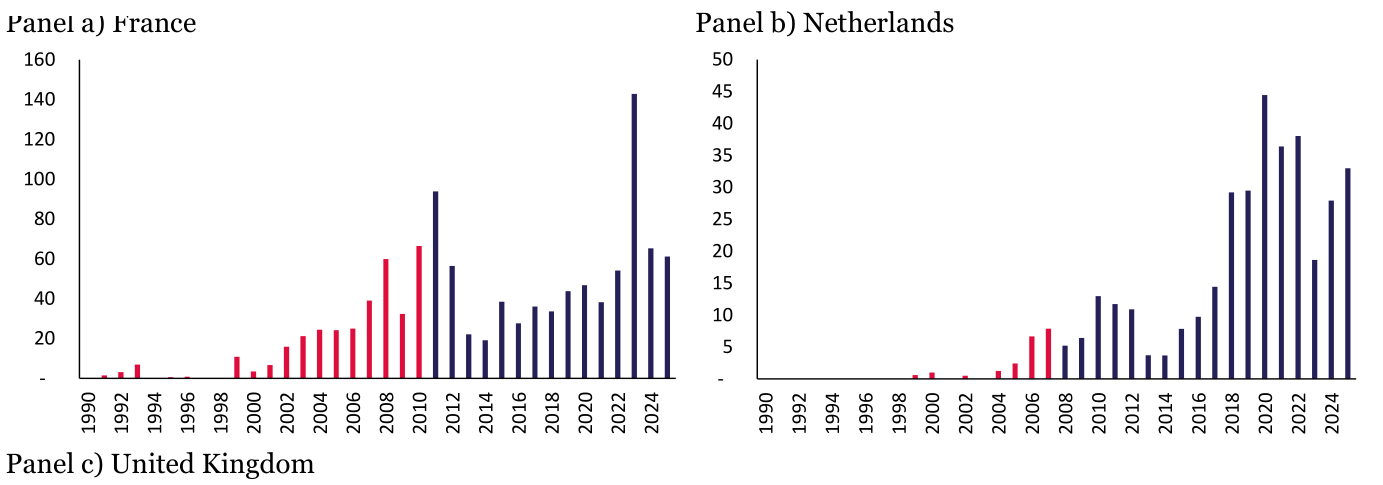
Building on this foundation, the subsequent introduction of formal regulatory frameworks contributed to a marked increase in covered bond issuance across several jurisdictions. This analysis focuses on three key markets: the United Kingdom, France, and the Netherlands. Annual issuance data, obtained from Bloomberg, identify covered bonds based on either a Bloomberg Level 4 classification of “Mortgage Non-Pfandbriefe” or the activation of the “is_covered” Boolean flag. Figure 4.2 presents annual covered bond issuance across these three countries over the period from 1990 to 2025.
Note: The vertical axis is expressed in millions of euros and the horizontal axis represents years. In panel a) the red bars show issuance before the framework was amended to issue covered bonds secured by residential mortgages or guaranteed housing loans. In panels b) and c) the red bar indicates covered bond issuance before covered-bond regulations were introduced. The source of the data is Bloomberg.
France and the Netherlands serve as comparison markets rather than as formal controls. They were selected because both are large European covered bond markets in which structured issuance preceded statutory recognition, so they permit the counterfactual question, whether issuance would have grown without a contractual precedent, to be examined in settings that share the United Kingdom’s regulatory sequencing but not its reference transaction. The comparison is illustrative: the three markets differ in size, mortgage market structure and the timing of legislation, and no attempt is made to match them on those characteristics.
Within this broader context, France represents one of the most established covered bond markets, with a framework that has evolved from its origins in 1852 into a modern dual structure comprising Sociétés de Crédit Foncier (SCFs), introduced in 1999, and Sociétés de Financement de l’Habitat (SFHs), introduced in 2010 (see Gallebaert (2014)). Notably, even prior to the formal regulatory recognition of structured covered bonds in 2010, market activity had already begun to expand. In 2006, BNP Paribas issued a €2.5 billion structured covered bond, marking a key milestone and initiating a steady increase in annual issuance between 2006 and 2010, as illustrated in Panel (a) of Figure 4.2.
A similar pattern of pre-regulatory market development can be observed in both the Netherlands and the United Kingdom. In the Netherlands, ABN AMRO became the inaugural issuer in 2005 with a €2.0 billion structured covered bond, drawing in part on earlier innovations in the UK market (see Dutch Association of Covered Bond Issuers (2026)). In both the Netherlands and the United Kingdom, formal covered bond legislation was subsequently introduced in 2008 (see Clifford Chance (2008); Financial Conduct Authority (2016)).
In the United Kingdom, however, issuance growth had already begun prior to the introduction of legislation, particularly in the period from 2003 to 2008 following the pioneering HBOS transaction. This trajectory closely mirrors the experience in France and the Netherlands, where issuance activity also expanded ahead of formal regulatory frameworks. Taken together, these developments suggest that market innovation initially preceded regulation, with legislative frameworks later consolidating and supporting the growth of covered bond markets across jurisdictions. No document reviewed for this study, including the United Kingdom’s Regulated Covered Bonds regime and the Dutch covered bond legislation, cites the HBOS programme by name. Attribution therefore rests on the timing and sequence of issuance relative to legislation and on the adoption of the contractual template by other issuers, and not on direct reference to the transaction in the regulations that followed.
The HBOS structured covered bond programme was issued in the United Kingdom, which the World Bank classified as a high-income country in fiscal year 2003 (see Figure 4.3).
To assess market awareness and perception of the HBOS transaction, 26 publicly available documents, including articles, reports, and studies relating to the programme, were collected and analysed (see Appendix 1 for further details). The findings indicate that the majority of market perceptions relating to the HBOS transaction were neutral, as illustrated in Figure 4.4. The corpus is small and probably understates the coverage the transaction received, a limitation of the evidence base given that the programme launched in 2003, before trade press and research were routinely published online. The search returned no documents at all for 2003 to 2006, which is why Table A2.1 begins in 2007.
The analysis identified five non-issuer publications expressing supportive sentiment towards the HBOS transaction. Figure 4.4: HBOS Market Awareness summarises market interest over time across sentiment categories and article types.
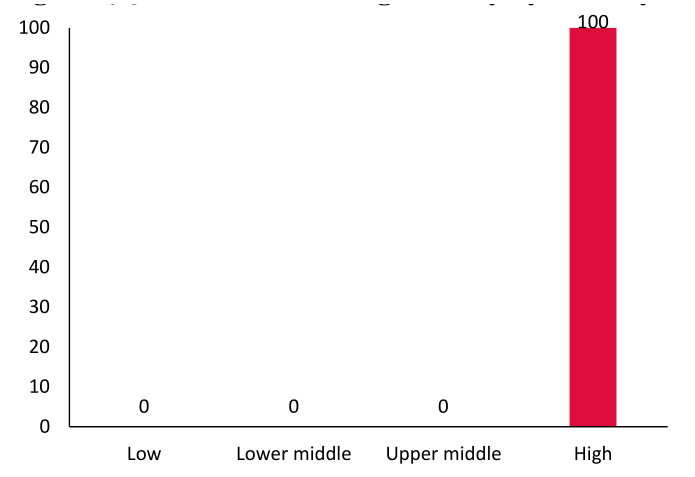
Note: All values are percentages. The country classification is based on the World Bank’s Gross National Income (GNI) per capita criteria.
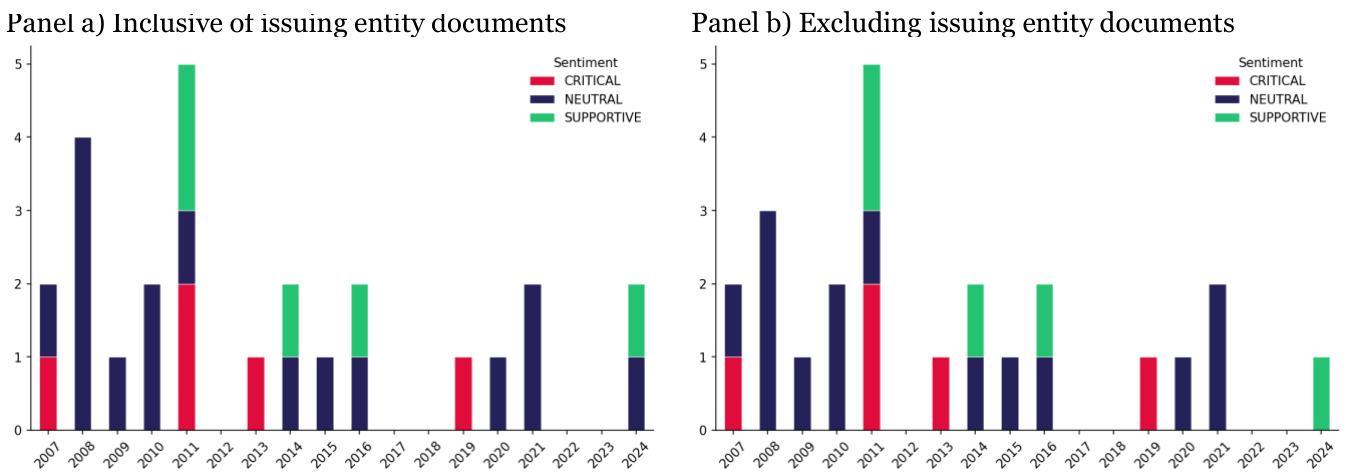
Note: The vertical axis represents count of the documents published for a given transaction in a year.
4.3 EIB Climate Awareness Bond (2007)
In June 2007, the European Investment Bank launched the Climate Awareness Bond as part of its European Public Offering of Securities programme (see EIB (2007)). It was not the first green bond. ProCredit Holding AG issued a €25 million green bond on 11 June 2007, seventeen days before the EIB priced its €600 million CAB on 28 June. What distinguished the CAB was its scale and its distribution: it was the first bond sold through a public offering across all 27 EU Member States simultaneously, including to retail investors. The proceeds were earmarked for future renewable energy and energy-efficiency projects, and the structure linked returns to an environmental equity index and gave investors the option to use returns to purchase carbon credits (see EIB (2007)).
The CAB is widely discussed in the literature as an early and influential example of thematic finance, and the 2007 issuance is often treated as a landmark in the development of green bonds (see EIB (2007)). Its design combined environmental purpose with mainstream bond-market features, and the issue was distributed by a syndicate of 13 banks and listed in Luxembourg, with passporting under the EU Prospectus Directive enabling simultaneous placement across the EU. This report treats the transaction as significant for its scale and for the reporting features that later frameworks drew on. Whether it caused the growth of the green bond market is a separate question, examined below, and the evidence assembled here supports a weaker conclusion than the literature's characterisation implies.
To assess the broader market impact of the EIB’s CAB, we examine annual green bond issuance from 2007 onwards[7]. The data are sourced from Bloomberg, which identifies fixed-income instruments[8] that it classifies as green bonds (see Bloomberg Professional Services (2024)). This is the market's working definition rather than a normative test of environmental outcomes, and it is the appropriate population here, since a demonstration effect is evidenced by what the market issues and trades as green.
Since then, the EIB has steadily increased its issuance of green bonds, broadly in line with the combined issuance of other supranational entities (see Panel a of Figure 4.5). At the same time, interest in green bonds has expanded beyond development finance institutions (DFIs), with non-DFI entities now surpassing DFIs in total issuance (see Panel b of Figure 4.5)
Panel a of Figure 4.5 shows that green bond issuance remained negligible for roughly seven years after 2007 and expanded only from around 2014, once the Green Bond Principles supplied common standards and a mandated investor base. The CAB is therefore classified Low for causality in Section 5.3. The transaction demonstrated that a large climate-labelled issue could be placed, but the market did not follow until the institutional apparatus arrived, and that apparatus was not supplied by the transaction. ProCredit's €25 million issue seventeen days earlier attracted no following either, which suggests that scale matters but is not on its own enough.
The borrowing countries associated with EIB lending in fiscal year 2007 were classified according to the World Bank’s income group categories. Information on borrower countries and outstanding amounts was obtained from EIB (2008). EIB does not publish a country allocation for the proceeds of the Climate Awareness Bond, which were earmarked for future renewable energy and energy efficiency projects rather than allocated at issuance, so the distribution of the Bank’s overall 2007 lending is used as a proxy. The proxy is imperfect, since general lending is weighted towards EU member states while the eligible project pool for the bond was narrower, and the resulting development quality classification should be read as an approximation. The distribution of borrowers was concentrated in high-income countries, and the weighted average income classification of borrowing countries was also high income (see Figure 4.6).
To assess market awareness and perceptions of the EIB CAB, 55 publicly available documents, including articles, reports, and academic studies, were collected and analysed (see Appendix 1 for further details). The findings indicate that market sentiment towards the CAB was predominantly supportive, as illustrated in Figure 4.7. This reception is consistent with growing market demand for environmentally focused instruments, though the corpus cannot separate approval of the transaction from approval of the asset class that later developed.
Only a limited number of publications expressed critical views of the transaction. The analysis also shows that market interest increased significantly after 2018, approximately eleven years after the initial CAB issuance. This lies outside the eight-year observation window assumed in Section 2.3 and shows that the window can close before market awareness peaks.
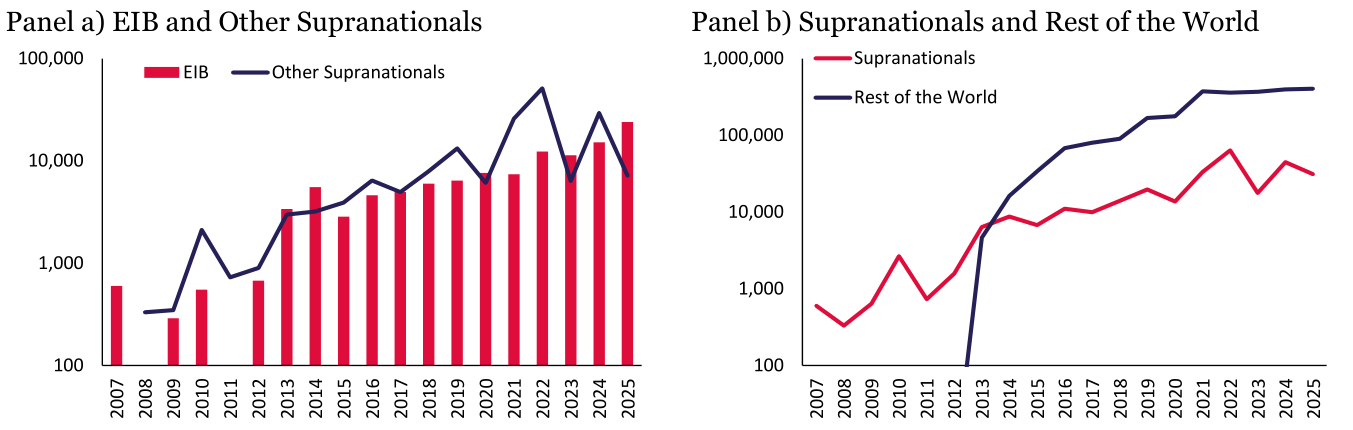
Note: The source is Bloomberg. The vertical axis is represented in millions of euros and is on a log scale.
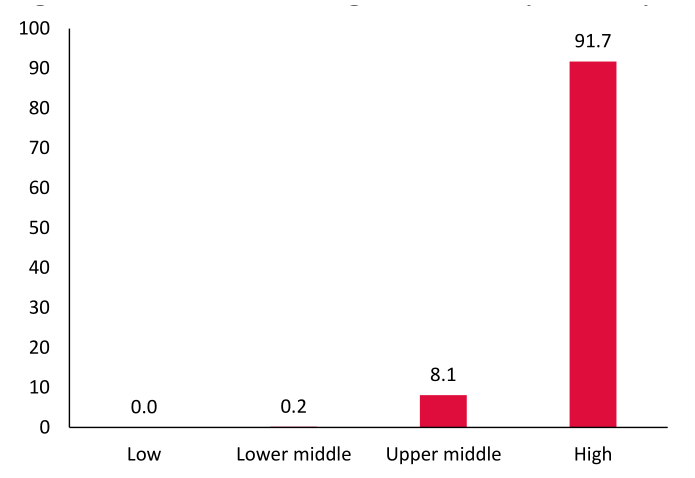
Note: All the values are expressed in percentage. The source is EIB (2008). The country classification is based on the World Bank’s Gross National Income (GNI) per capita criteria.
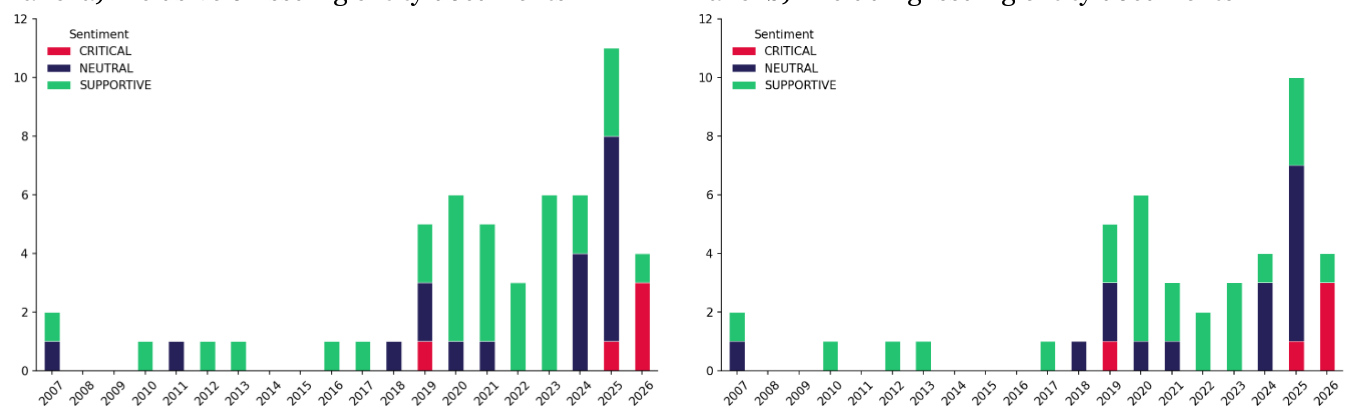
Note: The vertical axis represents count of the documents published for a given transaction in a year.
4.4 Ifc mcpp (2013)
In 2013, IFC launched its Managed Co-Lending Portfolio Program (MCPP) with a US$3 billion trust fund mandate from SAFE of the People’s Bank of China (see IFC (2018); IFC (2022)). Under this structure, IFC established a trust to hold SAFE’s funds, agreed project eligibility criteria in advance, and then originated development loans on a co-lending basis (see IFC (2018); IFC (2022)). IFC signed each loan twice, once for its own account and once as the implementing entity for the trust fund, and this arrangement became known as MCPP SAFE (see IFC (2018); IFC (2022)).
MCPP SAFE was designed as a cross-sectoral platform, allowing investment across the range of sectors in which IFC could lend (see IFC (2018); IFC (2022)). It mobilised government capital for co-lending with IFC in private-sector development projects and established the first category of MCPP structure: trust funds (see IFC (2018); IFC (2022)). In 2016, IFC introduced MCPP Infrastructure with support from SIDA (see IFC (2018); IFC (2022)). This version used a B-loan fund focused on infrastructure financing, with a senior tranche placed with private institutional investors and a junior tranche funded by IFC and SIDA, creating the second category of MCPP structure: B-loan funds (see IFC (2018); IFC (2022)).
In 2017, IFC launched three additional MCPP structures (see IFC (2018); IFC (2022)). MCPP HKMA followed the same trust fund model as MCPP SAFE, while MCPP URP and MCPP FIG introduced portfolio credit insurance programmes (see IFC (2018); IFC (2022)). Under these arrangements, IFC originated loans according to pre-agreed eligibility criteria and retained them on its balance sheet, while private insurers provided credit insurance or unfunded risk participation (see IFC (2018); IFC (2022)). These programmes formed the third category of MCPP structure: credit insurance programmes, and they helped mobilise private insurer capital through portfolio risk transfer (see IFC (2018); IFC (2022)).
As part of market research, no comparable structure to IFC’s MCPP was identified; accordingly, this section documents its growth. Under the definition in Section 2.3, growth in the programme’s own committed volumes is not a follow-on demonstration effect, because follow-on deals are transactions undertaken without the involvement of the original transacting institution. The growth described below is therefore recorded as context on the scale of the programme and on the willingness of new third-party investors to participate, and not as evidence of independent replication. The programme was launched with an initial investor pool of $3 billion and, by the end of FY2025, IFC reported that this had increased to $19.2 billion (see Table 4.1). As of FY25, the programme had allocated $14.4 billion across 371 projects in 72 countries. Furthermore, recent participants (post-2018) have primarily engaged in MCPP through the credit insurance structure (see Table 4.2).
The borrowing countries associated with IFC’s private co-financing in fiscal year 2017 were classified according to the World Bank’s country income groups. Information on private co-finance classified by income classification was obtained from Joint Report (2018). The distribution of borrowers was concentrated in middle-income countries[9], and the weighted average income classification of borrowing countries was lowermiddle income (see Figure 4.8).
To assess market awareness and perceptions of IFC’s MCPP, 37 publicly available documents, including articles, reports, and academic studies, were collected and analysed (see Appendix 1 for further details). The findings indicate that market sentiment towards the programme was predominantly supportive, as illustrated in Figure 4.9. Between 2014 and 2016, IFC actively promoted the programme and focused on strengthening market understanding and perception. From 2017 onwards, the programme was generally viewed favourably, with only one identified document expressing a critical perspective. Across the corpus, 32 documents expressed supportive sentiment, of which nine were published by IFC, leaving 23 supportive documents from independent sources. Table A2.3 reports the corpus by sentiment and, separately, by source type, using the categories academic, industry, issuer and regulator.
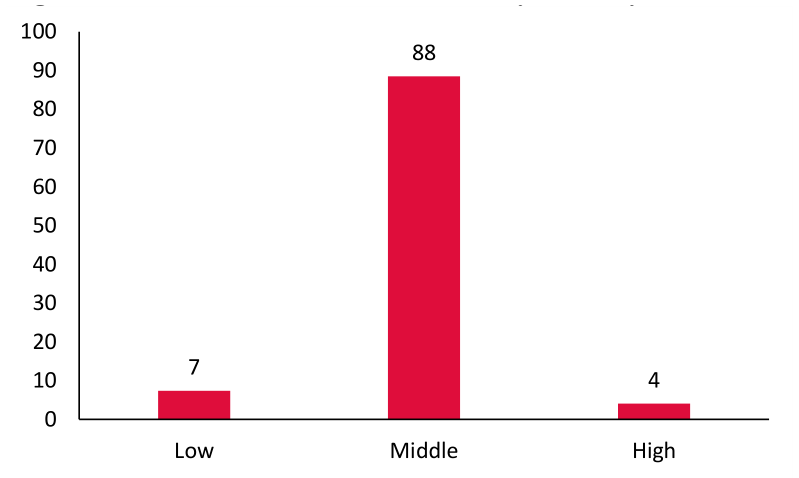
Note: All values are percentages. The source is Joint Report (2018). The country classification is based on the World Bank’s Gross National Income (GNI) per capita criteria.
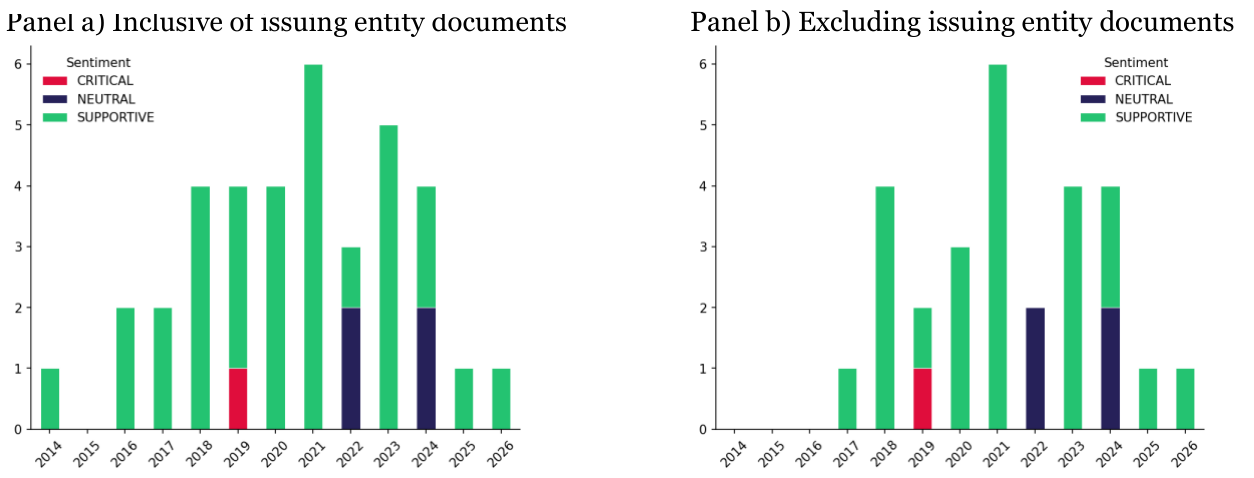
Note: The vertical axis represents count of the documents published for a given transaction in a year.
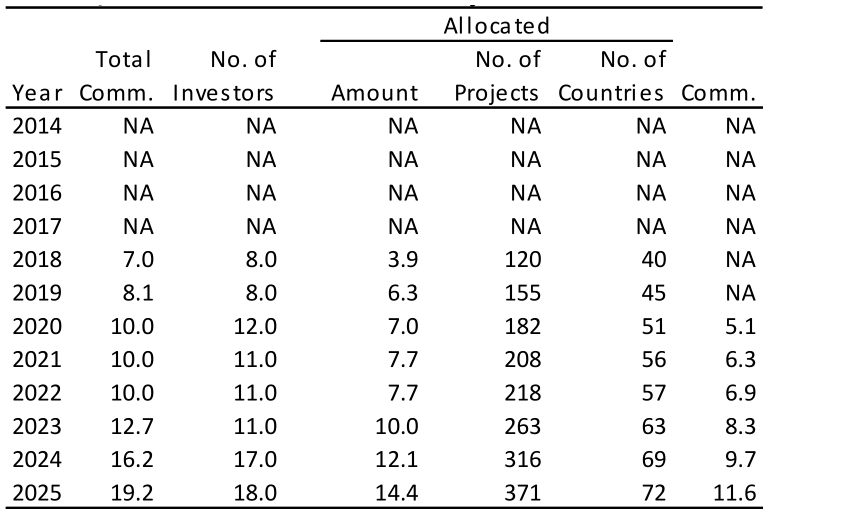
Show as data
| Allocated | ||||||
|---|---|---|---|---|---|---|
| Year | Total Comm. | No. of Investors | Amount | No. of Projects | No. of Countries | Comm. |
| 2014 | NA | NA | NA | NA | NA | NA |
| 2015 | NA | NA | NA | NA | NA | NA |
| 2016 | NA | NA | NA | NA | NA | NA |
| 2017 | NA | NA | NA | NA | NA | NA |
| 2018 | 7.0 | 8.0 | 3.9 | 120 | 40 | NA |
| 2019 | 8.1 | 8.0 | 6.3 | 155 | 45 | NA |
| 2020 | 10.0 | 12.0 | 7.0 | 182 | 51 | 5.1 |
| 2021 | 10.0 | 11.0 | 7.7 | 208 | 56 | 6.3 |
| 2022 | 10.0 | 11.0 | 7.7 | 218 | 57 | 6.9 |
| 2023 | 12.7 | 11.0 | 10.0 | 263 | 63 | 8.3 |
| 2024 | 16.2 | 17.0 | 12.1 | 316 | 69 | 9.7 |
| 2025 | 19.2 | 18.0 | 14.4 | 371 | 72 | 11.6 |
Note: The source of the data is IFC’s annual financial statements. Comm. means commitment. The amount is expressed in US$ billion.
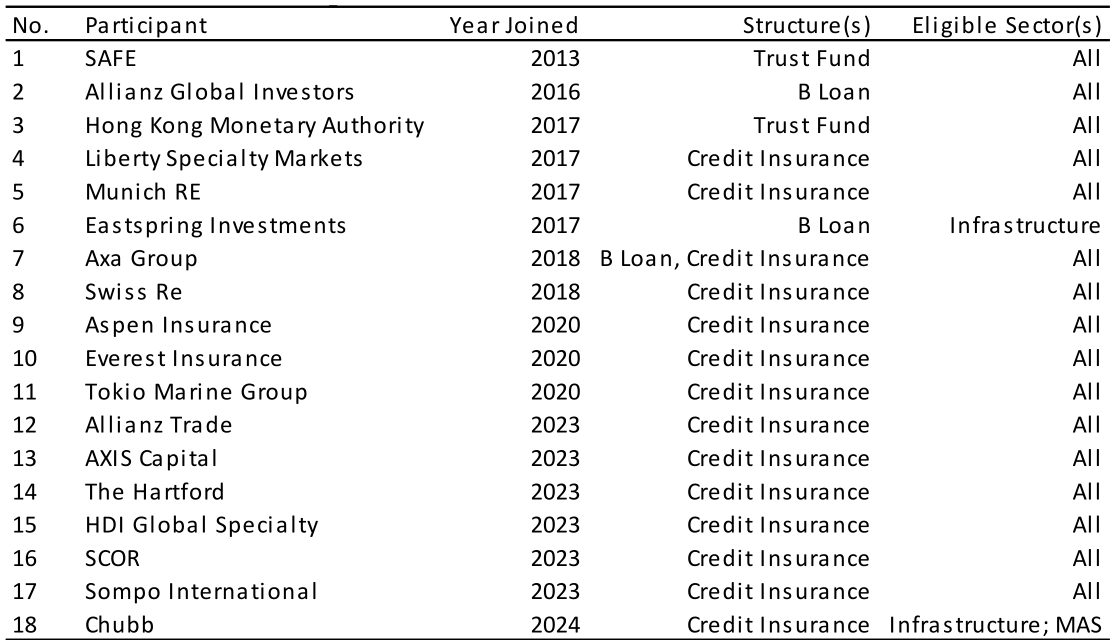
Show as data
| No. | Participant | Year Joined | Structure(s) | Eligible Sector(s) |
|---|---|---|---|---|
| 1 | SAFE | 2013 | Trust Fund | All |
| 2 | Allianz Global Investors | 2016 | B Loan | All |
| 3 | Hong Kong Monetary Authority | 2017 | Trust Fund | All |
| 4 | Liberty Specialty Markets | 2017 | Credit Insurance | All |
| 5 | Munich RE | 2017 | Credit Insurance | All |
| 6 | Eastspring Investments | 2017 | B Loan | Infrastructure |
| 7 | Axa Group | 2018 | B Loan, Credit Insurance | All |
| 8 | Swiss Re | 2018 | Credit Insurance | All |
| 9 | Aspen Insurance | 2020 | Credit Insurance | All |
| 10 | Everest Insurance | 2020 | Credit Insurance | All |
| 11 | Tokio Marine Group | 2020 | Credit Insurance | All |
| 12 | Allianz Trade | 2023 | Credit Insurance | All |
| 13 | AXIS Capital | 2023 | Credit Insurance | All |
| 14 | The Hartford | 2023 | Credit Insurance | All |
| 15 | HDI Global Specialty | 2023 | Credit Insurance | All |
| 16 | SCOR | 2023 | Credit Insurance | All |
| 17 | Sompo International | 2023 | Credit Insurance | All |
| 18 | Chubb | 2024 | Credit Insurance | Infrastructure; MAS |
Note: SAFE means State Administration of Foreign Exchange and MAS denote manufacturing, agribusiness and services. All includes investments across three of IFC's primary industry sectors: Financial Institutions; Infrastructure; and MAS.
4.5 Trade MAPS (2013)
In December 2013, Citigroup and Santander launched Trade MAPS 1 Limited, a multi-bank securitisation platform for global short-term trade finance loans (Citigroup et al. (2013)) with Citigroup, Morgan Stanley and Santander acting as joint bookrunners on the first issuance. At the same time, they completed the platform’s first issuance, a US$1 billion three-year floating-rate note transaction, Series 2013-1, which included four note classes ranging from triple-A to sub-investment grade at issuance (see Citigroup et al. (2013)). The lower-rated Class C and D notes were intended to transfer credit risk to investors and support capital relief for Citigroup and Santander (see Citigroup et al. (2013)).
Although the first issuance securitised trade-finance loans originated by Citigroup and Santander, the platform was designed as a blueprint that could later be used by other global trade finance banks (see Citigroup et al. (2013)). The programme had been under development since 2011, when Citi announced that ING Bank and Santander would co-sponsor it. ING co-sponsored the platform but did not originate receivables for the first issuance. The sponsoring banks presented Trade MAPS at launch as the first multi-bank securitisation platform for global trade finance loans, and expected it to support repeat issuances and participation by additional banks (see Citigroup et al. (2013)).
Trade MAPS was innovative because it combined a multi-bank structure with the securitisation of a heterogeneous, cross-border pool of trade-finance assets (see Citigroup et al. (2013)). Trade-finance loans are difficult to standardise because they cover multiple product types with varying documentation, and their crossborder nature can add legal and operational complexity to funded securitisations (see Citigroup et al. (2013)).
The platform also incorporated features typical of short-term securitisations, including a master issuer structure, under which a single issuing vehicle supports multiple series of notes backed by a common pool of receivables, and a revolving period during which repaid receivables could be replaced by new assets (see Citigroup et al. (2013)). Trade MAPS 1 was therefore built to support future issuances under the same platform, while the structure also had to accommodate multiple booking centres and several asset-purchasing entities across different jurisdictions to manage the legal and tax constraints associated with the underlying receivables (see Citigroup et al. (2013)).
However, the research identified no subsequent issuance under the Trade MAPS platform. As Table 4.3 shows, securitisation transactions involving trade receivables remain limited. Trafigura was the only issuer with repeated trade-receivables securitisations. Its first issuance was US$91 million in 2011, prior to Trade MAPS, so it cannot constitute a follow-on transaction attributable to Trade MAPS. The available issuance data therefore provide limited evidence that Trade MAPS generated a material demonstration effect in this asset class.
Three trade-receivables securitisations closed after Trade MAPS: Trafigura Securitisation Finance PLC 2014-1 (US$300 million), 2017-1 (US$500 million) and 2018-1 (US$500 million). These are counted as neighbourhood deals rather than follow-on deals. They securitise commodity trade receivables and so parallel the asset class, but they are single-seller programmes continuing a series Trafigura began in 2011, they do not use the multi-bank master issuer platform that was the innovation in Trade MAPS, and no document reviewed connects them to it. These are the only trade-receivables transactions identified after Trade MAPS, and no transaction identified in this study replicates the multi-bank platform itself.
Interview evidence was gathered from a senior practitioner directly involved in structuring the 2013 issuance. The account is reported here in anonymised and summary form. It indicates that the absence of a second issuance reflected the economics of the structure and the circumstances of the participants rather than any deficiency in the transaction, which closed and distributed successfully.
Several factors emerged. First, the participating institutions approached the platform with different objectives. One was principally seeking term funding at a time when wholesale markets were difficult and internal funding costs were elevated; the other was principally seeking credit risk transfer. Those priorities were reconcilable for a single issuance, but the participants found it very challenging to go forward on that basis, since a structure optimised for one objective delivered comparatively little to the other. Second, the two loan portfolios differed materially in granularity. The more concentrated portfolio required a substantially larger retained junior position to support the senior ratings, which left limited capital benefit for that participant and weakened the case for a repeat transaction. Third, the assets were booked across multiple jurisdictions, and each additional booking centre introduced its own true sale and legal questions. Preparation took around eighteen months and the associated legal costs were described as high relative to the benefit obtained.
The conditions that motivated the transaction also eased. As funding markets normalised, the internal funding cost charged to the trade finance business moderated to the point where retaining the assets became cheaper than funding them externally, removing the principal incentive for one of the participants. A further issuance was publicly anticipated in early 2014 but was not brought to market. The interview evidence therefore points to a combination of differing institutional priorities, portfolio heterogeneity, execution cost and a change in market conditions, rather than to any failure of the structure itself.
The borrowing countries associated with Trade MAPS in fiscal year 2014 were classified according to the World Bank’s income group categories. Information on the top three borrowing countries[10] is available in the Fitch
(2014) report. Here we assume the income-group distribution of the three largest country exposures is representative of the remaining portfolio. This assumption is necessary because country-level information was unavailable for the remaining 41% of the portfolio and introduces uncertainty into the income classification. The identified portfolio exposure was concentrated in high-income countries, and the estimated weightedaverage classification was also high-income (see Figure 4.10).
To assess market awareness of Trade MAPS, 20 publicly available documents, including articles, reports, and academic studies, were collected and analysed (see Appendix 1 for further details). The findings indicate that market sentiment towards the programme was predominantly supportive or neutral, with limited critical commentary, as illustrated in Figure 4.11.
Market discussion of the transaction was concentrated in 2013 and 2014, the year of issuance and the year following it. After 2014, five references to the programme were identified, one each in 2016, 2020, 2024, 2025 and 2026 (see Table A2.4). Across the corpus, 12 documents from independent sources expressed supportive sentiment, of which 11 were published in 2013 or later.
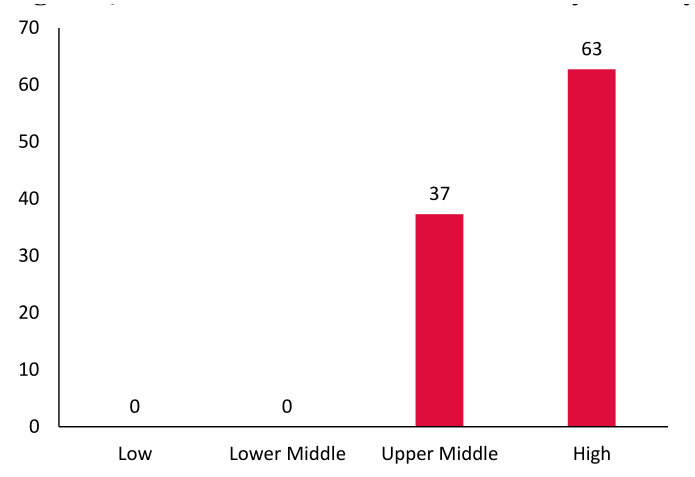
Note: All values are percentages. The source is Fitch (2014). The country classification is based on the World Bank’s Gross National Income (GNI) per capita criteria.
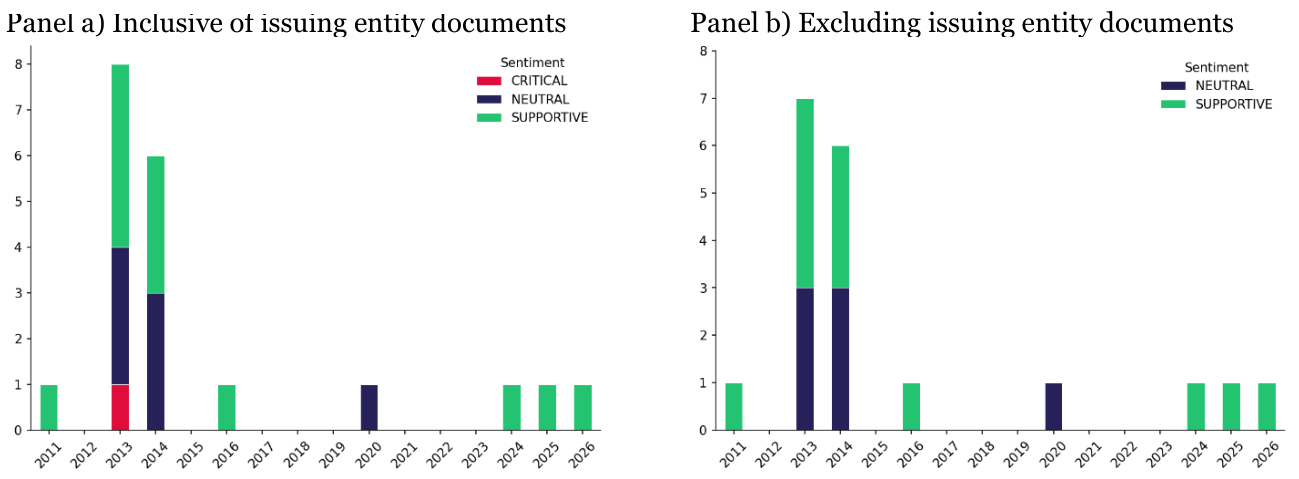
Note: The vertical axis represents the count of the documents published each year.
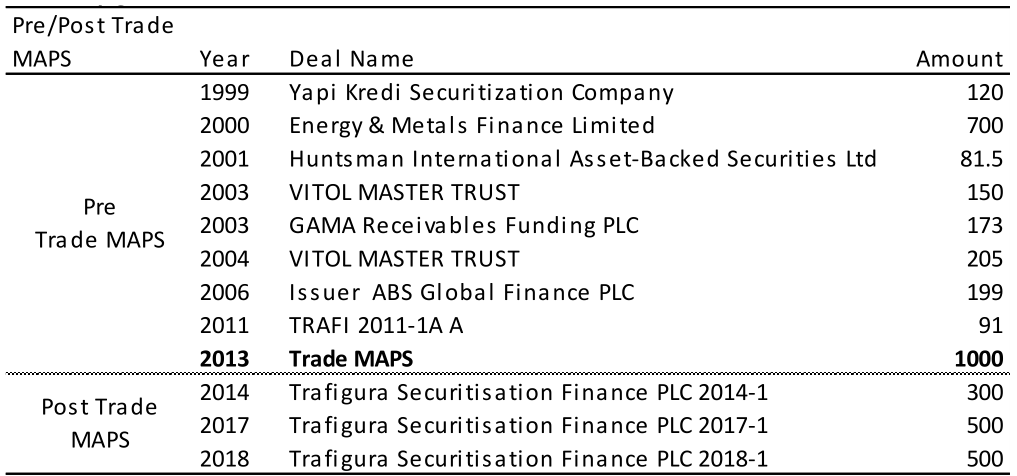
Show as data
| Pre/Post Trade MAPS | Year | Deal Name | Amount |
|---|---|---|---|
| Pre Trade MAPS | 1999 | Yapi Kredi Securitization Company | 120 |
| 2000 | Energy & Metals Finance Limited | 700 | |
| 2001 | Huntsman International Asset-Backed Securities Ltd | 81.5 | |
| 2003 | VITOL MASTER TRUST | 150 | |
| 2003 | GAMA Receivables Funding PLC | 173 | |
| 2004 | VITOL MASTER TRUST | 205 | |
| 2006 | Issuer ABS Global Finance PLC | 199 | |
| 2011 | TRAFI 2011-1A A | 91 | |
| 2013 | Trade MAPS | 1000 | |
| Post Trade MAPS | 2014 | Trafigura Securitisation Finance PLC 2014-1 | 300 |
| 2017 | Trafigura Securitisation Finance PLC 2017-1 | 500 | |
| 2018 | Trafigura Securitisation Finance PLC 2018-1 | 500 |
Note: The amount is expressed in US$ million. The data source is Bloomberg.
4.6 Room2Run (2018)
In 2018, the African Development Bank (AfDB) completed Room2Run (R2R), a synthetic securitisation of a US$1 billion portfolio of existing loans (see Mizuho (2018); Risk Control (2019)). The transaction transferred credit risk through a structure consisting of a junior tranche, a mezzanine tranche protected by private-sector investors, and a senior tranche retained by the Bank (see Mizuho (2018); Risk Control (2019)). Credit protection on the mezzanine tranche was provided by the International Infrastructure Finance Company II (IIFC II) and Africa50, while the European Commission’s European Fund for Sustainable Development covered the senior mezzanine segment (see Mizuho (2018); Risk Control (2019)).
The reference portfolio included approximately 45 non-sovereign loans spread across 16 African countries and 13 sectors, with roughly half of the exposure in infrastructure and the remainder in financial institutions (see
Mizuho (2018); Risk Control (2019)). AfDB's stated objective was to reduce risk-weighted assets in order to strengthen its risk-adjusted capital ratio, which is a key measure used by Standard & Poor’s in assessing MDB capital adequacy (see Mizuho (2018); Risk Control (2019)).
The borrowing countries associated with Room2Run were classified according to the World Bank’s income group categories. Information on the three largest borrowing countries is available in Risk Control’s (2019) report. The distribution of borrowers was concentrated in lower-middle-income countries, and the weightedaverage income classification was also lower-middle-income (see Figure 4.12).
The Room2Run transaction is relevant in the literature because it illustrates how MDBs have begun to use balance sheet risk transfer techniques to create capital space and potentially expand lending capacity (see Mizuho (2018); Risk Control (2019)). It has also been discussed as part of the renewed use of securitisation by MDBs after earlier isolated precedents, including an IFC transaction from two decades earlier (see Mizuho (2018); Risk Control (2019)).
The literature highlights that Room2Run was unusual in its focus on non-sovereign obligor loans, which make up only a small part of the balance sheets of most MDBs (see Mizuho (2018); Risk Control (2019)). It is also notable for the attention given to rating and pricing, since the transaction required a rating methodology acceptable to Standard & Poor's and a credible basis for comparing its pricing with alternative risk transfer structures (see Mizuho (2018); Risk Control (2019)). For these reasons, Room2Run is often cited not simply as a financing deal, but as a case study in MDB portfolio risk transfer and capital optimisation (see Mizuho (2018); Risk Control (2019)).
Following the first Room2Run non-sovereign obligor (NSO) transaction in 2018, AfDB launched the Room2Run sovereign obligor (SO) transaction in 2022, valued at US$2 billion (see Table 4.4). Because Room2Run SO was issued by the originating institution, it is excluded from the follow-on measures under the definition in Section 2.3 and is reported here as context only. Four transactions by other institutions followed: BOAD’s DOLI-P 2023 (US$252 million) and DOLI-P 2024 (US$273 million), IDB Invest’s Scaling4Impact (2024, US$1,000 million) and IFC’s EMSP1 (2025, US$510 million). Each transfers credit risk on a portfolio of MDB loans and each is classified as a follow-on deal, although BOAD’s second transaction is treated as a repeat issuance under an established programme rather than as a separate instance of replication. The increase in transactions after 2022 is consistent with increased MDB interest in portfolio securitisation and risk transfer.
The evidence for attribution is sequential rather than direct. No document reviewed for this study records that any of these institutions cited Room2Run as its reason for transacting, so the causality classification rests on the timing of the transactions, their common structure and the absence of comparable MDB balance sheet risk transfer between the IFC precedent two decades earlier and 2018. The four-year interval between Room2Run and the next transaction by another MDB is consistent with the time required to develop internal capital and accounting treatments, to obtain board approval and to assemble a reference portfolio, but the evidence available does not establish which of these was binding. Standard and Poor’s willingness to recognise the capital benefit of the structure was a necessary condition for Room2Run and plausibly for the transactions that followed, and the effect of that methodological development cannot be separated from the demonstration effect of the transaction itself on the evidence assembled here. These points qualify the High causality classification assigned in Section 5.3.
Financing replication and market awareness are scored separately. Replication is measured by the volume and rate of the four subsequent transactions, while awareness is measured by the document corpus and the industry recognition discussed below. A transaction may score highly on one and not the other, and Room2Run’s scores should be read in that light.
To evaluate market awareness of Room2Run (2018), 25 publicly available documents, including articles, reports, and academic studies, were collected and analysed (see Appendix 1 for further details). The findings indicate that market sentiment towards the transaction was predominantly supportive, although criticism was persistent. Of the 25 documents, 14 were supportive, seven critical and four neutral, and critical documents appear in most years of the review period, including two in 2026 (as illustrated in Figure 4.13).
Moreover, publications concerning Room2Run continued throughout the period reviewed, indicating that documentary coverage continued beyond the initial issuance. Only two of the 25 documents were published by AfDB, which is why the two panels of Figure 4.13 differ little. Excluding those two leaves 12 independent supportive publications, consistent with the figure reported in Appendix 2.
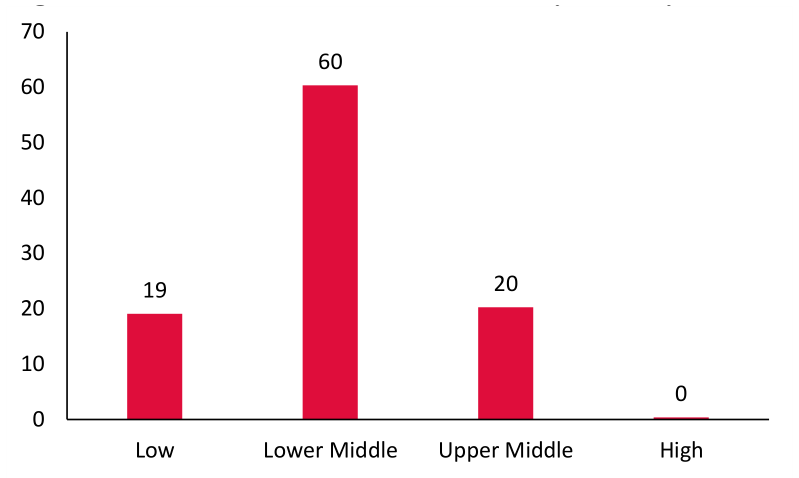
Note: All values are percentages. The source is Risk Control (2019). The country classification is based on the World Bank’s Gross National Income (GNI) per capita criteria.
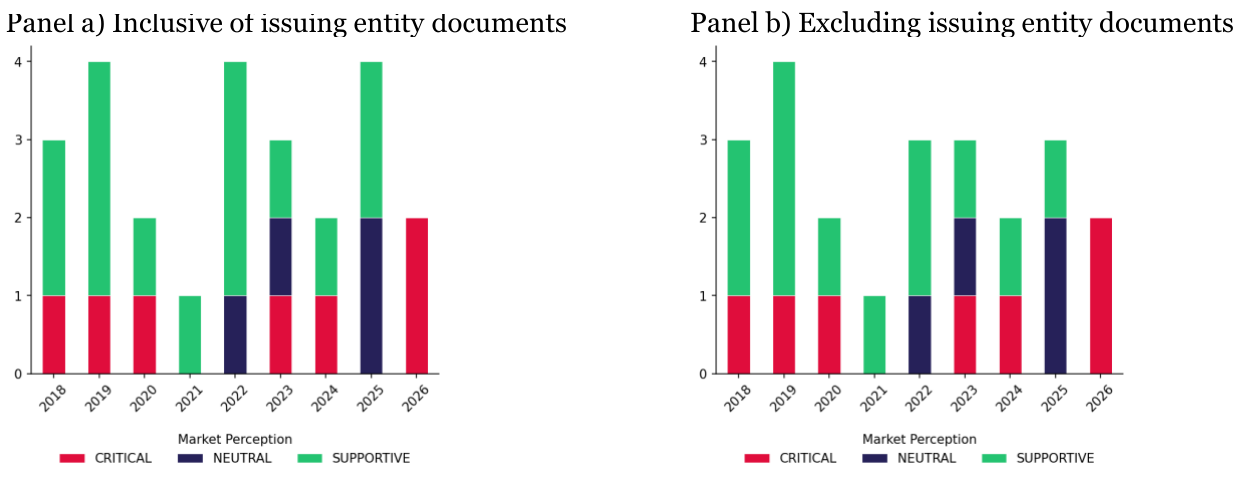
Note: The vertical axis shows the number of documents published in each year.
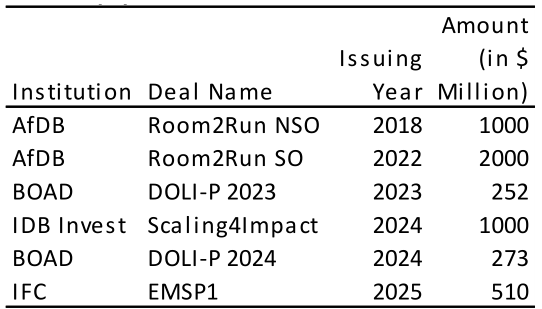
Show as data
| Institution | Deal Name | Issuing Year | Amount (in $ Million) |
|---|---|---|---|
| AfDB | Room2Run NSO | 2018 | 1000 |
| AfDB | Room2Run SO | 2022 | 2000 |
| BOAD | DOLI-P 2023 | 2023 | 252 |
| IDB Invest | Scaling4Impact | 2024 | 1000 |
| BOAD | DOLI-P 2024 | 2024 | 273 |
| IFC | EMSP1 | 2025 | 510 |
Note: Here NSO denotes non-sovereign obligors and SO denotes sovereign obligors. Sources: MOBILIST (2025) and IFC (2026a). The analysis uses an exchange rate of XOF 1 = US$0.0017.
4.7 Bayfront Infrastructure Capital IV (2023)
In September 2023, Bayfront Infrastructure Management priced Bayfront Infrastructure Capital IV (BIC IV), the fourth issuance under its infrastructure asset-backed securities platform, for US$410.3 million in notes backed by a loan portfolio of the same size (see Bayfront (2023); MOBILIST (2023)).
Although it was the fourth transaction in the BIC platform, BIC IV was a landmark issuance because MOBILIST, the UK government's flagship public-markets investment programme, committed up to US$20.4 million to invest in the equity tranche, marking the first participation by a third-party investor in the BIC equity tranche (see Bayfront (2023); MOBILIST (2023)).
Bayfront, as sponsor, acquired US$20.6 million of the equity tranche before the issue date as retention preference shares, equal to 5% of the capital structure, and retains them for the life of the transaction. MOBILIST was allocated the balance of US$5 million, or 19.5% of the tranche (see Bayfront (2023); MOBILIST (2023)).
MOBILIST's commitment of up to US$20.4 million was an anchor backstop rather than a firm subscription. Strong demand for the rated notes allowed a thinner equity tranche, sized at US$25.6 million or 6.2% of the transaction, and the sponsor's 5% retention absorbed US$20.6 million of that. MOBILIST therefore received the entire US$5 million balance available to third parties, and its allocation fell because less first-loss capital was needed, not because demand for the equity was weak. Two implications follow for the transaction as a demonstration template. Third-party participation in the equity of an infrastructure asset-backed transaction proved feasible, which is what the investment was intended to establish. But the retention requirement caps how much of that tranche can be placed, so the better a transaction is received, the less room remains for a development investor to occupy.
BIC IV offered five classes of notes, four of which were rated by Moody's and listed on the Singapore Exchange (see Bayfront (2023); MOBILIST (2023)). It also included a senior dedicated sustainability tranche, Class A1- SU, which had already appeared in BIC II and BIC III (see Bayfront (2023); MOBILIST (2023)). Another innovation was the pre-placement of the unrated junior Class D Notes with Apollo-managed funds, supported by a guarantee from GuarantCo, a member of PIDG (see Bayfront (2023); MOBILIST (2023)). This structure reduced the size of the equity tranche and allowed Bayfront to meet regulatory retention requirements while broadening the transaction's investor base (see Bayfront (2023); MOBILIST (2023)). In this sense, BIC IV built on earlier Bayfront issuances but also introduced new elements that strengthened the platform's demonstration value (see Bayfront (2023); MOBILIST (2023)).
The borrowing countries associated with BIC IV were classified according to the World Bank’s income group categories. Information on the top three borrowing countries are available in Moody’s (2023b) report. The distribution of borrowers was concentrated in lower-middle income countries, and the weighted average income classification of borrowing countries is upper-middle income (see Figure 4.15).
The Bayfront platform had first launched in 2018 and, as at end of December 2025, comprised seven issuances in total, as shown in Figure 4.14. The data presented draws on Moody's rating reports for each new transaction. Issuance volume increased significantly in 2025, with both BIC VI and BIC VII priced within the same calendar year, together totalling $1,232 million.
In May 2023, The Hong Kong Mortgage Corporation Limited, priced Bauhinia Infrastructure Loan Backed Securities I (Bauhinia ILBS 1), the first issuance under that platform, for US$404.8 million in notes backed by project finance and corporate infrastructure loans. The Bauhinia ILBS series has since issued consistently each year, with transaction sizes ranging between US$400 million and US$450 million, as shown in Figure 4.14.
The Bauhinia ILBS series bears close resemblance to the BIC platform across several key dimensions. Both programmes issue infrastructure asset-backed securities rated by Moody's and employ a comparable tranche structure, including a dedicated sustainability tranche. These structural similarities, combined with the consistency of issuance volumes observed in the Bauhinia series, suggest that the Bauhinia ILBS platform represents a successful replication of the BIC transaction model in a distinct institutional and regulatory context.
Applying the counterfactual test used for HBOS and the EIB Climate Awareness Bond in Section 2.3, the question is whether Bauhinia would have emerged without BIC IV. The evidence supporting attribution is that Bauhinia ILBS 1 adopted the same instrument, the same rating agency, a comparable tranche structure including a dedicated sustainability tranche and a similar transaction size, and that it followed three earlier BIC issuances which had established the template. The evidence against is that Bauhinia ILBS 1 priced in May 2023, four months before BIC IV, so it cannot have been caused by that transaction; that its sponsor, The Hong Kong Mortgage Corporation Limited, is a public institution with its own mandate and balance sheet motivation; and that the innovation specific to BIC IV, third-party participation in the equity tranche, has not been replicated in the Bauhinia series. On this evidence the demonstration effect belongs to the BIC platform established in 2018 rather than to BIC IV alone, and the High causality classification assigned in Section 5.3 should be read as applying to the platform. This is recorded as a limitation of the case study.
To evaluate market awareness and perceptions of BIC IV (2023), 30 publicly available documents, including articles, reports, and academic studies, were collected and analysed (see Appendix 1 for further details). Bayfront published 20 of them, leaving ten from independent sources, of which six are supportive and four neutral; no document in the corpus is critical (see Table A2.6). The independent base is thinner still once timing is taken into account. Eleven documents predate the September 2023 issuance, five of them independent, so only five independent documents were published in the transaction year or later. The corpus therefore records the issuer's own communications more than any settled view of the transaction, and the sentiment distribution shown in Figure 4.16 should be read on that basis.
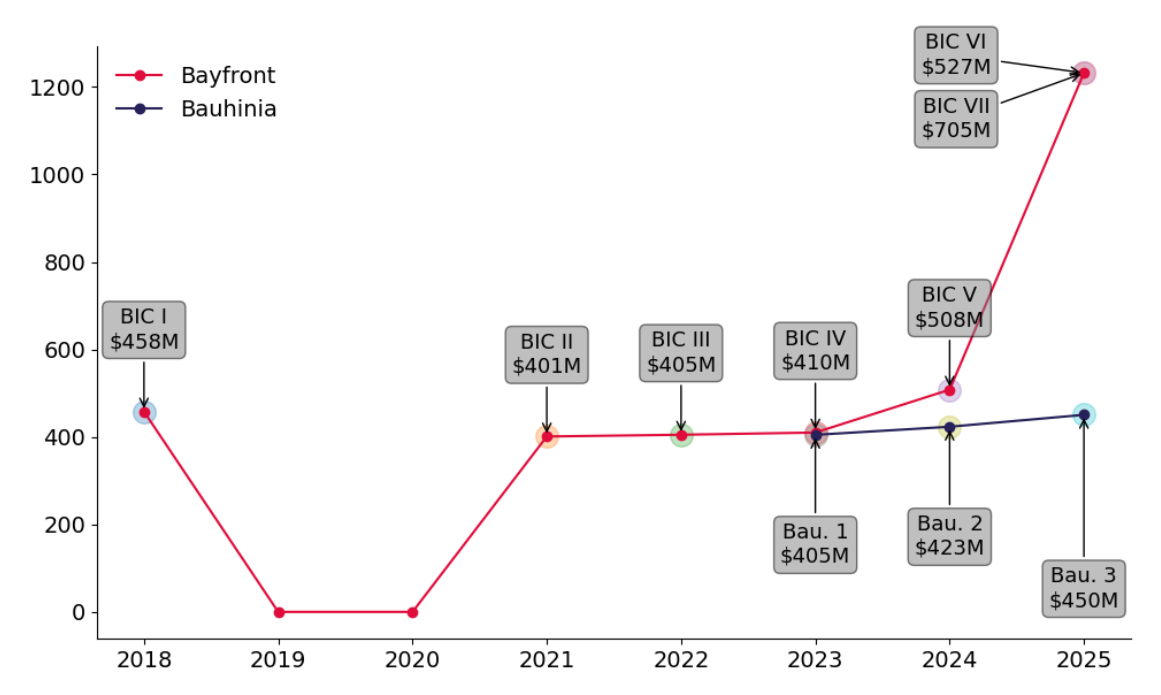
Note: The vertical axis shows issuance volumes in US$ millions. Sources: Moody’s new-issuance rating reports for each transaction. Here BIC denotes Bayfront Infrastructure Capital and Bau. denotes Bauhinia.
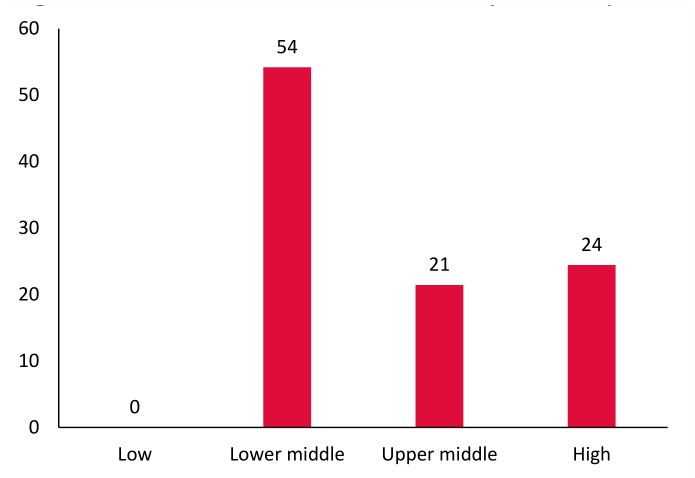
Note: All the values are expressed in percentage. The source is Moody’s (2023b). The country classification is based on the World Bank’s Gross National Income (GNI) per capita criteria.
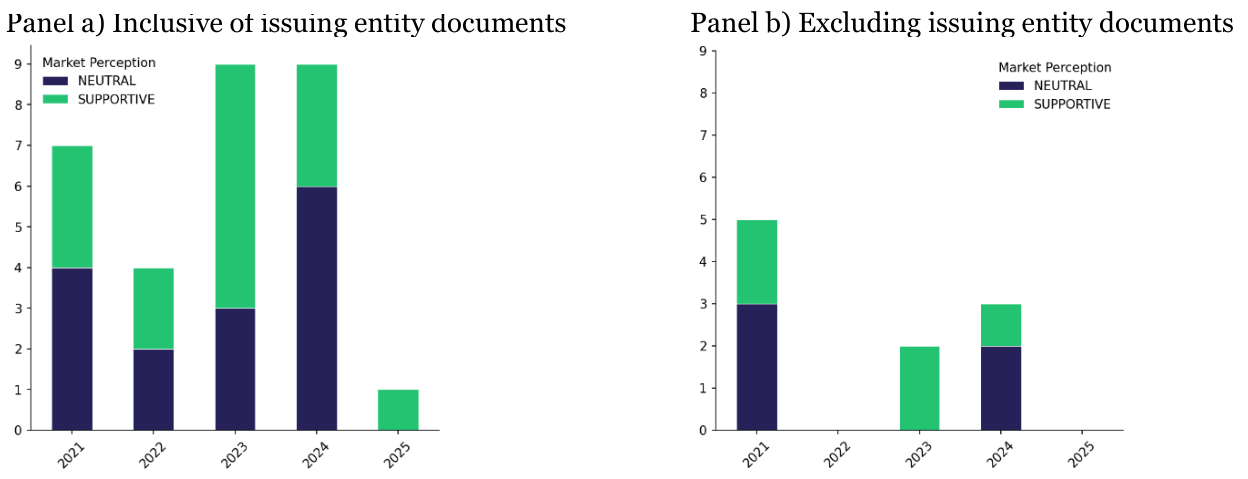
Note: The vertical axis represents count of the documents published for a given transaction in a year.
5. Scoring Re-Evaluation
5.1 Introduction
This section brings together the ex-ante and ex-post scoring results for the six transactions examined in Section
4. The ex-ante scores, originally derived in Risk Control (2024) using the structured scorecard described in Section 2.2, reflect the predicted capacity of each transaction to generate demonstration effects at the point of deal inception. The ex-post scores, derived using the framework set out in Section 2.3 and the data collected in Sections 3 and 4, reflect the realised outcomes observed following transaction closing.
Comparing the two sets of scores allows an assessment of whether the ex-ante scoring approach is a reliable predictor of ex-post demonstration effect outcomes, and where the largest divergences between predicted and realised effects have occurred. Table 5.1 and Table 5.2 summarise the ex-ante and ex-post scores respectively, while Figure 5.1 presents their relationship.
5.2 Ex ante Scoring
The ex-ante scores for the six transactions reflect their predicted potential to generate demonstration effects across the four dimensions of the ex-ante framework: information generation, obstacles overcome, profitability and impact, and deal feasibility.
As shown in Table 5.1, HBOS, EIB CAB, Room2Run, and BIC IV each received ex-ante scores of 4, reflecting strong predicted performance across multiple dimensions, while IFC MCPP and Trade MAPS received scores of 3, reflecting more moderate predicted demonstration potential. The ex-post framework then takes these predicted channels and tests them against the observed evidence gathered in Section 4.
This subsection explains how the case study scores are determined for the example transactions.
1. Financing effects: The financing effects were assessed based on the level of annual issuance generated through both follow-on transactions and neighbourhood deals. HBOS Structured Covered Bond and EIB CAB contributed significantly to the growth of the covered bond and green bond markets; therefore, both transactions received a score of 2 across all four sub-indicators. IFC MCPP scores zero on all four, since no other institution replicated its structure and growth in the programme's own committed volumes is not a follow-on demonstration effect under the definition in Section 2.3. Trade MAPS also scores zero on both follow-on indicators, since no transaction identified in this study replicates the multi-bank platform; the three post-2013 Trafigura securitisations described in Section 4.5 are the sole basis for its single neighbourhood volume point. Room2Run and BIC IV each generated follow-on transactions as well as neighbourhood deals and were therefore assigned a score of 1 across all four indicators.
2. Causality adjustment: HBOS, Room2Run and BIC IV receive High causality scores, since the follow-on activity in each case would probably not have occurred without the reference transaction. No subsequent transactor cites the reference deal in any of the three, so each classification rests on timing, common structure and the absence of comparable precedent. Two carry qualifications. For Room2Run, the four later MDB transactions support attribution by sequence alone (see Section 4.6). For BIC IV, the classification applies to the BIC platform established in 2018 rather than to that transaction alone (see Section 4.7).
The EIB Climate Awareness Bond, IFC MCPP and Trade MAPS receive Low causality scores. For the EIB CAB, green bond issuance remained negligible for seven years and expanded only once the Green Bond Principles supplied the standards and investor base the transaction did not provide (see Section 4.3). For MCPP the classification is inert, since all four sub-indicators score zero and the multiplier has no base to act on. For Trade MAPS it applies to the single neighbourhood volume point, reducing the financing category from 0.5 to 0.1; the final score is unchanged at either classification.
3. Quality effects: this category combines two sub-indicators. Country classification by income, scored 0 to 4, applies the mapping in Table 2.1 to the weighted-average income classification of the countries to which financing is exposed. HBOS, the EIB Climate Awareness Bond and Trade MAPS are concentrated in high-income countries and score 0. BIC IV is upper-middle income and scores 1. IFC MCPP and Room2Run are lower-middle income and score 2. Quality of risk mobilisation, scored 0 to 2, is assessed on the criteria in Section 2.3: IFC MCPP, Room2Run and BIC IV each score 1, since private participants took unwrapped exposure while remaining senior to a retained loss piece, and the other three score 0.
4. Market perception: Market perception was assessed through a review of external articles published in relation to each transaction. Positive scores were assigned only where independent sources, rather than the issuer, published supportive articles. A transaction scored 0 where between zero and ten supportive articles were identified, 1 where between eleven and twenty were identified, and 2 where more than twenty were identified.
The count runs from the year of the reference transaction onwards, since documents predating a transaction cannot evidence its demonstration effect. The corpus records publication year rather than date, so the transaction year is retained in full. This matters for Trade MAPS, which priced in December 2013: the four supportive documents published that year are counted, and excluding them would reduce its count from eleven to seven.
Applying these rules, the EIB Climate Awareness Bond and IFC MCPP score 2, on 24 and 23 independent supportive documents respectively. Trade MAPS and Room2Run each score 1, on eleven and twelve. HBOS scores 0 on five. Bayfront also scores 0: only five of its thirty documents are both independent and published from 2023 onwards, well within the zero to ten band.
For the EIB Climate Awareness Bond, the count is taken over the full corpus to 2026 rather than over the eight-year observation window, since market interest in that transaction peaked around eleven years after issuance. This departure from the standard window is recorded here.
5. Industry awards: A score of 1 was assigned where the transaction received recognition or an award from an industry body. The indicator is binary, so BIC IV, which won three FinanceAsia awards in 2023, scores the same as HBOS, which won a single IFLR award in 2004. This is a granularity limitation of the present scorecard. Half-notch scoring, awarding 0.5 for a single award and 1 for awards from more than one body, would separate the two cases and is recommended for a future version.
6. Rating agency recognition: This indicator was assessed based on whether the transaction received a credit rating.
7. Listing status: Transactions that were publicly listed received a positive score.
8. Facilitation: Transactions issued into favourable market conditions received a score of -1, and those issued into unfavourable conditions a score of +1, as defined in Section 2.3.
The ex-post demonstration effect scores for the six transactions range from 2 to 4. AfDB’s Room2Run received the highest score of 4, corresponding to a “Very Strong” demonstration effect. This rating reflects the transaction’s success in generating follow-on transactions and providing a replicable template for similar structures in the market. The transaction also performed strongly in the awareness category, supported by industry recognition and positive market perception.
At the lower end of the range, IFC’s Managed Co-Lending Portfolio Program (MCPP) and Trade MAPS each received a score of 2, equivalent to a “Moderate” demonstration effect. In the case of IFC’s MCPP, the financing effects score reflects the absence of comparable platform structures subsequently developed by other DFIs. Its awareness effects score rests on market perception, where it scores the maximum, since the programme received no industry award, no rating agency recognition and no listing. For Trade MAPS, the lower score primarily reflects the absence of follow-on transactions and the lack of evidence of increased activity in trade finance securitisation following the transaction.
The remaining three transactions received scores of 3, corresponding to a “Strong” demonstration effect. These transactions achieved balanced performance across the different scorecard categories, resulting in consistently solid overall assessments.
Figure 5.1 illustrates the relationship between the ex-ante and ex-post demonstration effect scores for the six transactions analysed in this study. The results indicate a positive correlation between the two sets of scores. However, most observations lie to the right of the diagonal line, showing that ex-ante scores tend to be higher than the corresponding ex-post scores. This pattern suggests that ex-ante assessments may incorporate optimistic assumptions regarding the potential profitability, impact and information generated by the transaction. By contrast, ex-post scores are based on realised outcomes and observable market evidence, which provide a more grounded assessment of the actual demonstration effects achieved over time.
Of the six case studies, only BIC IV remains inside the eight-year observation window (see Figure 4.1). Its score is therefore provisional rather than a finding of partial performance, since evidence of follow-on activity may still accumulate before the window closes in 2031. This presents the FCDO with a distinct opportunity to strengthen the deal's potential demonstration effects. At present, BIC IV's ex-post demonstration score stands at 3, a figure driven primarily by weak financing and quality effects scores (see Table 5.2). Addressing these two areas offers the clearest route to an improved overall score.
With regard to financing effects, the annual issuance size of BIC transactions has been rising steadily, and this upward trajectory is expected to lift the current financial score by the close of the eight-year observation period. The FCDO can reinforce this trend by supporting consistent growth in issuance volumes, thereby consolidating the gains already underway. With regard to quality effects, the FCDO can actively advocate for an underlying portfolio weighted towards a greater proportion of low- and middle-income countries, which would raise the "country classification by income" score and align the transaction more closely with the FCDO's development objectives.
A further constraint is the limited body of independent analysis: at present, very few articles on BIC IV exist beyond those published by the issuing entity. The most direct remedy is disclosure rather than commissioned research. FCDO could work with Bayfront to publish portfolio performance data across the BIC transactions, covering loss experience, rating migration and the composition of the underlying loans. Data of that kind is the raw material third parties need in order to form and publish their own view, and analysis built on it is independent of both the sponsor and FCDO. Where FCDO does fund research directly, independence should be protected by arm's-length arrangements: published terms of reference, no right of approval over findings, and disclosure of the funding relationship. The terms of reference should be framed as an evaluation of performance rather than an assessment of benefits, so that an adverse finding remains a possible outcome. Disclosure of this kind would also give other institutions the information they need to replicate the structure.
The systematic tendency for ex-ante scores to exceed ex-post scores, evident in the clustering of observations to the right of the diagonal in Figure 5.1, suggests several remedies. The most direct is to bring the counterfactual reasoning that anchors the ex-post causality adjustment into the ex-ante stage: much of the divergence arises because ex-ante scoring credits a transaction's full potential follow-on activity, whereas the ex-post score discounts it by the degree to which the market would have developed regardless, so asking explicitly at the point of investment whether the innovation would likely emerge without the transaction would temper optimistic projections.
This should be reinforced by greater conservatism where the evidence base is thin, since the Trade MAPS and IFC MCPP cases show that transactions with limited transparency or no established comparator structures are especially prone to overestimation.
The ex-ante score should also be treated as provisional rather than fixed, with intermediate review points within the eight-year window allowing optimistic assumptions to be corrected progressively against early follow-on evidence, and the accumulating set of paired scores analysed as a feedback loop to identify which assumptions prove most consistently over-optimistic and refine the scoring guidance accordingly. An evidence base that, as it grows, could eventually support a standard calibration adjustment, though the present sample of six transactions is too small to estimate one reliably.
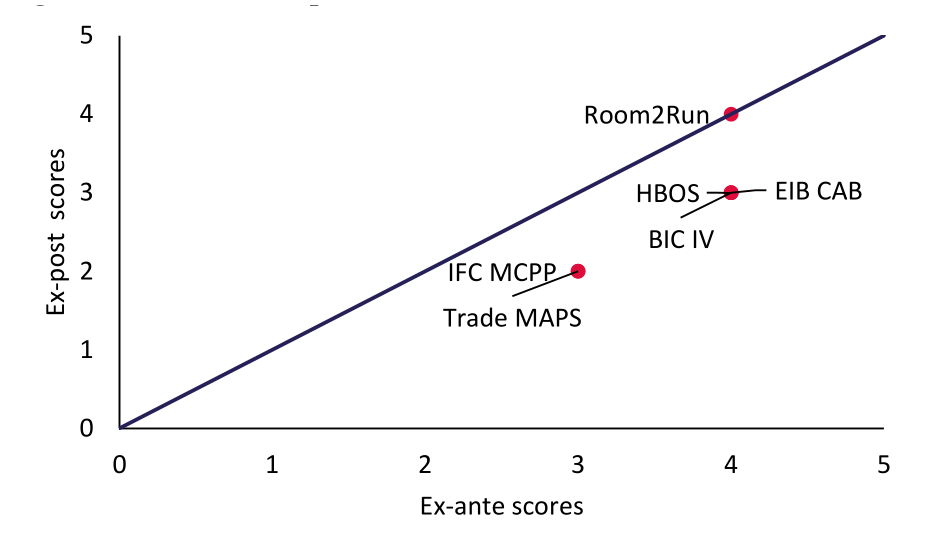
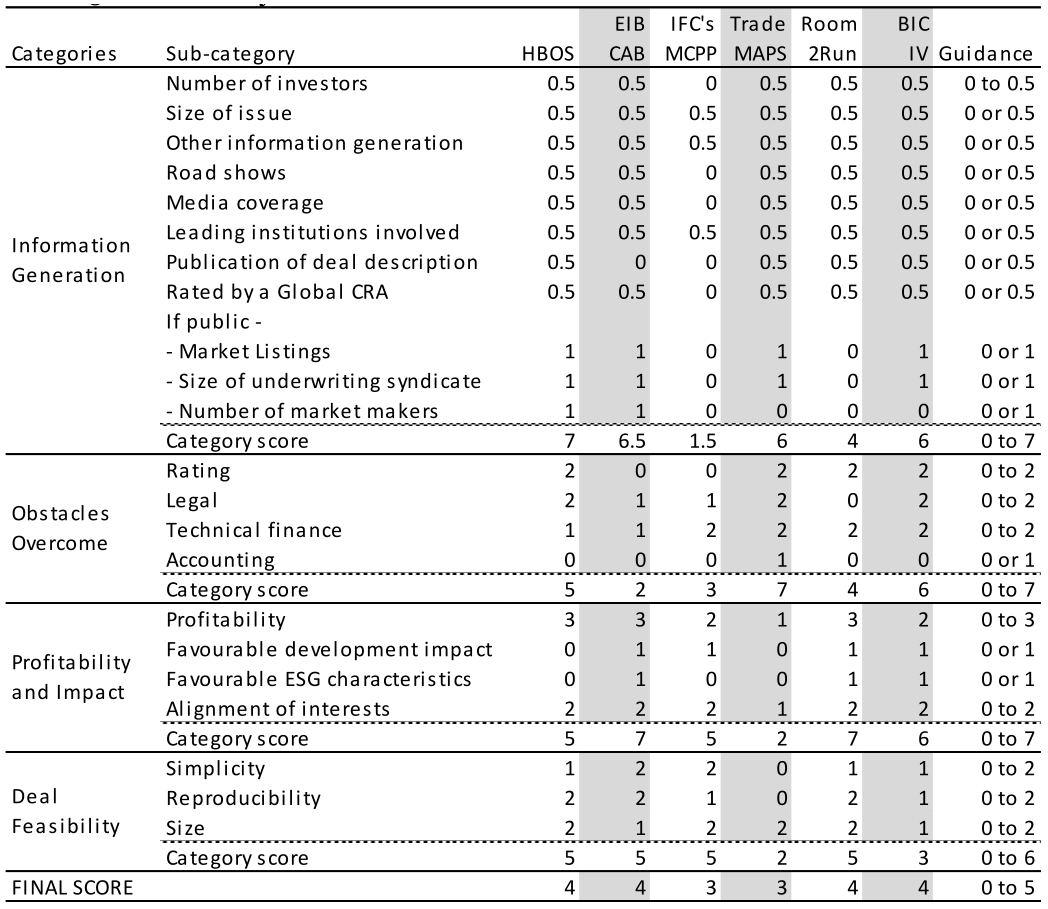
Show as data
| Categories | Sub-category | HBOS | EIB CAB | IFC's MCPP | Trade MAPS | Room 2Run | BIC IV | Guidance |
|---|---|---|---|---|---|---|---|---|
| Information Generation | Number of investors | 0.5 | 0.5 | 0 | 0.5 | 0.5 | 0.5 | 0 to 0.5 |
| Size of issue | 0.5 | 0.5 | 0.5 | 0.5 | 0.5 | 0.5 | 0 or 0.5 | |
| Other information generation | 0.5 | 0.5 | 0.5 | 0.5 | 0.5 | 0.5 | 0 or 0.5 | |
| Road shows | 0.5 | 0.5 | 0 | 0.5 | 0.5 | 0.5 | 0 or 0.5 | |
| Media coverage | 0.5 | 0.5 | 0 | 0.5 | 0.5 | 0.5 | 0 or 0.5 | |
| Leading institutions involved | 0.5 | 0.5 | 0.5 | 0.5 | 0.5 | 0.5 | 0 or 0.5 | |
| Publication of deal description | 0.5 | 0 | 0 | 0.5 | 0.5 | 0.5 | 0 or 0.5 | |
| Rated by a Global CRA | 0.5 | 0.5 | 0 | 0.5 | 0.5 | 0.5 | 0 or 0.5 | |
| If public - | ||||||||
| - Market Listings | 1 | 1 | 0 | 1 | 0 | 1 | 0 or 1 | |
| - Size of underwriting syndicate | 1 | 1 | 0 | 1 | 0 | 1 | 0 or 1 | |
| - Number of market makers | 1 | 1 | 0 | 0 | 0 | 0 | 0 or 1 | |
| Category score | 7 | 6.5 | 1.5 | 6 | 4 | 6 | 0 to 7 | |
| Obstacles Overcome | Rating | 2 | 0 | 0 | 2 | 2 | 2 | 0 to 2 |
| Legal | 2 | 1 | 1 | 2 | 0 | 2 | 0 to 2 | |
| Technical finance | 1 | 1 | 2 | 2 | 2 | 2 | 0 to 2 | |
| Accounting | 0 | 0 | 0 | 1 | 0 | 0 | 0 or 1 | |
| Category score | 5 | 2 | 3 | 7 | 4 | 6 | 0 to 7 | |
| Profitability and Impact | Profitability | 3 | 3 | 2 | 1 | 3 | 2 | 0 to 3 |
| Favourable development impact | 0 | 1 | 1 | 0 | 1 | 1 | 0 or 1 | |
| Favourable ESG characteristics | 0 | 1 | 0 | 0 | 1 | 1 | 0 or 1 | |
| Alignment of interests | 2 | 2 | 2 | 1 | 2 | 2 | 0 to 2 | |
| Category score | 5 | 7 | 5 | 2 | 7 | 6 | 0 to 7 | |
| Deal Feasibility | Simplicity | 1 | 2 | 2 | 0 | 1 | 1 | 0 to 2 |
| Reproducibility | 2 | 2 | 1 | 0 | 2 | 1 | 0 to 2 | |
| Size | 2 | 1 | 2 | 2 | 2 | 1 | 0 to 2 | |
| Category score | 5 | 5 | 5 | 2 | 5 | 3 | 0 to 6 | |
| FINAL SCORE | 4 | 4 | 3 | 3 | 4 | 4 | 0 to 5 |
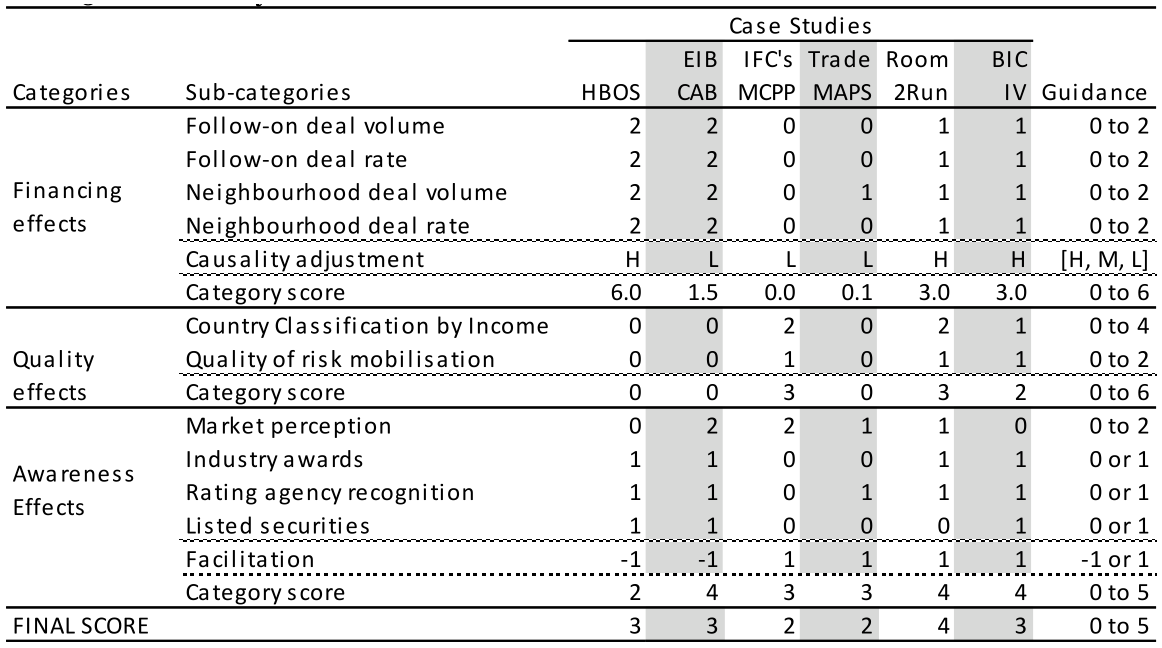
Show as data
| Case Studies | ||||||||
|---|---|---|---|---|---|---|---|---|
| EIB | IFC's | Trade | Room | BIC | ||||
| Categories | Sub-categories | HBOS | CAB | MCPP | MAPS | 2Run | IV | Guidance |
| Follow-on deal volume | 2 | 2 | 0 | 0 | 1 | 1 | 0 to 2 | |
| Follow-on deal rate | 2 | 2 | 0 | 0 | 1 | 1 | 0 to 2 | |
| Financing | Neighbourhood deal volume | 2 | 2 | 0 | 1 | 1 | 1 | 0 to 2 |
| effects | Neighbourhood deal rate | 2 | 2 | 0 | 0 | 1 | 1 | 0 to 2 |
| Causality adjustment | H | L | L | L | H | H | [H, M, L] | |
| Category score | 6.0 | 1.5 | 0.0 | 0.1 | 3.0 | 3.0 | 0 to 6 | |
| Country Classification by Income | 0 | 0 | 2 | 0 | 2 | 1 | 0 to 4 | |
| Quality | Quality of risk mobilisation | 0 | 0 | 1 | 0 | 1 | 1 | 0 to 2 |
| effects | Category score | 0 | 0 | 3 | 0 | 3 | 2 | 0 to 6 |
| Market perception | 0 | 2 | 2 | 1 | 1 | 0 | 0 to 2 | |
| Awareness | Industry awards | 1 | 1 | 0 | 0 | 1 | 1 | 0 or 1 |
| Effects | Rating agency recognition | 1 | 1 | 0 | 1 | 1 | 1 | 0 or 1 |
| Listed securities | 1 | 1 | 0 | 0 | 0 | 1 | 0 or 1 | |
| Facilitation | -1 | -1 | 1 | 1 | 1 | 1 | -1 or 1 | |
| Category score | 2 | 4 | 3 | 3 | 4 | 4 | 0 to 5 | |
| FINAL SCORE | 3 | 3 | 2 | 2 | 4 | 3 | 0 to 5 |
6. Reporting
6.1 Introduction
In this Section we aggregate the ex-ante and ex-post scores of the six transactions in this study and present them in an Excel implementation of the scorecard and online dashboard to review the results. The excel implementation allows the user to override the category scores to check the sensitivity on the final score. The dashboard allows the user to view the scoring of a transaction in a more user-friendly manner and generate a brief report scorecard for a given transaction.
6.2 Excel Implementation
The Excel implementation provides a structured rating interface for assessing development-effectiveness scorecards on both an ex-post and ex-ante basis. It allows users to select a transaction, load the relevant scorecard inputs, and review the calculated final rating, weighted score, source rating, and rating scale. The Excel implementation consolidates detailed sub-category scores into category-level outputs, making the scoring logic easier to review and communicate.
Its main use is to support consistent transaction assessment, comparison, and reporting. Users can rely on prefilled transaction scores or enter manual inputs and overrides where judgement-based adjustments are required (see Figure 6.1). This makes the Excel implementation suitable for both standardised analysis and tailored client review, while preserving transparency around how each category contributes to the final score.
Manual overrides are recorded rather than applied silently. Where the analyst departs from a value the workbook would otherwise produce, the record document captures the workbook-derived value, the value applied, the reason for the departure and the evidence relied on. An override takes effect only once the reviewing analyst countersigns it, and it is appended as part of that scoring run's entry rather than replacing an earlier one, so the sequence of overrides on a transaction can be read in date order.
Key features include separate ex-post and ex-ante rating dashboards, editable input and override fields, category-level weighting, applied score calculations, and a print-ready client output summary. The ex-post dashboard focuses on financing, quality, and awareness effects, while the ex-ante dashboard evaluates information generation, obstacles overcome, profitability and impact, and deal feasibility. Together, these features provide a clear and auditable view of transaction performance and expected development impact.
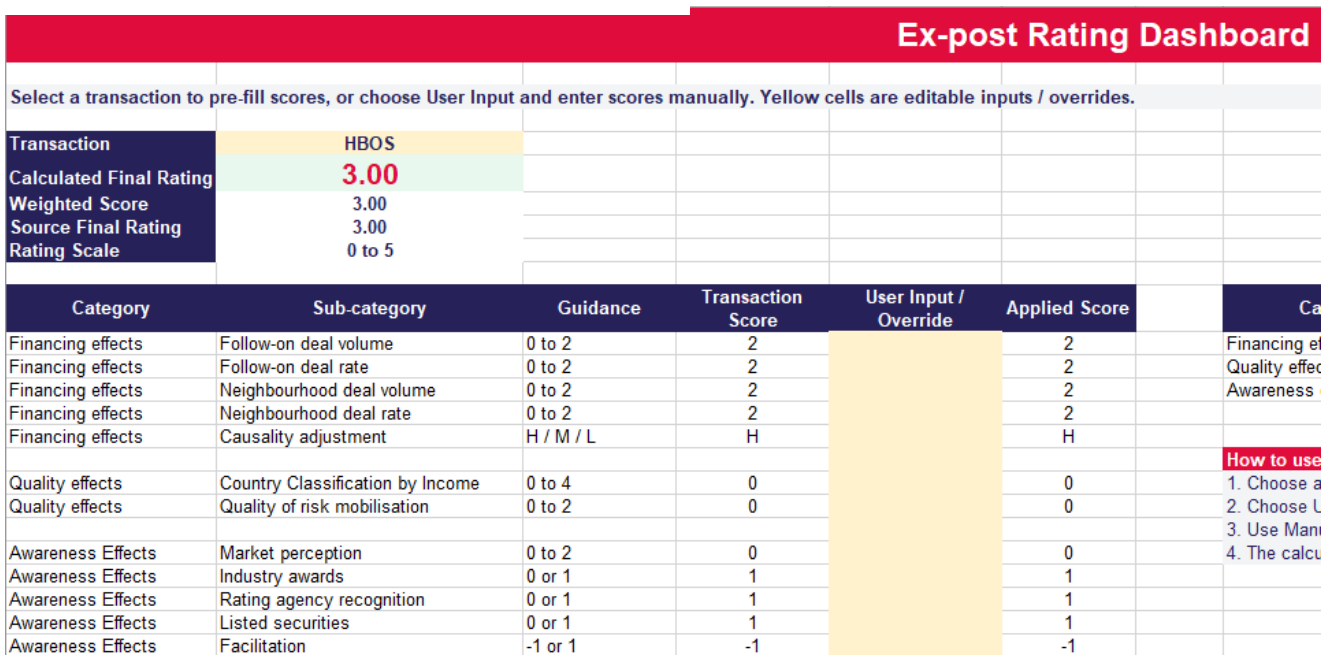
6.3 Dashboard
The Demonstration Effects (DE) Dashboard is an interactive web application that presents the ex-post and exante scorecards in a single interface. It loads transaction-level scores from a structured dataset, displays category weights and maxima, and computes a weighted overall score and an indicative rating on a 0–5 scale. Users may work from a selected transaction or enter alternative scores to explore scenarios without altering the underlying source data.
The dashboard supports ex-post assessment of demonstration effects (for example financing, quality, and awareness dimensions) and ex-ante evaluation across information generation, obstacles overcome, profitability and impact, and deal feasibility. It is suited to briefing materials, client workshops, and internal review: analysts can compare transactions, test sensitivities by adjusting line-item inputs within the guidance ranges, and label outputs with a scenario name for traceability. Results can be shared through on-screen summary tables, print or PDF export (see Figure 6.2 for sample report), and a structured Excel export aligned to the client output layout (see Figure 6.3).
The tool offers dual scorecard modes with tabbed navigation, a transaction selector, and a choice between workbook-based scores and user-defined “manual” inputs, with inputs constrained where guidance specifies numeric bounds. It presents headline key performance indicators (indicative rating and weighted score), category-level scores with bar visualisation, and a client output section summarising scenario, scorecard type, transaction, and quantitative results. Ancillary controls include reload to restore the selected transaction’s scores, and export to .xlsx for downstream use in reports or models.
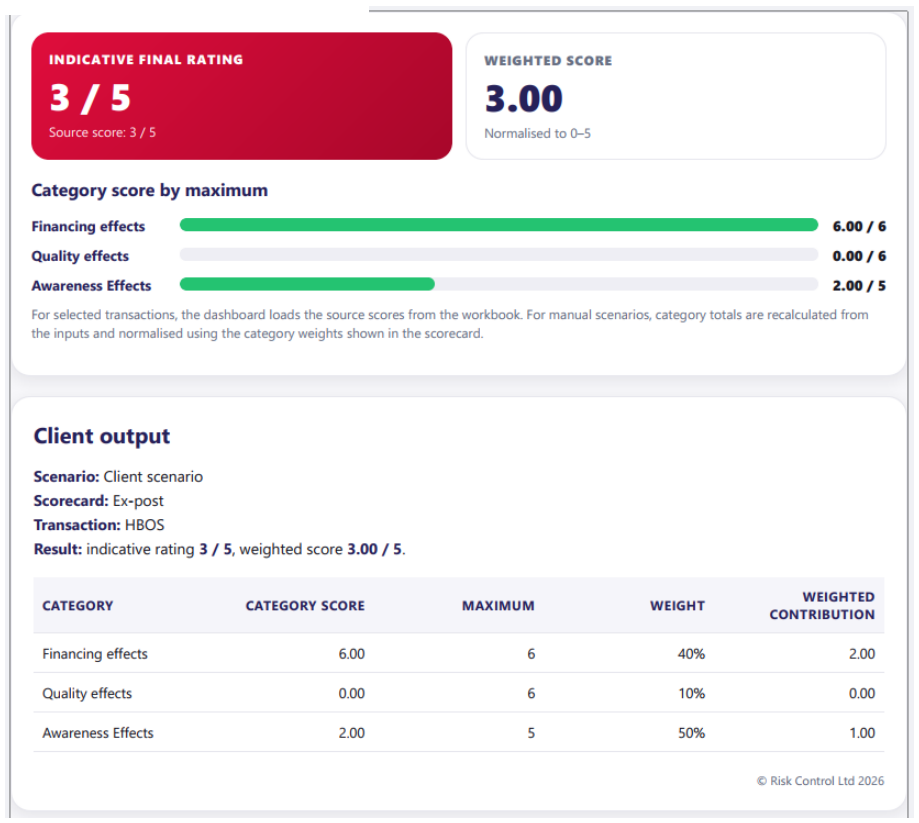
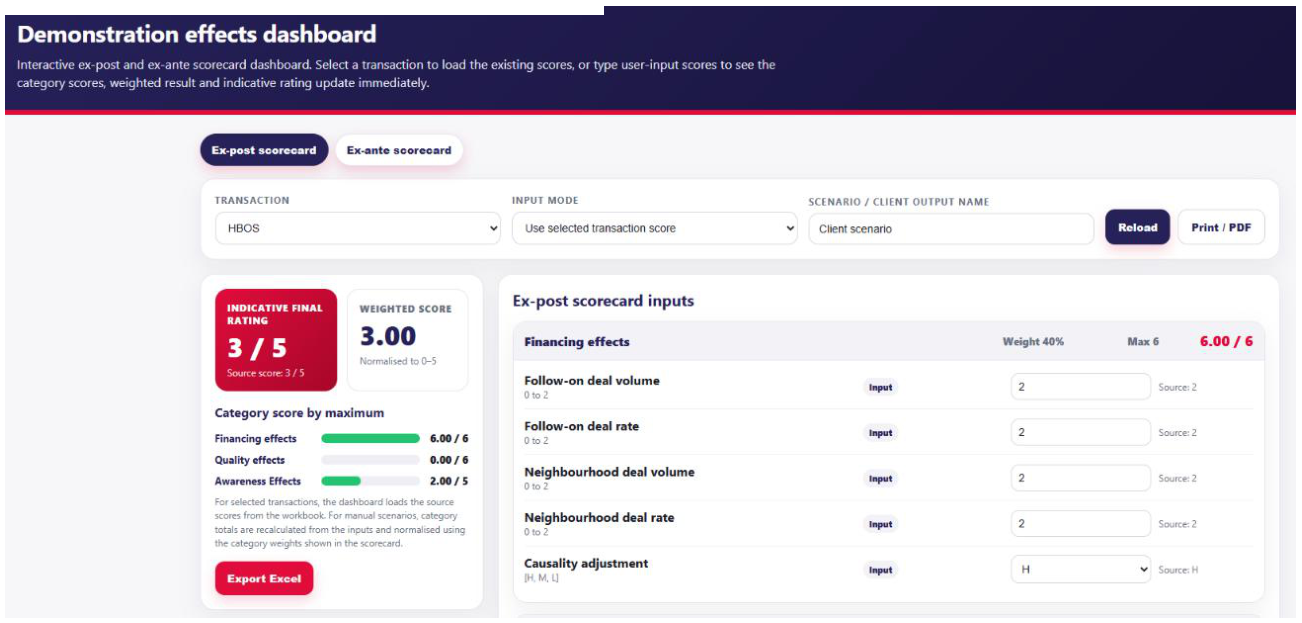
7. Conclusion
Demonstration effects can substantially magnify the impact of development finance interventions by DFIs. In contrast to private sector financial institutions which benefit from restricting replication of their own innovations until they have fully exploited their economic potential, DFIs seek to encourage follow on transactions to mobilise as much financing by private sector organisations as possible.
An earlier study (see Risk Control (2024)) presented examples of innovative transactions in both advanced economies and developing markets and identified factors that were likely to be associated with significant volumes of follow-on deals. That study formalised the presentation of success factors as an ex-ante scoring model that DFIs faced with choices between different deals might employ. Scores might be used as part of an origination decision or in the determination of pricing.
The present study builds on Risk Control (2024) by proposing an ex post scoring model in which quantitative data on volumes of follow-on deals and market awareness measured some years after deal closing to assess whether specific transactions have indeed resulted in the creation of new market activities not involving the original DFI.
The ex-post and ex-ante scoring approaches here exposited share a common understanding of demonstration effects but differ in that ex-post scores measure realised and largely quantifiable outcomes some time after the transaction occurs, whereas the ex-ante approach is based on factors and variables that are likely to be predictive of those outcomes.
The market awareness measures employed in the ex-post scoring are provided by a sentiment analysis application created by Risk Control as part of this project. The application processes inputs in the form of collections of documents that make mention of the transaction in question. Following prompts, a Large Language Model (LLM) is asked to summarise the qualitative nature of the documents’ reactions to the specific deal.
The approach is applied to a subset of the example transactions studied in Risk Control (2024) and findings compared with those implied by the ex-ante scoring model. Unified ex-ante/ex-post scoring workbook is provided and this is used via generative AI to yield an on-line report. The LLM-based application and the unified scoring model will be provided to FCDO upon completion of this project.
Several limitations qualify these results and bear on how the scorecard should be used. The sample of six transactions is too small to calibrate the relationship between ex-ante and ex-post scores or to estimate a standard adjustment. Causality is assessed judgmentally against a stated counterfactual and cannot be observed; the classifications reported here are analyst judgements supported by documented evidence, and in no case was direct evidence found that a subsequent transactor cited the reference deal as its reason for acting. The market awareness measure depends on documents retrievable through public search engines and is subject to search engine coverage, publication and survivorship bias, and it understates coverage of transactions predating the widespread online publication of trade press.
Several sub-indicators are binary, so transactions differing materially in the extent of their recognition receive the same score. The final score is rounded at each of three combination stages, and for three of the six transactions the last of these falls exactly on a half point, so those scores turn on the rounding convention. Bayfront Infrastructure Capital IV remains inside the observation window, so its score is provisional.
These limitations do not undermine the framework, but they define its intended use. The scorecard is a structured basis for comparing transactions and for documenting the reasoning behind an assessment, not a measurement instrument whose output should be relied on to a finer resolution than one point on the 0 to 5 scale. Scores should be reported together with the causality classification and the evidence supporting it, and a difference of one point between transactions should not be treated as material without reference to the underlying sub-indicators.
References
Arvanitis, Yannis, Marco Stampini and Desiré Vencatachellum (2015) “Balancing development returns and credit risks: project appraisal in a multilateral development bank,” Impact Assessment and Project Appraisal, 33.3, 195-206, May.
Barry, Frank, Holger Görg and Eric Strobl (2003) “Foreign Direct Investment, Agglomerations, and Demonstration Effects: An Empirical Investigation,” Review of world economics, 139, 583-600.
Bayfront Infrastructure (2023) “Bayfront prices US$410.3 million infrastructure asset-backed securities,” press release, September, available at: https://www.bayfront.sg/bic4
Bloomberg Professional Services (2024) “Making sense of sustainable debt labels,” available at: https://www.bloomberg.com/professional/insights/sustainable-finance/making-sense-of-sustainable-debtlabels/#:~:text=Green%20bonds/loans%20can%20raise,used%20for%20general%20purpose%20finance.
Broccolini, Chiara, Giulia Lotti, Alessandro Maffioli, Andrea F. Presbitero and Rodolfo Stucchi (2019) “Mobilization Effects of Multilateral Development Banks,” International Monetary Fund, No. 2019/028, February
Carter, Paddy (2021) “The economics of development finance,” November, available at: https://assets.bii.co.uk/wp-content/uploads/2021/11/02102457/The-economics-of-development-finance.pdf
Castalia Strategic Advisors (2011) “Evaluation of the Demonstration Effect of IFC’s Involvement in Infrastructure in Africa, ” available at: https://studylib.net/doc/18349592/evaluation-of-the-demonstrationeffect-of-ifc-s-involveme
Citigroup, Morgan Stanley and Santander (Trade MAPS) (2013) “Trade MAPS 1 Limited – $1,000,000,000 Floating Rate Notes, Series 2013-1 – Offering Memorandum,” December, available at: https://ise-prodnr-euwest-1-data-integration.s3-eu-west-1.amazonaws.com/legacy/Prospectus+-+Standalone_3df552a6-8787-4599- 864b-cee5aec5431a.pdf
Clifford Chance (2008) “New! Dutch covered bond law,” August, available at: https://www.cliffordchance.com/content/dam/cliffordchance/briefings/2008/08/new-dutch-covered-bondlaw-four-things-an-investor-needs-to-know.pdf
Cox, Donald and Oded Stark (1994) “Intergenerational transfers and the demonstration effect,” Working Papers in Economics, 304.
Dutch Association of Covered Bond Issuers (2026) “Dutch Covered Bonds,” available at: https://www.dacb.nl/content/structure-dutch-coveredbonds#:~:text=Although%20the%20history%20of%20covered,ABN%20AMRO%20Bank%20in%202005.
Environmental Finance (2017) “Green Bond Awards 2017,” available at: https://www.environmentalfinance.com/content/awards/green-bond-awards-2017/winners/biggest-issuer-sovereign-supranational-andagency-european-investment-bank.html
European Central Bank (2025) “Supervisory methodology 2025,” available at: https://www.bankingsupervision.europa.eu/activities/srep/2025/html/ssm.srep202511_supervisorymethodol ogy2025.en.html
European Investment Bank (2007) “EPOS II - The "Climate Awareness Bond" EIB promotes climate protection via pan-EU public offering,” investor relations news, May, available at: https://www.eib.org/en/investorrelations/press/all/2007-042-epos-ii-obligation-sensible-au-climat-la-beioeuvre-a-la-protection-du-climatpar-le-biais-de-son-emission-a-l-echelle-de-l-ue.
European Investment Bank (2008) “Annual Report 2007,” available at: https://www.eib.org/files/publications/general/reports/fr2007en.pdf
European Investment Bank (2016) “Climate Awareness Bond hits 100th Green Bond listing on LuxSE,” February, available at: https://www.eib.org/en/investor-relations/press/all/fi-2016-007-climate-awarenessbond-hits-100th-green-bond-listing-on-luxse
Fang, Sheng, Dean Xu, Lixin Colin Xu and Heba Shams (2023) “Does FDI have a social demonstration effect in developing economies? Evidence based on the presence of women-led local firms,” Journal of International Business Studies, 1-19, March
FinanceAsia (2023) “FinanceAsia Achievement Awards 2023: Asia's best deals revealed,” November, available at: https://www.financeasia.com/article/financeasia-achievement-awards-2023-asias-best-dealsrevealed/492792
Financial Conduct Authority (2016) “Regulated Covered Bonds,” May, available at: https://www.fca.org.uk/firms/regulated-covered-bonds
Fitch Ratings (2005) “Masters of the House –A Review of UK RMBS Master Trusts,” Special Report, June, Fitch Ratings, London, United Kingdom
Fitch Ratings (2014) “Fitch Affirms Trade MAPS 1 Limited Series 2013-1 Notes,” November, available at: https://www.fitchratings.com/research/structured-finance/fitch-affirms-trade-maps-1-limited-series-2013-1notes-24-11-2014
Gallebaert, Christine Van (2014) “How French covered bonds work,” August, available at: https://www.gide.com/sites/default/files/iflr_main_july_august2014_cvangallebaert_v2.pdf
GPEDC MDB working group (2019) “Multilateral Development Banks and Private Sector Engagement for Sustainable Development,” July, available at: https://www.adb.org/publications/mdbs-private-sectorengagement-sustainable-development
Gregory, Neil (2023) “Taking Stock of MDB and DFI Innovations for Mobilizing Private Capital for Development,” Center for Global Development (CGD), Policy Paper 290, April, available at: https://www.cgdev.org/publication/taking-stockmdb-and-dfi-innovations-mobilizing-private-capital
HBOS Treasury Services (2003) “€14 billion Covered Bond Programme – Offering Circular,” July, available at: https://blog.cscglobal.com/our-services/capital-markets-services/public-transactions/hbos-treasury-servicesplc/
Hetherington Hebe, Charles Michaelis , Alison Radevsky , Gregg Smith , Chris Walter (2019) “Mobilising private finance through demonstration effects,” PE2 Private Finance Final Report, December, available at: https://www.itad.com/knowledge-product/mobilising-private-finance-compass-final-report/
Inderst, Georg (2021) “Financing development: Private capital mobilization and institutional investors,” Inderst Advisory - Discussion Paper, March, Available at SSRN 3806742
International Finance Corporation (IFC) (2017) “Mobilizing Institutional Investments into Emerging Market Infrastructure,” EMCompass, Note 36, April, available at: https://hdl.handle.net/10986/30362.
International Finance Corporation (IFC) (2018) “Annual Report 2018 – Redefining Development Finance,” September, available at: https://www.ifc.org/en/insights-reports/2018/ifc-ar-2018
International Finance Corporation (IFC) (2022) “Partnering with IFC Syndications,” IFC Syndications Brochure, February, available at: https://www.ifc.org/content/dam/ifc/doc/2022/ifc-syndications-brochure- 2022.pdf
International Finance Corporation (2026a) “Emerging Markets Securitization Program (EMSP),” available at: https://www.ifc.org/en/what-we-do/sector-expertise/syndicated-loans-and-mobilization/ifc-emergingmarket-securitization-program
International Finance Corporation (2026b) “AIMM Guidance Note,” available at: https://www.ifc.org/content/dam/ifc/doc/latest/aimm-general-guidance-note.pdf
Joint Report (2018) “Mobilization of private finance 2018 by multilateral development banks and development finance institutions,” available at: https://www.ifc.org/content/dam/ifc/doc/mgrt/201806-mobilization-ofprivate-finance-v2.pdf
Kreitman, Robert M (2026) “Biography,” available at: https://www.sidley.com/en/people/k/kreitman-robertm
Latham and Watkins (2019) “Latham Wins Impact Deal and Innovation of the Year at Capital Relief Trade Awards,” October, available at: https://www.lw.com/en/news/2019/10/latham-wins-impact-deal-andinnovation-of-year-at-capital-relief-trade-awards
Lotti, Giulia, Andrea Presbitero (2019) “The mobilisation effects of multilateral development banks,” November, available at: https://cepr.org/voxeu/columns/mobilisation-effects-multilateral-development-banks
Massa, Isabella (2011) “Impact of multilateral development finance institutions on economic growth,” London Overseas Development Institute, August
Mitrut, Andreea and François-Charles Wolff (2009) “A causal test of the demonstration effect theory,” Economics Letters, 103(1), 52-54
Mizuho (2018) “Issuer Perspective—SCI’s 4th Annual Capital Relief Trades Seminar 16 October,” available at: https://www.structuredcreditinvestor.com/pdf/pdf_presentation/Untitled%20attachment%2006150.pdf
MOBILIST (2023) “Development Finance Through Public Markets: Originate-to-demonstrate,” November, available at: https://www.mobilistglobal.com/research-data/development-finance-through-public-marketsoriginate-to-demonstrate/
MOBILIST (2025) “Scaling securitisation development finance potential, precedents and pathways,” available at: https://securitisation.mobilistglobal.com/wp-content/uploads/2025/10/MOBILIST-Research- Paper_Scaling-Securitisation-in-Development-Finance_FINAL.pdf
Moody’s Investors Service (2018) “Bayfront Infrastructure Capital Pte Ltd,”, available at: https://api.cliffordcapital.sg/dev/file/download?id=1858399452341944322
Moody’s Investors Service (2021) “Bayfront Infrastructure Capital II Pte Ltd,”, available at: https://api.cliffordcapital.sg/dev/file/download?id=1858448401073389570
Moody’s Investors Service (2022) “Bayfront Infrastructure Capital III Pte Ltd,”, available at: https://api.cliffordcapital.sg/dev/file/download?id=1858697857844854785
Moody’s Investors Service (2023a) “Bauhinia ILBS 1 Limited,” available at: https://www.hkmc.com.hk/files/page/100/%5BMay- 2023%5D%20New%20Issue%20Report_Bauhinia%20ILBS1.pdf
Moody’s Investors Service (2023b) “Bayfront Infrastructure Capital IV Pte Ltd,”, available at: https://api.cliffordcapital.sg/dev/file/download?id=1858701640519860226
Moody’s Investors Service (2024a) “Bauhinia ILBS 2 Limited,” available at: https://www.hkmc.com.hk/files/page_announcement/104/403/New_Issue_Report-Bauhinia-ILBS-2- Limited-New-11Sep2024.pdf
Moody’s Investors Service (2024b) “Bayfront Infrastructure Capital V Pte Ltd,”, available at: https://api.cliffordcapital.sg/dev/file/download?id=1858705129836855297
Moody’s Investors Service (2025a) “Bauhinia ILBS 3 Limited,” available at: https://www.hkmc.com.hk/files/page_announcement/105/474/%5BOct%202025%5D%20New%20Issue%20 Report_Bauhinia%20ILBS%203.pdf
Moody’s Investors Service (2025b) “Bayfront Infrastructure Capital VI Pte Ltd,”, available at: https://api.cliffordcapital.sg/dev/file/download?id=1902527692579000321
Moody’s Investors Service (2025c) “Bayfront IABS VII Pte. Ltd,”, available at: https://api.cliffordcapital.sg/dev/file/download?id=1993588097681588226
Multilateral Development Banks (2017) “Mobilization of Private Finance by Multilateral Development Banks: 2016 Joint Report,” available at: https://www.eib.org/attachments/mdb_joint_report_mobilization_2016_en.pdf
Multilateral Development Banks (2023) “Mobilization of Private Finance 2020-2021 by Multilateral Development Banks and Development Finance Institutions,” June, available at: https://www.ifc.org/content/dam/ifc/doc/2023-delta/mdbs-joint-report-on-mobilization-of-private-finance 2020-21.pdf
Organisation for Economic Cooperation and Development (2020), “DAC methodologies for measuring the amounts mobilised from the private sector by official development”, May, available at: https://www.oecd.org/dac/financing-sustainable-development/development-finance-standards/DAC Methodologies-on-Mobilisation.pdf
Organisation for Economic Cooperation and Development (2023), “Private finance mobilised by official development finance interventions”, Development Co-operation Directorate, OECD Publishing, available at: https://www.oecd.org/dac/2023-private-finance-odfi.pdf
Publish What You Fund (PWYF) (2024) “Crowding in: An advanced approach for measuring and disclosing private capital mobilisation,” available at: https://www.publishwhatyoufund.org/app/uploads/dlm_uploads/2024/04/Crowding-in-An-advancedapproach-for-measuring-and-disclosing-private-capital-mobilisation.pdf
Risk Control (2019) “Room2Run: the AfDB’s Approach to Sharing Risk with the Private Sector,” 19-73a, April, available at: https://www.newmarketcapital.com/wp-content/uploads/2021/11/Room-to-Run_Risk- Control.pdf.
Risk Control (2024) “Innovative Deals in Development Finance: Originate to Demonstrate (O2D),” 24-66a, August, available at: https://www.riskcontrollimited.com/wp-content/uploads/2024/09/Innovative-Deals-in- Development-Finance-O2D-24-66a-19-8-24-v73.pdf
Risk Control (2026) “Market Awareness Application User Guide Tool,” 26-63a, May.
Shackle, G. L. S. and Duesenberry, James S. (March 1951) “Income, Saving, and the Theory of Consumer Behaviour,” The Economic Journal, 61 (241) 131.
Structured Credit Investor (2019) “SCI Capital Relief Trades Awards 2019,” available at: https://www.structuredcreditinvestor.com/pdf/SCI%20Award%20Content%20v2%204.pdf
World Bank (2026) “World Bank Country and Lending Groups,” available at: https://datahelpdesk.worldbank.org/knowledgebase/articles/906519-world-bank-country-and-lending-groups
World Bank Group Independent Evaluation Group (WBG-IEG) (2020) “World Bank Group Approaches to Mobilize Private Capital for Development –An Independent Evaluation,” January, available at: https://ppp.worldbank.org/sites/default/files/2025- 06/World%20Bank%20Group%20Approaches%20to%20Mobilize%20Private%20Capital%20for%20Develop ment%20-%20An%20Independent%20Evaluation.pdf
Annual Financial Statements
International Finance Corporation (2014) “Big challenges. Big solutions. IFC financials and projects 2014,” available at: https://documents1.worldbank.org/curated/en/762711468147875693/pdf/909490AR0v20IF0PUBLIC002014 0Volume2.pdf
International Finance Corporation (2016) “Information Statement,” available at: https://www.ifc.org/content/dam/ifc/doc/2010/fy16-q4-annual-information-statement.pdf
International Finance Corporation (2018) “Information Statement,” available at: https://www.ifc.org/content/dam/ifc/doc/2010/fy18-q4-annual-information-statement.pdf
International Finance Corporation (2020) “Information Statement,” available at: https://www.ifc.org/content/dam/ifc/doc/2020/fy20-q4-annual-information-statement.pdf
International Finance Corporation (2022) “Information Statement,” available at: https://www.ifc.org/content/dam/ifc/doc/2022/fy22-q4-annual-information-statement.pdf
International Finance Corporation (2024) “Information Statement,” available at: https://www.ifc.org/content/dam/ifc/doc/2024/IFC-Annual-Information-Statement-FY24.pdf
International Finance Corporation (2025) “Information Statement,” available at: https://www.ifc.org/content/dam/ifc/doc/2025/ifc-annual-information-statement-fy25.pdf
Appendix 1: Search Criteria for Market Perception Analysis
For each transaction, publicly available documents were collected by performing keyword searches on Google and Google Scholar. Results were reviewed in rank order and the search was stopped once returned items ceased to relate to the reference transaction, judged by successive pages returning no document that named the transaction or its issuer in a relevant context. This stopping rule replaces a fixed result count, since the number of relevant results differs widely between transactions: the HBOS corpus was exhausted within a small number of pages, whereas searches for the EIB Climate Awareness Bond continued to return relevant material considerably further down the rankings.
Search rankings vary over time and between users, so a repeated search will not return an identical result set. The reproducible record is therefore the retained corpus rather than the search itself. Every retrieved document is held as a PDF in the transaction input folder, and the CSV log records the file name, publication year, source type and classification of each document analysed, so that any subsequent reviewer can verify the corpus on which the scores were based and, if required, extend it.
The following criteria were applied. Only documents in English were retained; no search was carried out in other languages, which biases the corpus towards commentary in English-speaking markets. A document was included where it referred to the reference transaction by name or by an unambiguous alias and expressed or reported a view on it, and excluded where the reference was incidental or where the item was a database entry, index listing or aggregator page carrying no commentary. Duplicates were removed by comparing title, author and publication date. Where a document appeared in more than one version, the earliest complete version was retained and later revisions, syndicated republications and reprints were discarded rather than counted separately.
Documents published by the transaction issuer were retained but flagged, and they are reported separately in the panels and tables. Issuer documents are excluded from the market perception score used in Section 5.3, which counts independent supportive documents only, but they are included in the corpus totals reported for each transaction. Critical documents do not reduce the score, but their number is reported for each transaction, since a corpus with substantial criticism and one with none can produce the same score.
The classifications produced by the language model were reviewed manually for each transaction, and the sentiment and source-type labels reported here reflect that review. The review was carried out by the analysts running the tool rather than by independent coders, so it is a check on the model's output rather than a formal validation exercise with measured inter-rater agreement.
The corpus is subject to three further limitations. It captures only material that the search engines index and returns for the keyword strings used, so paywalled, unindexed and differently worded sources are missed regardless of how far the results are read. It is subject to publication bias, since commentary on a transaction is more often published by parties associated with it than by independent critics; in the Bayfront corpus, twothirds of documents were issuer-published and none was critical. It is subject to survivorship bias, since older material is less likely to remain accessible online, which best explains the small HBOS corpus.
Here are the search keywords for each transaction in this study:
1. HBOS Structured Covered Bonds (2003) The following search strings were used across Google and Google Scholar:
1. HBOS structured covered bonds
2. HBOS covered bond programme 2003
3. HBOS Treasury Services covered bond review
4. UK structured covered bonds
5. structured covered bonds without covered bond law
6. covered bond market UK development
7. structured covered bonds replication Europe assessment
8. HBOS covered bonds critique outlook
9. covered bond securitisation UK legislation
In total, 26 documents relating to the HBOS Structured Covered Bonds (2003) transaction were collected.
2. EIB Climate Awareness Bond (2007) The following search strings were used across Google and Google Scholar:
1. EIB Climate Awareness Bond
2. European Investment Bank Climate Awareness Bond
3. EIB CAB green bond 2007
4. Climate Awareness Bond review assessment
5. EIB green bond critique outlook
6. green bond market development EIB
7. Climate Awareness Bond issuance replication
8. EIB sustainable bond market impact
In total, 55 documents relating to the EIB Climate Awareness Bond (2007) transaction were collected.
3. IFC MCPP (2013) The following search strings were used across Google and Google Scholar:
1. IFC Managed Co-Lending Portfolio Program
2. IFC MCPP
3. IFC co-lending portfolio emerging markets
4. Managed Co-Lending Portfolio Program review assessment
5. IFC MCPP critique outlook
6. IFC MCPP infrastructure private sector mobilisation
7. IFC co-lending platform replication demonstration
8. MCPP development finance impact assessment
In total, 37 documents relating to the IFC MCPP (2013) transaction were collected.
4. Trade MAPS (2013) The following search strings were used across Google and Google Scholar:
1. Trade MAPS securitisation
2. Trade MAPS 1 Limited
3. Citigroup Santander trade receivables securitisation
4. trade finance securitisation emerging markets 2013
5. Trade MAPS review assessment
6. Trade MAPS critique outlook
7. trade receivables asset-backed securities
8. Citigroup Morgan Stanley trade finance ABS
In total, 20 documents relating to the Trade MAPS (2013) transaction were collected.
5. Room2Run (2018) The following search strings were used across Google and Google Scholar:
1. Room2Run AfDB
2. AfDB Room2Run securitisation
3. Room2Run 2018 review assessment
4. AfDB balance sheet securitisation
5. Room2Run critique outlook
6. African Development Bank synthetic securitisation
7. Room2Run capital relief trade
8. AfDB non-sovereign obligor portfolio securitisation
In total, 25 documents relating to the Room2Run (2018) transaction were collected.
6. Bayfront Infrastructure Capital IV (2023) The following search strings were used across Google and Google Scholar:
1. Bayfront Infrastructure Capital IV
2. Bayfront BIC IV
3. Clifford Capital Bayfront infrastructure securitisation
4. Bayfront infrastructure ABS 2023
5. Bayfront Infrastructure Capital review assessment
6. BIC IV securitisation assessment critique
7. infrastructure asset-backed securities Singapore
In total, 30 documents relating to the Bayfront Infrastructure Capital IV (2023) transaction were collected.
Appendix 2: Market Awareness Results
A2.1 Introduction In this Appendix we provide the market awareness results for each transaction year by year grouped by sentiment and article type. Additionally, details of the award won by the transaction is also presented.
A2.2 HBOS Structured Covered Bonds (2003) The analysis identified five non-issuer publications expressing supportive sentiment towards the HBOS transaction. Table A2.1 summarises market interest over time across sentiment categories and article types.
The significance of the HBOS structured covered bond transaction was further recognised when it received the IFLR 2004 Securitisation Deal of the Year award (see Kreitman (2026)).
A2.3 EIB Climate Awareness Bond (2007) In total, the analysis identified 24 non-issuer publications expressing supportive sentiment towards the EIB CAB issuance. Table A2.2 summarises the evolution of market interest over time across different sentiment categories and publication types.
This growth can be traced back to the EIB’s early role in the market, having listed the CAB on the Luxembourg Stock Exchange (LuxSE) in 2007. The significance of this milestone was later recognised in February 2016, when the transaction received the “Green Bond Pioneer Award” from the London Stock Exchange and the Climate Bonds Initiative (see EIB (2016)). In 2017, EIB won “Green Bonds Award 2017” from Environment Finance for being the largest issuer among sovereigns, supranationals and agencies (SSAs) for three consecutive years (see Environmental Finance (2017)).
A2.4 IFC MCPP (2013) In total, the analysis identified 23 non-issuer publications expressing supportive sentiment towards IFC’s MCPP. In addition, IFC published nine articles highlighting the programme’s benefits and encouraging broader market participation. Table A2.3 summarises the evolution of market interest over time across different sentiment categories and publication types.
A2.5 Trade MAPS (2013) In total, the analysis identified 12 non-issuer publications expressing supportive sentiment towards Trade MAPS. Table A2.4 summarises the evolution of market interest over time across different sentiment categories and publication types.
A2.6 Room2Run (2018) Overall, the analysis identified 12 non-issuer publications expressing supportive sentiment towards Room2Run (2018). Table A2.5 summarises the evolution of market interest over time across different sentiment categories and publication types.
The significance of AfDB’s pioneering Room2Run (2018) transaction was further reflected in its recognition by the Structured Credit Investor’s (SCI’s) Capital Relief Trade Awards 2019, where it received both the “Impact Deal of the Year” and “Innovation of the Year” awards (see Latham and Watkins (2019) and SCI (2019)).
A2.7 Bayfront Infrastructure Capital IV (2023) Overall, the analysis identified six non-issuer publications expressing supportive sentiment towards BIC IV (2023). Table A2.6 summarises the evolution of market interest over time across different sentiment categories and publication types.
The significance of BIC IV was further reflected in the recognition it received from FinanceAsia in 2023, where the transaction won awards for (i) Best Infrastructure Deal in Asia, (ii) Best Project Finance Deal in Asia, and
(iii) Best Sustainable Finance Deal in Asia (see FinanceAsia (2023)).

Show as data
| Group | Category | 2007 | 2008 | 2009 | 2010 | 2011 | 2012 | 2013 | 2014 | 2015 | 2016 | 2017 | 2018 | 2019 | 2020 | 2021 | 2022 | 2023 | 2024 | Total |
|---|---|---|---|---|---|---|---|---|---|---|---|---|---|---|---|---|---|---|---|---|
| Critical | 1 | - | - | - | 2 | - | 1 | - | - | - | - | - | 1 | - | - | - | - | - | 5 | |
| Sentiment | Neutral | 1 | 4 | 1 | 2 | 1 | - | - | 1 | 1 | 1 | - | - | - | 1 | 2 | - | - | 1 | 16 |
| Supportive | - | - | - | - | 2 | - | - | 1 | - | 1 | - | - | - | - | - | - | - | 1 | 5 | |
| Academic | 1 | 2 | - | 2 | 3 | - | 1 | 1 | 1 | - | - | - | - | - | 1 | - | - | - | 12 | |
| Article | Industry | - | 1 | 1 | - | - | - | - | - | - | 1 | - | - | 1 | - | 1 | - | - | 1 | 6 |
| type | Issuer | - | 1 | - | - | - | - | - | - | - | - | - | - | - | - | - | - | - | 1 | 2 |
| Regulator | 1 | - | - | - | 2 | - | - | 1 | - | 1 | - | - | - | 1 | - | - | - | - | 6 |
Note: Each cell represents the annual volume of documents published per sentiment or article type.

Show as data
| Group | Category | 2007 | 2008 | 2009 | 2010 | 2011 | 2012 | 2013 | 2014 | 2015 | 2016 | 2017 | 2018 | 2019 | 2020 | 2021 | 2022 | 2023 | 2024 | 2025 | 2026 | Total |
|---|---|---|---|---|---|---|---|---|---|---|---|---|---|---|---|---|---|---|---|---|---|---|
| Critical | - | - | - | - | - | - | - | - | - | - | - | - | 1 | - | - | - | - | - | 1 | 3 | 5 | |
| Sentiment | Neutral | 1 | - | - | - | 1 | - | - | - | - | - | - | 1 | 2 | 1 | 1 | - | - | 4 | 7 | - | 18 |
| Supportive | 1 | - | - | 1 | - | 1 | 1 | - | - | 1 | 1 | - | 2 | 5 | 4 | 3 | 6 | 2 | 3 | 1 | 32 | |
| Academic | 2 | - | - | - | - | - | 1 | - | - | - | 1 | - | 2 | 3 | 3 | - | 2 | 2 | 4 | 2 | 22 | |
| Article | Industry | - | - | - | 1 | - | 1 | - | - | - | - | - | 1 | 3 | 3 | - | 2 | 1 | 2 | 6 | 2 | 22 |
| type | Issuer | - | - | - | - | 1 | - | - | - | - | 1 | - | - | - | - | 2 | 1 | 3 | 2 | 1 | - | 11 |
| Regulator | - | - | - | - | - | - | - | - | - | - | - | - | - | - | - | - | - | - | - | - | - |
Note: Each cell represents the annual volume of documents published per sentiment or article type.
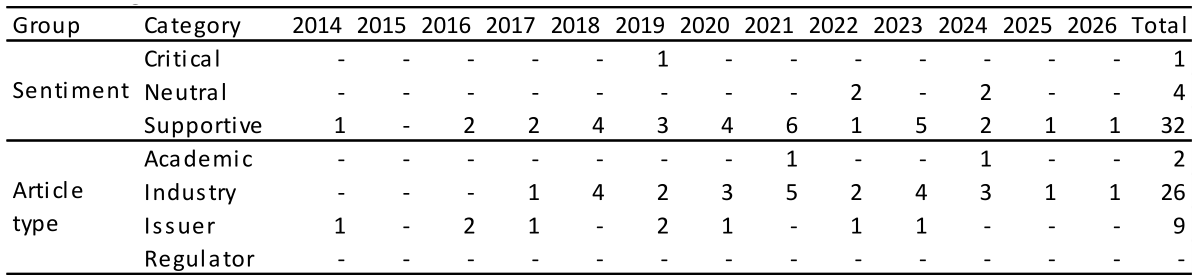
Show as data
| Group | Category | 2014 | 2015 | 2016 | 2017 | 2018 | 2019 | 2020 | 2021 | 2022 | 2023 | 2024 | 2025 | 2026 | Total |
|---|---|---|---|---|---|---|---|---|---|---|---|---|---|---|---|
| Critical | - | - | - | - | - | 1 | - | - | - | - | - | - | - | 1 | |
| Sentiment | Neutral | - | - | - | - | - | - | - | - | 2 | - | 2 | - | - | 4 |
| Supportive | 1 | - | 2 | 2 | 4 | 3 | 4 | 6 | 1 | 5 | 2 | 1 | 1 | 32 | |
| Academic | - | - | - | - | - | - | - | 1 | - | - | 1 | - | - | 2 | |
| Article | Industry | - | - | - | 1 | 4 | 2 | 3 | 5 | 2 | 4 | 3 | 1 | 1 | 26 |
| type | Issuer | 1 | - | 2 | 1 | - | 2 | 1 | - | 1 | 1 | - | - | - | 9 |
| Regulator | - | - | - | - | - | - | - | - | - | - | - | - | - | - |
Note: Each cell represents the annual volume of documents published per sentiment or article type.

Show as data
| Group | Category | 2011 | 2012 | 2013 | 2014 | 2015 | 2016 | 2017 | 2018 | 2019 | 2020 | 2021 | 2022 | 2023 | 2024 | 2025 | 2026 | Total |
|---|---|---|---|---|---|---|---|---|---|---|---|---|---|---|---|---|---|---|
| Sentiment | Critical | - | - | 1 | - | - | - | - | - | - | - | - | - | - | - | - | - | 1 |
| Neutral | - | - | 3 | 3 | - | - | - | - | - | 1 | - | - | - | - | - | - | 7 | |
| Supportive | 1 | - | 4 | 3 | - | 1 | - | - | - | - | - | - | - | 1 | 1 | 1 | 12 | |
| Article type | Academic | - | - | - | - | - | - | - | - | - | - | - | - | - | - | - | - | - |
| Industry | 1 | - | 7 | 5 | - | 1 | - | - | - | 1 | - | - | - | 1 | 1 | 1 | 18 | |
| Issuer | - | - | 1 | - | - | - | - | - | - | - | - | - | - | - | - | - | 1 | |
| Regulator | - | - | - | 1 | - | - | - | - | - | - | - | - | - | - | - | - | 1 |
Note: Each cell represents the annual volume of documents published per sentiment or article type.
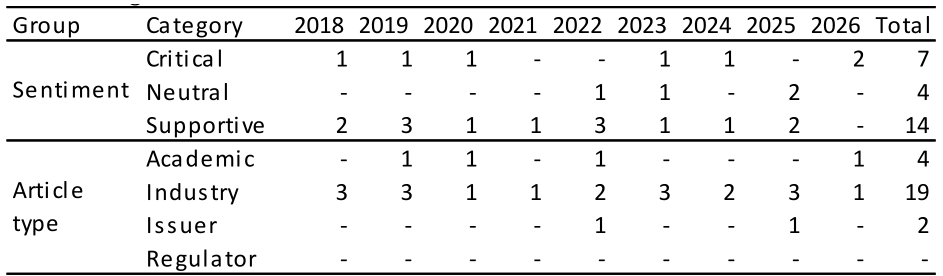
Show as data
| Group | Category | 2018 | 2019 | 2020 | 2021 | 2022 | 2023 | 2024 | 2025 | 2026 | Total |
|---|---|---|---|---|---|---|---|---|---|---|---|
| Sentiment | Critical | 1 | 1 | 1 | - | - | 1 | 1 | - | 2 | 7 |
| Neutral | - | - | - | - | 1 | 1 | - | 2 | - | 4 | |
| Supportive | 2 | 3 | 1 | 1 | 3 | 1 | 1 | 2 | - | 14 | |
| Article type | Academic | - | 1 | 1 | - | 1 | - | - | - | 1 | 4 |
| Industry | 3 | 3 | 1 | 1 | 2 | 3 | 2 | 3 | 1 | 19 | |
| Issuer | - | - | - | - | 1 | - | - | 1 | - | 2 | |
| Regulator | - | - | - | - | - | - | - | - | - | - |
Note: Each cell represents the annual volume of documents published per sentiment or article type.
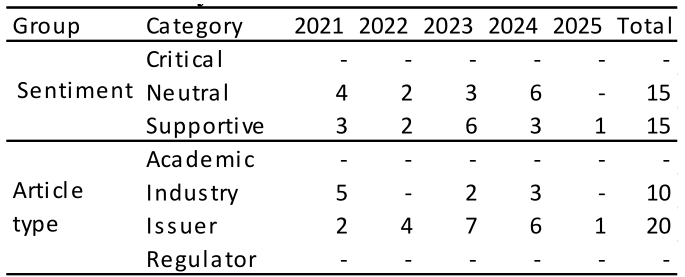
Show as data
| Group | Category | 2021 | 2022 | 2023 | 2024 | 2025 | Total |
|---|---|---|---|---|---|---|---|
| Critical | - | - | - | - | - | - | |
| Sentiment | Neutral | 4 | 2 | 3 | 6 | - | 15 |
| Supportive | 3 | 2 | 6 | 3 | 1 | 15 | |
| Academic | - | - | - | - | - | - | |
| Article | Industry | 5 | - | 2 | 3 | - | 10 |
| type | Issuer | 2 | 4 | 7 | 6 | 1 | 20 |
| Regulator | - | - | - | - | - | - |
Note: Each cell represents the annual volume of documents published per sentiment or article type.
Notes
[1] Other interventions by DFIs such as technical assistance that results in standardisation of products or clarification of legal or regulatory frameworks may also contribute to the emergence of new financial activity.
[2] The eight-year observation window is based on the case studies examined in this report, which suggest that demonstration effects typically emerge over a period of five to eight years following transaction closing. For example, widespread adoption of structured covered bonds occurred several years after the 2003 HBOS transaction, private-sector issuance of green bonds expanded materially only several years after the EIB's 2007 Climate Awareness Bond, and comparable MDB securitisations began to emerge only several years after AfDB's 2018 Room2Run transaction. Eight years was therefore selected as a conservative period by which the majority of a transaction's demonstration effects can reasonably be expected to have become observable.
[3] Relevant considerations include the extent to which it replicates the key innovative features of the original transaction, such as its structure, target asset class, use-of-proceeds logic, or risk-transfer mechanism. The degree of information generated by the original transaction may also vary depending on factors such as market characteristics and, where applicable, listing features.
[4] A neighbourhood deal is one that does not directly replicate the original transaction but may nevertheless have been influenced by it or by its more direct follow-on transactions. Such deals pursue a similar objective through a different structure, asset class, or implementation approach. A transaction may be classified as a neighbourhood deal only if it is not already classified as a follow-on deal.
[5] The half weight is applied across asset classes without calibration to observed differences in replication. Varying it from 0 to 1 changes no score in Table 5.2: where a transaction's follow-on and neighbourhood scores are equal the weight cancels against the category maximum, and elsewhere the variation is absorbed by rounding. The convention is therefore untested by this sample rather than validated by it, and the sensitivity should be re-run on a larger one. Note that any change to the weight also changes the financing effects maximum, since the maximum of 6 derives from it.
[6] It might be argued that market awareness is an intermediate factor in producing the primary demonstration indicators of volume and quality. However, it is so central to scaling and reinforcing transaction volumes that we believe it should factor directly into the demonstration effect scoring.
[7] We did not find any green bond issuance pre-2007.
[8] Bloomberg identifies green bonds through the "Green Instrument Indicator" field. Setting this field to "True" returns all instruments classified by Bloomberg as green bonds.
[9] The Joint Report (2018) does not disaggregate the middle-income group into further upper-middle- and lower-middle- income groups, so the 88% share reported as middle income is treated as lower-middle income. Though, treating the middle-income share as upper-middle income countries would not change the final score assigned to IFC’s MCPP.
[10] The top three countries accounted for 59% of the total portfolio of Trade MAPS.