

Financial regulation within Advanced Economies (AEs) is a key driver of capital flows to Emerging Market and Developing Economies (EMDEs). Bank capital rules affect the ability of developed country banks to lend and invest in EMDE financial instruments. Trading book capital rules influence whether banks can deal in Emerging Market (EM) cash and derivative instruments, and they crucially affect the liquidity of markets in these securities. Insurer and bank capital rules affect incentives to invest in important exposures closely associated with EM trade and investment, most notably infrastructure projects.
Key findings
- Monitor the participation of AE banks in EMDE markets, to assess the appropriateness of liquidity rules for EMDEs.
- Review the capital requirements for banks engaging in carbon credits, by reflecting the risk of the underlying assets.
Front matter
Financial Regulation and Capital Flows to EMDEs
About the MOBILIST Programme
The MOBILIST programme, developed by the UK Government and delivered in partnership with the Government of Norway, was created to harness the unparalleled potential of public markets to help deliver the climate transition and the United Nations Sustainable Development Goals (SDGs) in developing economies.
The programme demonstrates how public markets can help to mobilise the capital that emerging markets and developing economies (EMDEs) so urgently need to close the growing SDG financing gap. MOBILIST offers equity capital into pioneering products at IPO and provides them with technical assistance throughout the listing journey. The programme’s investments are selected for their feasibility, commercial viability, additionality, scalability, and replicability. These investments seek to generate information through demonstration, forging a shorter path to listing that other investors and issuers could follow.
In addition to its direct support for selected products, MOBILIST also strives to inspire the replication of these investments by creating an enabling environment for issuers, investors, and intermediaries. This includes conducting and commissioning research into the range of factors that shape capital flows to EMDEs and identifying solutions to constraints on these flows.
The research contained in this report was commissioned to reveal such insights and to inform stakeholders across the investment landscape to catalyse capital mobilisation while sustaining the benefits of stability, transparency, and good governance that public markets provide.
Financial Regulation and Capital Flows to EMDEs
Executive Summary
Financial regulation within Advanced Economies (AEs) is a key driver of capital flows to Emerging Market and Developing Economies (EMDEs). Bank capital rules affect the ability of developed country banks to lend and invest in EMDE financial instruments. Trading book capital rules influence whether banks can deal in Emerging Market (EM) cash and derivative instruments, and they crucially affect the liquidity of markets in these securities. Insurer and bank capital rules affect incentives to invest in important exposures closely associated with EM trade and investment, most notably infrastructure projects.
The regulatory environment for AEs has evolved greatly in the 15 years since the Global Financial Crisis (GFC) of 2007-9. That crisis and its after-shock, the European sovereign debt crisis of 2013, persuaded the global regulatory community, led by AE representatives, to engage in a major review of banking rules, boosting capital requirements for banks, and tightening the liquidity regulations they face. The pre-GFC regulatory environment for banks, provided by the Basel II package, has been superseded by a set of rules published in 2018 as the ‘Basel III Final’ package. As of 2023, these rules have begun to enter the national regulations and laws of many countries around the world. In parallel, regulatory rules for insurers have progressed as Solvency II rules in Europe have come into force, and the International Association of Insurance Supervisors (IAIS) has developed a comparable package of rules at an international level.
The three major elements of the changes in banking regulations set by the Basel Committee on Banking Supervision (BCBS) are (i) increases in capital ratios, (ii) the Fundamental Review of the Trading Book (FRTB), and (iii) the revised Credit Risk Standardised Approach (SA) and floors regime. The Basel capital rules work by multiplying a bank’s individual exposures by Risk Weights (RWs) to obtain a total amount of Risk Weighted Assets (RWAs). The bank then multiplies its RWAs by capital ratios to calculate the amount of capital it must hold. Of the above changes, (i) involved adjusting the overall ratios upwards while (ii) and
(iii) consist of changing the ways in which RWAs are computed in case (ii) for exposures in the trading book and in case (iii) for credit exposures in the banking book.
The GFC also led governments and regulators to update the mechanisms for determining financial regulations. The previous architecture for regulatory decision-making was revised with the G20 taking over from the G10 as the preeminent body for identifying high-level priorities in regulation. The Financial Stability Forum was revamped with an increased membership and increased numbers of members were admitted to the Standard Setting Bodies (SSBs) for banking, insurance, and securities markets with the International Organization of Securities Commissions (IOSCO). These developments introduced at least the potential for EMDE influence on regulatory policymaking.
This study considers these developments. First, to provide context, we examine data on capital flows to EMDEs, showing how they have evolved through the last two decades, and their sensitivity to the disruptions caused by financial crises. Leaving out capital flows to China, one may observe that most categories of public and private market capital flows have trended down in recent years. The exception is Foreign Direct Investment, which is probably the least sensitive to the regulatory policy environment. Also, despite the negative trend of capital flows through bank lending in recent years, the COVID-19 crisis appears to have brought an unexpected and sharp rise in bank lending. We suspect this phenomenon is temporary and reflects the peculiar conditions prevailing in the last two years for which we have data, 2021 and 2022.
The core of the paper is a set of vignettes of regulatory policy issues that we label “regulatory frictions”. Each vignette describes a specific set of developed country or global regulations that may adversely affect economic and financial developments in EMDEs. Clearly, capital charges or other rules that accurately reflect the relative risk or liquidity of EMDE exposures or markets are uninteresting, in this regard, as any prudential regulator is justified in adopting such rules. Our presumption in examining the set of issues included is, therefore, that the regulations in question are not commensurate with actual risk. We provide calibration evidence that this is the case.
The issues we examine are as follows:
1. Treatment of EM securities in FRTB
2. Impact on EM infrastructure loans of insurer prudential capital rules
3. Effect of MiFID II research rules on Emerging Market (EM) investment research
Financial Regulation and Capital Flows to EMDEs
4. Regulatory constraints on EM production of Voluntary Carbon Credits (VCCs)
5. Restrictions on the use of local Credit Ratings Agencies (CRAs)
6. Effects on bank activity in EM securities markets from capital consolidation rules
7. Impacts on Correspondent Banking in EMDEs of Anti Money Laundering (AML) and Know Your Customer (KYC) rules.
These are complex and major issues, all of which merit thorough analysis. This report should, therefore, be viewed as establishing a set of topics which are deserving of further study. It is introductory in nature, rather than conclusive. In each case, we provide preliminary thoughts on what could be done to mitigate the problem identified.
The last part of the report describes the architecture of regulatory policy decision-making outlined above, to identify how EMDE voices could be more influential in the design and implementation of financial regulation. It appears that EMDEs do have the requisite representation on SSBs and the scope through their periodic occupancy of the G20 presidency to place some issues on the table for discussion. In practice, however, almost all the regulators and policymakers we interviewed as part of this study confirmed that regulatory design and decision-making are the domain of a small number of AE countries.
Why is this? Part of the explanation is the tendency of EMDEs to act as ‘price takers’ in the process without trying to establish common cause and take initiatives jointly. Another issue is the relative lack of resources that many EMDEs face in the regulatory policy area. Since the approach to devising regulation within the current system relies on ‘soft law’ developed in a consensual way, agreement is reached through the preparation of technical analysis and evidence. But generating such evidence is costly and challenging for EMDE governments.
How might EMDE influence be enhanced? EMDEs should seek to find common cause either in the SSBs or when one of their number occupies the G20 presidency. The SSBs could also consider some changes in the ways they work, conducting regular analyses of the impact of regulations on EMDEs, checking calibrations where these may be incommensurate with risk and seeking to widen responses to consultations. Where there are committees within SSBs that focus on EMDEs, the evaluation of new rules and their impact should receive just as much emphasis as adoption and implementation (which tend to receive the most attention currently).
On the potential role of multilaterals, the Bretton Woods institutions are already involved with EMDEs on issues of financial regulation, but greater attention is paid to the adoption of AE rules than to the capacity building necessary for EMDEs to enter more actively into regulatory design and decision making at an international level. Regional MDBs which already assist regional country groupings on issues of common interest could potentially play a larger role in capacity building in financial regulation and the analysis of regulatory impact.
Financial Regulation and Capital Flows to EMDEs
1. Introduction
Capital flows to Emerging Market and Developing Economies (EMDEs)[1] are a key source of growth for the countries in question (see Harrison et al. (2004), Tong and Wei (2011), and Ahmed and Zlate (2014)). The alternative of building the capital resources necessary for growth through domestic savings alone is very challenging for all but a few EMDEs.
Despite their importance for EMDE growth, capital flows create significant challenges, however. IMF (2019) and FSB (2022) discuss how EMDE external financing exposes these countries to sudden withdrawals of investment. In addition, more than 80% of EM debt (excluding that of China) is denominated in external currencies (for the most part in US dollars). This generates a risk of a substantially higher debt burden if a country’s currency depreciates.
Such risks are not unique to EMDEs. Some Advanced Economies (AEs) were affected by foreign capital flight following the 2007-9 financial crisis (see Molina and Viani (2019)) and, indeed, the recovery in capital flows after that crisis appears to have been more rapid for EMDEs[2] than for the AEs affected. Also, the nature and extent of the vulnerability created by capital flows seem to have changed over time. It was noticeable in the COVID-19 crisis that EMDE capital outflows were much less serious than in earlier crises. It has been argued that this reflected greater robustness in EMDE fiscal and monetary policies.
What are the drivers of capital flows to EMDEs? The Committee on the Global Financial System (CGFS) suggests (see CGFS (2021)) that they are multiple and complex. CGFS categorise capital flow drivers as follows:
(i) Characteristics that ‘pull’ capital flows towards recipient countries,
(ii) Exogenous conditions that ‘push’ capital flows to foreign markets,
(iii) ‘Pipes’ through which capital is channelled, such as different types of financial intermediaries and the rules and practices they follow.
In this study[3], we focus on the impact on capital flows to EMDEs of developed country regulations. Such regulations can affect capital flows through what CGFS (2021) labels ‘pull’, ‘push’ and ‘pipe’ factors.
To illustrate, regulations associated with capital rules directly affect the portfolio allocation decisions of developed country investors. Banks and insurers are subject to capital regulation while funds generally are not. If capital rules are adopted that discriminate against holdings of EMDE securities by banks or insurers, push factors will be directly affected and pipe factors will be influenced in that fund-based, rather than bankbased financing, will be favoured in relative terms.
On the other hand, regulations may affect the availability of information on EMDE securities. If regulations, for example, adversely affect incentives to produce investment research on EMDE securities, then investors that lack their own information sources will find it harder to invest, leading to a negative push factor.
Below, we provide seven examples of developed country regulations that have implications for capital flows. These examples that we regard as ‘regulatory frictions’ are:
1. Treatment of EM securities in the Fundamental Review of the Trading Book (FRTB)
2. Impact on EM infrastructure loan market of insurer prudential capital rules
3. Effect of MiFID II research rules on Emerging Market (EM) investment research
4. Regulatory constraints on EM production of Voluntary Carbon Credits (VCCs)
5. Restrictions on the use of local Credit Ratings Agencies (CRAs)
6. Effects on bank activity in EM securities markets from capital consolidation rules
7. Impacts on Correspondent Banking in EMDEs of Anti Money Laundering (AML) and Know Your Customer (KYC) rules.
Financial Regulation and Capital Flows to EMDEs
The above issues combine pull, push and pipe effects in complex ways. Above, we discussed such effects for regulations that imply higher capital rules for EMDE instruments. Regulations that hamper correspondent banking in EMDEs affect push and pipe channels. Regulatory rules that limit EMDE VCC production could generate pull, push, and pipe channels. Rules that affect information flows regarding EMDE securities or issuers probably most affect the push channel.
How have we arrived at this list of ‘regulatory frictions’? In several cases, we have encountered them in past regulatory impact studies (for example, insurer capital rules on infrastructure debt and the effects of MiFID II on non-core-market investment research). In other cases, the topics were identified by industry experts or regulators we interviewed in the course of this study.
Interviewees included (i) senior current and former central bank officials (at governor, deputy-governor, executive director, and senior management levels), (ii) individuals involved at present in G20, Basel, IAIS and IOSCO activities,[4] (iii) senior representatives of several stock markets, commercial banks, and investment institutions, and (iv) regulatory experts from the industry (three heads of regulatory relations from global banks), academics involved in research on regulatory impacts, and heads of Emerging Market strategy from banks, (v) senior managers from multilateral development institutions [5] In all we interviewed approaching 50 individuals over a period of two months.
For each ‘regulatory friction’, we explain the challenges faced by regulators in setting the rules and analyse what the effect of the rules is likely to be. A key consideration is the extent to which the rules we discuss are commensurate with actual risk or otherwise consistent with justified public policy objectives. Our objective is to identify areas in which developed country regulations appear on the face of it misaligned with the actual risk or liquidity of EMDE instruments or in which the burden of the regulation is incommensurate with the gain in financial stability achieved by the regulation.
We do not advocate any reduction in the overall conservatism of AE regulations and, indeed, suggest that such a relaxation would be against the interests of EMDEs. What is relevant to the study is areas where relative regulations appear to be slanted against EMDE interests without this being aligned with risk or other legitimate policy objectives.
Again, we do not see our brief discussion of the issues as representing definitive examination of these topics, each of which merits extensive further investigation. Rather, our study aims to provide an agenda or menu of subjects that in our view should be picked up and reconsidered by regulators and researchers interested in the field.
As well as analysing significant aspects of regulations affecting EMDE capital flows, the study seeks to understand how governments or other bodies within EMDEs might better influence global regulatory policy debates that affect outcomes for their economies. To this effect, we examine the processes through which regulations are determined. We consider who is represented on the committees of the FSB, BCBS, IAIS and IOSCO and how they function. Furthermore, we consider what are the motives and incentives of individual EMDEs in the way in which they approach participation in these bodies. At a higher level of international governance is the G20. We discuss who determines the G20 agenda as it relates to financial regulation.
Finally, we consider how EMDEs might better present their own views in the regulatory policy forums described above. Should they cooperate or aim to work through proxies (for example certain developed country governments or multilateral institutions)?
The report is organised as follows. Section 2 examines recent relevant trends in capital flows to EMDEs through both public and private markets. Section 3 discusses the seven examples of regulatory frictions listed above, in each case explaining the issues, analysing how the policy has been determined and discussing the likely impact on EMDE investment flows. Section 4 looks at the influence that EMDEs can bring to bear on the regulatory process within global or developed country forums. Section 5 concludes.
Financial Regulation and Capital Flows to EMDEs
2. Capital Flows to EMDEs
This section sets the scene for subsequent analysis by documenting the nature of EMDE capital flows and establishing a set of stylised facts about how they have behaved in the last two decades. We examine flows, both gross and net, involving either debt or equity securities, and via either private or public capital markets. Gross inflows consist of changes in foreign holdings of domestic assets, while gross outflows are changes in domestic holdings of foreign assets. As such, gross inflows may be negative in a given period, even though one would expect them to be on average positive over time.
Figure 2.1 display gross flows to EMDEs. The four panels show Portfolio Debt and Portfolio Equity (Panels a) and b)), Foreign Direct Investment (Panel c)), and Other Investment (Panel d)) which consists primarily of bank lending. It is important to consider all categories of flows since capital can move through different channels depending on events and the incentives provided by, among other issues, regulation. For example, private market flows, like bank lending and Foreign Direct Investment (FDI), may be replaced by public market flows if banks and corporates become less willing to supply capital. This leads EMDE entities to rely instead on public debt and equity markets.
Financial Regulation and Capital Flows to EMDEs
Gross Debt flows are extremely low until a sudden increase following the 2007-9 crisis. They collapse again in 2015 when worries emerge regarding Chinese debt. After a period of recovery, portfolio debt flows fell again when the COVID-19 crisis occurred. Portfolio Equity flows to EMDEs are markedly lower in magnitude than Portfolio Debt flows. Portfolio Debt flows fell sharply during the COVID-19 crisis.
Flows via private markets have exhibited less volatility and clearer trends than those involving public markets. Foreign Direct Investment (FDI) has trended up over the last two decades from $70 billion in 2005 to $225 billion in 2022. Note that the OECD data on FDI does not include flows to China. A breakdown of the FDI data by country in 2022 is provided in Figure 2.2. This shows that Brazil is the leading destination country for FDI in that year, followed by India and Poland. Other Investment rose from $0 to $150 billion before 2007 and was volatile thereafter. In 2015 and 2016, Gross Other Investment became negative.
The data shown in Figure 2.1 is strongly influenced by capital flows to China. Figure 2.3 shows the same variables as in the earlier figure but this time excluding China. In this case, the picture is very different. For Portfolio Debt, Portfolio Equity and Other Investment, growth up to the end of 2007 is followed by a long period of decline, with gross flows close to zero by 2018-20. The only deviation from this pattern is that Other Investment (bank lending) rose sharply during the COVID-19 crisis.
It is also interesting to note that the sharp reduction in public market capital flows at the onset of the Covid- 19 crisis evident in Figure 2.1, is absent in Figure 2.3. This shows that the Covid 19 flight in public market capital flows affected China alone.
Figure 2.4 shows net inflows to EMDEs including China. Net inflows represent net inward flows to the country due to non-residents (Gross Inflow) and residents (Gross Outflow) capital flows. The overall picture for EMDEs, excluding China, is that portfolio investment replaced bank lending following the GFC but that, thereafter, all three categories of flows progressively declined. Only Other Investment (bank lending) rose sharply during the COVID-19 crisis.
The main message here is that net flows closely resemble the gross flows shown in Figure 2.1, i.e., flows initiated by domestic investors are relatively unimportant.
Financial Regulation and Capital Flows to EMDEs
What are the important findings of this section? First, the data point towards a long-term negative trend in gross capital flows via public markets to EMDEs excluding China. Both debt and equity gross capital flows progressively decline over the last decade. Unexpectedly, other capital flows which include bank lending rises sharply during the COVID-19 crisis, but it remains unclear how temporary this development is. Foreign direct investment to EMDEs excluding China has grown consistently over the last few years. Portfolio flows using public markets do not decline sharply for countries other than China.
A second important finding of this section, already mentioned, is the strong relation between financial crises and curtailments in capital flows to EMDEs. While this phenomenon is well known, it is worth emphasising in this study of regulatory impact because it underlines the fact that the interest of EMDEs is not served by a relaxation of AE financial rules. For both EMDEs and AEs, the stability of AE financial systems is crucially important. This does not imply, on the other hand, that imposing a high regulatory burden on certain categories of EMDE exposure or on activities that are important for EMDEs, is justified when such rules are incommensurate with risk or liquidity. The next section will examine cases in which the relative regulatory burden in AE rules appears to disadvantage EMDEs in ways that are not aligned with risk or justified by other reasonable public policy objectives.
What are the important findings of this section? First, the data point towards a long-term negative trend in gross capital flows via public markets to EMDEs excluding China. Both debt and equity gross capital flows progressively decline over the last decade. Unexpectedly, other capital flows which include bank lending rises sharply during the COVID-19 crisis, but it remains unclear how temporary this development is. Foreign direct investment to EMDEs excluding China has grown consistently over the last few years. Portfolio flows using public markets do not decline sharply for countries other than China.
Financial Regulation and Capital Flows to EMDEs
A second important finding of this section, already mentioned, is the strong relation between financial crises and curtailments in capital flows to EMDEs. While this phenomenon is well known, it is worth emphasising in this study of regulatory impact because it underlines the fact that the interest of EMDEs is not served by a relaxation of AE financial rules. For both EMDEs and AEs, the stability of AE financial systems is crucially important. This does not imply, on the other hand, that imposing a high regulatory burden on certain categories of EMDE exposure or on activities that are important for EMDEs, is justified when such rules are incommensurate with risk or liquidity. The next section will examine cases in which the relative regulatory burden in AE rules appears to disadvantage EMDEs in ways that are not aligned with risk or justified by other reasonable public policy objectives.
Figure 2.5 shows quarterly changes in net debt inflows to EMDEs, broken down by the source of funds and focussing on specific crisis periods, namely the GFC (Panel a)), the so-called Taper Tantrum of 2013 (Panel b)) when US monetary policy turned less supportive, affecting investment flows to EMDEs adversely, and the COVID-19 crisis of 2020 (Panel c)). Note that the data from Avdjiev et al. (2022) differ substantially from those used in earlier figures provided by OECD Monthly Capital Flow Dataset (2023). The figure shows the contraction in bank lending that occurred in each of the three crises. In the COVID-19 crisis, public sector flows helped to offset the contraction, although, in the earlier events, falls in public sector capital flows contributed to the overall declines. This figure serves to emphasise the cost to EMDEs of relying on foreign capital flows and the fact that it is strongly in the interests of EMDEs that AEs maintain high standards of financial regulation to guard against financial crises.
Financial Regulation and Capital Flows to EMDEs
What are the important findings of this section? First, the data point towards a long-term negative trend in gross capital flows via public markets to EMDEs excluding China. Both debt and equity gross capital flows progressively decline over the last decade. Unexpectedly, other capital flows which include bank lending rises sharply during the COVID-19 crisis, but it remains unclear how temporary this development is. Foreign direct investment to EMDEs excluding China has grown consistently over the last few years. Portfolio flows using public markets do not decline sharply for countries other than China.
A second important finding of this section, already mentioned, is the strong relation between financial crises and curtailments in capital flows to EMDEs. While this phenomenon is well known, it is worth emphasising in this study of regulatory impact because it underlines the fact that the interest of EMDEs is not served by a relaxation of AE financial rules. For both EMDEs and AEs, the stability of AE financial systems is crucially important. This does not imply, on the other hand, that imposing a high regulatory burden on certain categories of EMDE exposure or on activities that are important for EMDEs, is justified when such rules are incommensurate with risk or liquidity. The next section will examine cases in which the relative regulatory burden in AE rules appears to disadvantage EMDEs in ways that are not aligned with risk or justified by other reasonable public policy objectives.
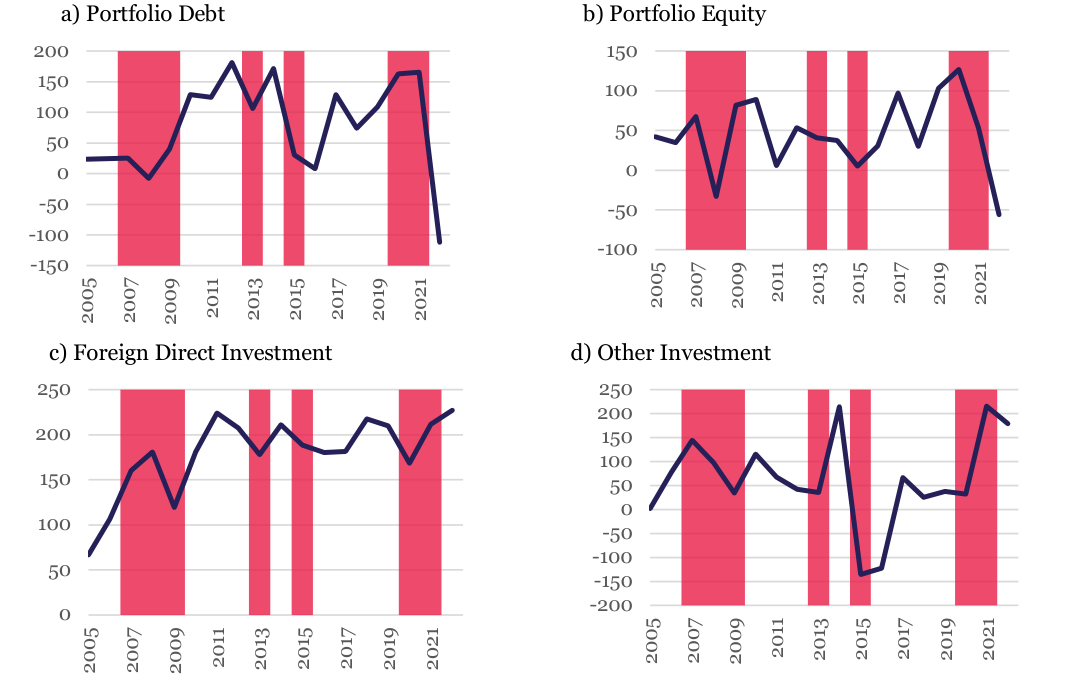
Note: The data are expressed in USD billions. The data source is OECD Monthly Capital Flow Dataset (2023). In the current study, we employ the January 2023 version. The source lacks data on Foreign Direct Investment (FDI) for China. The shaded regions represent global economic crises namely: the GFC (2007-2009), the Taper Tantrum (2013), the Chinese Renminbi Devaluation (2015), and the COVID-19 crisis (2020-2021).[6]
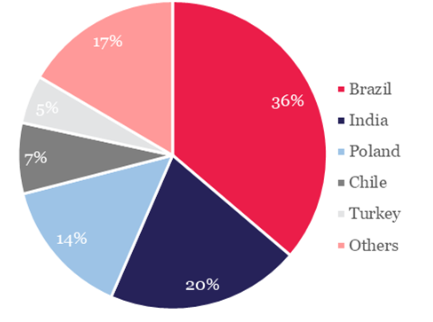
Note: The data source is OECD Monthly Capital Flow Dataset (2023), in the current study we have employed January 2023 version. The source lacks data on Foreign Direct Investment (FDI) for China.
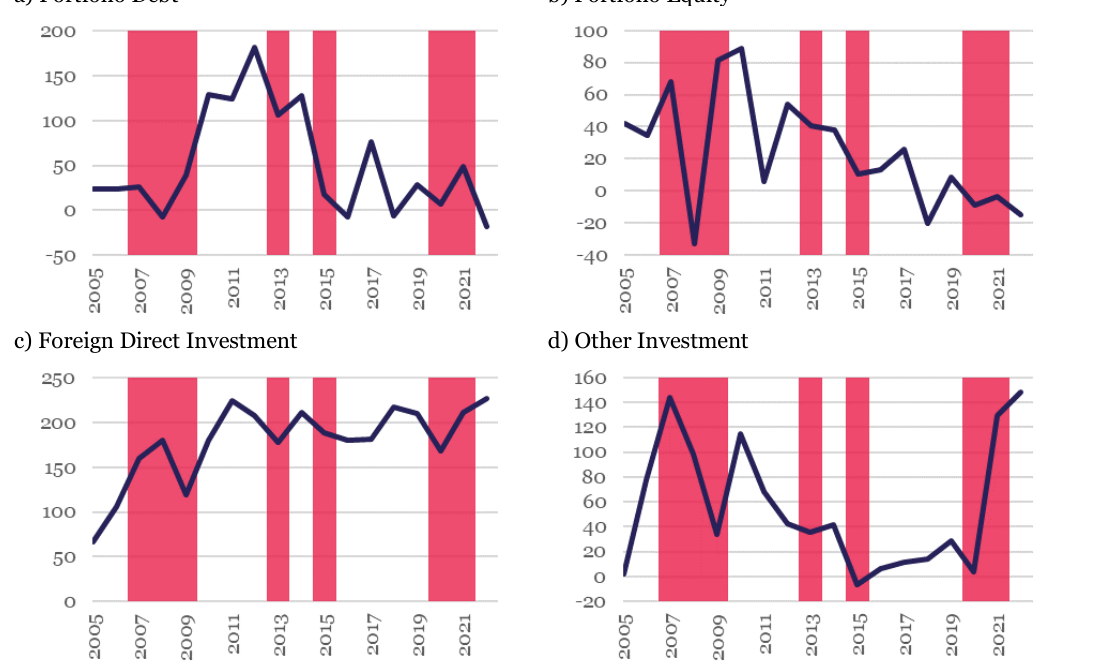
Note: The data are expressed in USD billions. The data source is OECD Monthly Capital Flow Dataset (2023), in the current study we have employed January 2023 version. The source lacks data on Foreign Direct Investment (FDI) for China. Hence, the FDI plot is identical to that in Figure 2.2. The shaded regions represent global economic crises namely: GFC (2007-2009), Taper Tantrum (2013), Chinese Renminbi Devaluation (2015), and COVID-19 (2020- 2021).
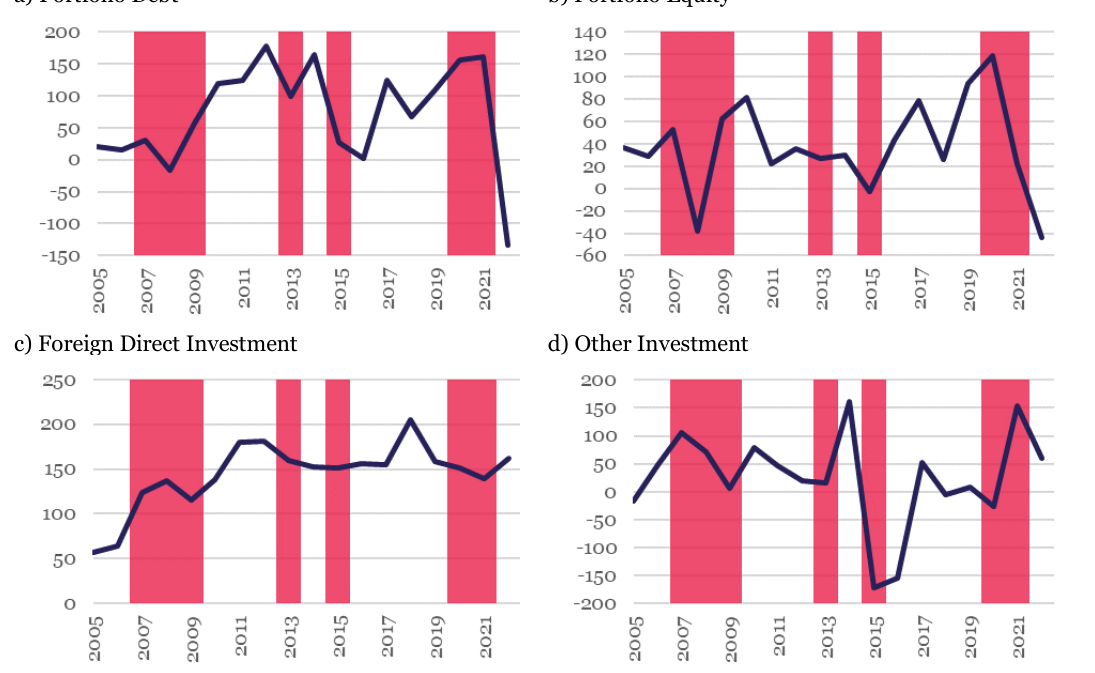
Note: The data are expressed in USD billion. The data source is OECD Monthly Capital Flow Dataset (2023), in the current study we have employed January 2023 version. The source lacks data on Foreign Direct Investment (FDI) for China. The shaded regions represent global economic crises, namely: the GFC (2007-2009), the Taper Tantrum (2013), the Chinese Renminbi Devaluation (2015), and the COVID-19 crisis (2020-2021). The net inflow is the difference between gross inflow and gross outflow.
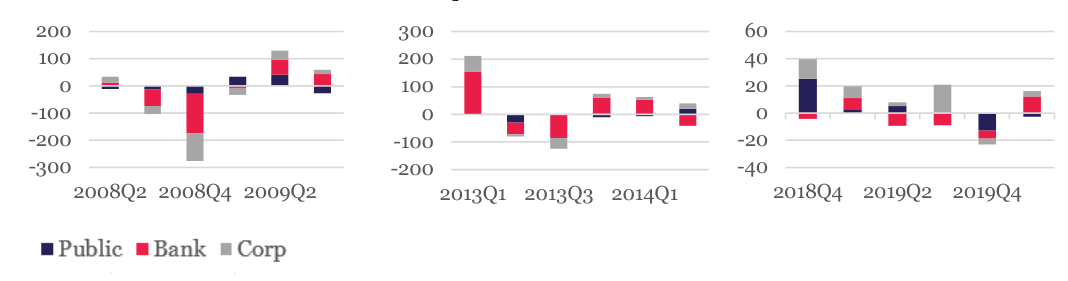
Note: Each bar shows changes in net debt inflows in the given quarter from the average of the previous two quarters for 34 EMDEs, expressed in USD billions, reproduced from Avdjiev et al. (2022).
3. Regulatory Frictions
3.1 Introduction
The regulatory environment for AEs has evolved greatly in the 15 years since the Global Financial Crisis (GFC) of 2007-9. That crisis and its after-shock, the European sovereign debt crisis of 2012-2013, persuaded the global regulatory community, led by AE representatives, to engage in a major review of banking rules, boosting capital requirements for banks, and tightening the liquidity regulations they face.
This section provides examples of how the global or developed country regulations that have emerged since the GFC may disadvantage EMDE financial instruments or institutions. An important aspect of the examples considered is that they appear to be incommensurate with the risk of the exposures in question or the cost appears to be excessive compared to the public policy objectives achieved.
The four primary elements of the post-GFC regulation changes in the case of banks are modifications in (i) capital ratios, (ii) Risk Weights for credit exposures and (iii) trading book capital rules, and (iv) liquidity rules. We will not focus on (i) or (iv) which, as reactions to a major crisis in which banks were found to be short of capital and balance sheet liquidity, are uncontroversial. Instead, we focus on items, (ii) and (iii), which contain elements that are harder to justify and that, in a number of specific ways, penalise EMDE exposures.
We add several other examples of developed country rules that penalise EMDE exposures, namely capital rules for European insurers and the rules governing investment research for European asset managers. The
Financial Regulation and Capital Flows to EMDEs
latter is an example of a regulation that negatively affects non-core markets generally. Hence, while EMDEs are not worse off than, say, less advanced (but non-EMDE) European countries, one may question the overly wide application of core-market approaches. We also examine the way that rules on Know Your Customer are affecting correspondent banking, a particular problem in smaller EMDE jurisdictions.
3.2 Treatment of EM securities in FRTB
Based on the lessons of the GFC, the Basel Committee on Banking Supervision (BCBS) wished to overhaul market risk capital requirements. The overhaul, called the Fundamental Review of the Trading Book (FRTB), began in 2012 when the Basel authorities announced their intention to develop a new Internal Models Approach (IMA), supervisory tests for IMA approval and a new Standardised Approach (SA).[7]
The FRTB was finalised in 2016, and then revised in 2019 as part of its integration into the finalised standards of Basel III (dubbed Basel III Final or, by the industry, Basel 4), with an implementation date in
2022. Following the COVID-19 crisis, and the need to use banks’ capital to help the economic recovery instead, the implementation has been delayed to 2024 or 2025 depending on the jurisdiction.[8]
The Basel III Final Market Risk rules may be found in BCBS (2019c) but are also provided in the online version of Basel III provided by the BCBS’s web-based resource.[9] Within this latter resource, rules related to Market Risk may be found under numbered paragraphs labelled BCBS MAR, for example, MAR 21 relates to the Standardised Approach.
The FRTB differentiates between Advanced Economies (AEs) and Emerging Market Economies (EMEs), in various ways. An explicit differentiation within the FRTB concerns the sensitivities to be used for equities under MAR 21. These differ according to whether the equity is issued within an Advanced Country (AC)[10] or not.
Within Europe, the European Banking Authority (EBA) defines ACs to be the Member States of the European Union, including the overseas countries and territories which have special relations with Denmark, France or the Netherlands, and the States, other than the Member States, which are parties to the Agreement on the European Economic Area (see EBA (2022)). In addition, the following countries are counted as advanced economies: (a) Australia; (b) Canada; (c) Hong Kong SAR; (d) Japan; (e) Mexico; (f) New Zealand; (g) Singapore; (h) Switzerland; (i) The United Kingdom; (j) the United States.[11]
Within the SA, Market Risk capital requirements are the sum of three components: (a) a capital requirement based on the Sensitivities-Based Method (SBM), (b) the Default Risk Capital (DRC) requirement which captures the jump-to-default risk for instruments subject to credit risk, (c) the Residual Risk Add-On (RRAO), related to ensuring sufficient coverage of market risks for specific instruments.
Financial Regulation and Capital Flows to EMDEs
In turn, the SBM capital requirement for a given instrument (before diversification adjustment) is the sum of three risk measures, so-called Delta, Vega, and Curvature. For cash equity positions, the Vega and Curvature risk measures are considered zero. For Delta, equity exposures are categorised by (i) market capitalisation,
(ii) economy and (iii) sector. Table 3.1 shows how this is done.
One may question whether the lower capital requirements for AC equities are justified by actual risk? To analyse this issue, we examine data for the individual-firm constituents of two major equity market indices, namely: (i) S&P Emerging Broad Market Index (BMI), and (ii) S&P Developed BMI. The S&P Emerging BMI represents all companies domiciled in emerging markets within the S&P Global BMI, with a float-adjusted market capitalisation of at least USD 100 million. The S&P Developed BMI is a comprehensive benchmark that includes stocks from 25 developed markets.
We create equal-weighted portfolios using equities that are constituents of the above two indices to compute daily return data for the period 01-Jan-2013 to 01-Jan-2023 (10 years of data). We then calculate 10-day 99%-confidence-level Marginal Value at Risks[12] (MVaRs). MVaR constitutes the amount of additional risk that a new investment adds to a portfolio, i.e., it provides insight into the change in Value at Risk (VaR) due to the purchase of a new investment.
Note that the regulators do not reveal how they themselves have calibrated risk for equities from ACs and other countries. Here, we adopt a ‘reasonable’ approach that sheds light on the issue. To the extent that we find results counter to what is in the rules, we regard the findings as justifying reconsideration of the issue rather than as a definitive result.
Financial Regulation and Capital Flows to EMDEs
Our calculations are under the assumption that losses are either Student’s t distributed[13] or Gaussian (i.e., normally distributed) (see Appendix 2). We focus on ratios of MVaRs. When mean returns are negligible, as is true in such market risk calculations, MVaRs under Gaussian and t-distributed are equal up to a scaling factor (see Appendix 2).
Table 3.2 presents the results of our computation. The ratio between the MVaRs of equities from EMs to AEs is 0.98, suggesting that there is no additional risk within a diversified portfolio of taking an equity position in an emerging market compared to an advanced market for the aggregate portfolio. The table also shows that, for the same equities, the ratio of RWAs for the EM equities to those from AEs is 1.29.
The most disadvantaged bucket is Bucket 1, which covers companies from the sector of consumer goods and services, transportation and storage, administrative and support service activities, healthcare, and utilities. According to the risk characteristics of the underlying securities, the ratio of risk weights between EMs and AEs should be 1.07, whereas the FRTB rules imply a ratio of 1.43, one-third more than our estimate.
What is the intuitive explanation for these results? The table displays the volatilities and correlations (with the aggregate portfolios) of the individual equity returns included in the analysis averaged across categories. This shows that, while the volatilities of the EM equity returns are slightly higher, they are more diversified within the index in comparison to AE equities. This suggests that, while EM equities may be slightly risky on a standalone basis, they are less correlated. Capital and Risk Weights should, therefore, be comparable rather than penalising EMs.
Bankers both from AE and EMDE institutions whom we interviewed as part of this study argued that the FRTB rules tend to discriminate against EM securities in broader and more subtle ways. The data and liquidity requirements for the use of the IMA strongly discourage its use in markets that are less liquid.
For example, among the supervisory tests for the IMA is the Risk Factor Eligibility Test (RFET). “This test requires identification of a sufficient number of real prices that are representative of the risk factor” (BCBS MAR 31.12). One of the conditions is that “the bank must identify for the risk factor at least 24 real price observations per year […]. Moreover, over the previous 12 months, there must be no 90-day period in which fewer than four real price observations are identified for the risk factor. […] The above criteria must be monitored monthly.” (BCBS MAR 31.13).
Financial Regulation and Capital Flows to EMDEs
For AE banks approved to use the IMA, there is a disincentive to participate in EM securities, as the need to continuously monitor the criteria can lead to a failure which could endanger the use of the IMA for the core book.
One might argue that IMA approaches are simply inapplicable in certain markets and that the approach taken in FRTB is justified. However, the concern is that reducing participation by AE banks in EM economies will itself feed back into lower liquidity and, hence, the regulatory approach will exacerbate liquidity issues. In addition, most EM banks, even large ones, will not be able to access the IMA and will turn to the capitalintensive SA instead. This is significant since EM banks play an increasing role in the international banking system, especially for trades between two EM economies (see Cerutti et al. (2018)).[14]
The issues identified in this section imply that AE banks will find it harder to make markets in EM equities, leading to an acceleration in the tendency observed in many such markets of progressive exit by major global institutions. In addition, the fact that EM banks will find it difficult to adopt the IMA (which tends to be less demanding of capital than the SA), will weaken their ability to contribute to cross-border activity in their regions. These issues were emphasised by EM interviewees.[15]
| Bucket | Market | ||||||
|---|---|---|---|---|---|---|---|
| No | cap | Economy | Sector | ||||
| 1 | Consumer goods and | services, transportation | and | storage, | |||
| and support service | activities, healthcare, | utilities | |||||
| 2 | Emerging | Telecommunications, | industrials | ||||
| 3 | market | Basic materials, energy, | agriculture, | manufacturing, | mining, and | ||
| economy | quarrying | ||||||
| 4 | Financials including | government-backed | financials, | real | estate | ||
| technology | |||||||
| Large | |||||||
| 5 | Consumer goods and | services, transportation | and | storage, | |||
| and support service | activities, healthcare, | utilities | |||||
| 6 | Telecommunications, | industrials | |||||
| Advanced | |||||||
| 7 | Basic materials, energy, | agriculture, | manufacturing, | mining, and | |||
| economy | quarrying | ||||||
| 8 | Financials including | government-backed | financials, | real | estate | ||
| technology | |||||||
| 9 | Emerging | All sectors described | under bucket numbers | 1, 2, 3 | and | 4 | |
| market | |||||||
| Small | economy | ||||||
| 10 | Advanced | All sectors described | under bucket numbers | 5, 6, 7 | and | 8 | |
| economy | |||||||
| 11 | Other sector | ||||||
| 12 | Large market | cap, advanced | economy equity | indices (non-sector | specific) | ||
| 13 | Other equity | indices | (non-sector specific) |
Note: Table 9 reproduced from BCBS (2019c). Large market capitalisation is defined as greater than USD 2 billion.
| Bucket | Sector MVaR | EM and | AE Correlation | EM and | AE Volatility | EM and | AE as per | FRTB EM and | AE | |
|---|---|---|---|---|---|---|---|---|---|---|
| 1 | Consumer | 6.6% | 1.07 | 37.6% | 0.91 | 7.4% | 1.15 | 21.4% | 1.43 | |
| 2 | Industrials | 7.6% | 1.11 | 40.2% | 0.86 | 7.9% | 1.24 | 23.4% | 1.34 | |
| Market | 3 | Resources | 8.3% | 0.89 | 42.3% | 0.87 | 8.3% | 1.01 | 17.6% | 0.88 |
| 4 | Financials | 6.8% | 0.95 | 39.9% | 0.79 | 7.4% | 1.20 | 21.5% | 0.86 | |
| 9 | Small Cap | 6.0% | 0.93 | 33.1% | 0.96 | 8.0% | 0.94 | 19.2% | 1.09 | |
| Emerging | ||||||||||
| Aggregate | 4.4% | 0.98 | 34.2% | 0.91 | 7.9% | 1.03 | 21.9% | 1.29 | ||
| 5 | Consumer | 6.2% | 41.5% | 6.4% | 15.0% | |||||
| 6 | Industrials | 6.9% | 46.5% | 6.4% | 17.5% | |||||
| Economies | ||||||||||
| 7 | Resources | 9.3% | 48.4% | 8.3% | 20.1% | |||||
| 8 | Financials | 7.2% | 50.4% | 6.1% | 25.1% | |||||
| Advanced | 10 | Small Cap | 6.4% | 34.3% | 8.6% | 17.7% | ||||
| Aggregate | 4.5% | 37.5% | 7.7% | 17.0% | ||||||
| Note: | The | classification of country | is based | on S&P’s | Broad Market | Index | (BMI) into | Emerging | markets as EMs | and |
Note: The classification of country is based on S&P’s Broad Market Index (BMI) into Emerging markets as EMs and Developed markets as AEs.
3.3 Impact on EM infrastructure debt of insurer and bank capital rules
Infrastructure debt is a key asset class for growth. One might expect that the secured nature of this debt would mean that its credit performance would be superior to that of corporate debt more generally. This should, of course, be reflected in the rating of infrastructure debt if Credit Rating Agencies (CRAs) correctly allow for its secured nature.
European regulators have recognised the significance of infrastructure debt within the Solvency II framework which provides prudential capital regulation for insurers in Europe. However, the favourable treatment of infrastructure debt is only accessible for infrastructure investment from OECD and European Economic Area (EEA) countries.
Table 3.3 presents a set of Solvency II capital charge parameters for corporate bonds and infrastructure loans. The charges are specified in terms of per-year-of-duration risk factors for each rating grade or unrated categories (Public Private Partnership (PPP) transactions or not). The upper part of Table 3.3 shows the risk factors for Corporate Debt Securities and Bank Loans. These were reduced for higher quality, rated infrastructure bonds and loans and for unrated PPP exposures at a late stage in the Solvency II calibration.
The lower infrastructure risk factors appear in the bottom half of Table 3.3.[16] One may observe that the adjustment for unrated infrastructure consists of a reduction of no more than a sixth for PPP exposures and that unrated, non-PPP loans receive no concessions at all. For some rated infrastructure exposures, the reduction in capital is more substantial, amounting to about a quarter decrease for exposures for Credit Quality Step (CQS) 3 (corresponding to an agency letter grade of BBB or Baa).
Without investigating the historical credit performance of infrastructure debt, one might imagine that EMDE infrastructure debt is riskier than equivalent exposures from AEs. That may be why the European authorities only permit lower capital charges for OECD and EEA infrastructure debt. However, inspection of data suggests otherwise.
Financial Regulation and Capital Flows to EMDEs
The relative riskiness of infrastructure debt from High-Income countries on the one hand and Medium- and Low-Income countries on the other may be analysed using the Moody’s-administered consortium data from major global infrastructure lenders.[17] Estimates of Probabilities of Default (PDs) and Loss Given Default (LGD) rates based on those data are provided in Table 3.4. The table also displays historical PDs and LGDs for Moody’s-rated corporate bonds in general.
The information in Table 3.4 suggests that MIC/LIC infrastructure loans have PDs higher than those of All Rated Corporate bonds for short maturities but that for horizons of 5 years and over, the MIC/LIC infrastructure loans are safer. The findings are consistent with the fact that most risks for infrastructure debt occur in the construction phase of the projects in question.
A striking aspect of the statistics in Table 3.4 is that the infrastructure loan LGDs are so low and that they are even lower for MICs/LICs than for HICs. At 15.80%, the historical LGD for MICs/LICs is a quarter of that which one may observe for corporate bonds more generally. This suggests that the treatment of MIC/LIC infrastructure exposures within the Solvency II rules is disproportionate to their true risk.
Risk Control (2020) presents an extensive analysis of the calibration of the Solvency II rules for infrastructure in addition to an examination of the calibration of the International Association of Insurance Supervisors (IAIS) and concludes that both sets of regulations are overly conservative. The analysis of that study focussed primarily on the comparison of infrastructure debt capital charges relative to that of corporate debt in general, rather than examining MIC/LIC versus HIC infrastructure debt charges.
AE insurers currently make relatively small contributions to the financing of EMDE infrastructure which is dominated by bank and fund investment flows. But for insurers that have appetite for long-duration assets
Financial Regulation and Capital Flows to EMDEs
(mainly life assurance companies), this may reflect the prudential regulations that they face rather than an intrinsic preference for other assets. Adjusting the calibration to be consistent with actual risk is a sensible step to take.
| Credit | Quality | Step (CQS) | Unrated | ||||||
|---|---|---|---|---|---|---|---|---|---|
| Duration (yrs) | 0 | 1 | 2 | 3 | 4 | >5 Not PPP | PPP only | ||
| up to 5 | 0.9 | 1.1 | 1.4 | 2.5 | 4.5 | 7.5 | 3 | 3 | |
| 5 to 10 | 0.5 | 0.6 | 0.7 | 1.5 | 2.5 | 4.2 | 1.7 | 1.7 | |
| 10 to 15 | 0.5 | 0.5 | 0.5 | 1 | 1.8 | 0.5 | 1.2 | 1.2 | |
| 15 to 20 | 0.5 | 0.5 | 0.5 | 1 | 0.5 | 0.5 | 1.2 | 1.2 | |
| >20 | 0.5 | 0.5 | 0.5 | 0.5 | 0.5 | 0.5 | 0.5 | 0.5 | |
| Adjusted Risk Factors | for | Infrastructure | Investment | ('Solvency | II Amendment') [EEA or | OECD] | |||
| Credit | Quality | Step (CQS) | Unrated | ||||||
| Duration (yrs) | 0 | 1 | 2 | 3 | 4 | >5 Not PPP | PPP only | ||
| up to 5 | 0.7 | 0.8 | 1.1 | 1.9 | --- | --- | --- | 2.5 | |
| 5 to 10 | 0.4 | 0.5 | 0.5 | 1.1 | --- | --- | --- | 1.5 | |
| 10 to 15 | 0.4 | 0.4 | 0.4 | 0.8 | --- | --- | --- | 1.0 | |
| 15 to 20 | 0.4 | 0.4 | 0.4 | 0.8 | --- | --- | --- | 1.0 | |
| >20 | 0.4 | 0.4 | 0.4 | 0.4 | --- | --- | --- | 0.5 | |
| Note: The source for the risk factors | for | fixed | income | (debt | securities | and lending) investment | is the | Solvency | Capital |
Note: The source for the risk factors for fixed income (debt securities and lending) investment is the Solvency Capital Requirement (SCR) Standard Formula of the Spread Risk Sub-Module (European Commission, 2015). This was amended by EU Regulation 2016/467 (European Commission, 2016) and EU Regulation 2017/1542 (European Commission, 2017). The reduced capital charges specified there (e.g., 20.0 percent in lieu of 23.5 percent over 10 years) apply to qualifying infrastructure investment in EEA and OECD countries (“EEA or OECD”) but only if the exposure is rated “Baa/BBB” (CQS=3) or higher or are Public Private Partnership (PPP) exposures. For unrated qualifying infrastructure investment, the original risk factors for “Baa/BBB”-rated corporate exposures apply. It is reported that the reduction factors are calibrated using the credit performance of PPP projects in EEA and OECD countries (see EIOPA (2013) and (2015)).
| Data set | 1 | 5 | 10 | 15 | 20 | LGD |
|---|---|---|---|---|---|---|
| HICs Infrastructure | 0.98 | 3.83 | 4.80 | 4.93 | 4.95 | 22.10 |
| MICs/LICs Infrastructure | 1.86 | 6.32 | 6.98 | 7.03 | 7.03 | 15.80 |
| Inv Grade Corporate | 0.09 | 0.90 | 2.16 | 3.60 | 5.20 | 60.00 |
| Spec Grade Corporate | 4.12 | 19.12 | 29.51 | 35.41 | 39.79 | 61.30 |
| All rated Corporate | 1.63 | 7.12 | 10.61 | 12.87 | 14.84 | 61.30 |
| Note: Columns 2 to 6 display cumulate | Probabilities of | Default (PDs) | or different | horizons | from issuance. | The |
Note: Columns 2 to 6 display cumulate Probabilities of Default (PDs) or different horizons from issuance. The righthand column contains historical average Loss Given Default (LGD) rates. The upper block contains statistics for infrastructure loans for High-Income and Middle- and Low-Income Countries (respectively HICs, MICs and LICs). The lower block contains statistics for corporate bonds.
3.4 Effect of MiFID II research rules on Emerging Market (EM) investment research
The Markets in Financial Instruments Directive (MiFID) is a European regulation that aims to improve transparency across the European Union’s (EU) financial markets. The application of MiFID II in 2018 transformed the European market for investment research, obliging many institutions to change how they market, budget, negotiate, contract, and pay for such research.
Concerns have been raised that MiFID II disadvantaged smaller companies and those located in non-core markets by reducing the volume and quality of investment research to which they are subject. While such worries are equally true for firms in non-core advanced or emerging markets economies, asymmetries of information are an issue, particularly for firms in developing countries. This means that one should consider the impact of MiFID II on EMDEs.
The MiFID II rules restrict the benefits that asset managers may receive from those other than their investment clients. Benefits of this kind, of which investment research is an example, are termed ‘inducements.’ MiFID II requires that managers purchase research either using client resources, through a transparent process termed Research Payment Accounts (RPAs) or by using their own resources. Either way, managers must budget, monitor, and evaluate research to ensure that they are not receiving research below the market value, which might constitute an inducement.
The use of either RPAs or the manager’s own resources separates payments for research from remuneration for execution services. In many markets, including the US, managers pay brokers for both research and execution services via a single ‘bundled’ payment. In equity markets, this takes the form of bundled commission. Brokers in Fixed Income, Currencies and Commodities (FICC) markets traditionally provided research to asset managers for free, being paid through the bid-ask spreads they charge as market-makers.
Either if they are buying research through RPAs or paying from their own resources, managers are likely to be reluctant to spend substantial amounts on research. Hence, the changes introduced by MiFID II are likely to reduce asset manager research budgets, leading to a fall in research prices, volumes and, possibly, in quality (see European Commission (2020)). In cases where research is especially important, such as in emerging or less well-known firms, the effects could be significant. Ultimately, a reduction in research volume may affect the liquidity of markets and financing terms that issuers can obtain.
Proponents of MiFID II-style unbundling argue that combining execution and research distorts research markets by (i) encouraging excessive research production and (ii) creating incentives for researchers to generate biased views designed to encourage trading rather than to create objective and accurate recommendations. Hence, reduced research volume following the introduction of MiFID II might have little negative effect on the market since only low-quality analysis would be squeezed out and, indeed, research quality could rise as research houses would focus on accurate forecasting rather than generating order flow.
Financial Regulation and Capital Flows to EMDEs
To examine the investment research market for EM and AE firms, we obtain historical data for the period 2014–2022 on the number of analysts covering different equity positions from Refinitiv Eikon. We focus on those firms that are constituents of the major equity indices: S&P Emerging BMI and S&P Developed BMI.
We study the behaviour over time of the number of analysts covering these firms, examining firms in 4 samples of 100 equity instruments each, from the S&P Emerging BMI and S&P Developed BMI. The sets of 100 equities are designed to be the 100 with the largest or smallest firms by total market capitalisations or the sets of ranked firms that are centred on the quantiles of constituent firms ranked by total market capitalisation (50 with capitalisation above and 50 with capitalisation below the quantile in question). Market capitalisation is expressed in USD and measured on the 1st of March 2023.
The average market capitalisation for the 4 samples is reported in Table 3.5. It is interesting to note that the average market capitalisation of AE equities is only higher for the top 100 and 25th quantile compared with the EM equities. From the median (50th quantile) onwards, EM equities have larger market capitalisation than AE equities. This difference could be attributed to the fact that EM stocks must have a market capitalisation of no less than USD 100 million (as discussed in Subsection 3.2).
Figure 3.1 shows the behaviour over time of the average numbers of analysts following individual equities. The trends are very different for AE and EM equities. The number of analysts following large EM firms has grown from 18 to 25 over the nine years considered. This rate of growth is noticeably larger than that for the largest AE firms. For the median sets of firms, the growth is less for EM firms than for AE firms. There is a noticeable drop in the number of analysts in 2018 from averages of around 4 in 2017 to 3.4 the following year.
For the 75% quantile group, the average number of analysts has trended up to AE firms, while for EM firms the earlier upward trend slackened and then declined in 2018-19. For the bottom 100 firms in the indices, while the AE group has a pronounced upward trend, the EM group exhibits a noticeable downward trend, dropping from 2 analysts in 2017 to below 1 in 2022.
Past studies of the impact of MiFID II unbundling rules for investment research have focussed on the impact on Small and Medium Enterprises (SMEs) within EU 28 plus the UK. An example is Risk Control (2020) which presents an extensive legal, statistical, and survey-based analysis of MiFID II unbundling. This and other studies have concluded that while SME research did drop around 2018, the year of MiFID II implementation, this may have reflected cyclical issues.
Similar considerations may affect the apparent impact of MiFID II on EMDE firm-related investment research. From Figure 3.1, it appears that firms that have market capitalisation at or below the median do exhibit weakness in research volumes starting in 2018. It is noticeable that this 2018 weakness is reversed for firms with a market capitalisation in the vicinity of the median level while, for smaller firms, the weakness persists. This trend began before 2018 but a further negative deviation from it appears to occur in 2018.
An industry expert, whom we interviewed as part of this study, emphasised to us that the dynamics of EMDE research are strongly driven by developments in Asia since this is the region in which the large majority of EMDE firms that are of interest to AE investors are located. The 2018 implementation of MiFID II coincided
Financial Regulation and Capital Flows to EMDEs
with weakness in stock indices for this region. The profits of specialist EMDE fund managers depend on how their indices performed the year before (since this drives the volume of their Asset Under Management (AUM)). Large bank brokers adjust their research activity as the profitability of the fund managers evolves.
Nevertheless, the rapidly contracting volume of research for the smaller firms included in Figure 3.1 suggests that the research environment for EMDE corporates is a significant issue. The potential effect of MiFID II in discouraging investment research on such firms is, therefore, important to consider and monitor.
The same industry expert mentioned above emphasised to us that, operationally, for major brokers, unbundling is awkward and challenging in EMDE contexts as it leads to multiple quite different bundled and unbundled prices including those of local brokers. Asset managers are obliged to seek the best execution costs but with multiple prices, this poses practical problems.
EMDE markets are plagued by asymmetries of information that discourage AE investors from taking exposure. This appears to be a much more significant (‘first order’) market failure that might lead, in some cases, to an over-production of research (a ‘second order’ market failure). This could justify the adoption of an exemption in unbundling requirements for non-core markets.
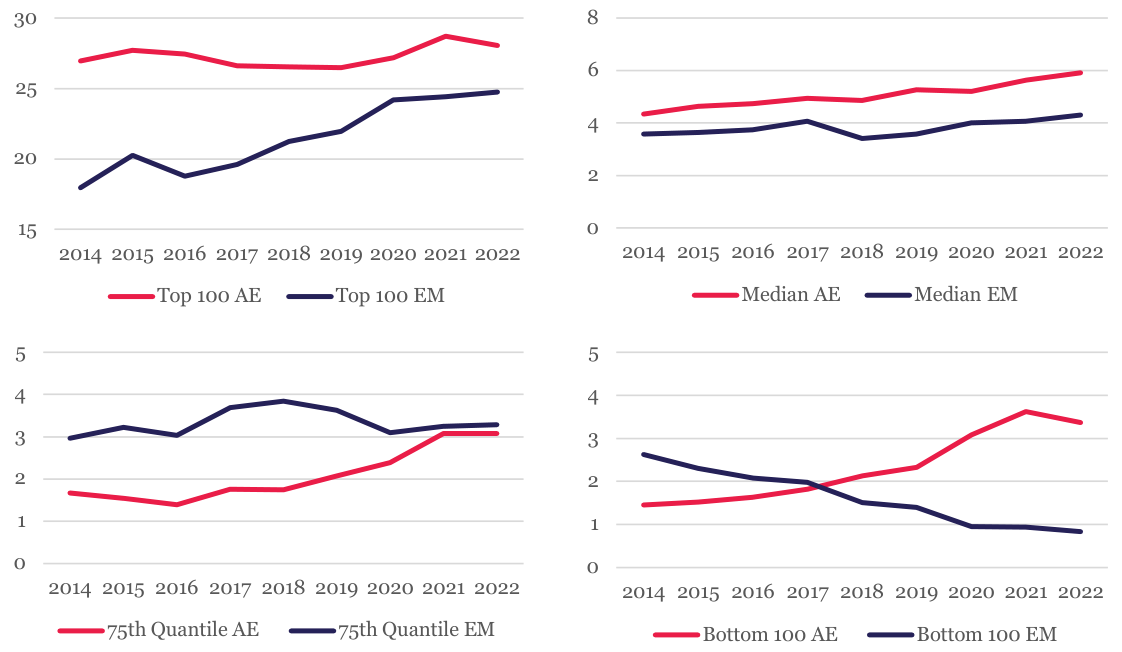
Note: The plots show the average number of analysts following the equity in question over time. The equities are grouped based on Market Capitalization in S&P’s Emerging and Developed BMI indices. The classification of country is based on S&P’s Broad Market Index (BMI) into Emerging markets as EMs and Developed markets as AEs. Data sources used are Refinitiv and Bloomberg.
| Top 100 | 279,061 | 105,920 |
|---|---|---|
| 25th Quantile | 4,448 | 3,874 |
| 50th Quantile | 1,191 | 1,444 |
| 75th Quantile | 403 | 558 |
| Bottom 100 | 56 | 104 |
Note: The source is Bloomberg.
3.5 Regulatory constraints on EM production of voluntary carbon credits (VCCs)
The term Carbon Credits denotes Emission Allowances (EA) or carbon offsets depending on the context (see Climate Solutions and Simmons & Simmons (2023)). Of these, EA certificates are issued by governmental authorities, and they give the registered holder the authorisation to emit one tonne of carbon dioxide or other greenhouse gas equivalent (tCO2e). Such certificates can be traded on a Compliance Carbon Market (CCM), typically established on regulated exchanges. As trades are typically reported publicly by the platform
Financial Regulation and Capital Flows to EMDEs
on which the sale happens, there is a transparent price for such EAs. As the name implies, CCM participants are mandatorily required to comply with regulatory obligations in relation to EAs.
According to the International Swaps and Derivatives Association (ISDA) (2021), the EU Emission Trading System (EU ETS), established in 2005 in response to the 1997 Kyoto Protocol, which set targets for adhering countries to reduce their emissions, is currently the largest CCM in the world. It has influenced the design of other CCMs. For example, post-Brexit, the UK ETS replaced the EU ETS in the UK in January 2021 and follows a near-identical structure. There are similar schemes in China, Japan, Mexico, South Africa, South Korea, California and nearly 70 other jurisdictions around the world.
Carbon offsets, on the other hand, are instruments representing the avoidance, reduction or removal of tCO2e. They are issued by entities called ‘standards’[18] in the voluntary carbon market (VCM) or, in some but not all cases, by governments in the Sovereign Carbon Market (SCM). The VCM and SCM are each, broadly speaking, unregulated. Carbon offsets can be sold Over-The-Counter (OTC), via unregulated exchanges or through regulated exchanges. They may also be converted into a digital asset through the process of ‘tokenisation’. As with all financial products and commodities, the OTC market has the least transparent price discovery.
A SCM is also starting to develop which is consistent with Articles 5 (REDD+)[19] and 6 (Internationally Transferred Mitigation Outcomes (ITMO)) of the 2015 Paris Agreement. Article 6 creates a mechanism through which governments can use ITMOs to transfer the benefits of their carbon reductions or removals to another government that is a party to the Paris Agreement (e.g., to enable the buying country to attain their Nationally Determined Contribution (NDC) under the Paris Agreement) and/or to corporate buyers. At the UN Climate Change Conference in Glasgow in November 2021, the rules related to Article 6 were adopted, making the Paris Agreement fully operational. It is anticipated that purchasers of ITMOs will typically be located in developed countries and that the selling governments will typically belong to emerging market countries (OBG, 2021).
The goal of achieving “Net zero” emissions by 2050 is impossible to achieve without the use of carbon offsets. Through the purchase and retirement of carbon offsets, companies can achieve the last mile of their Net Zero goals to offset their undebatable emissions (those that cannot be avoided, reduced or removed).
With some exceptions, the framework for regulated financial institutions to buy and sell Carbon Credits (CCs) is still relatively unformed. In the context of this study, the issue is not so much that the current rules create obstacles but more that there is potential for this to occur. One might expect that the primary supply of carbon offsets for the VCM will be countries located in the global south. Clearly, the regulatory framework adopted for CCs will be key to the development of the market and, hence, whether regulations emerge that favour or disfavour EMDE production will strongly influence 0utcomes.
How might regulation for the VCM develop? Past experience suggests a role for global standard setters. Following the G20 summit in Pittsburgh in 2009, the Committee on Payments and Market Infrastructures (CPMI) and the International Organization of Securities Commissions (IOSCO) created global standards for post-GFC regulation that were ultimately built upon and further developed at jurisdictional level by local policymakers.
A key benefit of such a ‘top-down’ approach is that it promotes global harmonisation of standards. This, in turn, has led to the US, European Commission and others adopting ‘equivalence’ mechanisms that result in the deference of one regulatory authority to another, in circumstances where the applicable third-country
Financial Regulation and Capital Flows to EMDEs
legislation is determined to be ‘equivalent’ to the home jurisdiction’s laws. The greater the number of equivalence determinations, the more cross-border execution and clearing can be facilitated.
A VCM market participant, when interviewed as part of this study, observed that the consultations launched by IOSCO on how to regulate in the VCM suggest that IOSCO is now looking to perform a similar global standard-setting role in relation to the VCM. Indeed, in November 2022, at the COP27 meeting in Egypt, IOSCO (2022a) launched a public consultation on recommendations for establishing sound Compliance Carbon Markets (CCMs) and on key considerations for enhancing the resilience and integrity of Voluntary Carbon Markets (VCMs). IOSCO is thus more advanced in the rule-setting process for CCM (at the recommendation stage) and is just starting for the VCM (at the consideration stage).
For the VCM, IOSCO (2022b) has put forward eleven Key Considerations (KCs) relating to eight topics as shown in Table 3.6. In the future, KC 6 and KC 7 are likely to affect the business model of financial intermediaries, standards and carbon credit rating agencies. However, whether a ‘top-down’ IOSCO-led approach to regulation of the VCM can succeed in the 2020s remains to be seen, given the recent increase in competition between jurisdictions and the resulting decline in globalisation.
A key consideration for VCMs is the degree to which, and how, to allow for open, 1 Open access broad market participation. A key consideration for VCMs is how to ensure that the market has sufficient integrity to operate without fraud, manipulation, or disruption. Market A related key consideration for VCMs is how to provide market participants with integrity 3 sufficient liquidity and price discovery to execute trades on a timely basis with minimal price dislocation. Publicly A key consideration for VCMs is how to promote transparency by ensuring that available data market participants have sufficient data publicly available. to promote Another key consideration concerns how relevant VCM participants may disclose transparency their use of carbon credits in their financial reporting. 6 Price discovery A key consideration for VCMs is how to facilitate price discovery for carbon credits. A key consideration for VCMs is how to accord with global, high-quality standards Product 7 standardisation against which the environmental integrity of carbon credits and their underlying & methodology can be assessed. Environmental A further key consideration for VCMs is how to, to the extent possible, standardise integrity carbon credits in order to promote greater liquidity. A key consideration for VCMs is how to take steps to improve the interoperability 9 Interoperability of offset registries. Financial A key consideration for VCMs is that market participants engaging in these 10 integrity of markets have sufficient financial integrity to ensure the cash settlement or physical transactions delivery of a carbon credit transaction. A key consideration is what legal challenges VCM stakeholders may encounter 11 Legal certainty during the lifecycle of an offset.
Currently, VCCs are not considered financial instruments under the key piece of post-2008 financial crisis regulation in Europe, MiFID II. As a result, VCCs are not subject to specific regulation in Europe. Whilst perhaps tempting to declare VCCs as financial instruments, to accelerate regulation of the VCM, the impact that such an approach would have on liquidity requires further research and evaluation. Some intermediaries in the VCM’s OTC market are lightly capitalised today and would likely disappear from the market in the event that they are required to seek authorisation from national competent authorities.
Some countries do not permit (or at least, do not encourage), the purchase of carbon offsets issued by or on behalf of foreign companies or governments foreign issuers. Australian companies are largely limited to purchasing domestic Australian Carbon Credit Units (ACCUs) and, in future, Safeguard Mechanism Credits.
Financial Regulation and Capital Flows to EMDEs
Australian companies tend to prioritise the purchase of EAs and offsets in their domestic CCM and VCM.[20] This illustrates the fact that developed economy governments have an essential role in catalysing inward investment in emerging market economies via sovereign carbon markets.
As carbon prices are higher in AEs compared to in EMDEs, careful analysis of the quantitative impact regarding the elasticity of carbon prices in AEs is important when developing regulation on carbon offsets that will facilitate the capital flows from AEs to EMDEs. Current levels of carbon prices in AEs are at a level which means that counterparties are not only offsetting carbon emissions but actively reducing carbon emissions. In other words, absolute reduction is a permanent contributor to the “net zero” goal.[21]
Some EMDE jurisdictions wish to scale up their production of VCCs. Africa currently produces only a small percentage of its carbon credit potential. The Africa Carbon Market Initiative (ACMI) announced a bold ambition for the continent — to reach 300 million credits produced annually by 2030 (a 19-fold increase from the 16 million credits in 2020).[22] It said that this level of production could unlock $6 billion in income and support 30 million jobs. By 2050, ACMI is targeting over 1.5 billion credits produced annually in Africa, leveraging over $120 billion and supporting over 110 million jobs. The initiative was inaugurated at COP 27 in Egypt in collaboration with The Global Energy Alliance for People and Planet (GEAPP), Sustainable Energy for All (SEforALL), and the UN Economic Commission for Africa. At the time, Damilola Ogunbiyi, the CEO of SEforALL and a member of the ACMI’s steering committee, commented on the initiative, saying “the current scale of financing available for Africa’s energy transition is nowhere close to what is required. Achieving the ACMI targets will provide much-needed financing that will be transformative for the continent.”[23]
A roadmap report by ACMI (see ACMI (2022)) sets out 13 action programs to address challenges across the VCM value chain in Africa. The first programme seeks to implement the relevant regulatory framework: “Development of country VCM activation plans that stimulate the carbon credit ecosystem, build local capacity and clarify regulation”. This initiative shows how EMDEs can make their voice heard. They first need to put in place the regulatory framework and then collaborate with international organisations to achieve their aims. Such collaboration would ensure interoperability between locally adapted and global frameworks.
One area in which regulations have already been developed for Carbon Credits is in the Risk Weights (RWs) that banks must use in their trading books. These are set out in the FRTB SA regulations. According to the Basel III framework, the SA RWs should be consistent with a stressed (97.5 percentile) Expected Shortfall (ES). To investigate this, we estimate the 99th percentile VAR for the return volatility of the EU Allowance (EUA) carbon certificates. In doing so, we closely follow the methodology of ISDA (2021), extending their sample by including post-June 2021 observations up to 1st January 2023. The approach involves estimating the daily return volatility of the EUA Futures using the Generalized Auto-Regressive Conditional Heteroskedasticity Model (GARCH) model.[24]
Financial Regulation and Capital Flows to EMDEs
Figure 3.2 Panel a) displays the price of EUA futures since 2013. Since the start of 2018, the price rose from below €10 per metric tonne of carbon to more than €90. Ampudia et al. (2022) mention that the major factors behind the increase since early 2018 are the introduction of increasingly stringent climate change policies in the EU and, at a global level, various changes in ETS market design. This includes (i) the announcement by the European Commission of the European Green Deal in late 2019, and (ii) the endorsement by the European Council of a new EU-wide emission reduction target in late 2020. In July 2021, the unveiling of the European Commission’s “Fit for 55” package of legislative proposals reinforced the role of the EU ETS as the EU’s major decarbonisation tool.
In late February and early March 2022, EUA prices declined by 30% in just a few days, as natural gas prices reached all-time highs in Europe (see ESMA (2022)). The market turmoil was the consequence of Russia’s invasion of Ukraine. Prices recovered by mid-March, as a result, the maximum historical annualised volatility of 2022 did not reach the value of 56.6% observed in 2017 (see Figure 3.2, Panel b)).
We employ the historical price data of the Intercontinental Exchange Endex EUA Monthly Electronic Energy Future Continuation from Refinitiv for the period 1-Jul-2013 to 1-Jan-2023.[25] Under the Standardised Approach to Market Risk, the liquidity horizon is 20 working days. Using the 2017 stressed annual volatility of 56.6%, the risk weight of the EUAs is approximately 37%, which is similar to what is obtained in ISDA (2021).[26] This is strikingly lower than the risk weight of 60% charged by FRTB (see Table 11 of BCBS (2019c)), which would imply a stressed volatility of 91.4% (see Figure 3.3).[27]
Financial Regulation and Capital Flows to EMDEs
It might be argued that the above analysis focussed overly on return volatility whereas we highlighted in Table 3.6 a much richer set of considerations that should, according to IOSCO, be allowed for in the development of a suitable regulatory framework. In our view, capital risk weights should be calibrated based on the marginal contribution that instruments make to portfolio risk (i.e., marginal Value at Risk or Expected Shortfall) and other considerations should be included in determining other aspects of regulation such as permissible operational approaches for standards and market structures.
Higher capital requirements for banks engaging in the carbon credits market make it costly for both banks and customers (who rely on banks). The importance of developing this market, both for AEs and EMDEs, in combatting climate change is so great that the misalignment of risk and required capital appears to be a serious error.
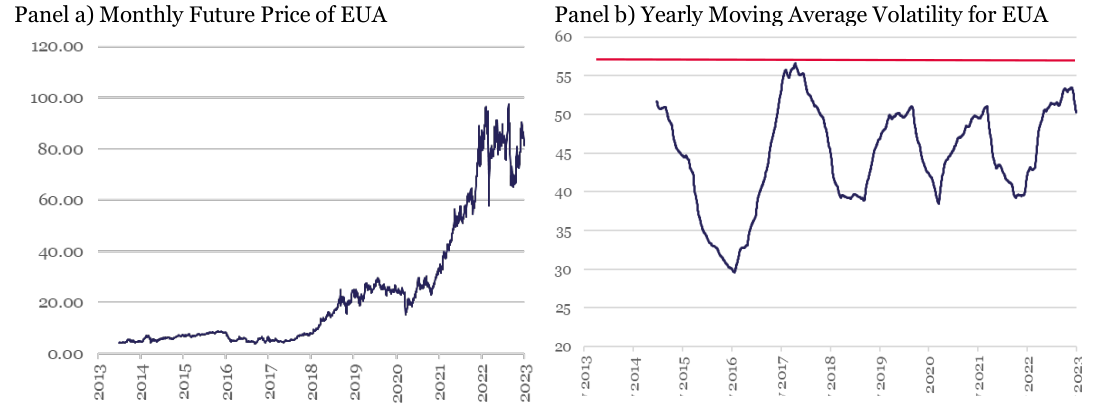
Note: The y-axis unit for a) is € per tCO[2]e and for b) is per cent, the red line represents the max value of 56.6%.
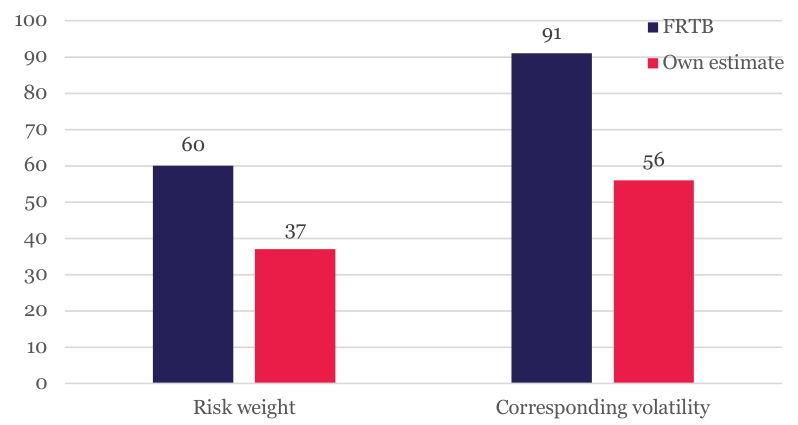
Note: Units on the vertical axis are per cent.
3.6 Restrictions on the use of local Credit Ratings Agencies (CRAs)
Use of CRAs ratings in legislation (statutes), regulations (rules), and supervisory policies (guidance) were common at the time of the GFC. It is widely believed that, in several ways, this amplified losses and forced deleveraging in the financial system.
In apparent agreement with this view, the Financial Stability Forum (FSF) asked the Joint Forum comprising BCBS, IOSCO, and IAIS to perform a stocktaking of the uses of external credit ratings by its member authorities in the banking, securities, and insurance sectors (see FSF (2008)). The FSF also suggested that authorities review whether their regulations and supervisory policies unintentionally give credit ratings an official seal of approval that discourages investors from performing their own due diligence. The Joint Forum (2009) report documented that CRA ratings were used in (a) determining capital requirements, (b) identifying or classifying assets, usually in the context of eligible investments or permissible asset concentrations, (c) providing a credible evaluation of the credit risk associated with assets purchased as part of a securitisation offering or a covered bond offering, (d) determining disclosure requirements and (e) determining prospectus eligibility.
Since the Joint Forum report, jurisdictions like the US have passed legislation to remove CRAs (known as SEC-regulated Nationally Recognised Statistical Rating Organisations (NRSROs)) from their banking regulation, while others, like Europe, have slightly reduced their dependency on CRAs (known in banking regulation as External Credit Assessment Institutions (ECAIs)) and simultaneously increased the degree to which CRAs themselves are regulated.
Many jurisdictions inherit their dependency on CRAs from their implementation of Basel regulation. Although central banks from large emerging countries are now members of the Basel Committee, they have
Financial Regulation and Capital Flows to EMDEs
not been able to influence the rules that entrench developed economies’ supervisory practices, which disadvantage investments in EMDE assets (loans and securities).
An example of regulations that disadvantage investments in EMDE securities is the restriction which is found in several regulatory frameworks concerning the use of national CRAs. This prescription typically applies even if the national CRA is a subsidiary of one of the major international agencies, also known as global CRAs. Note that the restriction in the case of banks is not a direct interdiction, but a common interpretation. Under the BCBS Standardised Approach for Credit Risk, rule CRE21.8 states: “Banks must use the chosen ECAIs and their ratings consistently for all types of exposure where they have been recognised by their supervisor as an eligible ECAI, for both risk-weighting and risk management purposes. Banks are not allowed to ‘cherry-pick’ the ratings provided by different ECAIs and to arbitrarily change the use of ECAIs.”
The fact that the same rating on a given security should be used for both risk-weighting and riskmanagement purposes is uncontroversial. This is the only part of CRE21.8 that is not problematic, however. Indeed, it is not enough to have an ECAI eligible and recognised by a bank’s supervisor. The bank must ‘choose’ in advance the ECAI it will use in its policies and apply this approach to all types of exposures. The Basel Committee’s intention in this is indicated in their comments about cherry-picking. Market competition and more importantly, market development, is frowned upon and considered cherry-picking. In practice, the effect of this rule is to freeze the corporate rating market in favour of the incumbents with the largest market shares (such as the two New-York based rating agencies Moody’s and Standard & Poor’s). Other ECAIs ratings can only be used if the incumbents are not present.
To illustrate, there are only four ECAIs registered by the Financial Sector Conduct Authority (FSCA) for South Africa: a) Moody’s Investors Service South Africa (Pty) Ltd., (b) Global Credit Rating Co. (Pty) Ltd., a regional rating agency which, since May 2022, has been an affiliate of Moody’s Investor Services, (c) S&P Global Ratings Europe Ltd. with its South Africa Branch and (d) Sovereign Africa Ratings (Pty) Ltd., which specialises in rating sovereign and sub-sovereigns. In effect, South African rating methodologies are now dependent on governance processes that are based in New York.
Outsourcing governance to a single regulator (the SEC, in the case of Moody’s and S&P) can lead to costly waves of downgrades and upgrades in certain sectors. An example is Southern European securitisations during the Euro crisis. This led the rating agencies to publish two ratings: an official rating where a sovereign ceiling was applied (with many senior tranches capped at single-A) and an unofficial rating where the sovereign ceiling was removed (with the identical tranches retaining their triple-A rating). Such waves of arbitrary downgrades (followed by waves of upgrades) could happen to other areas of the financial markets, such as EMDEs.
The problems surrounding EMDEs rating are compounded by another paragraph in the Basel regulation, CRE21.15, which states: “Where exposures are risk-weighted based on the rating of an equivalent exposure to that borrower, the general rule is that foreign currency ratings would be used for exposures in foreign currency. Domestic currency ratings, if separate, would only be used to risk-weight exposures denominated in the domestic currency.[28]”
The consequences of this paragraph have not been carefully considered. When a borrower has taken a foreign currency debt, the CRA’s domestic rating is impacted if it affects the credit standing of that borrower.[29] There should be no need to reject domestic currency ratings when the rating methodology explicitly takes care of this mismatch. In practice, the combination of CRE21.8 and CRE21.15 is doublecounting currency risk, which is particularly punitive for EMDE issuers that are more likely than AE issuers to raise capital in a foreign currency. It creates a bias against capital flows towards EMDEs.
The United Nations has recently highlighted a multitude of biases that the use of CRAs ratings creates for EMDEs (see Griffith-Jones and Kraemer (2021) and made thought-provoking policy recommendations to address the issues by (i) refocussing regulatory scrutiny, (ii) reducing dependency on credit ratings in
Financial Regulation and Capital Flows to EMDEs
regulation, (iii) reducing cliff effects in investment-grade and sub-investment grade ratings, (iv) improving transparency of CRA methodologies, (v) establishing new long-term ratings for long maturities, and (vi) creating CRAs with alternative ownership models such as non-profits. Some of those are well-intentioned but impractical, while others are important reforms that will take years to implement. Their report highlights that the status quo cannot remain and that EMDE regulators need to coordinate better and urgently tackle the direct and indirect regulatory impacts of CRAs.
This section has highlighted a number of ways in which rules on the use of national ratings hinder the development of banking and credit markets in EMDEs. We would support the viewpoint of the United Nations study mentioned above in arguing for a review and reconsideration of the approaches taken.
3.7 Effects on bank activity in EM securities markets from capital consolidation rules
This subsection examines how capital consolidation rules, overlapping accounting norms and banking regulation, can create roadblocks to the development of EMDE financial markets. Before an EMDE achieves a thriving local stock exchange with listed products accessible to international investors, its banking system typically goes through several stages of development. These stages may involve liberalising the domestic banking market and opening it to international institutions. Foreign banks may participate, either by opening branches or by acquiring or creating subsidiaries.
Fiechter et al. (2011) examine the advantages and disadvantages of different organisational structures for cross-border banking groups, both from the perspective of the financial groups themselves and from that of the host authorities. It concludes that the appropriate organisational structure for cross-border expansion varies depending on several factors. It is more straightforward to offer wholesale (i.e., large corporate) lending via a centralised branch model as this provides flexibility to manage liquidity and credit risks and is better suited for the needs of substantial clients, with lower funding costs. Subsidiaries have constraints on cross-border fund transfer, and thus retail lending, serving local retail clients and relying on local deposits, is more adapted to the decentralised subsidiary model.
Policymakers, concerned with financial stability, have a different perspective. Host countries with underdeveloped financial systems and weak economies may prefer global banks to enter by establishing fullservice branches providing credit services based on the strength of the parent. If host regulators wish to develop a strong domestic banking sector, they may prefer the subsidiary model, insulating the affiliate from the problems of its parents. For EMDEs, the branch model is most common in the first stage of banking development, while the subsidiary model becomes more prevalent in the second stage.
Most subsidiaries of foreign banks are majority owned and fully consolidated in their Group’s balance sheet. Capital requirements are calculated at two separate levels. For the host regulator, the capital requirement is calculated based on the subsidiary’s assets only (via the Basel risk weights), and the result of this capital requirement computation is compared to the level of capital resources of the subsidiary. If we assume that all assets are in local currency, the capital requirement must be less than the Tier 1 and Tier 2 capital resources of the subsidiary. For the home regulator, the capital requirement is calculated by treating the subsidiary’s assets as though they are consolidated on the Group’s balance sheet. The Basel Rules will require additional capital requirement to cover the currency mismatch between the consolidated assets and consolidated liabilities. This mismatch can lead to a consolidated contribution to the Group’s capital requirement for the subsidiary that exceeds the Group’s capital investment in its subsidiary. In this instance, there is no cap.
Other sources of regulatory friction can occur between the home and the host regulators. For example, cash reserves at the host’s central bank will be zero risk-weighted, though they will be subject to the foreign currency rating of the country.[30] To cover this risk, some multilateral insurers, such as Multilateral Investment Guarantee Agency (MIGA), propose political insurance to eliminate the RW applied by the home
30 The difference in Risk Weights (RWs) under the Credit Risk Standardised Approach (SA) can be large: Credit Risk Standardised Approach Risk weight table for sovereigns and central banks External rating AAA to AA- A+ to A- BBB+ to BBB- BB+ to B- Below B- Unrated Risk weight 0% 20% 50% 100% 150% 100%
Financial Regulation and Capital Flows to EMDEs
regulator to the host country’s central bank. While such an insurance solution may be helpful, there is an issue that concerns all countries, namely the regulatory treatment of sovereign exposures.
Historically, Basel I's treatment of sovereign risk was based on the distinction between OECD and non- OECD members, with the former assigned a 0% risk weight and the latter a 100% risk weight.[31] With Basel II and Basel III, this was reformed and under the Standardised Approach, the risk weight was linked to external rating agencies’ rating (see footnote [16]) or to export credit agencies’ risk scores with methodologies framed by the OECD.
The BCBS rule CRE20.8 allows national supervisors discretion in applying risk weight below this level for domestic currency exposures. For example, Mexico is rated BBB/BBB- by the global CRAs, and sovereign bonds or cash reserves at the central bank should be risk weighted 50%. However, the Mexican regulator has the discretion to apply a 0% risk weight on the Mexican sovereign exposures in Mexican pesos. The question is whether an Advanced Economy (AE) banking group with a Mexican subsidiary should be permitted to maintain a 0% risk weight on Mexican sovereign exposure in Mexican pesos or whether it should calculate group capital for all such assets with a 50% risk weight.
If discretion is exercised and the host Mexican regulator permits a 0% RW, would the home regulator of the foreign bank group accept this treatment? The BCBS rule CRE.20 states that “where this discretion is exercised, other national supervisors may also permit their banks to apply the same risk weight to domestic currency exposures to this sovereign (or central bank) funded in that currency.” In reality, in a letter to the BCBS, the Institute of International Finance (IIF (2018)) mentions that “there is a misconception that home authorities of internationally active banks typically recognise the prudential treatment of sovereign exposures applied by host authorities for subsidiaries; in reality, banks face different viewpoints from home authorities and host authorities.”
Following the contagion effect on bank capital of sovereign exposure and the experience with sovereign default in Greece in 2015, Northern European countries exerted strong pressure to revisit the entire approach. The BCBS created a high-level Task Force on Sovereign Exposures to review the regulatory treatment of sovereign exposures and to recommend potential policy options. In 2017, it published a discussion paper on the subject in which it addressed the issue of home-host arrangements: “The Basel framework applies to all internationally active banks on a fully consolidated basis or at every tier within a group. To mitigate potential concerns related to different prudential treatments under both the standardised and IRB approaches for sovereign exposures applied at the subsidiary and consolidated level of such banks, the Committee encourages home authorities of internationally-active banks to recognise, at the consolidated level, the prudential treatment applied by host authorities for subsidiaries, to the extent that the latter is compliant with the Basel framework.” (See BCBS (2017).)
Some EMDEs institutions responded clearly. For example, the Banking Association of South Africa (BASA) stated: “Home authorities must recognise the prudential treatment of sovereign exposures applied by host authorities. To allow home authorities to deviate from host authorities would lead to an unlevelled playing field between internationally active and domestic banks as well as result in confusion in the market as to the level of risk amongst international and domestic banks operating in a specific jurisdiction.” (See BASA (2018).) While the focus of this report is on capital flows from AE to EMDEs, the Basel regulation, once adopted, also affects capital flows from strong EMDEs to frontier economies. In that respect, BASA’s point of view has a unique relevance. As a strong emerging market economy, South Africa is particularly active in African frontier markets.
Following the 2018 consultation, the Basel Committee has not reached a consensus to make any changes to the regulatory treatment of sovereign exposures, and the current Basel III rules remain almost unchanged from those of Basel II. In this, it is failing to address a problem that impedes the flow of capital to EMDEs.[32]
Financial Regulation and Capital Flows to EMDEs
BCBS (2015) published a literature review related to the interplay of accounting and regulation and its impact on bank behaviour. Its focus is on those cases where accounting can increase financial stability risks, rather than the other way around. One may argue that, in the case of the regulatory treatment of sovereign exposures, the penalties on EMDEs overstate the financial stability risks.
There are two possibilities when looking at the subsidiary/parent capital requirement calculations:
(i) situations where the capital requirement at the subsidiary level is greater than the one calculated at the consolidated level, and (ii) situations where the capital requirement at the parent level is greater than the one calculated at the subsidiary level.
On (i), this does not constitute an impediment to the growth of the subsidiary. It might however cause qualitative concerns to the home regulator, such as the issue of double leverage (see Bank of England (2018)). This occurs when debt instruments at the Group level are used to finance capital instruments at the subsidiary level. On (ii), this is the situation that impedes the growth of capital going to an EMDE via a subsidiary.
The combination of the three aforementioned issues (currency mismatch, central bank exposure on the cash reserves, and the regulatory treatment of sovereign exposures) means that additional capital requirement on a consolidated basis is uncapped. This in turn can lead the Group to have a capital requirement that exceeds the committed amount that it has invested in the capital of its subsidiary (with or without minority interest). When this occurs, group risk management processes on capital limits either constrain further expansion or lead to a reduction in the size of the local balance sheet of the subsidiary if host/home currency pair volatility increases.
To unblock the growth of capital flows to EMDEs via banking subsidiaries, a simple regulatory rule could be devised, capping the amount of consolidated capital requirement by the home country of a subsidiary to the greater of a) the capital investment[33] of the Group in the subsidiary and b) to the capital requirement that applies to the subsidiary as calculated by the host country. Such a cap could be applied, regardless of whether the difference is due to the regulatory treatment of sovereign exposures or otherwise. This would be subject to bilateral agreements between regulatory institutions represented in the Basel Committee.[34]
3.8 Impacts on Correspondent Banking in EMDEs
Earlier sections have highlighted how regulation can affect capital flows to EMDEs. In interviews most of the regulators and AE banks dealing with EMDE investments, also highlighted an issue that may exceed, in the magnitude of its economic effects, all other regulatory issues as far as banks are concerned. That is, there will be little capital flows to EMDEs if there is no stable correspondent banking network in EMDEs.
This issue has been a concern for some time (see IMF (2017a)). In 2015, several international banks ended their Correspondent Banking Relationships (CBRs) with Belizean banks, citing concerns about money laundering. Correspondent banks terminated over two-thirds of CBR accounts of banks in less than a year, from mid-2015 to early 2016. Of the ten banks licensed in Belize then, only one, a Canadian bank, had not lost any CBRs (see IMF (2017c)).
With this background, the Basel-based Committee on Payments and Market Infrastructures (CPMI) published a report on the issue in 2016. They were concerned by the fact that AE banks had started to reduce the number of CBRs (the so-called ‘de-risking’ phenomenon), reducing cross-border payment services to their customers, when such cross-border payments are supporting international trade and financial inclusion.
The reasons for the reduction in CBRs are complex, with many banks mentioning the rising costs and uncertainty about how far customer due diligence should go in order to ensure regulatory compliance (i.e., to what extent banks need to ‘Know Their Customers’ Customers’ – the so-called KYCC).
Financial Regulation and Capital Flows to EMDEs
CPMI (2016) invited IOSCO and other global rule setters, to consider setting standards for correspondent banks on five topics:
(i) the use of “know your customer” (KYC) utilities,
(ii) the use of the Legal Entity Identifier (LEI) in correspondent banking,
(iii) information-sharing initiatives,
(iv) payment messages,
(v) the use of the LEI as additional information in payment messages.
Belize was not unique in the Caribbean. Caribbean economies are characterized by their extensive links to the global economy and they depend on the reliable functioning of CBRs. They are important for
a) international trade and commerce (including tourism which requires CBRs), b) remittances (especially Guyana, Haiti and Jamaica), c) financial account flows (especially Foreign Direct Investments (FDIs), and
d) offshore banks (Bahamas, Barbados, Belize) (see IMF (2017b)). The IMF surveyed the trend in the loss of CBRs in the Caribbean. It concluded that the loss of CBRs had limited macroeconomic impact, in part because banks either had multiple relationships or had been successful in replacing lost CBRs. However, the cost of services had increased substantially, some services had been cut back, and some sectors had experienced reduced access.
Multilateral Development Banks (MDBs), such as the Caribbean Development Bank (CDB) and the World Bank, aided affected countries. The CDB (2016) proposed strategic solutions to the ‘de-risking’ by global banks that led to the decline in CBRs in the Caribbean. In the case of Belize, the problem culminated in mid- July 2016, by which time, affected banks found some replacement CBRs and alternative ways of processing cross-border transactions (see IMF (2017c)). This resulted in Belize’s implementing a strengthened AML/CFT legal and regulatory framework (see IMF (2018)).
Rice et al. (2020) analysed the drivers of the global retreat of correspondent banks, with the numbers of CBRs dropping by about one-fifth globally, between 2011-2020. They found that jurisdictions with weaker governance and deficient controls to prevent illicit financing have lost more relationships, while trade and growth were supportive.
They identified three issues that warrant particular attention going forward: a) although the complete loss of access to the global financial system is rare, and typically linked to jurisdictions with weak governance or deficient controls on illicit financing, access is key for remittances that drive financial inclusion, b) greater concentration in correspondent banking could keep costs of remittances elevated and c) if banks are not providing critical payment services, users may resort to less regulated or unregulated channels, which may undermine international financial integrity. The reduction of CBRs is accompanied by the reduction in country-to-country payment corridors, and Rice et al recommend monitoring corridors more closely to help assess which jurisdictions risk losing access, impeding financial inclusion and growth.
The data provided by the Committee on Payments and Market Infrastructures (see CPMI (2021)) is particularly useful for seeing the drop in active corridors[35] and CBRs per country. It shows a clear steady decline. Three sub-regions of the World have lost more than 40% of direct counterparty countries in the years 2011-2020: Melanesia, Polynesia and the Caribbean.[36] The report also contains data on individual countries and shows that Frontier Market countries are particularly impacted.
Regulatory efforts have not been able to stop the downward trend in CBRs. In the case of the Caribbean, according to the Atlantic Council (2022), banks across the world increasingly deem this region too small to be profitable due to high compliance costs, while maintaining a perception that the region is a high-risk jurisdiction. The consequence is stagnation in economic growth and inclusion, as the sectors hardest hit by de-risking, tourism and remittances, are vital to the local economy. But ‘de-risking’ affects more than just the Caribbean economies. It can help to accelerate increased poverty, reduced purchasing power, the growing use of Chinese currencies, and the potential for regional instability, with direct implications for the United States.
Financial Regulation and Capital Flows to EMDEs
The geopolitical impact is such that the US Congress has put in place a strategy to combat financial ‘derisking’. According to Maxine Waters, the 2020 National Defense Authorization Act contains “provisions that, when fully implemented, will allow banks and their regulators to share information, augment the use of innovative technologies, and more accurately assess the risk of financial crimes, thus rebalancing and potentially broadening how financial services can be offered in areas like the Caribbean.”[37]
The example of how CBRs have evolved in the Caribbean shows how global rules, when designed primarily for the needs of AEs, can have a long-term damaging effect, not only on emerging markets but also on the long-term strategic interests of the AEs themselves.
It is extremely important that global rule setters are more inclusive of the voice of EMDEs when designing global rules. Such progress can be quantified by monitoring the number of new CBRs in EMDEs[38], and by policymakers mandating regulators to ensure that the overall number increases. This could be with a publicly available dashboard where EMDE regulators would input their numbers on new CBRs.[39]
Correspondent banking is crucial to much of the economic and financial activity in EMDEs. Several participants in the interviews conducted as part of this study identified this area as highly topical and all the regulatory frictions identified here as crucial for the continued development of financial markets in EMDEs.
3.9 Conclusion
This section highlights some important examples of ‘regulatory frictions’. These result from AEs designing rules that suit them and EMDEs adopting them without having much say in their design. If EMDE voices were considered more at the design stage, small changes in the wording or calibration of the rules could reduce regulatory frictions.
There is also a need to monitor the effects of global rules in a transparent way. For example, regulatory impact assessments should include a mandatory section on the consequences for EMDEs.
Table 3.7 lists the frictions and some of the steps that might help rectify them. Those steps should be seen as agenda-setting suggestions for rule setters. They need further assessment under the appropriate governance process before reaching recommendation and consultation stages.
The aggregate data on capital flows to EMDEs displayed in Section 2 underline the fact that EMDEs have much to gain from AE and, indeed, global financial stability. Reversals in capital flows that can disrupt economic activity in EMDEs are clearly associated with financial crises and, to some extent, with sharp changes in AE monetary policies. Thus, it is very much in the interest of EMDEs that AEs maintain stringent prudential standards in their financial systems.
What is not in the interest of EMDEs, however, are aspects of the rules that are incommensurate with the actual risk of EMDE securities, or which make it difficult for AE financial institutions to operate in and contribute to the development of EMDE markets.
Financial Regulation and Capital Flows to EMDEs
securities in • Review the capital requirements and the eligibility criteria for banks engaged FRTB in trading EMDE risk. Suggestion for the FSB:
• Monitor the participation of AE banks in EMDE markets, to assess the appropriateness of liquidity rules for EMDEs.
2. Impact on EM Suggestion for the European Commission: infrastructure • Review the capital charges for non-OECD infrastructure in Solvency II. bonds of insurer Suggestion for UK Treasury: and bank capital • Review the capital charges for non-OECD infrastructure in successor rules regulations.
3. Effect of MiFID Suggestion for the European Commission: II research rules • Monitor the impact of MiFID II unbundling rules on EMDE firm investment on Emerging research. Market (EM) Suggestion for UK Treasury: investment • Monitor the impact of MiFID II unbundling rules on EMDE firm investment research research.
4. Voluntary Carbon Suggestion for IOSCO: Offsets and • Conduct a quantitative impact study on opening foreign carbon offsets into Emission products that are restricted to domestic carbon offsets and assess different Allowances ways such opening could occur. Suggestion for BCBS:
• Review the capital requirements for banks engaging in carbon credits, by reflecting the risk of the underlying assets.
5. Restrictions on Suggestion for BCBS: the use of local • Remove or modify the second sentence of CRE21.8 to allow changes in the use Credit Ratings of ECAIs in accordance with a pre-specified policy. Agencies (CRAs) • Add a sentence to paragraph CRE21.15 to the effect that “Domestic currency ratings can be used if the rating methodology of the ECAI explicitly takes into account foreign currency debt into its assessment.”
6. Effects on bank Suggestion for IASB & BCBS: activity in EM • Devise a simple regulatory rule to unblock the growth of capital flows to securities EMDEs via banking subsidiaries by capping the amount of consolidated markets from capital requirement by the home country of a subsidiary to the greater of a) capital the capital investment of the Group in the subsidiary and b) the capital consolidation requirement that applies to the subsidiary as calculated by the host country. rules
7. Impacts on Suggestion for the FSB: Correspondent • Leverage the research done by CPMI and create a publicly available Banking in dashboard to monitor progress in establishing new CBRs. EMDE regulators EMDEs could input data to this.

4. Emerging Market Influence on Developed Market Regulation
4.1 Introduction
The institutional arrangement for determining financial regulation at an international level consists of a loose hierarchy of organisations headed by the G20 as the primary political body. Below this sits the Financial Stability Board (FSB), followed by three sector-specific Standard Setting Bodies (SSBs), the Basel Committee on Banking Supervision (BCBS), the International Organisation of Securities Commissions (IOSCO) and the International Association of Insurance Supervisors (IAIS). A fourth SSB that sits below the FSB is the Committee on Payments and Market Infrastructures (CPMI). Finally, there is a private sector SSB, the International Accounting Standards Board (IASB). Collectively, these organisations generate
Financial Regulation and Capital Flows to EMDEs
recommendations for regulatory arrangements that sovereign governments may choose to implement in national legislation or not.
The organisations are connected loosely in that, for example, the FSB’s charter states that its mandate is provided by the Heads of State and Government of the G20. Financial stability issues identified as of concern by the G20 commonly are picked up by the FSB, which prepares reports and analyses. Examples include FSB reports on the effects of regulation on SME and infrastructure lending (see FSB (2018)), the impetus for which came from G20 requests. Members of the FSB (which include BCBS, IOSCO, CPMI, IASB and IAIS) are required by the FSB charter to work to implement decisions made by the FSB.
At a high level, such institutional arrangements, founded on what academic researchers refer to as ‘soft law’, attempt to coordinate financial rules through consensual decision-making by sovereign governments around the world. Coordination of financial regulation is desirable because of spillovers between financial markets in different countries. Ortino (2019) argues that soft law arrangements are a response to the complexity of financial markets and decision-making by governments.
The influence of the hierarchy just described operates through suasion rather than via a direct exercise of authority[40]. In a sense, this approach represents a counterpart to the phenomenon observed in domestic banking markets in which central banks influence the commercial institutions they supervise to take steps through persuasion rather than through legal sanctions.
The degree to which the system results in the implementation of detailed rules and regulations determined at an international level varies substantially across the three financial sectors covered by the framework. To illustrate, proposals for banking rules established by BCBS have been substantially adopted across many jurisdictions, while insurance and securities firm rules at national levels remain much less coordinated internationally. In securities markets, the relevant SSB, IOSCO generates statements of principles but not detailed prescriptive rules.
4.2 Profiles of the Major Institutions
4.2.1 G20
The work of the G20 revolves around an annual cycle of meetings chaired successively by different national government ‘presidencies.’ The current Indian presidency is the second of a sequence of three EMDE-led G20 cycles. (India was preceded by Indonesia in 2022 and will be succeeded by Brazil in 2024.) The G20 has two tracks: the Sherpa track coordinated by representatives of national political leaders and the finance track coordinated by representatives of ministers of finance and central bank governors.
The G20 has several Working Groups. Financial Sector Issues constitute an important area of concern for the G20 but there is no formal working group for this topic. Instead, the FSB provides analysis and papers for discussions on the G20 financial sector agenda. The FSB is also accountable to the G20 in the evaluation of the effects of financial reforms and monitoring of their implementation. During the German presidency, the FSB developed a framework for the post-implementation evaluation of G20 financial regulatory reforms.
4.2.2 Fsb
As just described, on financial stability issues, the FSB supports G20 discussions and takes forward the latter’s requests. FSB members include (i) Senior policymakers from Ministries of Finance, central banks, supervisory and regulatory authorities., (ii) International institutions like BCBS, IOSCO, and the IAIS, and
(iii) Regional institutions like the European Central Bank and European Commission.
Financial Regulation and Capital Flows to EMDEs
The FSB is more political than the standard-setting institutions, but less so than the G20. Its primary tasks are to develop principles and standards at the request of the G20. It develops proposals on specific issues. An example is its proposals on Total Loss-Absorbing Capacity (TLAC) Global Systemically Important Banks (G-SIBs), which were developed in consultation with the BCBS. It coordinates the activities of the SSBs, tracks the vulnerability of different sectors (through Early Warning Exercises conducted jointly with the IMF) and it monitors the implementation and impact of regulatory reforms.
These FSB functions are associated with the different committees shown in Figure 4.1 which cover the assessment of vulnerabilities, supervisory and regulatory cooperation, and standards implementation. The FSB has six regional consultative groups.
The FSB has EMDE member institutions, most notably corresponding to those of G20 members. For example, Brazil has three members: the Ministry of Finance, the central bank and the securities and exchange commission office. Broadly speaking, according to participants in the interviews conducted as part of this study, EMDE members have relatively little influence. Some argued that the bulk of financial market activity worldwide occurs in AEs and, hence, this was natural and justified.
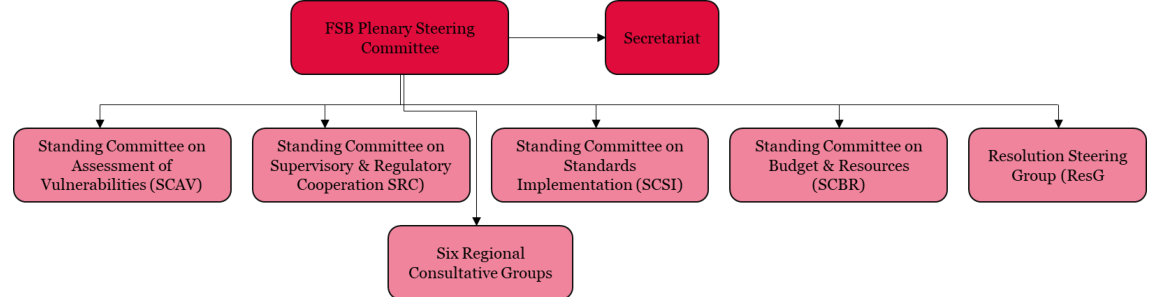
Note: Source is FSB website on 17-3-2023.
4.2.3 Bcbs
BCBS comprises 45 members from 28 jurisdictions, consisting of central banks and authorities with formal responsibility for the supervision of banking businesses.[41] Additionally, the Committee has eight observers[42], including central banks, supervisory groups, international organisations, and other bodies[43]. The Committee expanded its membership in 2009 and again in 2014.
Figure 4.2 shows the organisational structure of BCBS. While governance is provided by the Group of Governors and Heads of Supervision, the primary activities of the committee are performed by three groups who work on risks and vulnerabilities, supervisory cooperation, and policy & standards.
A fourth group of particular relevance to the current study is the Basel Consultative Group (BCG). This committee provides a voice for non-BCBS members that may adopt Basel rules and that are not represented in other BCBS committees.
According to BCBS, the BCG “provides a forum for deepening the Basel Committee's engagement with supervisors around the world on banking supervisory issues. It facilitates broad supervisory dialogue with
Financial Regulation and Capital Flows to EMDEs
non-member countries on new Committee initiatives early in the process by gathering senior representatives from various countries, international institutions and regional groups of banking supervisors that are not members of the Basel Committee.”
The BCG is the only Basel Committee that is chaired by an EMDE individual. Its two current chairs are from the South African Reserve Bank and the Group of International Finance Centre Supervisors (the latter representing offshore banking centres). BCG members comprise central banks, supervisory authorities from 39 countries[44], supervisory groups, international agencies, and other bodies[45].
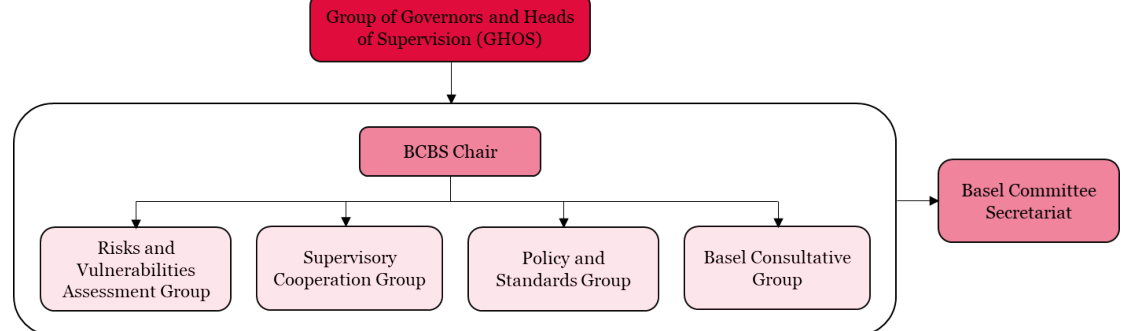
Note: Source is the BCBS website on 17-3-2023.
4.2.4 Iosco
The International Organization of Securities Commissions (IOSCO) is the global entity which brings together the world’s securities regulators and has been recognized as the international regulator for the securities sector. It develops, implements, and promotes adherence to internationally recognized standards for securities regulation.
As mentioned in Section 4.2, IOSCO works alongside G20 and FSB to resolve global regulatory issues. IOSCO is mainly divided into 5 committees as shown in Figure 4.3. Each committee is assigned tasks that are key for the overall working of the IOSCO. The President’s committee acts as an executive-level group that checks on the yearly development of IOSCO during the annual meeting. Currently, 76% of the total ordinary members[46] are from Emerging Markets (EMs) (see Figure 4.6).
The IOSCO Board is the crucial part of the organization structure and the governing and standard-setting body of IOSCO. The policy work is delegated to the following 8 committees working under the Board:
1. Issuer Accounting, Auditing and Disclosure 5. Investment Management
2. Regulation of Secondary Markets 6. Credit Rating Agencies
3. Regulation of Market Intermediaries 7. Commodities Derivatives Markets
4. Enforcement and the Exchange of Information and the 8. Retail Investors Multilateral Memorandum of Understanding Screening Group
Financial Regulation and Capital Flows to EMDEs
In public statements, IOSCO highlights the fact that it is the only international regulator that has a committee solely for EMs issues, namely the Growth and Emerging Markets Committee. This committee aims to develop securities market in EMDEs through information transfer and training programs and seeks to improve the efficiency of emerging securities and futures markets.
The Regional Committee and the Affiliate Members Consultative Committee (AMCC) are the focused groups which perform studies on problems associated with the members of the group. The four regional committees are as follows:
1. Africa/ Middle East Regional Committee (AMERC) 3. European Regional Committee (ERC)
2. Asia- Pacific Regional Committee (APRC) 4. Inter – American Regional Committee (IARC)

Note: Source is the IOSCO website on 17-3-2023.
4.2.5 Iais
The International Association of Insurance Supervisors (IAIS), established in 1994, is a voluntary membership organisation of insurance supervisors and regulators. It is the global standard-setting body responsible for developing and assisting in the implementation of principles, standards and guidance as well as supporting material for the supervision of the insurance sector. It has 154 members, representing 97% of the world’s insurance premiums. 74% of the membership is from EMDEs.
The IAIS mission is to promote effective and globally consistent supervision of the insurance industry in order to develop and maintain fair, safe and stable insurance markets for the benefit and protection of policyholders and to contribute to global financial stability. It delivers on its mission through a committee system made up of its members. The committee system is led by an Executive Committee, the 38 members of which come from around the world, representing advanced and developing insurance markets. The Executive Committee is supported by five committees established under its by-laws (see Figure 4.4).
Financial Regulation and Capital Flows to EMDEs
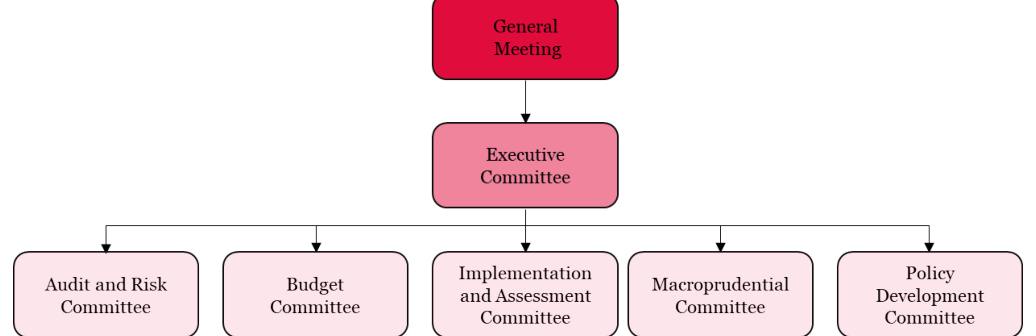
Note: In addition to the 5 primary committees, another 8 committees and groups take specific responsibilities. Source is the IAIS website on 17-3-2023.
4.2.6 Cpmi
The Committee on Payments and Market Infrastructures (CPMI) started as a group of experts on payment systems set up by the G10 countries in 1980. It is the global standard-setting body responsible for promoting the safety and efficiency of payment, clearing, settlement and related arrangements. Members are the senior officials of the central banks of the 28 member countries.
The members of CPMI meet about three times a year. The key decisions need to be endorsed by the Global Economy Meeting, which is the governing body of the CPMI. The two broad themes for the 2021-22 work programme are to (i) Shape the future of payments and (ii) Evaluate and address risks in Financial Market Infrastructures (FMI).
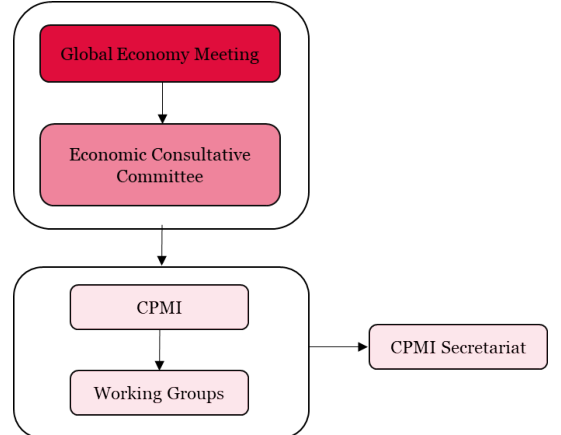
Note: Source is the CPMI website on 17-3-2023.
4.3 Evolution of the Major Institutions
The current hierarchy of financial regulatory decision-making may be seen as the consequence of several past financial crises. Both the Asian crisis in the 1990s and the GFC in 2007-9 underlined for regulators worldwide the magnitudes of spillovers and, hence, the importance of coordination. Claessens et al. (2008) explain that the post-Basel I financial crises of the 1990s triggered many changes to the design of the international financial system leading to Basel II. The GFC of 2007-9 precipitated major changes in the regulatory decision-making architecture.
The G-20 was adopted as a “premier forum” for meetings of heads of state and government only in November 2008, in the weeks following the collapse of Lehman Brothers and the ensuing wholesale market collapse (see Véron (2012)). The inclusion of large emerging countries into the “premier forum” of political leaders triggered the parallel expansion or rebalancing of most of the global financial authorities that play a role in financial regulation.
In April 2009, the Financial Stability Forum (FSF), which had been created in 1999 following the Asian Crisis, was transformed into the Financial Stability Board (FSB). The FSB’s membership was expanded from the FSF’s 11 countries (eight Western countries plus Japan, Hong Kong, and Singapore) to 24 countries, of which 10 are emerging economies in addition to Hong Kong, Singapore, and South Korea.
Similarly, in March 2009, the Basel Committee for Banking Supervision (BCBS) expanded from 13 member countries (all developed economies) to 27 (of which 10 are emerging economies, plus Hong Kong, Singapore, and South Korea). The Committee on the Global Financial System (CGFS), also in Basel, expanded at the same time from 13 to 22 countries including Brazil, China, Hong Kong, India, Mexico, Singapore, and South Korea.
Financial Regulation and Capital Flows to EMDEs
4.4 Current Memberships of the Institutions
The current membership breakdowns of the BCBS, IOSCO and IAIS are displayed in Figure 4.6.
The BCBS membership, in Panel a), is clearly heavily weighted towards AEs, in large part because of the over-representation of Euro-area countries.
Financial Regulation and Capital Flows to EMDEs
Institutions are more numerous than countries, of course, because, while the BCBS is primarily a group of central banks, in many countries other entities participate in banking regulation and supervision. Thus, the US has four institutional members of the BCBS representing the Federal Reserve Board (FRB), the Office of the Controller of the Currency (OCC), the Federal Deposit Insurance Corporation (FDIC) and the Federal Reserve Bank of New York (FRNY).
Panel b) of Figure 4.6 shows that the membership of IOCSO committees is much more weighted towards EMDEs than the BCBS. The main IOSCO board is close to an equal split between EMDE and AE members. The President’s Committee which reviews the activities of IOSCO at annual meetings is dominated by EMDE members. And IOSCO has a specific committee GEMs (mentioned above) aimed at increasing standards and efficiency in EMDE markets.
The membership of IAIS is also much broader and less concentrated on AE members than BCBS (see Panel c) of Figure 4.6). It has a total of 40 AE members versus 114 members from EMDEs.
The membership of the FSB, consistent with its coordinating role and links with the G20, is more heterogeneous with 20 AE members, 26 EMDE members and 13 members coming from SSBs and regional and multilateral entities (see Panel d) of Figure 4.6).
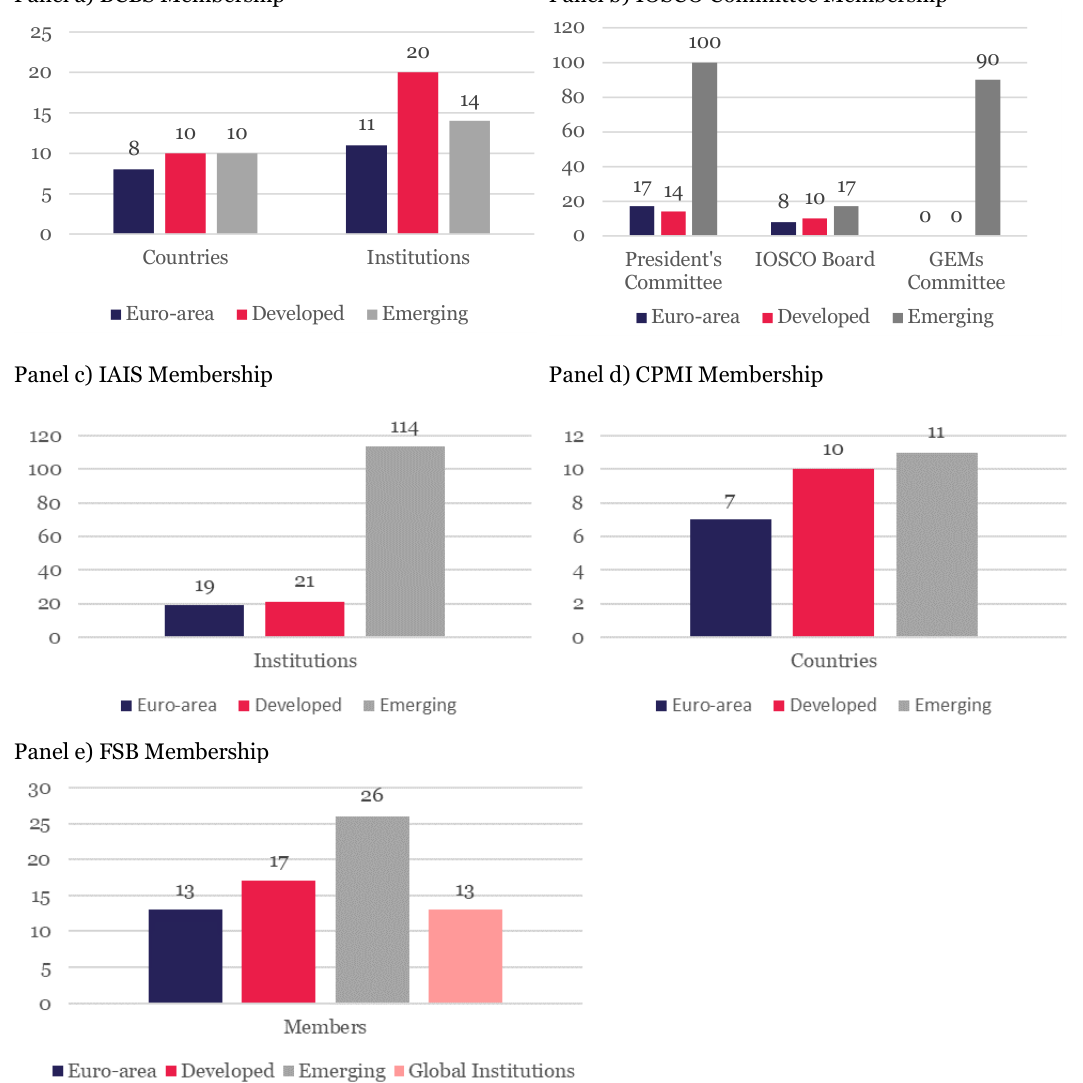
Note: Sources are BCBS, IOSCO, IAIS, CPMI and FSB websites on 17-3-2023. The IOSCO GEMs Committee denotes the Growth and Emerging Markets Committee. The thirteen FSB Global Institution members are BCBS, IOSCO, IAIS, IASB, IMF, WB, BIS, OECD, ECB, SSM, European Commission, CGFS and CPMI. The definition of Developed and Emerging countries used here is that of the IMF (see IMF (2022)).
4.5 EMDE Influence
The potential for EMDEs to influence the determination of financial regulations have undoubtedly increased over time. Claessens et al. (2008) argue that developing countries had little influence on the formulation of Basel II despite multiple instances when such stakeholders have raised concerns with proposed standards.
The BCBS employed an open consultation process for the Basel II accord (in contrast to the closed dialogue with the industry used in developing Basel I). Four consultative papers (CPs) were issued during the development of Basel II, each attracting around 200 responses. Very few financial firms in developing countries submitted comments. This is despite the fact that, according to Barr and Miller (2006), many EMDE institutions worried the Basel standards would be too complex for their supervisory agencies and banks to administer.
The consultation process that BCBS operated for Basel III has been analysed by Bengtsson (2023). The development of the Basel III standards was a lengthy and complex process stretching over five years from an initial call by FSB, to changes to Basel II, and then the finalization of Basel III by BCBS.
Table 4.1 shows the percentages of respondents from different categories that expressed concerns or support for different aspects of the proposed rules. Bengtsson reports that of 214 respondents to the Basel III consultation 185 responses (86.4%) were posted by AE respondents while only 29 (13.6%) respondents were from EMDEs. Bengtsson argues that, in finalising Basel III, the BCBS mainly accommodated the preferences of private sector stakeholders from the AE financial industry.
Financial Regulation and Capital Flows to EMDEs
Bengtsson (2023) also reports the fractions of responses that express concerns or support for specific components of the Basel III package. The components include capital adequacy requirements (CAP), the liquidity coverage ratio (LCR), the net stable funding ratio (NSFR), the leverage ratio (LR), and the role of credit rating agencies (CRA).
To assess the abilities to influence, Bengtsson (2023) analysed the adjustments made. He argues that changes adopted by BCBS were aimed at satisfying respondents from advanced economies, traditional BCBS member countries and the financial sector. All the areas in which major adjustments were made were more important to those respondents, relative to respondents from EMDCs, new and non-BCBS members, and from outside the financial sector.
Conversely, areas particularly highlighted by respondents from non-BCBS member countries and emerging markets were not adjusted by the BCBS. For instance, the latter groups of respondents expressed relatively high support for the proposed capital adequacy requirements. Bengtsson’s findings support the proposition that regulatory outcomes in banking standards are disproportionally influenced by a few advanced economies. The influence brought to bear by EMDEs remains quite limited.
Progress might be made by developing the role of the Basel Consultative Group. This sub-committee of the BCBS is designed to ensure the implementation of banking standards with ‘proportionality’, i.e., that the standards reflect jurisdictions’ circumstances and supervisory capacity (while not diluting the robustness of the standards). A common presumption is that any simpler proportionate approach should be more conservative to compensate for the lower risk sensitivity, and, thus, remain broadly aligned with international standards. The concept of ‘proportionality’ is rooted in the ‘Basel Core Principles for effective banking supervision’ (BCPs).[47] BCBS considers that it may be appropriate to tailor regulation for noninternationally active banks. This includes potentially applying the Basel Framework in its current form, or earlier or modified forms, for jurisdictions with simpler banking systems. For this purpose, the BCG produced high-level considerations on proportionality (see BCBS (2022)).[48]
Going beyond this role of considering proportionality, the BCG might be involved in assessing aspects of the regulations for their effects on EMDEs. This could generate insights on the effects of the rules on non-core markets in general.
| Stakeholder categories | Policy areas - | concern | support | ||||
|---|---|---|---|---|---|---|---|
| CAP | LCR | NSFR LR | CRA | CAP S LR | S | ||
| Advanced economy (AE) | 34.6% | 41.6% | 33.5% | 28.6% | 3.2% | 3.2% | 3.2% |
| Emerging market & developing | |||||||
| 20.7% | 48.3% | 17.2% | 10.3% | 0.0% | 10.3% | 0.0% | |
| countries | |||||||
| Non-financial sector (NFS) | 0.0% | 9.1% | 0.0% | 18.2% | 0.0% | 9.1% | 0.0% |
| Financial sector (FS) | 40.1% | 49.0% | 40.1% | 30.6% | 3.2% | 0.6% | 3.2% |
| Bank (B) | 45.6% | 44.7% | 43.7% | 36.9% | 0.0% | 0.0% | 4.9% |
| Non-bank financial institution (NBFI) | 22.2% | 48.1% | 27.8% | 16.7% | 9.3% | 1.9% | 0.0% |
| Total | 32.7% | 42.5% | 31.3% | 26.2% | 2.8% | 4.2% | 2.8% |
Note: The table reproduces as a subset of the entries from a table in Bengtsson (2023). CAP – Capital Adequacy Requirements, LCR – Liquidity Coverage Ratio, NSFR – Net stable Funding Ratio; LR – Leverage Ratio; CRA – Credit Rating Agencies; CAP S – Capital Adequacy Requirements (Support); LR S – Leverage Ratio (Support).
4.6 Strategies for EMDEs to influence developed country regulation
We believe that EMDEs should engage with existing regulatory policy institutions, pushing for changes in these institutions if necessary to enhance their influence. A key aspect of this is the creation of alliances, either through direct cooperation between major EMDE countries or through regional grouping for sets of small countries with common challenges.
When EMDE countries occupy the presidency of the G20, efforts should be made to identify issues on which views are shared with other comparable emerging economies. In some cases, countries leading the G20 have focussed on their own narrow interests and concentrated on issues or resource transfer instead of on structural questions including financial regulation.
Devoting time and resources to the study and development of regulatory policies is also necessary if EMDEs are to acquire influence within existing institutions. The current system for producing financial regulation is based on consensus and persuasion. Achieving this requires the careful documentation and presentation of evidence-based arguments.
The Basel Committee already has EMDE members, but those we interviewed suggested with few exceptions that these members play little role in the generation of new policy. The Basel Consultative Group apparently offers a forum for discussing EMDE views, but again it seems that this focuses more on issues of regulatory implementation and supervisory standards than on the analysis of policy initiatives.
Financial Regulation and Capital Flows to EMDEs
Multilateral institutions could play a role in assisting EMDEs in analysing AE regulations and supporting efforts to rectify problems. The World Bank and the IMF already, to some extent, perform such roles but regional development banks could work with groups of countries in their geographical areas.
On the Bretton Woods institutions, one interview participant suggested that the Financial Sector Assessment Program (FSAP) reports[49] produced by the IMF and the World Bank for EMDEs focus too much on compliance, rather than on whether such compliance is adapted to the country in question. Capacity development for EMDEs, funded by AE institutions, is mainly aimed at training to comply with global standards, not at challenging their content.
Regional MDBs have been active in a few areas of financial market development. One notable topic on which both EBRD and ADB have been extremely active, is the development of appropriate regional market practices (at the pre-regulation stage) for sovereign and corporate bond markets. These initiatives have implications for subsequent regional regulation.[50]
For regional MDBs to expand their activities of this type would require the creation of financial policy units in MDBs. For the moment, few have sought to build such capacity.
4.7 Conclusion on EM Influence
This section has summarised important aspects of the regulatory architecture created after the Asian crisis of the 1990s and then reformed and refined following the GFC. This architecture consists of a loose grouping of institutions, the G20, the FSB and several SSBs, engaged in regular contacts and analyses of financial stability priorities. From these activities have emerged prudential standards for internationally active banks and insurers worldwide and, more broadly, principles and standards that financial firms and markets and their supervisors should follow.
If EMDEs are to influence the direction or detail of regulation, they must engage with the institutions that participate in this process. Among the SSBs, IOSCO appears very open to EMDE voices but is not heavily engaged in generating prescriptive regulation. On the other hand, the BCBS appears to be a relatively closed club of AE central banks, for which influence from non-core markets including from EMDEs is peripheral. The situation might improve either if the role of the BCG were to expand or if G20 EMDE members of BCBS could coordinate better.
While governance aspects might evolve to cater more for the needs of EMDEs, it is important to develop a reporting methodology that can measure the effectiveness of such progress. The work started by Bengtsson on the political economy of Basel III should be generalised and transposed to other regulatory bodies. This could be part of the reporting by the FSB to the G20. Funding and resources (NGO model, academic research model, professional monitoring model, MDB-coordination model) would need to be discussed at G20 level. We believe MDBs are best placed to ensure continuity of monitoring over time.
Financial Regulation and Capital Flows to EMDEs
5. Conclusion
This report examines the effects of developed country regulation on capital flows to EMDEs. We provide background on the nature of those capital flows, demonstrating the varying importance over time of public and private markets.
Capital flows to China have followed very particular patterns and differ substantially from those to the wider set of EMDEs. When China is omitted, long-term negative trends in capital flows to ENDEs involving public market equity and debt are evident. Bank lending also trends down except for a sharp rise with the onset of the Covid 19 crisis.
Financial crises and sharp changes in monetary policy in Advanced Economies periodically disrupt the flow of capital to EMDEs. An implication of this is that sound regulation of financial sectors worldwide is in the interest of EMDEs. Hence, the weakening of overall levels of prudential regulation is certainly not in the interest of EMDEs.
Nevertheless, many steps taken by international regulators in recent years have involved changes in the relative burden of regulation either on particular asset classes of great importance to EMDEs (such as infrastructure finance) or directly on EMDE exposures (such as EMDE equity and again infrastructure).
Also, much of the direction of regulation post the GFC has been to penalise non-core markets where liquidity and information production are less developed. In this study, we identify a set of issues that we label ‘regulatory frictions’ that might be reconsidered if regulators and standard setters decide to take seriously the challenges faced by EMDEs.
The study also considers how EMDEs might better make the case for regulations that suit their economies and markets. The set of regulatory policy institutions that emerged following the GFC does include EMDE representation. This is most apparent for IOSCO but IAIS and even the BCBS have significant EMDE participation. According to the policymakers we interviewed, major policy developments and decisions concerning financial regulation almost always reflect the views of AE representatives, with major North American and European countries taking the lead on most issues. This is particularly true of banking regulation.
To improve the situation, EMDEs must operate through the institutions that constitute the regulatory architecture. The current G20 is the second of a sequence of three EMDE presidencies. G20 presidencies typically have some leeway to push certain agenda items, especially if these issues are seen as having wide relevance.
The G20 agenda on financial stability issues will always be led primarily by the major AEs, but an EMDE presidency might be able to raise the effect of AE regulation on the developing world if undesirable impacts were clearly identified and common cause was made with other EMDE G20 members.
The SSBs vary substantially in the degree to which they are open or not to EMDE views and priorities. BCBS appears the most influenced by core market perspectives. To improve matters, the role of the Basel Consultative Group (BCG) might be expanded to consider the wider impact of the Basel framework on EMDEs.
It would also seem advisable that EMDE BCBS members (i) devote more resources at a technical level to the analysis of issues and (ii) seek common cause with other EMDE participants in BCBS. Multilateral institutions including the World Bank, IMF and the regional development banks could assist in the process.
Individual AE countries, either participating in SSB discussions on policy formulation or implementing these rules in national legislation, may wish to consider performing EMDE impact analysis. Furthermore, development aid authorities within AEs might consider financing a project on technical analysis and evidence, assembling EMDE regulatory experts, with the remit of proposing amendments to Basel rules, so that the BCBS can have a concrete starting point with EMDE inputs for future discussion.
Financial Regulation and Capital Flows to EMDEs
With the exception of the discussion we provide of the VCC market, the analysis in this paper relates to the existing incumbent banks, insurers and funds in AE and EMDE markets. A growing wave of innovation is apparent in EMDEs as FinTechs exploit the fact that large fractions of EMDE populations have limited access to financial services.[51] FinTechs are not subject to many of the regulations currently applied to incumbent institutions, but global regulators are catching up. Like the VCC market, this may be the occasion for EMDEs to provide early input as new global regulations emerge.
Financial Regulation and Capital Flows to EMDEs
References
Africa Carbon Market Initiative (2022) “Harnessing carbon markets for Africa,” November, available at: https://www.seforall.org/system/files/2022-11/acmi_roadmap_report_2022.pdf
Ahmed, Shaghil, and Andrei Zlate (2014) “Capital flows to emerging market economies: A brave new world?,” Journal of International Money and Finance 48, 221-248, available at: https://www.federalreserve.gov/pubs/ifdp/2013/1081/ifdp1081.pdf
Ampudia, Miguel, Giovanna Bua, Daniel Kapp and Dilyara Salakhova, (2022), “The role of speculation during the recent increase in EU emissions allowance prices”, ECB Economic Bulletin, Issue 3/2022, available at: https://www.ecb.europa.eu/pub/economicbulletin/focus/2022/html/ecb.ebbox202203_06~ca1e9ea13e.en.html
Atlantic Council (2022) “Financial de-risking in the Caribbean: the US implications and what needs to be done,” Caribbean Initiative’s Financial Inclusion Task Force, available at: https://www.atlanticcouncil.org/wp-content/uploads/2022/02/Financial-De-Risking-in-the- Caribbean_US-Implications.pdf
Avdjiev, Stefan, Bryan Hardy and Şebnem Kalemli-Özcan and Luis Servén (2022) “Gross Capital Flows by Banks, Corporates, and Sovereigns,” Journal of the European Economic Association, 20(5), 2098-2135, available at: http://www.nber.org/papers/w23116
Banking Association South Africa (2018) “Re Discussion paper: Regulatory Treatment of Sovereign Exposures,” Letter to the BCBS, March, available at: https://www.banking.org.za/wp-content/uploads/2019/04/BASA-Response-on-Soverign-Exposures-9- March18.pdf
Bank of England (2018) “Groups policy and double leverage”, Policy Statement PS9/18, April, available at: https://www.bankofengland.co.uk/-/media/boe/files/prudential-regulation/policystatement/2018/ps918.pdf
Barr, Michael S., and Geoffrey P. Miller (2006) “Global administrative law: the view from Basel,” European Journal of International Law, 17( 1), 15-46, available at: https://academic.oup.com/ejil/article-pdf/17/1/15/1144256/chi167.pdf
Basel Committee on Banking Supervision (2015) “The interplay of accounting and regulation and its impact on bank behaviour: Literature review,” Working Paper 28, January, available at: https://www.bis.org/bcbs/publ/wp28.pdf
Basel Committee on Banking Supervision (2017) “The treatment of sovereign exposures,” Discussion paper, December, available at: https://www.bis.org/bcbs/publ/d425.pdf
Basel Committee on Banking Supervision (2019a) “Definition of capital in Basel III - Executive Summary,” FSI Executive Summaries, June, available at: https://www.bis.org/fsi/fsisummaries/defcap_b3.htm
Basel Committee on Banking Supervision (2019b) “Explanatory note on the minimum capital requirements for market risk,” January, available at: https://www.bis.org/bcbs/publ/d457_note.pdf
Basel Committee on Banking Supervision (2019c) “Minimum capital requirements for market risk,” January, available at: https://www.bis.org/bcbs/publ/d457.pdf
Basel Committee on Banking Supervision (2022) “High-level considerations on proportionality,” July, available at: https://www.bis.org/bcbs/publ/d534.pdf
Bengtsson, Elias (2023) “Who influences global banking standards? A quantitative analysis of Basel III,” Working paper, April, available at: https://papers.ssrn.com/sol3/papers.cfm?abstract_id=4431626
Financial Regulation and Capital Flows to EMDEs
Caribbean Development Bank (2016) “Strategic Solutions to ‘de-risking’ and the decline of correspondent banking relationships in the Caribbean,” available at: https://www.caribank.org/sites/default/files/publication-resources/DiscussionPaper_Solutions_De- RiskingCBRs-5.16print.pdf
Cerutti, Eugenio, Catherine Koch and Swapan-Kumar Pradhan (2018) “The growing footprint of EME banks in the international banking system,” BIS Quarterly Review, December, available at: https://www.bis.org/publ/qtrpdf/r_qt1812e.pdf
Claessens, Stijn, Geoffrey RD Underhill, and Xiaoke Zhang (2008) “The political economy of Basle II: The costs for poor countries,” World Economy, 31( 3), 313-344, available at: https://www.academia.edu/download/51752933/The_Political_Economy_of_Basle_II_The_Co20170211- 18026-166y0ie.pdf
Climate Solutions and Simmons & Simmons (2023) “An introduction to carbon markets,” February, available at: https://climatesolutions.global/carbon-markets-1
Committee on the Global Financial System (2021) “Changing patterns of capital flows,” CGFS Paper No 66, May, available at: https://www.bis.org/publ/cgfs66.pdf
Committee on Payments and Market Infrastructures (2016), “Correspondent banking,” July, available at: https://www.bis.org/cpmi/publ/d147.pdf
Committee on Payments and Market Infrastructures (2021), “CPMI correspondent banking chartpack”, available at: https://www.bis.org/cpmi/paysysinfo/corr_bank_data/chartpack_2112.pdf
De Crescenzio, Annamaria, and Etienne Lepers (2021) “Extreme capital flow episodes from the Global Financial Crisis to COVID-19: An exploration with monthly data," OECD Working Papers on International Investment, May, available at: https://doi.org/10.1787/18151957
European Banking Authority (2022) “Final draft Regulatory Technical Standards,” February, EBA/RTS/2022/01, available at: https://www.eba.europa.eu/sites/default/documents/files/document_library/Publications/Draft%20Techn ical%20Standards/2022/EBA-RTS-2022- 01RTS%20on%20emerging%20markets%20and%20advanced%20economies/1026500/Final%20draft%20 RTS%20on%20emerging%20markets%20and%20advanced%20economies%20for%20equity%20risk.pdf.
European Commission, Directorate-General for Financial Stability, Financial Services and Capital Markets Union (2020) “ The impact of MiFID II rules on SME and fixed income investment research,” available at: https://op.europa.eu/en/publication-detail/-/publication/39810a8e-0c35-11eb-bc07- 01aa75ed71a1/language-en/format-PDF/source-165575916
European Securities and Markets Authority (2022) “Final Report - Emission allowances and associated derivatives,” March, available at: https://www.esma.europa.eu/sites/default/files/library/esma70-445- 38_final_report_on_emission_allowances_and_associated_derivatives.pdf
Feyen, Erik, Norbert Fiess, Ata Can Bertay, and Igor Zuccardi Huertas (2020) “Cross-Border Banking in EMDEs Trends, Scale, and Policy Implications,” World Bank Group, Finance, Competitiveness and Innovation Global Practice, September, available at: https://openknowledge.worldbank.org/bitstream/handle/10986/34479/Cross-Border-Banking-in-EMDEs- Trends-Scale-and-Policy-Implications.pdf
Fiechter, Jonathan, İnci Ötker-Robe, Anna Ilyina, Michael Hsu, André Santos, and Jay Surti (2011) “Subsidiaries or Branches: Does One Size Fit All?,” IMF Staff Discussion Note, SDN/11/04, March, available at: https://www.imf.org/external/pubs/ft/sdn/2011/sdn1104.pdf
Financial Regulation and Capital Flows to EMDEs
Financial Stability Board (2018) “Evaluation of the effects of financial regulatory reforms on infrastructure finance,” November, available at: https://www.fsb.org/wp-content/uploads/P201118-1.pdf
Financial Stability Board (2022) “US dollar funding and emerging market economy vulnerabilities,” April, available at: https://www.fsb.org/wp-content/uploads/P260422.pdf
Financial Stability Forum (2008) “Report of the Financial Stability Forum on Enhancing Market and Institutional Resilience,” report to the G7, April, available at: https://www.fsb.org/wp-content/uploads/r_0804.pdf?page_moved=1
Griffith-Jones, Stephany and Moritz Kraemer (2021) “Credit rating agencies and developing economies,” Department of Economic and Social Affairs, United Nations, DESA Working Paper No. 175, December, available at: https://www.un.org/en/file/147841/download?token=bejCgRC4
Harrison, Ann E., Inessa Love, and Margaret S. McMillan (2004) “Global capital flows and financing constraints,” Journal of development Economics, 75 (1), 269-301, available at: https://www.nber.org/system/files/working_papers/w8887/w8887.pdf
Innes, Cleo Rose, and Jacqueline Andrieu (2022) “Banking on FinTech in Emerging Markets,” EM Compass, January, Note 109, available at: https://openknowledge.worldbank.org/server/api/core/bitstreams/a8eb76cd-0629-522d-872d- 6f467816190c/content
Institute of International Finance (2018) “Re: BCBS Discussion Paper on The Regulatory Treatment of Sovereign Exposures,” Letter to the BCBS, March, available at: https://www.iif.com/portals/0/Files/private/32370132_iif_response_letter_basel_discussion_paper_on_s overeign_risk_march92018.pdf
International Monetary Fund (2017a) “Recent Trends in Correspondent Banking Relationships – Further Considerations”, April, available at: https://www.imf.org/en/Publications/Policy-Papers/Issues/2017/04/21/recent-trends-in-correspondentbanking-relationships-further-considerations
International Monetary Fund (2017b) “Loss of Correspondent Banking Relationships in the Caribbean: Trends, Impact, and Policy Options,” August, available at: https://www.imf.org/en/Publications/WP/Issues/2017/09/29/Loss-of-Correspondent-Banking- Relationships-in-the-Caribbean-Trends-Impact-and-Policy-Options-45220
International Monetary Fund (2017c) “Belize,” IMF Country Report No. 17/287, September, available at: https://www.imf.org/~/media/Files/Publications/CR/2017/cr17287.ashx
International Monetary Fund (2018) “Belize Selected Issues,” IMF Country Report No. 18/328, November, available at: https://www.imf.org/-/media/Files/Publications/CR/2018/cr18328-BelizeSelectedIssues.ashx
International Monetary Fund (2019) “Global Financial Stability Report,” April, available at: https://www.imf.org/-/media/Files/Publications/GFSR/2019/April/English/text.ashx
International Monetary Fund (2022) “Table A – Economy Groupings,” Fiscal Monitor, October, available at: https://www.imf.org/external/datamapper/FMEconGroup.xlsx
International Organization of Securities Commissions (IOSCO) (2022a), “IOSCO consults on the development of sound and well-functioning carbon markets”, Press Release, November, available at: https://www.iosco.org/news/pdf/IOSCONEWS668.pdf
International Organization of Securities Commissions (IOSCO) (2022a), “Voluntary Carbon Markets”, Discussion Paper, November, available at: https://www.iosco.org/library/pubdocs/pdf/IOSCOPD718.pdf
Financial Regulation and Capital Flows to EMDEs
International Swaps and Derivatives Association (2021) “Implications of the FRTB for Carbon Certificates,” 19 July, available at: https://www.isda.org/a/i6MgE/Implications-of-the-FRTB-for-Carbon-Certificates.pdf
International Swaps and Derivatives Association (2022) “Implications of the FRTB for Carbon Certificates: A Global Perspective,” 21 April, available at: https://www.isda.org/2022/04/21/implications-of-the-frtb-for-carbon-certificates-a-global-perspective/
Joint Forum (2009) “Stocktaking on the use of credit ratings,” June, available at: https://www.bis.org/publ/joint22.pdf
Kelhoffer, Kevin (2021) “Examining Infrastructure as an Asset Class,” September, available at: https://www.moodysanalytics.com/articles/2020/examining-infrastructure-as-an-asset-class
Koepke, Robin, and Simon Paetzold (2020) “Capital flow data—A guide for empirical analysis and real-time tracking,” International Journal of Finance & Economics, available at: https://onlinelibrary.wiley.com/doi/pdf/10.1002/ijfe.2687
Molina, Luis, and Francesca Viani (2019) “Capital flows to emerging economies: recent developments and drivers,” Bank of Spain Economic Bulletin 2/2019, May, available at: https://ssrn.com/abstract=3413637
OECD Monthly Capital Flow Dataset (2023), available at: https://www.oecd.org/daf/inv/investment-policy/OECD-monthly-capital-flow-dataset.xlsx
Ortino, Matteo (2019) "The governance of global banking in the face of complexity," Journal of International Economic Law, 22 (2), 177-204, available at: https://doi.org/10.1093/jiel/jgz010
Oxford Business Group (2021) “How will emerging markets benefit from new carbon trading rules,” available at: https://oxfordbusinessgroup.com/articles-interviews/how-will-emerging-markets-benefitfrom-new-carbon-trading-rules
Puy, Damien (2017) “Mutual funds flows and the geography of contagion,” Journal of International Money and Finance, 60, 73-93.
Rice, Tara, Goetz von Peter and Codruta Boar (2020), “On the global retreat of correspondent banks,” BIS Quarterly Review, March, available at: https://www.bis.org/publ/qtrpdf/r_qt2003g.htm
Risk Control (2020) “The impact of MiFID II on SME and fixed income investment research,” Report for Directorate-General for Financial Stability, Financial Services and Capital Markets Union (FISMA), European Commission, April, available at: https://data.europa.eu/doi/10.2874/986931
S&P Dow Jones Indices (2022) “Country Classification Methodology,” December, available at: https://www.spglobal.com/spdji/en/documents/index-policies/methodology-country-classification.pdf
Tong, Hui, and Shang-Jin Wei (2011) “The composition matters: capital inflows and liquidity crunch during a global economic crisis,” The Review of Financial Studies, 24(6), 2023-2052, available at: https://www.nber.org/system/files/working_papers/w15207/w15207.pdf
Véron, Nicolas (2012) “Financial reform after the crisis: An early assessment,” Peterson Institute for International Economics Working Paper 12(2), available at: https://www.econstor.eu/bitstream/10419/78014/1/75629133X.pdf
Viterbo, Annamaria (2019) “The European Union in the transnational financial regulatory arena: the case of the Basel Committee on Banking Supervision,” Journal of International Economic Law, 22(2), 205-228, available at: https://iris.unito.it/bitstream/2318/1713006/6/Viterbo%20%E2%80%93%20Basel%202019- 04-15%20DEF_clean-1.pdf
Financial Regulation and Capital Flows to EMDEs
Appendix 1: Anonymised Description of Interviewees
For the purpose of this study, a total of 65 participants were invited for the interviews. Due to the niche topics covered only 41 out of 65 participants agreed for an interview. Table A1.1 provides the anonymised description of the interviewees, 78% of the respondent were from Advanced Economies (AEs) while only 22% of the respondents were from Emerging Market and Developing Economies (EMDEs).
Table A1.1: List of Interviewees # Category Country Anonymised Description Classification 1 Banker AE Global head of regulatory relations of a global bank 2 Multilateral AE Deputy head of research of MDB 3 G20 Organisation AE Former chief economist of G20 initiative 4 G20 Organisation AE Economist at a G20 initiative 5 Insurer AE Economist at a large multinational insurance group 6 Reg relations AE Global head of regulatory relations of a global bank 7 Multilateral AE Deputy director of MDB 8 Stock exchanges AE Director of an advanced economy stock exchange 9 Stock exchanges EMDE Head of business development of an EMDE stock exchange 10 Regulator AE Head of international banking in a global regulatory institution 11 Regulator AE Deputy head of international banking in a global regulatory institution 12 Regulator AE Secretariat of a Standard Setting Body 13 Regulator AE Member of a Standard Setting Body 14 Industry AE Director of an international industry association association 15 Researcher AE Former central bank governor of AE 16 Researcher EMDE Former deputy central bank governor of EMDE 17 RegPol Specialist AE Former head of regulatory relations of a global bank 18 Rating agency AE Former chief credit officer of global credit rating agencies 19 Stock exchange EMDE Head of equities of an EMDE stock exchange 20 Multilateral EMDE Senior advisor for an international organisation for sustainability 21 Bank AE Former global head of investment research of a global bank 22 Bank AE Head of strategies team in EM of a global bank 23 Researcher AE Emeritus Professor of Finance 24 Bank AE Senior risk manager of a global bank 25 Investor AE Partner of major investment institution 26 Investor AE Managing director of fund 27 Multilateral AE Chief Risk Officer of a large multinational development institution 28 Regulator AE Senior regulator of an AE regulatory body 29 Trade Association EMDE General manager of an EMDE trade association 30 Bank EMDE Head of market risk of an EMDE bank 31 NGO AE Finance specialist of an international NGO for nature 32 Broker AE CEO of broker in VCC markets 33 Regulator EMDE Director of banking of an EMDE monetary authority 34 Multilateral AE Principal for capital markets of an MDB 35 Insurance AE Partner in asset manager involved in sustainable funds 36 Multilateral EMDE Head of development finance at an MDB 37 Regulator AE Executive director of AE central bank 38 Stock exchanges EMDE Head of sustainability of EMDE stock exchange 39 Regulator AE Deputy head of consultative division for international Standard Setting Body 40 Consultancy AE Former director for credit analysis of a global bank 41 Academic AE Professor of Economics
Financial Regulation and Capital Flows to EMDEs
Appendix 2: MVaR Calculations
This appendix provides documentation on the calculation of Value at Risk (VaR) and Marginal Value at Risk (MVaR) risk statistics under the assumption that losses on individual exposures are distributed as joint Gaussian random variables.
Consider a portfolio with dollar amounts a[5] invested in N assets where i= 1,2, . . , N. Losses on the ith asset are denoted x[5] while total portfolio losses are defined as:
< x≡ ∑5=> x[5] a[5] (A2.1)
Assume that the x[5] are joint normally distributed with means μ[5] and covariance matrix made up of individual covariances where the covariance between the ith and jth loss is denoted σ5,@. Define the mean and variance of the total portfolio losses as:
< μ≡ ∑5=> μ[5] a[5] (A2.2) < < ∑ σ" ≡ ∑5=> @=> σ5,@ a[5] a@ (A2.3)
The VaR for the total portfolio loss when returns are Gaussian is defined as:
(A2.4) Prob(x> VaRI) = α (OPQRST) 1 −ΦN V = α (A2.5) U W = μ+ σ ΦS>(1 −α) (A2.6) VaRI
A very similar expression holds when the portfolio return is Student’s t-distributed, namely:
Y = μ+ σ k(ν) tS>(1 −α) (A2.6) VaRI
Here, k(ν) = ](ν−2)/ν is a constant depending on the degrees of freedom of the Student’s t distribution.
The MVaR for the i_` exposure in the Gaussian case is defined as:
bOPQR < MVaRI,5 = @=> a@σ5,@ΦS>(1 −α) bPc = μ[5] + σS> ∑ (A2.7) = μ[5] + Correlation(x[5], x)]σ5,5 ΦS>(1 −α)
In the Student’s t case, the MVaR is very similar, the only difference being a scaling factor, k(ν)tS>(1 −α), on the volatility-correlation term. In the text, we focus on the ratio of MVaRs between EMDE and AE. When the mean return is negligible as is the case in standard Market Risk capital computations[52], the scaling factor will cancel in the ratio and so the conclusions we reach are robust to the assumption of either Gaussian or Student’s t portfolio returns.
Financial Regulation and Capital Flows to EMDEs
Risk Control 13-14 Dean Street London W1D 3RS +44(0)2033070730 www.riskcontrollimited.com
Notes
[1] ‘EMDE’ as used here corresponds to the countries classified as Emerging and Developing by the IMF. We refer to countries other than EMDE as Advanced Economies (AEs).
[2] CGFS (2021) notes that capital flows to Emerging Market Economies (EMEs) “have, on average, held up better than those to advanced economies (AEs) in the years since the GFC. Inflows to EMEs fluctuated around their pre-GFC levels, whereas flows to AEs remained far below their pre-GFC levels.”
[3] This study has been completed with the financial support of the UK's Foreign, Commonwealth and Development Office (FCDO) provided through the MOBILIST programme.
[4] Anonymised information on interviewees is contained in Appendix 1.
[5] On the Carbon Credit market, we talked to both public and private sector market participants.
[6] Research studies of inter-country Capital Flows employ a variety of data sources. These include (i) IMF’s Balance of Payment Statistics (BoPS), (ii) OECD Monthly Capital Flow Dataset (iii) Emerging Portfolio Fund Research’s (EPFR) Fund Flows Data, and (iv) Institute of International Finance’s (IIF) Portfolio Flows Trackers and Capital Flows Databases. The IMF’s BoPS (i.e., (i)) is a public dataset that summarizes transactions between residents and non- residents. It provides quarterly data with a typical lag of 2 quarters. In the current study, we employ the OECD Monthly Capital Flow Dataset (i.e., (ii)). This dataset, introduced in the study by De Crescenzio and Lepers (2021), extends the IMF’s dataset covering portfolio inflows from 18 EMEs (Koepke and Paetzold (2020)) to 47 countries. The capital flow coverage provided by OECD goes beyond portfolio flows to cover other investments (including bank flows) and FDI. The OECD collect cross-country capital flows data from public sources, at a monthly frequency and produces the dataset which is consistent with IMF’s BoPS principles. Sources (iii) and (iv) are private data sources, providing information on investment flows at monthly, weekly and even daily intervals. (ii) includes only mutual fund flows and, thus, represents a fraction (estimated at around a quarter by Puy (2019)) of the full balance of payments flows. (iii) proxies a wider set of balance of payment flows but lacks coverage of some countries.
[7] Under the Internal Models Approach (IMA), a bank (i) implements an internal risk model subject to certain standards, conditions of use and regulator-determined parameters, and (ii) uses the model to calculate capital for a trading book portfolio. On the other hand, the Standardised Approach (SA) consists of a set of risk weights contained in look-up tables that the bank applies to the values of its exposures and then sums subject to adjustment for concentration.
[8] The International implementation date of the BCBS standards was originally 1/1/22, however this international date was delayed to 1/1/23 at the start of the covid pandemic. Different jurisdictions have now announced implementation dates ranging from 2024 to 2025. The UK and EU have announced an implementation date of 1/1/25. The US has yet to publish its notice of proposed rulemaking ‘NPR’, although this is expected soon.
[9] The BCBS web-based resource can be found at https://www.bis.org/basel_framework/
[10] Depending on the regulatory context, the terminology changes to design developed economies.
[11] The Basel guidelines of MAR21.75 provides a list of Advanced Countries. An alternative classification into ACs and others may be found in S&P’s Dow Jones Developed Broad Market Index as of June 2022. S&P (2022) explains the criteria used by the agency. The criteria imply that countries with strong economic markets count as Advanced (Developed) Economies. The BCBS MAR21.75 provides no information about the criteria employed in the Basel classification and does not indicate whether the classification will be reviewed periodically. Advanced Economies according to Basel but excluded by S&P are Mexico, Croatia, Cyprus, Estonia, Greece, Latvia, Lithuania, Malta, Slovakia, and Slovenia. Advanced Economies included by S&P but excluded by Basel are Israel and South Korea. Countries in the Euro area are likely to be considered ‘Advanced’ by Basel even if they lack large and liquid markets and stable market institutions. Some EMDE countries like Israel and South Korea represented in major global indexes might make the case to be regarded as Advanced by Basel.
[12] Check Appendix 2 for the MVaR calculations.
[13] Student’s t is a particular fat-tailed distribution.
[14] One might argue that a market should not overwhelmingly rely on foreign liquidity or that markets with low domestic savings and liquidity should have higher capital requirements. But rules that substantially reduce the liquidity of markets are hard to justify. The markets in question are a small part of the overall market risk exposure of global banks so the economic capital impact of the liquidity risk is undoubtedly small.
[15] A bank participant in the interviews conducted for this study also highlighted that the SA vs. IMA issue has other negative qualitative impacts: a bank subsidiary located in a Frontier Market country is not allowed to use hedging products that would enter the FRTB category to avoid consuming capital under the SA rule. As a result, the growth of that bank subsidiary has almost stopped, leading to management prioritising home country clients’ cross-border trade rather than enabling lending growth for host country clients. Such impediments cannot be assessed quantitatively, as one cannot measure what does not exist.
[16] The table shows charges for different Credit Quality Steps (CQSs). These correspond to the regulator labels for standard rating grades. The mapping from CQSs to ratings may be summarised as follows Aaa 0, Aa 1, A 2, Baa 3, Ba 4, B 5 and higher.
[17] See Kelhoffer (2021). The default definition employed confirms to that of Basel.
[18] The term ‘standards’, in the VCM context, has a specific meaning and relates to entities that set and operate methodologies applicable to carbon credits. Examples of standards are the American Carbon Registry, the Climate Action Reserve, The Gold Standard, Verra (ex-Verified Carbon Standards).
[19] REDD+ is a framework created by the UNFCCC Conference of the Parties (COP) to guide activities in the forest sector that reduces emissions from deforestation and forest degradation, as well as the sustainable management of forests and the conservation and enhancement of forest carbon stocks in developing countries. (https://unfccc.int/topics/land- use/workstreams/redd/what-is-redd
[20] Several Australian companies have indicated that if the Australian government were to expressly support Australian companies purchasing sovereign carbon offsets issued by foreign carbon offsets pursuant to the Paris Agreement, then their appetite to (and confidence in) purchasing sovereign carbon offsets issued by emerging market governments would significantly increase.
[21] Depending on carbon price elasticity, there could be three ways of opening up the market of AEs: (i) with an econometrics approach: by setting a percentage of how much non-domestic VCCs are allowed in proportion to domestic VCCs; (ii) with a development approach: by prioritising the type of countries, for example, priority to frontier markets, or priority based on other UN-defined criteria; (iii) with a science-based approach: an NGO participant suggested to prioritise certain categories of VCCs such as “nature-based sequestration” VCCs rather than “avoided nature loss” VCCs (the latter suffering from major governance problems).
[22] If VCCs became directly substitutable with CCs in the compliance market, such ambitious targets would create price convergences between markets. Right now, VCCs from Africa are around $12 versus approaching $100 in the compliance markets. The convergence would certainly benefit Africa and lead to a price drop in the compliance markets.
[23] https://www.seforall.org/news/africa-carbon-markets-initiative-inaugurated-at-cop27
[24] The number of lags to be considered in GARCH was estimated using the Partial Auto-Correlation Factor (PACF) which provides the partial correlation of a stationary time series with its own lagged values. The estimated daily volatility was scaled to represent annualized volatility as per the total number of trading days in a year (252 days). This was then smoothened out using a moving average over a year to get the final plot shown in Figure 3.2, Panel b). Now, we could estimate the stressed period volatilities and from Figure 3.2, Panel b), it was in the year 2017 when we encountered the most stressed annualized volatility with the highest value of 56.6%.
[25] To calibrate FRTB capital charges, one might expect to rely more on spot than futures prices. For EUAs, however, the forwards market is more relevant. Hence, we follow ISDA (2021) in calibrating using forwards prices. Note that Risk Weights might be calibrated using one or other of the two major North American markets – the Western Climate Initiative (WCI) and the Regional Greenhouse Gas Initiative (RGGI). These are less volatile than the EU market during stressed market periods (see ISDA (2022). Using the EU ETS prices should be seen as conservative, therefore.
[26] The stressed volatility is used to compute the 99th percentile VaR measure (see BCBS (2019b)). Assuming a Gaussian distribution of returns, the 99th percentile is 2.33 standard deviations away from the mean volatility of risk factors in a bucket over the prescribed liquidity horizon LH (20 working days). By scaling the annualised (252 working days) volatility σ"#" = 56.6%, we have -. RW = 2.33 × σ"#" × ,"#" ≈37.1%
[27] A stressed volatility of 91.4% would require this market to experience price swings that are far greater than the historical experience, and over longer periods. While regulators calibrate conservatively the risk weight in the standardised approach, in this case, the question arises as to whether this level is too conservative and going against the regulators’ own objectives of greening finance.
[28] This does not apply when there is Preferred Creditor Treatment.
[29] A CRA that would not include FX risk in its credit assessment is unlikely to be an approved ECAI in the first place.
[31] Treatment of sovereign risk in the Basel capital framework (BIS Quarterly Review, December 2013)
[32] An EMDE stakeholder mentioned that EMDEs sovereign exposures are also affected negatively in the FRTB, and some rules are conflicting with each other, with inconsistent treatment between components of the risk weights. A redrafting taking into account EMDE concerns would be welcome.
[33] See BCBS (2019a) for the definition of capital.
[34] https://www.bis.org/bcbs/membership.htm
[35] An active corridor is defined as a country pair that processed at least one transaction.
[36] See Table 5 of CPMI (2021) for the other sub-regions.
[37] A participant in the interviews found it concerning that the damage of some AE-designed global regulations needs to reach the level where it causes ‘national security’ concerns before AE lawmakers take it seriously. A way to track and monitor systematically the impact of global regulations on EMDEs should be part of the annual agenda of the G20.
[38] Feyen et al. (2020) analysed cross-border banking in EMDEs, the trends, scale and policy implications, and the challenges for policymakers in both home and host jurisdictions. Currently, data on CBRs is survey based, and a dashboard would bring transparency on this important topic.
[39] The CPMI (2021) data is currently sourced from SWIFT and the National Bank of Belgium. As stated in the report, SWIFT statistics on financial flows do not represent complete market or industry statistics.
[40] Viterbo (2019) argues that “At intergovernmental level, the G20 largely succeeded in asserting political control over SSBs, becoming the primary agenda-setting body for international financial and economic policy and calling the Financial Stability Board (FSB) ‘to coordinate at international level the work of national financial authorities and international SSBs in order to develop and promote the implementation of effective regulatory, supervisory, and other financial sector policies’ (Article 1 of the FSB Charter). In certain sectors, the FSB itself is becoming a standard-setter. As a result, Heads of State or Government and finance ministers are now deeply involved in strengthening the global financial system alongside central banks and supervisory agencies. Also, international soft law has become the main tool of the G20 programme to improve global economic stability and coordinate national regulatory reforms.”
[41] 28 jurisdictions (number of members in each country, totalling 45): Argentina (1), Australia (2), Belgium (1), Brazil (1), Canada (2), China (2), European Union (2), France (2), Germany (2), Hong Kong (1), India (1), Indonesia (2), Italy (1), Japan (2), Korea (2), Luxembourg (1), Mexico (2), Netherlands (1), Russia (1), Saudi Arabia (1), Singapore (1), South Africa (1), Spain (1), Sweden (2), Switzerland (2), Türkiye (2), United Kingdom (2), United States (4).
[42] The observers currently include Chile (1), Malaysia (1), United Arab Emirates.
[43] The Supervisory groups, international agencies and other bodies currently include the Bank for International Settlements (BIS), the Basel Consultative Group (BCG), the European Banking Authority (EBA), the European Commission (EC), and the International Monetary Fund (IMF).
[44] Countries currently include: Argentina, Armenia, Austria, Azerbaijan, Canada, Chile, China, Colombia, Croatia, Czech Republic, Denmark, France, Georgia, Germany, Ghana, Hungary, Japan, Kazakhstan, Lebanon, Malaysia, Mauritius, Mexico, Netherlands, New Zealand, Nigeria, Norway, Peru, Philippines, Poland, Qatar, Russia, Saudi Arabia, Spain, Switzerland, Thailand, Tunisia, Ukraine, United Arab Emirates, United States.
[45] Supervisory groups, international agencies and other bodies currently include: the Arab Committee of Banking Supervisors, the Association of African Central Banks, the Association of Supervisors of Banks of the Americas, the Caribbean Group of Banking Supervisors, the Central Bank of West African States, the Executives' Meeting of East Asia Pacific Working Group on Banking Supervision (EMEAP), the Financial Stability Institute of the Bank for International Settlements, the Group of Banking Supervisors from Central and Eastern Europe, the Group of International Finance Centre Supervisors, the Gulf Cooperation Council Committee of Banking Supervisors, the International Monetary Fund, the Islamic Financial Services Board, and the World Bank.
[46] For further details on ordinary membership: https://www.iosco.org/about/?subsection=becoming_a_member.
[47] www.bis.org/basel_framework/standard/BCP.htm
[48] An example of proportionality is provided for emerging and developing economies, where might be the predominant source of market risk under Pillar 1. “In these cases, it could be advisable to establish a more risk-sensitive approach to FX risk, such as by applying only the FX component of the simplified standardised approach or taking advantage of data already produced by banks (eg for accounting statements). One example would be to use relevant balance sheet lines to calculate a measure of banks’ open FX position, and apply risk weights to that amount.” (see BCBS (2022)).
[49] https://www.imf.org/en/About/Factsheets/Sheets/2023/financial-sector-assessment-program-FSAP
[50] Corporate bond markets tend to be decentralised, with most transactions being Over-The-Counter (OTC), transacted through brokers. In such a market, bond dealers tend to be capitalised to absorb client orders and create liquidity. Unlike EMDE equity transactions, EMDE corporate bond transactions are infrequent, mainly for buy-and-hold investors, and each trade is often a significant proportion of the issuance. Pre-trade transparency concerns mainly the bid-ask prices and positioning (buy or sell), and post-trade transparency the executed price and volume. But because corporate bond prices take as their starting points sovereign bond prices, creating transparency in the sovereign bond market is a prerequisite for efficient price discovery in corporate bonds, especially for EMDEs. Lalanne and Turnbull (2021) describes efforts by the EBRD to build transparency in the term structure of North African countries as a first step in creating more efficient corporate bond markets in those countries. Another example is provided by the AsianBondsOnline platform. Developed and maintained by the Economic Research and Regional Cooperation Department of the Asian Development Bank (ADB (2019)), the platform is a one-stop clearinghouse of information on sovereign and corporate bonds, funded by Japan's Ministry of Finance, through the Investment Climate Facilitation Fund. The platform presents both regional and market-specific information in a structured format. Note that even with quality information on EMDE bond markets, AE transparency rules cannot simply be transposed to EMDEs. Lalanne and Turnbull (2021) argue that too much transparency can, in certain cases, impede the activities of dealers, reducing liquidity and efficiency.
[51] Innes and Andrieu (2022) state “Despite near-universal access to financial services in advanced economies, financial exclusion is stubbornly persistent in many emerging markets, leaving huge swaths of low-income populations unbanked or underbanked. FinTech companies, which apply innovative technologies to deliver such services in new ways, have begun to tap into the enormous unmet demand that this represents. These companies are starting to thrive in emerging markets, though regulatory issues, particularly weak consumer protection measures, remain to be resolved in many countries. If these can be overcome, and more progress toward universal access to digital infrastructure can be made, FinTechs will continue to scale and spread.”
[52] Estimates of financial return means are typically imprecise. Better out-of-sample estimates of Value-at-Risk are obtained by assuming that mean returns equal zero than by attempting to estimate them freely.