

The MiFID II rules on unbundling payments for research[1] and execution have brought major changes to the European market for investment research. This study combines statistical analysis, surveys, interviews and legal analysis to shed light on how MiFID II has affected the research market, particularly for Small and Medium Enterprise (SME) and corporate bond issuers. The study shows that MiFID II reduced research budgets and lowered equity research prices particularly for larger investment firms. Research coverage and volumes for European equities have trended down for several years. MiFID II coincided with an increase in this decline for European SMEs although some of the decline may reflect cyclical effects. Research quality has not been systematically affected by the introduction of MiFID II unbundling. An area in which MiFID II seems to have produced structural shifts in behaviour is Fixed Income (FI) where published research volumes are lower and some providers have moved towards a strategy-analyst approach and reduced their use of publishing researchers. Also, the Investor Relations (IR) activities of issuers have been affected by MiFID II as the traditional role of brokers in facilitating contacts has been impeded, particularly in the case of contacts with foreign investors. This study examines the current state of SME-related investment research across European Union (EU) countries and the effect on such research of MiFID II. An important question for future study is what policy measures could be taken to increase SME investment research levels and reduce the large imbalances across countries and regions.
Front matter
Author:
Risk Control Limited
EUROPEAN COMMISSION
Directorate-General for Financial Stability, Financial Services and Capital Markets Union European Commission B-1049 Brussels
EUROPEAN COMMISSION
Final report
Directorate-General for Financial Stability, Financial Services and Capital Markets Union (FISMA)
April 2020 EV-02-19-027-EN-N
LEGAL NOTICE
This document has been prepared for the European Commission however it reflects the views only of the authors, and the Commission cannot be held responsible for any use which may be made of the information contained therein.
The European Commission is not liable for any consequence stemming from the reuse of this publication.
Luxembourg: Publications Office of the European Union, 2020
ISBN 978-92-79-98887-5
doi:10.2874/986931
© European Union, 2020 Reuse is authorised provided the source is acknowledged. The reuse policy of European Commission documents is regulated by Decision 2011/833/EU (OJ L 330, 14.12.2011, p. 39).
Table of Contents
Executive Summary
This report on the impact of MiFID II on SME and Fixed Income Investment Research was prepared for the European Commission by Risk Control. MiFID II rules restrict benefits that asset managers may receive from parties other than their investment clients, such benefits being termed ‘inducements’.
The restrictions on inducements limit the ways in which asset managers may pay for research. To purchase research using client resources, managers must implement transparent processes involving Research Payment Accounts (RPAs). Otherwise, they are required to pay for external research out of their own resources. In either case, they must budget, monitor and evaluate research to ensure that they are not receiving research below market prices which might constitute an inducement.
The two approaches to paying for research permitted by MiFID II both involve the separation of payments for research and execution services. In many markets for investment research and specifically the US, these two payments are made by asset managers to brokers through a single bundled payment. In the case of equity this takes the form of bundled commission. In Fixed Income, Currencies and Commodities (FICC) markets (including corporate bond markets), brokers have traditionally provided research to asset manager clients for free and have financed research activities through the bid-ask spreads they offer when they make markets.
The MiFID II reforms just described substantially change the way that asset managers and brokers interact in buying and selling research. Either if they purchase research via RPAs or if they pay from their own P&L, asset managers are likely to be less willing to spend heavily on research. One may expect to observe this reduced willingness to pay in the form of changes to asset manager research budgets pre- and post-MiFID II and a reduction in research prices over the period of MiFID II implementation. Depending on the elasticity of research supply from brokers and Independent Research Providers (IRPs), one may then expect to observe changes in research volumes. Forms of research that benefitted from cross-subsidisation in the pre-MiFID II market may experience particularly marked reductions in volume after the new rules came into force. Ultimately, a reduction in research volume may affect the liquidity of markets and financing terms that issuers can obtain.
Some proponents of MiFID II-style unbundling argue, on the other hand, that combining execution and research may distort research markets by (i) encouraging excessive research production and (ii) creating incentives for researchers to generate biased views designed to elicit trading rather than to formulate objective recommendations accurately. Hence, reduced research volume following the introduction of MiFID II might have little negative effect on the market since only lowquality analysis would be squeezed out and, indeed, research quality might rise as research houses would focus on accurate forecasting rather than generating order flow.
This study aims to establish the facts about how budgets, prices, coverage, volume, and research quality were affected by MiFID II. The focus is broad in that the report aims to understand the research landscape across all EU 28 countries including highly developed, developed and less developed markets. The two major topics covered by the report are the impacts on Small and Medium Enterprise (SME) equity and corporate bond research; but since credit trading relies in part also on Large Cap equity research, all European corporate-focussed research is relevant for the study.
The large majority of corporate-focussed investment research is produced by brokers. The nature of this research involves large teams of specialists with detailed knowledge of individual companies. Creating such teams is hard to manage economically[2] unless there are internal research clients or other income flows that can pay for research. For these reasons, relatively few non-broker IRPs are engaged in corporate-focussed research. But the study also considers, to some extent, the non-broker part of the market.
Key conclusions of the study are as follows.
• Faced with implementing MiFID II rules in 2017, almost all large asset managers chose to pay for research from their own P&L rather than by using RPAs. Survey and interview evidence suggest that the choice was largely influenced by competitive pressures which made it hard for managers to impose new explicit research charges on their clients. Also important for larger firms was the complexity of calculating fund-level research charges when block trades are typically executed simultaneously for multiple funds via multiple trading platforms all with different research charges. Some medium-sized firms ran out of time to implement the prior-notice and transparent-reporting requirements of RPAs and, hence, were obliged to adopt P&L-based approaches.[3] Smaller asset managers that adopted RPAs typically have simpler fund structures which make the use of RPAs practically feasible. Moreover, these firms felt that absorbing research costs in P&L was not a viable option for them.
• The average asset manager budget for external equity research fell between 2017 and 2019 by around 20-30%. The decline was concentrated in the budgets of larger firms (with the most sizeable firms reducing their research budgets by 30-40%) and was partially offset by higher spending on credit research and, possibly, by an increase in internal research costs. SME equity research expenditures also declined but not by as much as expenditures on Large Cap equity research.
• A key concern for many policy-makers and market participants has been the effects of MiFID II rules on the coverage of companies and the volume of research. Some have argued that MiFID II impaired research coverage and volume for SME firms in particular. Many interviewees and survey respondents believe that MiFID II has had a negative impact on SME equity research. 71% of buy-side survey respondents reported that the effect of MiFID II on the availability of SME equity research was negative. While most of the interviewees view MiFID II as having a negative impact, quite a few, particularly from larger and more specialist firm, report that research volumes and coverage has not so far declined substantially.
• To investigate the impact of MiFID II statistically, coverage may be measured
(i) by the fraction of companies for which at least one research report is published in a given year or (ii) the average across companies of the number of research houses publishing at least one research report within a given year. The volume of research may be measured by the average number of research reports per firm per year. The study concludes that coverage and research volumes did fall below trend in 2018 in a number of European regions and countries. The results indicate statistically significant negative 2018 effects (over and above trend) for most firm sizes in Western, Southern and Eastern
Europe and for Non-SME companies in Northern Europe. For SMEs, there is some evidence that the decline was partly cyclical and reflected low trading activity in 2018. Allowing for cyclical effects (using the statistical technique of instrumental variables), declines in SME coverage and research volumes are less severe in 2018 but, for Mid and Large Cap companies, declines in coverage and volume occur in 2018 that are statistically significant and about 10% in magnitude.[4] The trend declines in investment research volumes apparent in the data
• presented in this study and the variation across countries are greater in magnitude than the ‘MiFID II effect’. One may hypothesise that the negative trends in investment research reflect the secular erosion in the profitability of brokerage activities. Multiple factors have contributed to this erosion including weakening primary market issuance, low trading volumes, the shrinking of margins due to technological change, and higher compliance costs and capital requirements reflecting regulatory changes. The statistics presented reveal the gulf that exists between levels of investment research in highly developed versus less developed markets. This underlines the difficulties of raising equity or bond finance in many national European markets and presents a major challenge to policy-makers seeking to promote Capital Markets Union (CMU).
• Research quality (as measured by the standard deviation of Earnings per Share (EPS) forecast errors) did not change in a systematic way after the introduction of MiFID II. This belies the optimistic view of some unbundling proponents who argue that MiFID II may increase the accuracy of earnings forecasts. As with coverage rates and research volumes, the variation across markets dwarfs the year to year changes including those from 2017 to 2018. The statistical evidence on research coverage contrasts sharply with survey responses indicating a widespread industry view that research quality has declined. (Of buyside respondents, 49%, 44% and 7% said investment research quality fell, was unchanged or rose since MiFID II. The buy-side respondents cited factors such as juniorization, reduced analyst numbers and fewer research providers that led to the reduction in the quality of SME equity research.) Interviews with specialists such as managers of SMEs and corporate bond funds pointed to more nuanced conclusions, in that in several cases such specialists disputed that any significant change had occurred.
• MiFID II has generated some structural changes in the research market. These include, particularly in credit markets, increased reliance by large brokers on strategy/sales analysts rather than publishing researchers. While partly a continuation of past trends, the tendency appears to have been further boosted by MiFID II as brokers have sought to place activities related to research beyond the scope of the new rules. A reflection of these developments appears in data on Fixed Income reports (made available by a leading data supplier) in which the number of reports falls by 28% between 2017 and 2019.
• The inducement restrictions introduced by MiFID II apply to other benefits that asset managers may obtain from brokers including the facilitation of contacts with issuers’ top management that brokers have traditionally offered in the form of organising road shows and conferences at which issuers and asset managers can meet. These contacts, referred to by issuers as Investor Relations (IR) and by asset managers as Corporate Access (CA), can have an important impact on the financing terms that smaller firms, Mid Caps and SMEs, receive in the market. Interview and survey participants suggested that, IR and
CA for smaller firms have been affected by MiFID II. The access that issuers have to asset managers via brokers has become more challenging particularly when issuers want to elicit interest in foreign financial centres.
• Lastly, the report provides industry perspectives, as reported by survey participants, on how MiFID II has affected the liquidity of equity and corporate bond securities and on the costs of financing faced by issuers. 60% of issuers surveyed believe SME equity funding costs have risen and liquidity has fallen. It is noticeable, however, that individual issuers identify bigger implications of MiFID II for issuers in general than they perceive applying to their own firms (only 25% say their firm’s access to equity or bond finance has worsened between 2017 and 2019).
1. Introduction
1.1 Background and methodology
MiFID II has transformed the European market for investment research. Asset managers, brokers and Independent Research Providers (IRPs) have implemented new systems to meet the new requirements. Many institutions have changed the ways in which they market, budget, negotiate, contract and pay for research. The significance of the development is reflected in the large number of surveys on the impact of the MiFID II research rules organised by different industry bodies. There have been at least 12 public surveys within the last two years[5] together with a number of private, unpublished surveys.
This study aims to shed light on the impact the MiFID II restrictions on inducements on investment research and securities issuers. The specific focus is on investment research pertaining to Small and Medium Enterprise (SME) equities and Fixed Income securities, in particular corporate bonds. Since investors in corporate bonds typically consult Equity research studies as well as Credit research, Mid and Large Cap Equity research is also, to an extent, relevant for our study. Non-research interactions between SMEs and investors such as Investor Relations (IR) activities are also examined.
Since SMEs are so much the focus of this study, the precise definition employed is important. SMEs are here interpreted as companies with equity market capitalisation less than EUR 1 billion. Such companies represent a subset of what are commonly regarded by market participants as “Small Caps”. In the US, Small Caps are often identified as firms with market capitalisation less than USD 2 billion.[6] We investigate research for sub-categories of SMEs for which we use the nomenclature: Small Cap (EUR 200-1000 million), Micro Cap (EUR 50-200 million) and Nano Cap (less than EUR 50 million).
The particular attention paid to SME equities and corporate bonds in this study reflects concerns about the possible impact of MiFID II on these securities. On European equity research, some argue that, to support their execution business, large brokers aimed at “water-front” coverage pre-MiFID II, i.e., they provided comprehensive analysis of the market including research coverage of unprofitable parts of the market. If MiFID II reduces such cross-subsidisation, one might expect that SME equity research would suffer and anecdotal accounts frequently suggest that this has indeed occurred.
On European corporate bonds, it is widely acknowledged that declining profitability of Fixed Income brokerage has contributed to reduced liquidity. Risk Control (2017) documents reduced liquidity in the European corporate bond market and analyses the decline in dealer profitability that underlies it. The Capital Market Union (CMU) Expert Group on European Corporate Bond Markets argued, in its 2017 report, that MiFID II research rules might reduce the availability of corporate bond research especially as it relates to small issuers, further reducing liquidity.[7] 6 See, https://www.investopedia.com/terms/s/small-cap.asp, for example.
To investigate the effects of MiFID II on European investment research, this study employs an interdisciplinary methodology, combining statistical analysis with surveys of sell-side brokers, buy-side asset managers, IRPs and issuers, in-depth interviews with market participants and legal analysis. On the last of these, the leading law firm Clifford Chance has participated in the study by implementing a survey of MiFID II implementation in different national jurisdictions (see Annex 1) and providing insights on legal aspects of the topics discussed.
The questionnaire-based surveys of issuers, buy-side, sell-side and IRPs employed in this study are detailed and relatively quantitative. The number of questions ranges from 67 for buy-side asset manager survey to 40 for the IRP survey. Typically, each survey question has multiple parts with responses including quantitative and quantitative information. The numbers of respondents for these detailed surveys was 55 buy-side firms (almost all asset managers), 41 brokers, 55 issuers and 14 IRPs. Asset manager and broker respondents included major global firms, medium-sized institutions and a number of small firms (particularly for less developed markets).
Finally, we conducted in-depth interviews with 72 market institutions. These participants included some of the largest global firms but also a range of medium and small companies. Among issuers, a relatively large number of participants were Medium or Small caps but we also talked to some large firms that are active issuers of corporate bonds.
The breakdown of institutions that were interviewed by region was: Western Europe 26, Northern Europe 16, Southern Europe 1, Eastern Europe 3, European non-EU 8, Non-EU 13, Non-Region Specific 4. The breakdown by type of institution was Sell Side 16, Buy Side 27, IRPs 6, Issuers 10, Associations 11, Legal firms 1 and Others 1. Here, interviews with associations consisted of group interviews of market participants. Almost all interviews exceeded an hour in length. On a few occasions, a follow up call occurred but these duplicates are not included in the above breakdowns.
1.2 Findings of the study
1.2.1 Introduction to key findings
This subsection presents findings of the study in a concise form. MiFID II reduced the bargaining power of research suppliers as unbundling of research and execution increased the transparency of research costs for ultimate investors or induced asset managers to pay for research out of their own resources. Different types of producers and consumers of investment research were affected to varying degrees.
Budgets fell (particularly for larger asset managers) and, hence, the price of research overall dropped. Key questions are (i) whether the price declines provoked a significant fall in the quantity and quality of research produced, and (ii) how volume and quality changes fed through into worse outcomes for equity and corporate bond issuers? Below, the study’s findings on this sequence of effects are highlighted.
1.2.2 Cross-sectional variation in research coverage and volume
Very marked differences in the degree of research activity across countries and regions emerge from the market landscape section of the study. Germany, France and the UK
in November 2016 and the Communication on the Mid-term review of the CMU Action Plan, published in June 2017.
have high numbers of reports per company for most company sizes. France has relatively high numbers for Nano Cap and Small Caps. Belgium has a large number of reports per company for Nano Caps but not for other size categories relative to other leading countries.
The variation across regions for smaller firms is particularly striking. Reports per company for Southern and Eastern European Nano Cap companies averaged 0.5 and 0.2 reports per company compared to 2.0 for Northern and 3.2 for Western Europe, for example.
1.2.3 Payment choices made by MiFID II in-scope asset managers
In describing the legal landscape for MiFID II, it is interesting to examine the choices that firms made in how to pay for research when they implemented MiFID II. The MiFID II rules permit asset managers to pay for research either from their own resources (i.e., from their P&L) or using client money if they establish Research Payment Accounts (RPAs) (described in detail in Section 3). Why did only a small fraction of the market (mostly small asset managers and some hedge funds) adopt RPAs?
Prior to MiFID II, many large firms had already implemented Commission Sharing Agreements (CSAs) which represent a partially unbundled way of paying for research using client resources, less transparent but otherwise related to RPAs. So, switching from CSAs to more transparent RPAs might not appear to represent a major step. In fact, RPAs have become a small part of the research market, adopted by small longonly funds and some hedge funds.
First, large firms appear to have avoided RPAs because of the highly competitive market environment in which the new rules were introduced. Major, long-only buy-side firms felt unable to introduce highly transparent new charges for their clients at a time when there is so much downward pressure on fund management fees. These firms, therefore, decided to pay for research out of P&L. Second, large firms chose to pay out of P&L because of the complexity they would face in attributing research costs to individual funds when block trades are performed simultaneously for multiple clients using a variety of trading mechanisms. Third, at a mundane level, some firms reportedly ran out of time to implement the administrative procedures required by RPAs in the run up to the MiFID II implementation date and hence were obliged to pay out of P&L.
Smaller asset managers that adopted RPAs typically have simpler trading activity (fewer block trades for multiple funds, routed through many platforms) so use of RPAs was at least reasonably feasible from a practical standpoint. These firms felt unable to absorb research costs in P&L. This may assist their profitability in the short run but could affect their market share over a longer horizon.
1.2.4 Differential effects of MiFID II on asset and manager types
A second topic explored by the study is the magnitude of declines in budgets and, in consequence, prices, and how were these declines distributed across different types of asset manager and different asset classes?
Global buy-side firms were most successful in bargaining down the costs of research. The largest firms reduced research budgets by 30-40%. Medium-sized, buy-side firms made smaller savings. Small firms found the pressures of paying for research out of P&L very challenging. Some implemented RPAs attempted to bargain but typically saw little reduction in research costs. Sell-side firms reported substantial reductions in the numbers of smaller firms consuming their research.
Apart from direct financial impacts, the changes in ways of working that MiFID II entailed for different in-scope buy-side firms varied considerably. Global asset managers typically had already implemented processes for budgeting, monitoring and evaluating research prior to MiFID II. The rules require that firms adopt these approaches whether they pay for research via P&L or RPAs in order that be able to show that they have not accepted inducements to trade in the form of mis-priced or free research. Putting these systems in place was a substantial undertaking for small and medium-sized firms that had not implemented best-practice systems before MiFID II.
1.2.5 Effects on research coverage and volume
One would naturally expect that declining budgets among research consumers and, hence, reduced prices would result in changes in the quantity of research produced. A key topic for the study is, therefore, whether changes occurred in coverage or research volume. Coverage may be defined as the fraction of firms for which some research is available or the number of researchers that publish reports on a given company. Research volume may be defined as the number of research reports per company, per year.[8]
From the market landscape described in Section 2 of our study, it is striking that levels of equity research activity, as measured by reports per company and coverage ratios[9], have trended down in multiple European markets in recent years. Less developed markets, like those in Eastern and Southern Europe, have been particularly hard hit. The question remains: did research fall in 2018, the first year of MiFID II, in excess of the trend decline?
Sample averages do indeed suggest that research fell more in 2018 than would be explained by the trend. One must evaluate carefully, however, whether this decline is statistically significant or no more than a reflection of year-by-year fluctuation. To investigate this, panel regressions are performed, calculating robust standard errors with clustering. These regressions condition only on clearly exogenous variables including trends and 2018 dummies specific to regions (Western, Northern, Southern and Eastern Europe). The results point to statistically significant negative 2018 effects (over and above trend) for most firm sizes in Western, Southern and Eastern Europe and for Non-SME companies in Northern Europe.
The final question to ask, however, is whether 2018 is an unusual year once one has allowed for other influences on research? As the cycle of investment activity in different types of company evolves, levels of research activity change. The two most obvious additional drivers of investment research are secondary market volumes traded and primary market issuance. As a short-hand, one may refer to these additional influences as ‘cyclical’. To investigate cyclical influences on research, we regressed numbers of reports per company on exogenous variables and on firmspecific volume and indicators of increases in the firms’ number of common shares.
Inference is this case is complicated by the fact that turnover and research volume jointly affect each other. We allow for this using an Instrumental Variables approach within the context of the panel regression.
In these regressions, the statistically significant 2018 declines in research for smaller companies are reduced. This suggests that low 2018 SME research activity may reflect a cyclical drop in SME trading volumes and new issuance and not the introduction of MiFID II. Here, the statistical approach employed of Instrumental Variables is used in order to allow for the fact that turnover may itself depend on research in which case the regression coefficients may be biased. Questions may be asked about the legitimacy of the instruments employed (here, lagged turnover is employed) so results should be interpreted with caution.
Meanwhile, the regressions suggest that significant negative trends for less developed markets remain as do negative 2018 effects for Mid and Large Cap companies in Western, Southern and Northern Europe and for the United States. Even allowing for cyclical effects, moderate statistically significant 2018 decreases in reports per company remain for large companies and less developed markets and may result from MiFID II.
How do these findings compare with the survey and interview evidence collected? It is apparent from simple year averages that there was weakness in research indicators in 2018 for a number of company sizes and regions. Many industry views reflect this. 71% of buy-side survey respondents reported that MiFID II reduced the amount of SME equity research. Most firms that participated in interviews agreed but a significant number from larger and more specialist firms questioned whether volumes and coverage had changed much.
The need to condition on the state of the research activity cycle is spelt out by Specialist SME investors interviewed as part of the study spelt out that research volumes for smaller companies fluctuate significantly as equity turnover and new issuance rise and fall. They described SME research as highly cyclical. In bear markets, Small Cap analysts are the first to go. Liquidity dries up and banks cut credit. The cyclicality of new issuance also means that research dries up in downturns.
1.2.6 Effects of MiFID II on research quality
Proponents of MiFID II unbundling argue that even if research quantity declines, this could reflect a reduction in low quality research and that improved incentives for providers that remain may result in more accurate forecasts and generally higher research quality. A fourth key subject of analysis for the report is, therefore, whether MiFID II led to systematic changes in the quality of research.
To evaluate possible changes in research quality, the study includes analysis of the accuracy of Earnings per Share estimates based again on I/B/E/S data. This analysis suggests no systematic changes in research quality but provides striking evidence of the substantial variations in forecasting accuracy across national markets. The variation in forecasting accuracy together with the results of our initial research market landscape section underline how fragmented and varied is the market for investment research across different European countries and how far European investment research has to progress before uniform standards are achieved across countries.
The statistical evidence on research accuracy contrasts sharply with responses to the surveys conducted as part of this project. Many buy-side survey participants report that research quality has declined particularly for SMEs, citing juniorization, reduced analyst numbers and fewer research providers as factors driving lower research quality. Respondents report similar views for factors driving declines in Credit research quality although the fraction of respondents for which these factors are an issue is lower in the case of Credit research.
1.2.7 Number of researchers
A fifth topic examined by the study is whether MiFID II affected the number of research providers covering SMEs. If a change in regulation like MiFID II were to reduce the number of research providers, one might expect that this would take time to occur. In fact, the statistical evidence does suggest that there were declines in the number of providers in 2018 over and above trend. These were marked for non-SME and Small Cap companies across multiple regions. The evidence of declines is less strong for Micro and Nano Caps. Some of the decline appears to be cyclical in the sense that when one conditions on increased numbers of shares and volume, the magnitudes of several of the more significant effects are diminished and the effects become less statistically significant.
1.2.8 Structure and volume of Fixed Income Research
A sixth topic the study addresses is the implications of MiFID II for the structure and volume of Fixed Income (FI) research. The in-depth interviews, in particular, highlighted the implications of MiFID II for the structure of FI investment research. Following MiFID II, a number of firms de-emphasised or even ceased publishing research in favour of a sales- or strategy-analyst approach. Other firms, in contrast, maintained publishing research teams, operating fully within the MiFID II system of unbundled charging.
Where the borderline should be between publishing and sales analysts is hard to determine. In a dealer market, like the market in corporate bonds, traders, assuming inventory risk for their firms, necessarily require the support of research or analytical teams. To do their job, these analysts must speak to issuers and buy-side market participants just as a publishing researcher would.
Interview respondents from firms that have maintained publishing research teams in some cases question the direction in which the industry is moving. While their views presumably reflect their own competitive position in the market, they raise plausible concerns that some FI research at least has been driven underground by MiFID II.[10]
Assessing trends in Credit Research volume is hampered by the difficult in obtaining data. Research reports are typically posted on broker research portals or other proprietary platforms and are only visible to those with research contracts. One major data provider, however, Refinitiv, provided access to the subset of investment reports on their system relating to European FI.[11]
Over the period 2017 to 2019, these reports declined by 28%. Since the data was tracking the research output of a given set of major research houses, this calculation is unaffected by the choice of sell-side firms to cease contributing data to aggregators. The decline was greatest for the largest research providers with smaller research houses providing unchanged or even slightly higher numbers of research reports.
The substantial decline was only partly borne out by surveys and interviews. Of buyside survey respondents, 56% said that the impact of MiFID II on the availability of credit research was negative. In interviews with specialists and larger firms, some respondents said that there has been a progressive decline in credit research activity but did not regard MiFID II as having accelerated the trend.
Nevertheless, the overall picture of Credit Research activity implied by the evidence presented in this study is concerning with reported declines in publishing research activity, growth in much less transparent sales analyst research and a sharp decline in numbers of Credit research reports by major houses.
1.2.9 MiFID II and Investor Relations
A seventh topic we address is the possible impact of MiFID II on Investor Relations (IR) and Corporate Access (CA), i.e., the interactions between asset managers and issuers of equity or corporate bond securities. Brokers have traditionally played an important role in these interactions since they advise issuers in the primary market while having good information about existing or potential investors, in particular equity or corporate bond securities.
The two primary types of CA activity provided by brokers are (i) road shows whereby brokers organise for issuers series of meetings with asset managers (typically in the managers’ offices) and (ii) conferences in which brokers run events on their own premises, inviting issuers and asset managers to attend.
Under MiFID II, CA activity is interpreted as distinct from research but still a potential form of inducement if asset managers accept it from brokers without monetary recompense. Hence, regulators generally expect some form of payment unless the issuers themselves bear the cost. The requirement that brokers charge for their CA activities has changed the dynamics of interactions between issuers and investors, impeding the process according to some Small and Mid Cap firms that were interviewed.
Of the different participants in interviews and surveys, it was noticeable that issuers were most perturbed about the effects of MiFID II on IR/CA. Several argued that MiFID II hampered their attempts to contact investors in other financial centres. Brokers were least concerned about developments while buy-side firms only viewed IR as negatively affected by MiFID II in cases where were close to SMEs (for example, specialised Small Cap investors) or if they thought pressure on brokers to increase income streams had led to distinctly higher costs for participating in conferences. All these views contribute to a picture in which IR for smaller European firms is somewhat disrupted and in flux. Market solutions like non-broker service providers and more direct contacts between firms and investors might resolve the situation but the topic merits some monitoring by policy-makers.
1.3 Literature
1.3.1 Views on MiFID II and unbundling
The changes in the rules governing investment research for European investment firms represented by MiFID II represented a major shock to established markets for research and intermediation services. The nature of the shock is controversial, however. Some have argued that investment research is a quasi-public good in that it is hard to exclude all but those who finance research from the benefits of the activity. Hence, research is likely to be under-produced, especially as concerns some topics like small firm research. Linking research and execution services in payments may mitigate this issue. On the other hand, some regulators viewed the market, as it existed before MiFID II as distorted, with conflicts of interest encouraging over-production of research and wastage of resources at the expense of ultimate investors.
Academic research provides other perspectives, notably by suggesting that linking payment for research and transactions services may distort the incentives of research providers leading to biased forecasts. Cowen, Groysberg and Healy (2006) examine the variation in analysts’ forecast and recommendation optimism based on the business activities used to fund research. The authors find that analyst at firms that funded research through underwriting and trading activities were less optimistic in their recommendations in comparison to analysts at brokerage houses without underwriting activities. The authors concluded that trading incentives is a more important factor driving analyst optimism than underwriting activities. A possible explanation is that bulge firms may attract underwriting clients through their reputations, rather than through optimistic research. This explanation is supported by some evidence that bank status is negatively related to forecast optimism.
Barber, Lehavy and Trueman (2007) compare the stock recommendation performance of analysts at independent research firms and investment banks. The authors find that the average daily abnormal return of the buy recommendations of independent research firm exceeds that of the investment bank by 3.1 basis points. However, the hold and sell recommendations of investment banks outperform those of independent research firms by 1.8 basis points daily. The authors argue that their results indicate of reluctance by investment banks to downgrade stocks whose prospects dimmed during the bear market of the early 2000s.
Galanti and Vaubourg (2017) examine whether CSAs reduce conflicts of interest, after they were implemented in France in 2007. The authors conduct panel regressions on a sample of one-year-ahead EPS forecasts for 58 French firms covering the period from 1999 to 2011. The authors find that the analysts' optimistic bias declined significantly after CSA rules, which suggests that these rules are effective at curbing the conflicts of interest between brokerage activities and financial research.
Whatever one’s view about the ultimate effects on the research market of unbundling, the increased transparency of payments for research introduced by MiFID II certainly altered the bargaining power of suppliers and providers of research. The widespread choice by asset managers to pay for research from P&L rather than through RPAs (see the last section) further affected the bargaining process between research consumers and producers.
1.3.2 Analyst coverage and equity financing costs
Various academic papers have investigated the importance of analyst coverage in the context of equity financing. Some such studies are Derrien and Kecskés (2013), Chang, Dasgupta and Hilary (2006) and Brennan and Subrahmanyam (1995). Of these studies, Derrien and Kecskés (2013) examine the causal effects of analyst coverage on corporate investment and financing policies. The authors identify analyst coverage changes that are exogenous to corporate policies by identifying the broker closures and broker mergers. The authors use a difference-in-difference approach to conclude that firms that lose an analyst decrease their investment and financing by 1.9% and 2.0% of total assets, respectively, compared to similar firms that do not lose an analyst.
Chang, Dasgupta and Hilary (2006) find evidence that analyst coverage affects security issuance. The authors argue that the analyst coverage of a firm is negatively correlated with the extent of information asymmetry, either because of a direct reduction in information asymmetry from the analysts following, or because analysts covering that firm that are more transparent and for which information gathering costs are lower.
Brennan and Subrahmanyam (1995) examine the link between analyst coverage and the estimated adverse selection cost of transacting the security after controlling for the effects of previously identified determinants of liquidity. Using intraday data for the year 1988, they find that analysts follow trends to reduce adverse selection costs.
1.3.3 Effects of MiFID II unbundling on research coverage
Several academic studies have recently performed analyses of the effects of MiFID II research unbundling using, like us, EPS forecast data from I/B/E/S as their main data source for research coverage. The approach they take is Difference-in-Difference (DiD). The papers document decreases in coverage of European companies and reductions in analyst activities.
Pope, Tamayo, and Wang (2019) study changes in sell-side research upon implementation of Research Payment Account (RPA) model among large Swedish asset managers since the beginning of 2015. The authors find reduced number of companies covered by an average analyst with some companies losing coverage entirely. The reduction is more profound for companies with lower market capitalization and lower institutional ownership.
Fang, Hope, Huang and Moldovan (2019) study the changes in European sell-side analysts and buy-side analysts under the influence of MiFID II. A panel regression model and a DiD model are run in parallel. The authors find reduction in number of analysts covering European firms, with 334 firms losing their coverage completely. The authors also find that buy-side firms are more reliant on in-house researches and increase their participation in earning conferences.
Guo and Mota (2019) find reduction in sell-side research led by MiFID II. The authors find that the reduction concentrates more on large firms rather than small and midcaps. Lang, Pinto and Sul (2019) also find reduction in analysts following European firms in comparison with US firms. Similar to Guo and Mota, they find the decrease largest for larger, older and less volatile firms.
We believe that performing DiD analysis in which European firms are paired with US firms in order to condition away time series influences apart from MiFID II is problematic. As will shortly be apparent, coverage and volume have strong and contrasting regional patterns including differing trends. Investment research is cyclical particularly for smaller firms. The US and European economies are at very different stages of the cyclical in 2018 so using US firm controls is questionable.
1.4 Organisation of the study
The report is organised as follows. Section 2 sets out the market environment for investment research in Europe. The wide variety in equity and bond markets across different European countries is described. The focus here is on the size of markets, the volumes of new issues, the degree of foreign ownership, the number of public companies and of publicly quoted SMEs (defined as firms with equity market capitalisation less than EUR 1 billion), the financial development score, the degree of concentration in brokers involved in primary markets, and the number of winners in a prominent award for equity analyst forecasting accuracy.
Information is presented on suppliers and consumers of investment research in different markets, drawing on responses to the surveys implemented as part of this project. Data is provided by region and country on indicators of research including the fraction of companies covered by at least one analyst, reports per company, brokers per company and companies per broker. Finally, the study presents an analysis of winners in two prominent investment research awards, those of StarMine and Extel. From these, one may learn about which types of institutions deliver high quality research.
Section 3 describes the legal landscape for investment research. This section includes a summary of the MiFID II rules, the legal framework for these rules and how member states implemented these rules. The report describes the different approaches to paying for research pre- and post-MiFID II and then focusses on requirements for the Research Payment Accounts (RPAs) that MiFID II introduced. The choice that firms made in implementing MiFID II, opting for RPA approaches or paying for research out of P&L, is presented and discussed. The discussion then turns to the complex issue of how EU firms purchase research from non-EU providers and the constraints placed on this by the regulations extant in other jurisdictions. The implementation of MiFID II across different EU countries is examined. The rules for treatment of free research, trial periods and sponsored research are also presented. Finally, the topic of Corporate Access is discussed.
Sections 4 through to 11 present the core analysis of the study: analysing how MiFID II has affected different dimensions of investment research or other structural aspects of equity and corporate bond markets. On the impact effects of MiFID II, the study follows the economic logic of impact analysis: the regulatory change affected the disposition of bargaining power between providers and consumers of investment research. Hence, the effects first show up in budgets and pricing, continue into impact on coverage and research volume. Subsequent possible effects examined include research quality and numbers of research providers. Finally, structural effects (a) on Fixed Income research and (b) on internal research strategies for buy-side firms are discussed. Last, the effects on issuers are analysed, including both the impact on IR/CA and effects on financing terms and liquidity.
Section 4 addresses the impact of MiFID II on the budgets that managers are willing to deploy in buying research. We begin by discussing the effects on budgets and then consider how this affected the pricing of research. Survey results of buy-side, sell-side and IRPs are compared and analysed.
Section 5 presents a synthesis of survey, interview and statistical evidence on research activity and coverage. This includes a panel regression analysis of key activity and coverage ratios: the number of reports per company and the fraction of firms covered by at least one analyst. By regressing these indicators, at the individual firm level, on
(i) region-specific dummies, (ii) trends and (iii) 2018 dummies, we are able to investigate the statistical significance of the 2018 effects for each region, over and above trend, in reports-per-company and coverage indicators. We also present additional regressions that include endogenous variables (suitably instrumented) on the right-hand side to condition for the effects of research drivers: volume and primary market activity.
Section 6 discusses the impact of MiFID II on research quality based on surveys, interviews and statistical analysis. This section first presents the survey results highlighting the views of buy-side firms and issuers on research quality. We then statistically investigate the impact on research quality by analysing the EPS forecast accuracy. The report also examines which types of research providers have won awards for their investment research and how this has evolved over time.
Section 7 discusses the impact of MiFID II on the numbers of research providers. We first present the survey results on the number of research providers used by the buyside firms before and after MiFID II. We then statistically analyse the impact on the number of brokers per company using the I/B/E/S dataset.
Section 8 presents a discussion on non-equity research in the context of MiFID II. It starts off by discussing credit research volumes based on data provided by Refinitiv. Then, based on the interviews, we discuss the evolution in the organisation or categorisation of credit research within bank brokers. We also present a discussion on whether Macro and Fixed Income, Currencies and Commodities (FICC) research are really susceptible to the unbundling rules.
Section 9 discusses some of the other implications of MiFID II including the impact on the internal operations of buy-side firms and the channels that the sell-side firms use to distribute for research.
Section 10 presents a discussion of the impact of MiFID II on Investor Relations (IR) and Corporate Access (CA) activities drawing on the interview and survey responses on IR and CA reported by issuers, sell-side and buy-side firms.
Section 11 discusses the impact of MiFID II on financing costs and liquidity. It presents survey results on individual issuer views of the impact (i) on issuer firms in general and (ii) on the firms themselves. We also present the views of the sell-side firms on impact on liquidity and financing terms.
Lastly, Section 12 presents our conclusions on the impact of MiFID II based on the evidence from the survey, interviews and statistical analysis.
The study includes a series of annexes. Annex 1 contains the responses from the legal survey. Annex 2 provides information on the respondent description for our survey. Annex 3 presents a summary of some of the existing surveys on the impact of MiFID II. Annex 4 lists the survey questions for the buy-side, sell-side, issuer and IRP surveys. Annex 5 presents country fiches for each of the EU 28 countries providing key stats on coverage indicators, forecast accuracy and market indicators including equity and corporate debt securities outstanding, common equity issuance, debt issuance, daily transaction volume per equity, average bid-ask spread, number of companies selected, reports per company per month, brokers per entity per month. Annex 6 extends the regression results presented in Section 5 by including data on companies in the United States. Annex 7 lists the terms and definitions related to this report and the survey.
2. The Market Landscape for Investment Research
2.1 Introduction
This section sets the scene for our study by describing the market landscape for investment research in the EU. In this, we draw on statistical, survey and interview evidence. To begin with, it is important to understand the very considerable heterogeneity of European equity and bond markets. This ‘market landscape’ section focusses on differences in markets are associated with contrasting levels and trends in investment research.
Key findings of this ‘market landscape’ section are that Equity and bond markets vary substantially across European countries, providing very different market environments for investment research. (Subsequent sections of the study (notably Sections 4 and thereafter) present the core results of the study in the form of analyses of the impact of MiFID II on research levels and quality in 2018.)
The levels of research quantity (numbers of reports per company), coverage (fraction of firms followed by at least one analyst) and research quality (as measured by Earnings per Share (EPS) forecast accuracy or success in winning research awards) differ very considerably across countries. Varying trends are discernible in research coverage and volumes. Eastern and Southern European firms have very noticeably worse levels and trends in research quantity and coverage than other regions for most firm size categories.
2.2 Variation across European markets
Most investment research is conducted by brokers for whom the motives to generate research include:
(i) to service their brokerage clients in equity market trading,
(ii) to provide information to investors in new equity issues,
(iii) to generate information for their own market makers in corporate bonds,
(iv) to service clients trading in corporate bonds in the secondary market and
(v) to provide information for investors in corporate bond issues. The relative importance of these motives evolves over time as will be discussed below.
Given the central role of brokers as research producers and their involvement in security trading and issuance, one may expect the level of research activity to vary according to the amounts of primary and secondary market activity. Below, we consider a set of primary and secondary market indicators and consider how they vary across countries and European regions.
Tables 2.1 and 2.3 present statistics on equity and bond markets in European countries. Of these, Table 2.1 contains data on outstanding amounts, issuance and ownership. Table 2.3 presents a more varied set of indicators including StarMine Award winners, Herfindahl Index (HFI) SME equity issuance, HFI corporate bond issuance, HFI corporate bond and equity, financial development scores, numbers of public companies and numbers of public SMEs. Detailed information on the data used to construct the indicators in the tables may be found in Boxes 2.1 and 2.2.
Results are provided for all EU 28 countries and for several regions.[12] The data on equity outstanding in Table 2.1 reveal which are the highly developed equity markets, namely UK, France, Germany and the Netherlands. Italy, Ireland, Spain and Sweden make up the second tier of countries in this respect. Austria, Luxembourg, the other Nordics, Belgium and Poland represent the third tier. The remaining countries including the other Eastern European countries have very small equity markets.
From Table 2.1, it is noticeable that equity outstanding is highly correlated with corporate bonds outstanding. There are some exceptions like Luxembourg which has a
averages. In Table 2.3, the regional measures equal averages of the country measures for Herfindahl Index (HFI) measures and Financial Development Scores. The rest of columns in much larger bond market than equity market. But overall, having a developed market in one security type is closely associated with having a similar level of development in the other.
Box 2.1: Data Notes for Table 2.1
First two columns are outstanding amounts of listed shares and corporate debt securities. Data is downloaded from ECB Statistical Data Warehouse. Note that corporate debt securities amount is calculated by taking the difference between total debt securities amount outstanding and debt securities issued by general government. Data presented are averages over 2016 to 2018 period, measured in billions EUR.
Following amount outstanding data are issuance amount of common equity Initial Public Offerings (IPOs), total issuance (including IPOs and additional issuances) of common equities and corporate bond issuance amount. Data presented are yearly averages over the 2016 to 2018 period. All issuance data is downloaded from Bloomberg and presented in billion EUR. Initial deal amounts are aggregated into countries by issuers’ registration country.
The last two columns are proportions of domestic listed shares or corporate debt securities held by foreign entities. Foreign holdings are calculated based on 2018 Q4 data from ECB Data Warehouse Quarterly Financial and Non-Financial Accounts. For listed equities, the share of foreign holding is calculated by taking the division of amount outstanding held by rest of the world and total amount outstanding. There is no direct measure for debt securities issued by corporate entities in ECB database. We calculate corporate debt security outstanding as the difference between total debt security outstanding and debt security issued by general government. Similarly, corporate debt security held by rest of the world is calculated as the difference between debt securities held by rest of the world and debt security issued by general government and held by rest of the world. Shares of foreign holding is the ratio of corporate debt security held by rest of the world to its amount outstanding.
The bottom part of the table aggregates indicators into geographical regions. For outstanding and issuance amounts, the totals of constituent countries are presented. For foreign holding ratios, averages across constituent countries are taken.
The mapping from country to region is present in Table 2.2.
One might expect that equity issuance would again be correlated with amounts outstanding. In general, this is true but one may contrast, for example, France which has low issuance and particularly low IPO activity relative to the size of its total equity outstanding compared to the UK. On the other hand, France has relatively sizeable corporate bond issuance (as a ratio to the size of its corporate bond market) compared to the UK. These patterns could affect brokers’ incentives to offer research in different markets. An active primary equity market as exists, for example, in the UK is more likely to result in high levels of research coverage.
Also relevant for understanding the context for investment research and MiFID II inducement rules is the degree of foreign ownership.[13] One may expect that research will facilitate foreign ownership by reducing the informational barriers between local and foreign investors.[14] The figures in Table 2.1 reveal how some countries are very open to foreign investment (Ireland, Netherlands, Portugal, for example). Sizeable countries like Germany and the UK have rather smaller shares of foreign ownership. France has a strikingly low fraction of foreign equity ownership. In corporate bonds, Finland, Ireland and the Netherlands have substantial shares of foreign investment while some countries like Italy have surprisingly low foreign ownership shares.
Table 2.3 presents a variety of indicators including StarMine Award winners, HFI SME equity issuance, HFI corporate bond issuance, HFI corporate bond and equity, financial development scores, numbers of public companies and numbers of public SME companies. StarMine Awards are prominent accolades attributed to industry analysts for forecasting accuracy. This measure provides a first indicator of the quality of research in different countries. UK, France and Germany are the domiciles of most winners. Sweden and Finland have a number of winners. Perhaps surprisingly, the Netherlands, Italy and Ireland have relatively few winners.
On numbers of public companies and public-SMEs (last two columns), clearly UK, Germany and France represent countries with large numbers of firms in both categories. (In this report, SMEs are defined as firms with equity market capitalisation less than EUR 1 billion.) Poland has strikingly many public companies. The Nordics as well have significant numbers of public firms. Some Eastern European countries such as Romania and Bulgaria have a large number of public companies, in both cases more than Spain.
The IMF’s financial development score is a standard way of assessing the degree to which financial markets are sophisticated. In this case, the measures appear anomalous in that Spain has a higher score than the UK closely followed by Italy. Sweden, Netherlands, France and Germany comprise the next tier by this measure. Baltics and Eastern European countries include examples that are highly concentrated like Croatia and Latvia.
The Herfindahl Index (HFI)[15] provides a standard measure of concentration. Here, we present Herfindahl indices for the degree of concentration in broker and investment bank shares in under-writing (a) SME equity issuance, (b) corporate bond issuance and
(c) the sum of the equity and corporate bond issuance in each of the national markets. These statistics reveal how much primary market activities in these markets are dominated by a few brokers and investment banks or are genuinely competitive with the substantive participation of many brokers and investment banks. In general, the larger markets (particularly, UK, France, Germany) are highly competitive. There are outliers such as Portugal, Luxembourg and Hungary where brokers engaged in SME primary markets appear to be highly concentrated. Bulgaria, Czech Republic, Austria and Romania also appear to have relatively uncompetitive primary for SME equity issuance. The extreme heterogeneity of the market environments for investment research across Europe was emphasized by the brokers and asset managers that were interviewed from less developed securities markets. In particular, Eastern European interviewees emphasised the historical experience of multiple markets in their region consisting of a privatisation-related boom in the early 2000’s followed by a post-2007 stock market collapse (by amounts up to 85%). The interviewees highlighted that post crisis, new equity issues and liquidity dried up and corporate debt issue also largely ceased.
Eastern European asset managers may be very small by international standards but still be leading firms in their domestic markets. Pre-crisis many had a strong home bias, investing almost all their funds domestically. Post-crisis, they have diversified by investing most funds abroad. Firms interviewed as part of this study reported that they do not buy research from local brokers, in part, because they do not trust them to provide unbiased evaluations and, in part, because they believe the quality of local broker research is low.
Asset manager from Eastern European countries that participated in interviews reported that few domestic brokerages have in-house research, having cut back research departments following 2007. The asset managers themselves have built their own research teams for domestic investments and generally focus on narrow investible universes determined by the free-float and liquidity of available instruments. For one asset manager interviewed, this left just 20 domestic companies in which they could invest.[16]
Box 2.2: Data Notes for Table 2.3
The column headed StarMine award winners counts how many winners of StarMine Analyst Awards dedicated to European company-focused analyses from 2016 to 2018 are domiciled in each EU country. Analyst Awards measure the performance of analysts based on the returns of their buy/sell recommendations and the accuracy of their earnings estimates. For a certain industry category, based on GICS definition, Top 3 Stock Pickers and Top 3 Earning Estimators are elected for each year. For overall performance regardless of sectors, Top 10 Stock Pickers and Top 10 Earning Estimators are awarded each year as well. Country of analysts’ companies are manually searched by us. In cases where an analyst wins more than one award, records are not combined into one. One can refer to Box 2.4 for more information about StarMine awards.
The following three columns contain Herfindahl Index (HFI) calculated for primary issuances of corporate bonds, SME equities and the combination of corporate bonds and equities, respectively. To obtain the HFI of the brokers in the equity and bond issuance market, we download Bloomberg’s league table data on the managers of equity or corporate bond issuance within the EU countries over the period 2015 to 2018. The downloaded data includes the issuance amount in EUR.
We consider the sum of all corporate issuance over 2015 to 2018 attributed to a broker/manager within the EU countries. Then HFIcorp,c, the HFI for all the brokers in country c for corporate bond issuance is calculated as, n 2 (2.1) HFIAll,c = ∑i=1 si,c issue_amounti Here, si,c = total_issue_amount is issue amount for manager i over 2015 to 2018 in country c. Similarly, we calculate the HFI for SME equities and combined corporate bond and equities primary markets.
Financial Development Index is calculated by International Monetary Fund (IMF)[17], indicating how developed financial institutions and financial markets are in terms of their depth, access and efficiency. Scores presented in the table are based on year 2017. A higher score indicates more advanced financial development.
The number of public companies for each country is obtained from Eikon from Refinitiv search function. Companies included in the table are those that became public before 2015 and are still listed now (February 2019). These companies comprise the company universe for our statistical analysis. We also count number of companies within this company universe that have current market capitalisation below 1 billion EUR. They are listed in the last column of the table.
The bottom part of Table 2.3 shows regional sums of StarMine award winners, number of public company and number of SMEs, and regional averages for other indicators.
Other investment managers in the same region are subsidiaries of foreign companies. Such firms often make extensive use of pooled services provided by the parent in key functions like finance, risk and compliance. The local entity may have discretion only over the small fraction of investments that is placed locally. One such manager interviewed as part of this study again said they did not access local broker research.
These and other Eastern European asset managers and brokers described a capital market environment that is ill-suited to the raising of new capital. The managers question the relevance to their market of regulations framed for highly developed markets. MiFID II is less of an issue for them than some other aspects of regulation since research is not their central concern (illiquidity and concentration or lack of new issuance figure larger).[18]
To conclude, this subsection underlines the extreme variation in primary and secondary market activity across different countries and, hence, in research (in light of the central role in the latter of brokers). At one end of the spectrum, Western Europe is characterised by substantial outstanding amounts of equities and bonds, low concentration in brokers and success in winning research awards, and foreign holdings of equity and corporate bonds between 60 and 70%. At the other end of the spectrum, Eastern Europe exhibits equity and bond markets 30 to 40 times smaller, highly concentrated broker provision, no success at all in research awards, and foreign holdings of equity and debt between 40 and 50%. The number of SMEs is somewhat comparable with 1,882 in Western Europe and 1,525 in Eastern Europe. (Although, of course, in Eastern Europe SMEs, defined as less than EUR 1 billion in market capitalisation, may represent relatively larger companies in the market.) These comparisons serve to emphasise the challenges that policy-makers in Europe face in creating a genuine Capital Markets Union (CMU) in such areas as investment research.
| Table 2.1: Country | Statistics | – | Outstanding | Amounts, | Issuance | and | Ownership | ||
|---|---|---|---|---|---|---|---|---|---|
| Equity | Corp | bond Common | Common | Corp | bond | Listed | equity Corp bond | ||
| outstanding | outstanding equity | IPO | equity | issuance | foreign | foreign | |||
| issuance | holdings | holdings | |||||||
| Austria | 114.6 | 191.2 | 0.58 | 1.42 | 55.5 | 0.44 | 0.58 | ||
| Belgium | 371.2 | 230.4 | 0.40 | 1.30 | 20.6 | 0.64 | 0.58 | ||
| Bulgaria | 8.1 | 2.5 | 0.02 | 0.02 | 0.5 | 0.27 | 0.59 | ||
| Croatia | 19.4 | 2.4 | 0.00 | 0.06 | 0.1 | 0.50 | n.a. | ||
| Cyprus | 7.7 | 10.1 | 0.00 | 0.09 | 4.5 | 0.76 | 0.99 | ||
| Czech Republic | 24.6 | 81.5 | 0.25 | 0.47 | 5.0 | 0.54 | 0.56 | ||
| Denmark | 337.0 | 567.6 | 1.20 | 3.16 | 21.2 | 0.50 | 0.35 | ||
| Estonia | 2.5 | 1.6 | 0.06 | 0.06 | 0.2 | 0.36 | 0.72 | ||
| Finland | 212.7 | 136.9 | 1.14 | 1.94 | 28.4 | 0.54 | 0.82 | ||
| France | 1,941.4 | 1,915.4 | 1.61 | 10.44 | 298.5 | 0.38 | 0.51 | ||
| Germany | 1,742.8 | 1,480.7 | 6.95 | 15.91 | 1,214.5 | 0.51 | 0.50 | ||
| Greece | 35.7 | 17.9 | 0.05 | 0.29 | 14.4 | 0.50 | 0.01 | ||
| Hungary | 23.8 | 9.4 | 0.03 | 0.25 | 1.8 | 0.64 | 0.28 | ||
| Ireland | 549.4 | 593.2 | 3.04 | 4.18 | 48.3 | 0.94 | 0.79 | ||
| Italy | 505.5 | 846.9 | 2.91 | 6.33 | 126.9 | 0.50 | 0.30 | ||
| Latvia | 0.9 | 1.1 | 0.00 | 0.01 | 0.3 | 0.66 | 0.75 | ||
| Lithuania | 3.7 | 0.3 | 0.02 | 0.03 | 0.3 | 0.30 | 0.72 | ||
| Luxembourg | 138.1 | 820.1 | 0.33 | 1.95 | 126.1 | 0.55 | 0.72 | ||
| Malta | 6.4 | 3.9 | 0.06 | 0.12 | 1.1 | 0.29 | 0.35 | ||
| Netherlands | 1,025.8 | 1,561.9 | 2.01 | 7.44 | 315.3 | 0.87 | 0.85 | ||
| Poland | 136.4 | 66.3 | 0.73 | 1.54 | 5.3 | 0.40 | 0.16 | ||
| Portugal | 54.1 | 109.0 | 0.13 | 0.37 | 8.8 | 0.76 | 0.31 | ||
| Romania | 16.1 | 0.5 | 0.04 | 0.53 | 0.1 | 0.41 | 0.24 | ||
| Slovakia | 4.5 | 11.0 | 0.00 | 0.00 | 2.2 | 0.72 | 0.56 | ||
| Slovenia | 5.4 | 1.7 | 0.22 | 0.22 | 0.1 | 0.30 | 0.35 | ||
| Spain | 660.1 | 695.3 | 3.49 | 7.49 | 104.7 | 0.50 | 0.40 | ||
| Sweden | 636.1 | 628.0 | 1.73 | 4.90 | 138.2 | 0.39 | 0.56 | ||
| United Kingdom | 2,397.8 | 2,460.2 | 9.95 | 28.23 | 248.4 | 0.60 | n.a. | ||
| EU | 10,981.8 | 12,447.1 | 36.92 | 98.73 | 2,791.5 | 0.53 | 0.52 | ||
| EU excl. UK | 8,584.0 | 9,986.9 | 26.96 | 70.51 | 2,543.1 | 0.52 | 0.52 | ||
| Eastern Europe | 245.5 | 178.4 | 1.35 | 3.18 | 16.0 | 0.46 | 0.49 | ||
| Western Europe | 6,538.2 | 7,772.4 | 17.92 | 54.97 | 1,112.7 | 0.63 | 0.67 | ||
| Southern Europe | 1,269.5 | 1,683.1 | 6.63 | 14.68 | 260.4 | 0.55 | 0.39 | ||
| Northern Europe | 2,928.6 | 2,813.2 | 11.01 | 25.90 | 1,402.3 | 0.49 | 0.56 |
Note: Equity outstanding, corporate bond outstanding, common equity IPO, common equity issuance and corporate bond issuance are in billion EUR. Listed equity foreign holdings and corporate bond foreign holdings are fractions. Further details are given in Box 2.1.
| Group | Countries |
|---|---|
| Eastern Europe | Bulgaria, |
| Latvia, Lithuania, | |
| Northern Europe | Denmark, |
| Southern Europe | Cyprus, Greece, |
| Western Europe | Austria, |
| Netherlands, |
Note: This table shows the country groupings used for the analysis.
| StarMine | HFI SME | HFI corp | HFI corp | Financial | Number | of Number | of | ||||||
|---|---|---|---|---|---|---|---|---|---|---|---|---|---|
| award | equity | bond | bond | and | Development | public | public | SMEs | |||||
| winners | issuance | issuance | equity | score | companies | ||||||||
| Austria | 2 | 0.29 | 0.06 | 0.04 | 0.63 | 70 | 44 | ||||||
| Belgium | 0 | 0.09 | 0.10 | 0.07 | 0.58 | 136 | 98 | ||||||
| Bulgaria | 0 | 1.00 | 0.32 | 0.32 | 0.38 | 219 | 219 | ||||||
| Croatia | 0 | 0.30 | 0.40 | 0.37 | 0.40 | 114 | 110 | ||||||
| Cyprus | 0 | 0.22 | 0.17 | 0.13 | 0.51 | 104 | 100 | ||||||
| Czech Republic | 0 | 0.39 | 0.11 | 0.11 | 0.38 | 9 | 5 | ||||||
| Denmark | 5 | 0.13 | 0.07 | 0.08 | 0.66 | 137 | 105 | ||||||
| Estonia | 0 | 0.24 | 0.18 | 0.14 | 0.33 | 20 | 19 | ||||||
| Finland | 27 | 0.12 | 0.10 | 0.07 | 0.66 | 130 | 101 | ||||||
| France | 77 | 0.07 | 0.05 | 0.05 | 0.77 | 668 | 542 | ||||||
| Germany | 68 | 0.10 | 0.05 | 0.04 | 0.69 | 727 | 599 | ||||||
| Greece | 0 | 0.13 | 0.14 | 0.05 | 0.54 | 183 | 171 | ||||||
| Hungary | 0 | 0.21 | 0.17 | 0.13 | 0.43 | 35 | 31 | ||||||
| Ireland | 11 | 0.12 | 0.05 | 0.05 | 0.69 | 70 | 37 | ||||||
| Italy | 8 | 0.07 | 0.06 | 0.06 | 0.79 | 276 | 209 | ||||||
| Latvia | 0 | 1.00 | 0.86 | 0.81 | 0.28 | 22 | 22 | ||||||
| Lithuania | 0 | 0.31 | 0.33 | 0.28 | 0.26 | 29 | 29 | ||||||
| Luxembourg | 0 | 0.77 | 0.05 | 0.05 | 0.75 | 70 | 43 | ||||||
| Malta | 0 | 0.35 | 0.16 | 0.18 | 0.56 | 30 | 29 | ||||||
| Netherlands | 3 | 0.10 | 0.04 | 0.04 | 0.70 | 144 | 84 | ||||||
| Poland | 0 | 0.08 | 0.13 | 0.07 | 0.48 | 726 | 702 | ||||||
| Portugal | 2 | 0.66 | 0.10 | 0.08 | 0.66 | 51 | 40 | ||||||
| Romania | 0 | 0.21 | 0.17 | 0.12 | 0.30 | 322 | 317 | ||||||
| Slovakia | 0 | n.a. | 0.30 | 0.30 | 0.32 | 43 | 41 | ||||||
| Slovenia | 0 | n.a. | 0.09 | 0.11 | 0.38 | 31 | 30 | ||||||
| Spain | 9 | 0.10 | 0.04 | 0.05 | 0.86 | 212 | 150 | ||||||
| Sweden | 22 | 0.13 | 0.07 | 0.06 | 0.71 | 555 | 485 | ||||||
| United Kingdom | 175 | 0.06 | 0.05 | 0.05 | 0.85 | 1,295 | 1,034 | ||||||
| EU | 409 | 0.28 | 0.16 | 0.14 | 0.56 | 6,428 | 5,396 | ||||||
| EU excl. UK | 234 | 0.29 | 0.16 | 0.14 | 0.54 | 5,133 | 4,362 | ||||||
| Eastern Europe | 0 | 0.42 | 0.28 | 0.25 | 0.36 | 1,570 | 1,525 | ||||||
| Western Europe | 268 | 0.21 | 0.06 | 0.05 | 0.71 | 2,453 | 1,882 | ||||||
| Southern Europe | 19 | 0.25 | 0.11 | 0.09 | 0.65 | 856 | 699 | ||||||
| Northern Europe | 122 | 0.12 | 0.07 | 0.06 | 0.68 | 1,549 | 1,290 |
Note: All columns are in natural units. Further details are given in Box 2.2.
2.3 Suppliers of investment research
2.3.1 Suppliers of investment research - brokers
This subsection examines the character of research providers and consumers. The analysis draws on statistics but also employs survey responses. Information on the breakdown of the surveys employed may be found in Annex 2 to this report. The surveys included detailed responses on many questions. Participants comprised a range of asset managers, brokers, issuers of debt and equity and Independent Research Providers (IRPs).
As emphasised above, brokers generate research not just to service research clients but also for their internal purposes of supporting primary market and dealing activities in the case of FICC. This affects the research market in that the costs incurred by brokers in generating research can be shared by internal “clients”. Brokers, therefore, enjoy a competitive advantage in research production vis-à-vis IRPs.
Figure 2.1 sheds light on this phenomenon by showing how sell-side survey respondents judge that the costs of producing research may be allocated to different objectives. In each of the panels in the figure, the number displayed on the x-axis corresponds to the proportion of cost allocated to that category. The number displayed on the y-axis corresponds to the percentage of respondents. Most of the sell-side respondents estimate that buy-side customers contribute to most of the cost of research. Specifically, 30% suggest that buy-side clients pay for more than 80% of research costs. Only a small fraction of firms (about 17%) report that less than 20% of costs are borne by buy-side customers. Most respondents report that internal needs contribute least to research costs with 62% of the respondents attributing less than 20% of the research costs to internal needs. Primary market activities also contribute relatively little to research costs with 48% of the respondents estimating that origination contributes to less than 20% of the research costs.
The findings in Figure 2.1 are consistent with the views reported by market participants that we interviewed. Specialists in Credit research, in particular, told us that the emphasis on servicing their firms’ secondary market clients had increased substantially as the market had matured and that new issuers had become relatively rare even in High Yield.
Despite a diminishing emphasis on primary market activities, brokers still place value on the contribution that research makes to their issuance-related businesses. Figure
2.2 shows that 77% of the sell-side respondents believe that their research quality is a selling point for their underwriting or security issuance activities. Only a small fraction (8%) do not view their research quality as the selling point of such activities.
Figure 2.3 describes the brokers that are headquartered in the EU and that have been the managers of primary equity or corporate bond issuance within the EU in the period 2015 to 2018. In the UK, equity brokers number more than double the number of corporate bond brokers. For Spain, the reverse is true. In Germany, similar numbers of brokers are involved in equity and bond issuance. Spain has the highest number of corporate bond brokers whereas UK has the highest number of equity brokers.
Table 2.4 shows the breakdown of brokers involved with equity or corporate bond issuance (combined) in the EU over the period 2015-2018 distinguishing between whether the brokers used were domestic or foreign. In all countries, a majority of brokers involved were headquartered abroad. In the Netherlands, just 4 out of 104 were domestic. In the UK, the corresponding figures were 45 out of 168. Small countries are almost entirely dominated by foreign brokers. For example, in Austria, 34 out of 36 brokers were foreign.
Figure 2.4 shows the area of focus of the broker research providers that responded to the survey. Most broker respondents provide research on SME equities (73%), the percentage actually exceeding that for Large and Mid Cap equities (68%). The large fraction covering SMEs reflects the fact that large and small brokers cover at least some SMEs whereas smaller brokers may not cover major companies. As pointed out below, it is nevertheless true that coverage for individual SMEs is much inferior to that of larger firms. About half of the respondents (49%) supply credit research.
Figure 2.5 shows issuer survey responses on equity and corporate bond issuance. It should be emphasised that issuer respondents to the survey were mostly Mid or Small Cap firms. A large majority of the firms surveyed did not issue equity in 2018 and do not expect to issue equities in the next two years. In comparison, almost half of the respondents have issued equities once or more in the last 10 years and a smaller fraction (20%) expect to issue equities in the next two years.
For bond issuance, the top criteria for selecting lead managers are their banking relationship with the firm (55%), the sales network (38%) and fees (33%). Quality of research emerges as a less popular criterion with only 13% of the bond issuers considering it when selecting their lead manager. These responses underline the relatively weak connection between primary market activity and incentives to engage in research that exists in the corporate bond market.
For equity issuance, the top criteria for selecting lead managers are sales network (65%), banking relationship with the firm (62%) and fees (56%). For equity issuers, quality of research is a criterion for a large fraction of issuers (44%) suggesting that research is more important for equity than for corporate bond issuers. Again, the connection between primary market issuance and incentives for equity brokers to engage in research appears relatively weak (in that three other factors are identified as important by larger fractions of respondents) although greater than in the corporate bond market.
Interview respondents told us that the relative weight of primary and secondary market activities as drivers of research has evolved in recent years as the proportion of new issuers has declined. One or two decades ago, brokers encountered considerable demand for pre-deal research work (and this still remains somewhat true on the equity side). One of the largest European brokers that participated in interviews reported that even four years ago, perhaps 100 names new to the High Yield market would appear in a given year. (Other large brokers that participated in interviews reported similar developments.) Now, the number is down to 20, however. The pace of deal-making has also speeded up. A new issuer would, in the past, engage in two to three weeks of road shows. Currently, a large bank can open its book and price in a day. For these reasons, the current emphasis of Credit research work has shifted firmly to the secondary market.[20]
Figure 2.6 shows the survey results on the number of analysts employed by the sellside respondents. The plurality of sell-side respondents (37%) have 10 or fewer internal equity research analysts in the EU. Slightly smaller percentages (34% and 24%) have between 10 and 50 or between 50 and 200 internal equity research analysts. Only a very small fraction (2%) have between 200 and 500 equity analysts in the EU. The results show the wide range of broker equity research department sizes represented by the respondents to the survey. The larger teams appear to be concentrated in the UK and France but some significant teams appear to be located in Italy and Germany. A large majority (72%) of the sell-side firms employ 10 or fewer internal credit research analysts in the EU. A smaller fraction (18%) employs between 10 to 50 credit analysts.
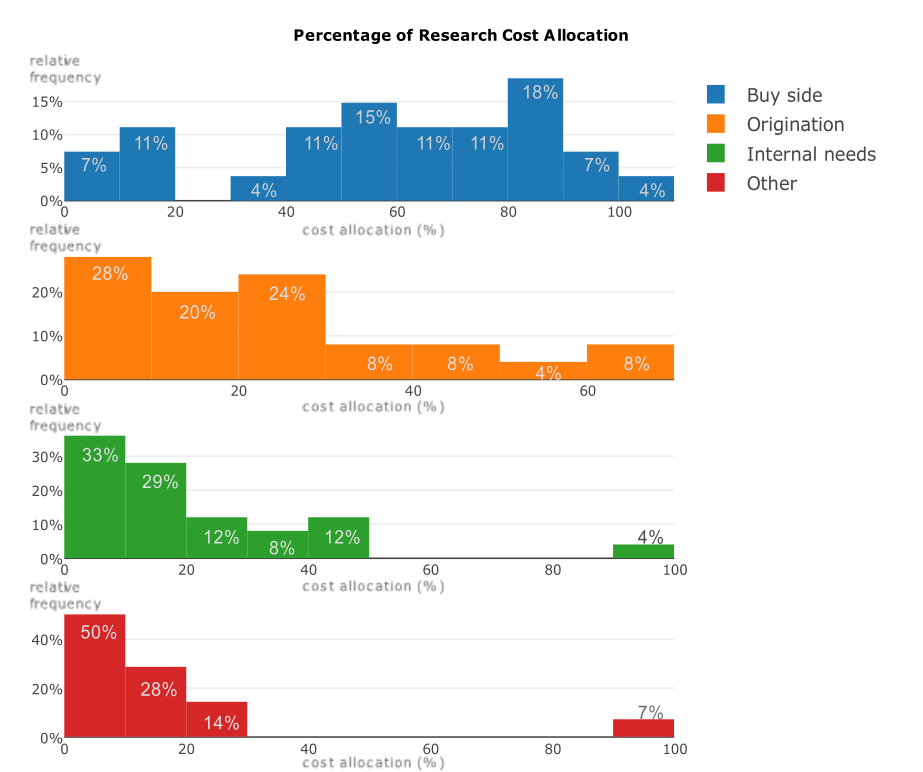
Note: The figure above correspond to question no.24 from the sell-side survey: ‘Could you provide a "guesstimate" of the allocation of the costs that your firm incurs in producing research (in a broad sense) between: Your buy-side customers, your underwriting and securities issuance activities (if any), your internal needs, other’.

Note: The figure above corresponds to question no. 23 of the sell-side survey: ‘Is the quality of your research a selling point for your underwriting/securities issuance activities (if you have them)?’
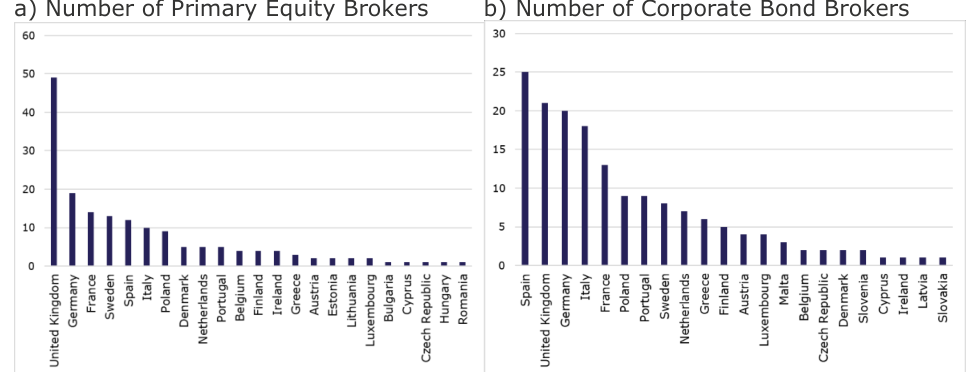
Note: League table data from Bloomberg and characteristics data such as firm headquarters[19] from Refinitiv. Panel a) shows the number of brokers by the country of headquarters in the EU that have been the managers of equity issuance for firms within the EU over the period 2015 to 2018. Panel b) shows the number of brokers by the country of headquarters in the EU that have been the managers of corporate bond issuance for firms within the EU over the period 2015 to 2018.
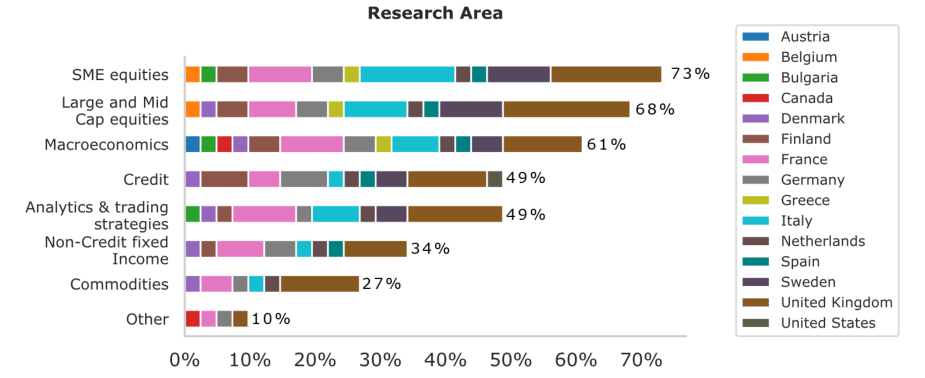
Note: The figure above corresponds to question no.15: ‘On which areas of research do you focus?’
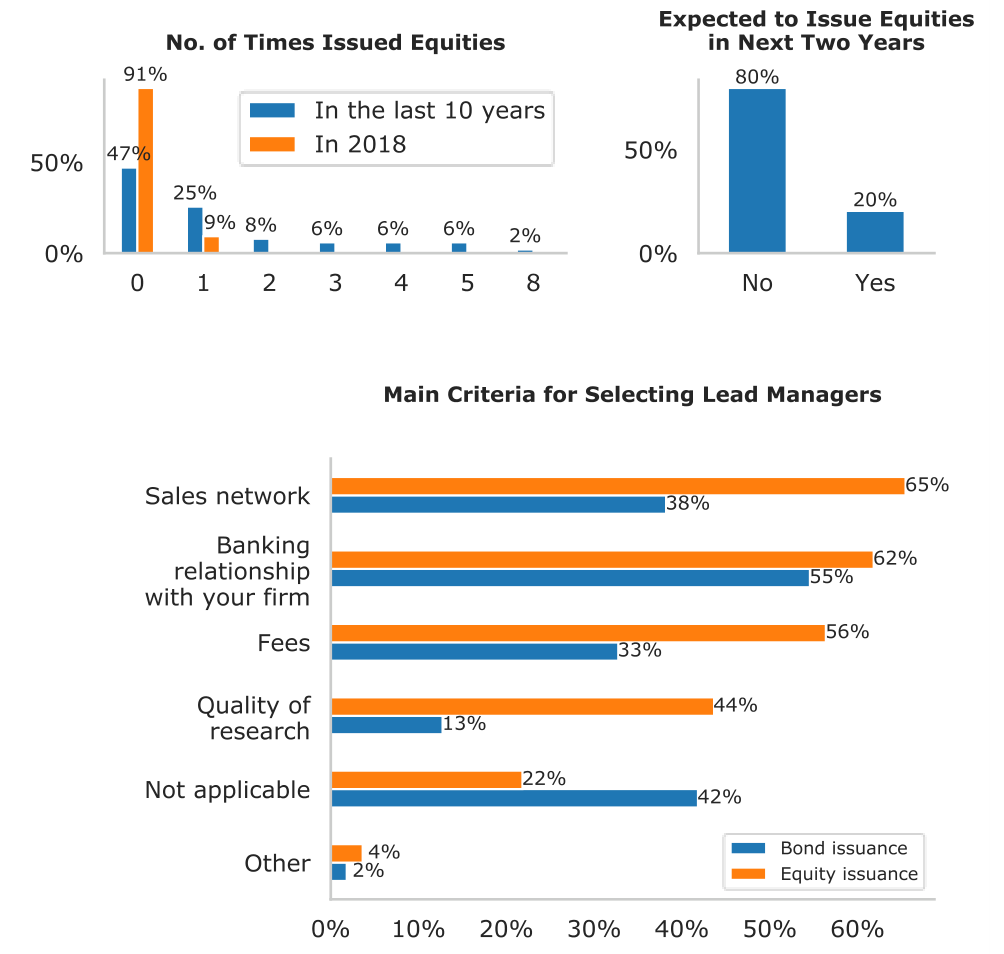
Note: The top left panel corresponds to question no.1 : ‘How many times have you issued equities either (i) in the last 10 years, or (ii) in 2018?’ The top right panel corresponds to question no.1 : ‘Are you expected to issue equities in the next two years?’ and the bottom panel corresponds to questions no.12&15: ‘What are the main criteria for selecting lead managers for your bond issuances?’ and ‘What will be the main criteria for selecting lead managers for your issuances?’
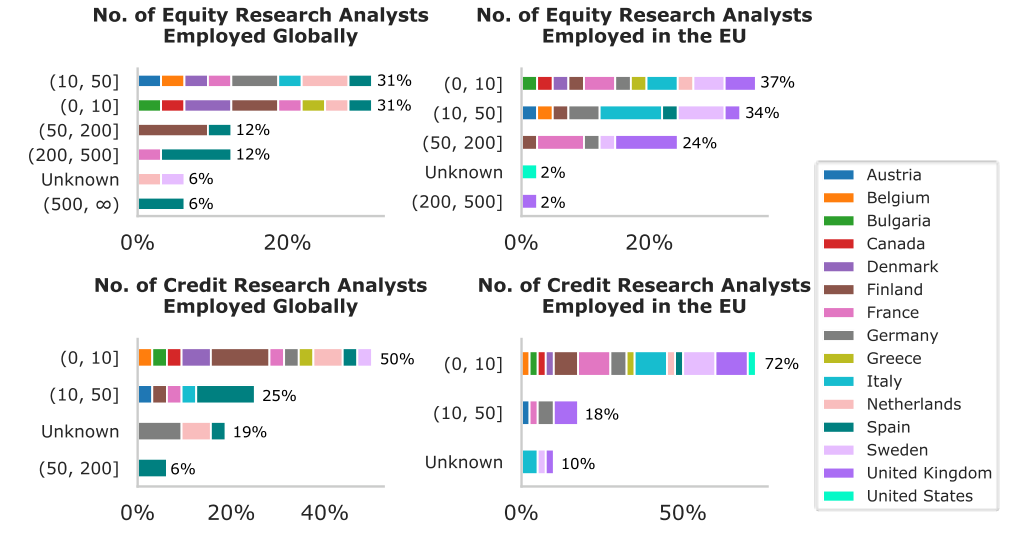
Note: The top panel correspond to questions no.16 from the sell-side survey: ‘How many internal equity research analysts are employed in your organisation (i) globally, and (ii) in the EU?’ The bottom panels correspond to question no.18: ‘How many internal credit research analysts are employed in your organisation (i) globally, and (ii) in the EU?’
| Domestic Foreign | HFI HFI | Domestic Foreign | HFI HFI | ||||||||
|---|---|---|---|---|---|---|---|---|---|---|---|
| Country | Count Count | HFI | All | Domestic Foreign | Country | Count Count | HFI | All | Domestic Foreign | ||
| Austria | 2 | 34 | 0.04 | 0.52 | 0.05 | Italy | 9 | 54 | 0.06 | 0.29 | 0.06 |
| Belgium | 3 | 29 | 0.07 | 0.44 | 0.08 | Latvia | 0 | 3 | 0.81 | n.a. | 0.81 |
| Bulgaria | 1 | 5 | 0.32 | 1.00 | 0.32 | Lithuania | 2 | 8 | 0.28 | 0.63 | 0.29 |
| Croatia | 0 | 5 | 0.37 | n.a. | 0.37 | Luxembourg | 0 | 90 | 0.05 | n.a. | 0.05 |
| Cyprus | 0 | 15 | 0.13 | n.a. | 0.13 | Malta | 0 | 11 | 0.18 | n.a. | 0.18 |
| Czech Republic | 1 | 19 | 0.11 | 1.00 | 0.11 | Netherlands | 4 | 100 | 0.04 | 0.37 | 0.05 |
| Denmark | 4 | 37 | 0.08 | 0.98 | 0.08 | Poland | 9 | 27 | 0.07 | 0.52 | 0.08 |
| Estonia | 1 | 11 | 0.14 | 1.00 | 0.14 | Portugal | 1 | 29 | 0.08 | 1.00 | 0.08 |
| Finland | 3 | 33 | 0.07 | 0.92 | 0.07 | Romania | 0 | 13 | 0.12 | n.a. | 0.12 |
| France | 14 | 69 | 0.05 | 0.23 | 0.05 | Slovakia | 0 | 6 | 0.30 | n.a. | 0.30 |
| Germany | 19 | 83 | 0.04 | 0.36 | 0.05 | Slovenia | 0 | 12 | 0.11 | n.a. | 0.11 |
| Greece | 1 | 32 | 0.05 | 1.00 | 0.05 | Spain | 13 | 59 | 0.05 | 0.29 | 0.06 |
| Hungary | 1 | 14 | 0.13 | 1.00 | 0.14 | Sweden | 13 | 51 | 0.06 | 0.30 | 0.07 |
| Ireland | 2 | 71 | 0.05 | 0.69 | 0.05 | United Kingdom | 45 | 123 | 0.05 | 0.30 | 0.05 |
Note: This table shows for each country, the number of managers for equity and corporate bond issuance over 2015 to 2018 and the percent which are headquartered in the same country. Underlying data is the league table data from Bloomberg.
2.3.2 Independent Research Providers of investment research
The primary focus of this study is on corporate investment research related to SME equities and corporate bonds (which implies interest in Credit and Equity research for bond issuers).
Relatively few IRPs provide firm-level equity or credit research. IRP participants in interviews suggested that this reflects the fact that creating teams of analysts with company level expertise is costly and challenging in the absence of other income streams (such as brokerage services) that can in part cover the expense. Many IRPs focus more on thematic research, sector-focused research, investment strategies and strategy generation. Some IRPs, in addition, provide bespoke research instead of functioning as a research publishing house and offer advisory and consulting services.
For the purposes of this study, it remains important to consider the impact of MiFID II on IRP-generated investment research. Before MiFID II was implemented, some suggested that the rules would offer opportunities to IRPs as they would be able to compete fairly with broker-based researchers that would no longer be able to bundle execution with their research.
To facilitate the analysis, a list of IRPs was constructed consisting either of members of the European Association of Independent Research Providers (EuroIRP)[21] or those IRPs that are ranked by Extel. In total, the list comprises 109 IRPs (of which 75 are members of EuroIRP).
Within the list, the few IRPs that provide firm-level equity research include Arete Research, Alpha Value, Agency Partners, IDMidCaps, the IDEA, Morningstar Research, News Street Research and On Field Investment Research.
To give some idea of the activities pursued by these firms, Arete Research offers longterm, thematic investment advice with a focus on about 100 technology and telecommunications companies globally. Alpha Value operates as an equity research firm covering about 462 European mid and large cap stocks. Agency Partners is an equity research firm that provides quarterly sector presentations, company access and meetings with key management, and bespoke research services. IDMidCaps is an equity research firm that specializes in French mid-cap equities research. Morningstar is a provider of independent equity, credit and fund investment research covering 1400
preferred or green bonds. Finally, a large bank told us that in bond issuance, banks win mandate because of their experience in raising money for similar firms. So, there is less of a link between research and primary markets. 21 List available at: https://euroirp.com/members/.
companies across all sectors globally. New Street Research is an independent research boutique focused on the Telecommunications and Technology sectors globally.
IRPs such as 13D Global Strategy & Research provide overall trends and analysis on topics such as credit markets, energy and Europe. This firm identifies three to five major investment themes each year holding them over five-year horizons or more. Absolute Strategy Research offers macroeconomic, equity strategy and asset allocation research and advice.
Moreover, some IRPs undertake consulting projects. Examples include Absolute Strategy Research, Capital Economics, CM Research, Consumer Edge Research, Creative Global Investments, Green Street Advisors, Longview Economics, Medley Global Advisors, Morningstar, Ned Davis Research and New Street Research.
Figure A2.9 in the Annex 2 describes the domicile and research area of the respondent IRPs. Most of the IPRs surveyed are domiciled in Western Europe (57%), followed by North America (36%) and Southern Europe (7%). On area of research, only 29% of the respondent IRPs cover SME equities and 21% cover credit securities.[22] About half of the IRP respondents cover large and mid-cap equities and 36% cover macroeconomics. Views of IRP respondents on the impact of MiFID II is discussed in Section 4.
2.3.3 Sponsored research
It is widely perceived that a greater proportion of research on small companies in Europe is paid for by issuers themselves, i.e., is sponsored. CFA Society (2019) reports that small- and mid-cap equity research could increasingly become the preserve of issuer-sponsored research (which already existed pre-MiFID II, but which is now gaining market share). This may potentially raise conflict-of-interest concerns among investors, leading to a less fair and effective market in the equities and corporate bonds of smaller and less liquid issuers.
Lee (2018a) (writing on Bloomberg) reports that a number of financial firms such as SEB AB and Kepler Cheuvreux have started to offer sponsored research[23] services. According to Lee (2018a) the number of corporates that pay Kepler Cheuvreux for sponsored research increased from 60 to 100 within a few months of the implementation of MiFID II and that the firm hopes to double the numbers for which they deliver sponsored research in the next few years. Among other firms mentioned by Lee, Oddo BHF has offered sponsored research for some years but MiFID II has reportedly allowed it to increase prices. Hardman and Co has a sponsored research department which grew 50% in the first half of 2018 compared to the previous year.
AlphaValue, a French IRP, offers sponsored research and has a client list of about 10 small-cap clients[24]. AlphaValue has been innovative in its response to MiFID II in that it has, for instance, started a crowdfunding solution, whereby it names a stock and encourages investors to co-finance the cost.[25] Only the stocks that gather enough funds are researched. It has also created an instant messaging service to facilitate easier communication between analysts and clients. Another example IRP is East Value Research which offers sponsored research with a particular focus on small and very small company stocks (Small-, Micro- and Nano-caps) in Eastern Europe[26].
Other firms that were already supplying sponsored research before MiFID II either increased their fees or enjoyed an increase in revenues following MiFID II. The Edison Investment Research (2016) report describes the growth in the number of firms or issuer-sponsored research as sell-side coverage diminishes. The report states that Edison Investment Research, one of the largest issuer-sponsored research houses, saw its coverage grow at a 22% compound annual rate. According to Lee (2018a), Edison Investment Research Ltd., charges £50,000 a year for coverage.
Some stock exchanges have begun to supply sponsored research. The German stock exchange Deutsche Börse, for instance, has endeavoured to provide research for its smaller firms. In March 2017, it launched a series of reports on its SME members which replaced the Entry Standard in the exchange-regulated market, obligatory for all equity issuers. These initial reports were written by Morningstar and Edison and the aim is that they be updated by two more reports each year.[27]
While sponsored research of SMEs has clearly expanded in multiple markets, many interviewees with whom we discussed the issue, including those engaged in its production, did not see it as a long-term solution to inadequate coverage in certain markets or of particular types of company. Providers told us that the profitability of supplying sponsored research is relatively low and multiple buy-side firms said they regard research paid for issuers as not fully reliable. It also appears that sponsored research is mainly available in markets in which coverage is already reasonably good including highly developed markets in Western Europe and Scandinavia.[28]
2.4 Investment firm consumers of investment research
So far, the report has focussed on suppliers of investment research. In this subsection, we describe asset manager consumers of investment research that responded to our survey.
Figure 2.7 presents characteristics of the buy-side survey respondents. A very large majority (87%) of the buy-side respondents are asset managers. Hedge funds and pension funds comprise very small fractions at 2% each. Additionally, 4% are private banks. Somewhat fewer than half (48%) of the respondents have research departments. Among buy-side firms that participated in interviews, the variation was very large between asset managers that had no internal research and others, particularly those focussed on bonds that relied almost exclusively on their own analysis.
Figure 2.7 suggests that Research on large or mid cap equities dominates the research areas on which respondents focus (at 83%). This is followed by a focus on credit of 72% and a focus on macroeconomics of 72%. A smaller majority of firms (55%) focus on research related to Small, Micro or Nano Cap equities.
Figure 2.8 shows the distribution of asset classes in which buy-side respondents invest. A large majority of the respondents invest in Large Cap (87%) and Mid Cap
(85%) equities. This is closely followed by Corporate Bonds at 82%, Small Cap equities at 78% and High Yield bonds at 76%. A much smaller fraction (35%) invest in Micro Cap equities. Only 16% of the buy-side respondents invest in Nano Cap equities.
classes do your funds invest?’
Figure 2.9 shows, perhaps surprisingly, that a large majority of the buy-side respondents have specialized funds for SME equities (81%) and High Yield bonds (74%). This fact is interesting in that it should provide a basic safety net for SME equity and credit research. Investors in these funds are likely to expect the offering institutions to be consumers of relevant research since the funds will be marketed to reflect a specialist investment theme.
We conclude that the buy-side firms in our sample are almost all long-only asset managers, mostly focussed on Equity research although large fractions are also consumers of Credit and Macro research. Most have a research department and surprisingly many have specialized funds focussing on SME equities and High Yield bonds.
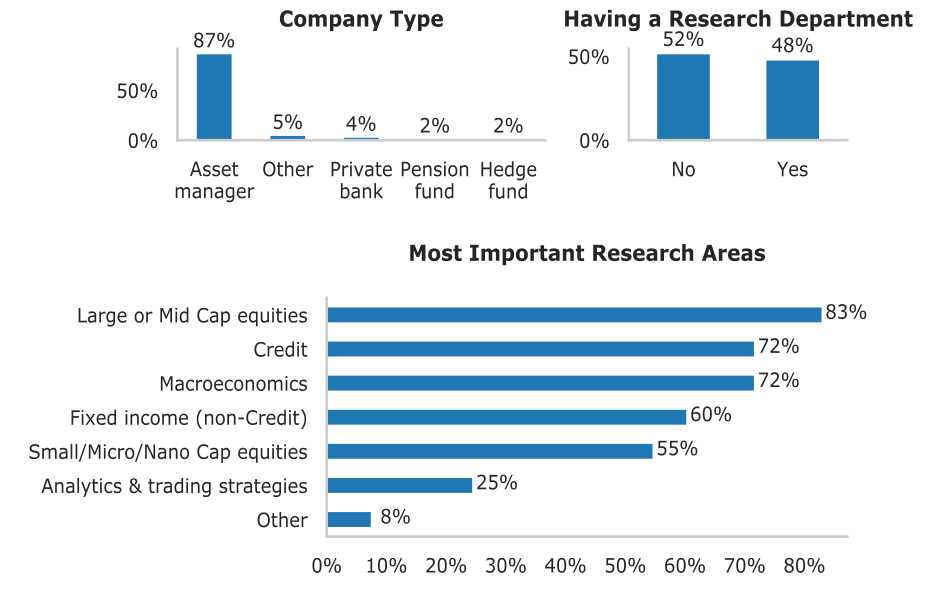
Note: The top left panel corresponds to question no.1 : ‘Which of the following best describes your firm?’ The top right panel corresponds to question no.1 : ‘Does your firm have a Research Department?’ The bottom panel corresponds to question no. 18: ‘Which areas of research are the most important for your business?’
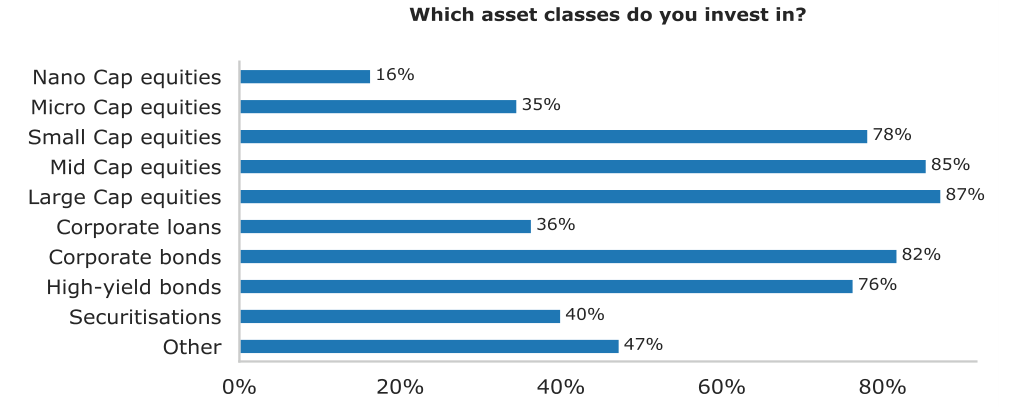
Note: The figure above corresponds to question no. 1 : ‘In which of the following asset
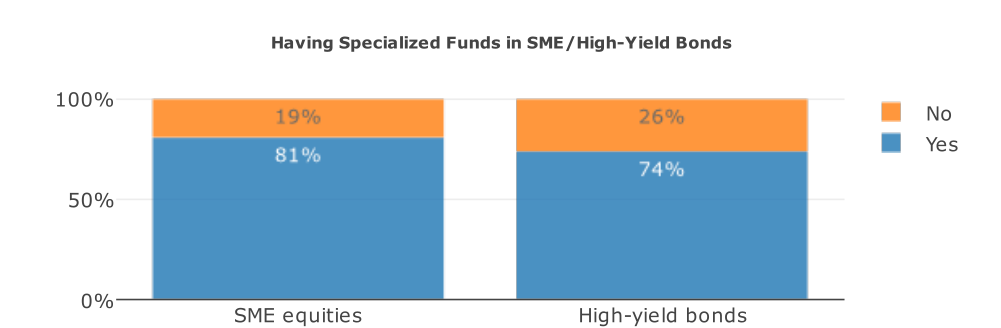
Note: The figure above corresponds to question numbered 14 & 15: ‘If you invest in SME (Small/Micro/Nano Cap) Equities, do you have specialised funds designated as such for this purpose?’ and ‘If you invest in High-yield bonds, do you have specialised funds designated as such for this purpose?’
2.5 Research coverage
2.5.1 Research activity and coverage for Europe and United States
This subsection shows how research activity and coverage vary across national markets. Section 5 below examines whether these indicators have been affected by MiFID II. Here, we will introduce the data and examine how levels of research activity as measures by coverage (fractions of firms for which at least some research is conducted and numbers of researchers by company) and volume (number of research reports per company per year) vary in the cross-section.
An important source of evidence on coverage and equity research volume is the I/B/E/S database of Refinitiv. These data permit one to study which research providers provide equity earnings forecasts for which individual company. Tracking these data over time, one can build up a detailed picture of the evolution of equity research for European countries. As a comparison, we include US firms as well in our analysis.
In using data from an aggregator like Refinitiv, one must take care to avoid biases introduced by the fact that some research providers have, over time, reduced the extent to which they contribute data (for example, either ceased to contribute at all or continued to contribute on an anonymous basis). To allow for this and to provide a suitable sample for our calculations, we focus on earnings forecasts by research providers that were present all through our sample period. We also examine reports relating to companies for which characteristic data (equity market capitalisation for example) were available for the whole period. This means eliminating firms that started up or were taken over or became insolvent during the sample period.
The resulting dataset may be regarded as homogeneous through the sample period. Changes in coverage or research activity associated with closures or mergers of existing brokerages or the emergence of new brokerages would not show up in our results. Nor would changes in research activity associated with the new companies or those that became defunct for some reason during the period of years we covered.
Box 2.3 provides detailed information about the data employed.
Box 2.3: Introducing the I/B/E/S Data This box describes the nature of research coverage for European and US companies. The data employed is based on information taken from the I/B/E/S dataset and data on firm market capitalisation from Eikon from Refinitiv.
We focus on a set of key indicators of research activity: coverage ratio (the fraction of companies for which at least one earnings forecast is available), the average number of reports per company in a given year, the average number of reports per covered company, the average number of broker per company and the average number of companies per broker. For each of these, we calculate levels in four years 2015 to 2018 and annual percentage changes for 2016 to 2018.
Results are broken down by groups of country. The six country groups we consider are EU, Non- UK EU, Eastern, Western, Southern, Northern Europe and the United States. We also break results down by the market capitalisation of the firms in question. Specifically, we calculate results for Nano, Micro and Small Cap companies and Non-SME companies (which comprise all the rest).
We first obtained a list of listed companies registered in the EU member states and the United States through Eikon from Refinitiv. Then, from the I/B/E/S database, we collected all Earnings per Share (EPS) forecasts for which the forecasted periods are from FY 2005 to FY2023 and the report is submitted before 04/02/2019. This approach enables us to collect effectively all EPS forecast data as the EPS forecasts are rarely made for a period beyond 5 years from the forecast date. Contributors of forecast reports comprise sell-side firms and independent research providers, but the large majority are brokers. We adopt the I/B/E/S approach of referring to contributors as brokers.
The I/B/E/S dataset stretches back as far as early 2000s but forecast records are relatively scarce in the early years, compared to the period post-2013. We choose to limit our study to reports submitted during the period from January 2013 to February 2019. We believe this sample period is sufficiently long and reduces possible problems from changes in the coverage of the I/B/E/S system early on in its history.
regression analysis, we examine a potential complication with the I/B/E/S data relevant for our analysis, namely the reduced willingness of brokers to contribute earnings estimates to aggregators such as I/B/E/S. Our hypothesis is that if a broker decides to cease to participate in the aggregation provided by I/B/E/S, they do so for all the stocks they cover and not for a subset of stocks. Hence, if we require that a broker remain in the sample over the whole period, we remove the bias induced by progressive anonymisation.
For each month in the period from January 2015[29] to January 2019, we count number of named and masked brokers which has submitted forecast reports on EU companies within that month. Figure 2.10 shows how the numbers evolve over time. While the number of anonymised brokers stays stable through the whole sample period, number of named brokers decrease over time. This trend is accelerated since 2018. From January 2015 to January 2018, number of named brokers dropped from 199 to 175. In January 2019, there are only 158 named brokers.
We have tackled this issue (which tends to reduce coverage as measured by the I/B/E/S data even when, in fact, research is still being conducted) by creating a subset of the I/B/E/S data in which the set of brokers and companies is held constant over time.
We have selected companies that went public before January 2015 and have remained listed without being bankrupt by the end February 2019. This ensures our company sample is constant overtime.
We also hold brokers and other sell-side organisations fixed over the period. (I/B/E/S dataset handles cases where merger and acquisition happen among brokers. Historical data reported by the impacted broker will remain under the stopped Estimator ID and will not be moved to the surviving Estimator. This ensures that we can effectively exclude impacted brokers.) The reason is that we wish to avoid the possibility that, part way through our sample period, some brokers may either have started to supply their forecasts to I/B/E/S or others may have ceased to contribute their forecasts even though they have continued to provide forecasts to consumers of their research. Such occurrences would obscure the changes that we seek to observe, namely changes in the volume of broker research that is supplied to investors.
In this context, it is instructive to consider survey evidence from the sell-side on how much they contribute to aggregators. Figure 2.11 presents the results of the sell-side survey on earnings forecasts. The largest fraction of the sell-side respondents (46%) have not reduced their contribution of earning forecasts to aggregators which is closely followed by 44% of the respondents that have reduced their forecast contribution to the aggregators. Additionally, a large majority (73%) of the sell-side respondents view that MiFID II has reduced the usefulness of consensus forecasts.
The fraction that says they have reduced contributions to aggregators is much larger than the indications we receive from analysing the I/B/E/S data. It may be that the sell-side respondents have in mind aggregators other than I/B/E/S or that they continue to contribute data but no longer identify themselves on the system. (An increasing number of sell-side firms appear to have moved to being anonymous on the system.[30]) One may also note the very large fraction of respondents who see aggregator-supplied forecasts as being less useful guides for the market following MiFID II. Again, this may possibly pertain less to I/B/E/S than to other data.
Table 2.5 shows the average levels and yearly changes of a set of indicators of research activity and coverage during the period 2015 to 2018. Levels and year-onyear changes per year are provided in Annex 5 for each country and region. As described in Box 2.3, the companies for which we have earnings forecasts and the brokers and other sell-side organisations that provide them are held constant throughout our analysis.
The results show very marked differences in the degree of development of the research environment for companies of different sizes and different European regions. The environment for Eastern and Southern Europe appears reasonable for larger companies but for Nano and Micro Caps the levels of research evidenced by our results are very poorly developed. Also, there is strong evidence of negative trends in the research environment for smaller firms in Eastern and Southern European regions.
What observations may one draw from Table 2.5?
• For Small Caps, again percentages of firms covered are somewhat similar across regions although, on yearly average, 55% of Southern and 53% of Eastern European companies were covered compared to 67% in Northern Europe. EU average coverage ratio is 64%, which is very close to the 65% coverage ratio for EU excluding UK. The average coverage ratio in EU is higher than coverage ratio of United States, which is 61%.
• For Micro and even more for Nano Cap companies, the regional discrepancies in earnings forecast coverage become much more striking. A mere 3% of Eastern European Nano Cap companies have earnings forecasts compared to 30% of Western European Nano Caps.
• Reports per Company (see the second block of numbers in Table 2.5) are highest for Northern European Non-SMEs with 168 per year, followed by Western Europe, which has 148 reports per company. Southern and Eastern Europe, while somewhat fewer reports still exhibit reasonable numbers of earnings forecasts, 121 and 73, respectively.
• For Non-SME companies, the fractions that are covered by earnings forecasts are similar across regions. United States has a slightly higher coverage ratio of 93% as compared to 89% for Europe. Note that the Non-SMEs include some investment and property companies which explains why about 13% are not covered by earnings forecasts even in advanced markets like the UK.
• Reports per company drop off substantially as the market cap of firms is reduced, particularly for Micro and Nano Cap companies. Southern and Eastern European Nano Cap companies averaged 0.5 and 0.2 reports per company compared to 3.2 for Western Europe. One may note that Northern European Nano Caps average fewer earnings reports per annum than Western European companies, namely 2.0 rather than 3.2.
• Much of the variation in the Reports per Company reflects the different coverage percentages across groups of countries. To eliminate this effect, the third block of numbers in Table 2.5 shows Reports per Covered Company. These again vary across regions and are somewhat lower for companies from Southern and Eastern European countries than those from Western Europe. But the drastic reductions in numbers of report per company as market cap declines are not present for these statistics. The ratio of Reports per covered company for Southern and Western Europe Small cap companies is 0.8, much greater than the corresponding ratio for companies overall.
• The fourth block of numbers in Table 2.5 shows the average number of brokers that supply earnings forecasts for each company. For Non-SMEs, the figures are comparable for different regions with the exception of Eastern Europe, for which the numbers are noticeably lower. The pattern remains true for smaller cap firms. Nano Cap Eastern European companies have, on average 0.05 brokers providing earnings estimates compared to 0.49 for Western Europe companies, a multiple of about 10 times.
• The last block of numbers in Table 2.5 shows companies per broker. An average broker in our example covers more Northern European and Western European companies than Southern and Eastern European companies. The fact that there are distinctively more US companies covered by an average broker reflects the fact that around half of our company sample consists of US companies.
• This is consistent with smaller brokers in Eastern Europe and also, possibly, brokers that do not provide research. For smaller cap companies, the qualitative pattern remains the same as for Non-SMEs although it is noticeable that the number of Nano Cap companies per broker is particularly small for Southern Europe, again suggestive of the fact that brokers in that region may be research inactive.
• The results show consistent trend declines in coverage rates for smaller companies, particularly Nano Caps. All percentage changes for Nano Caps are negative, including United States. Southern and Eastern European companies are those that suffer the most. There is a slight increase of coverage ratio of Small Caps. Non-SMEs coverage ratios are almost stable over the period for all regions.[31]
• In the case of Reports per Company (see the second block in Table 2.5), the declines are even more pronounced for Nano and Micro Caps. The Northern and Western European companies are exceptions with small losses over several years. But in Southern and Eastern Europe, clear negative trends are apparent.
• For larger cap companies, Reports per Company are stable, with the exceptions of Eastern Europe, which has an 11% average decline. Different from European companies, US non-SMEs has a 4% increase in reports per company.
• The third block of numbers shows Reports per Covered Company. These also show trend declines in most European regions, with substantial drops in Southern and Eastern Europe especially for Nano and Micro Caps. The declines in reports per covered companies is not as drastic as declines in reports per company, indicating the decline in reports per company is a result both decreased coverage ratio and decreased coverage of companies being covered.
• The number of brokers providing earnings forecasts per company shows consistent declines especially for smaller companies. Very substantial falls in broker numbers per company are evident for Southern European companies.
• The percentage changes in numbers of companies per broker are the same as those for brokers per company. This reflects the fact that the statistics are calculated for a fixed set of brokers and companies.
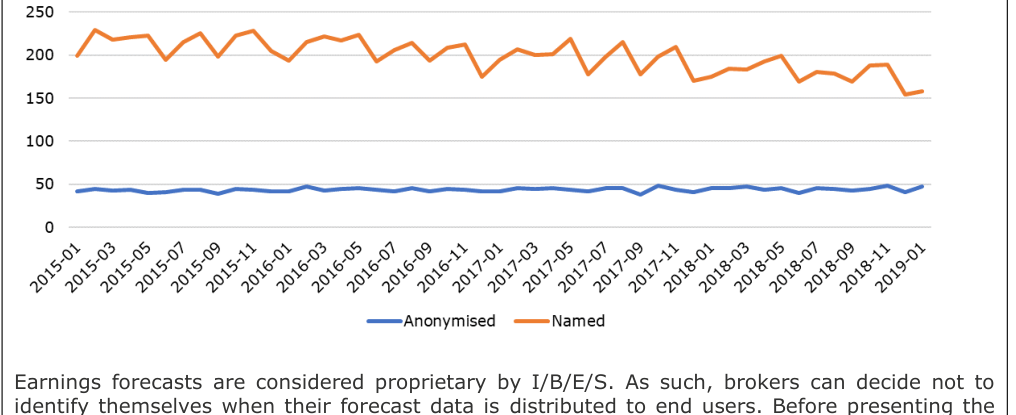
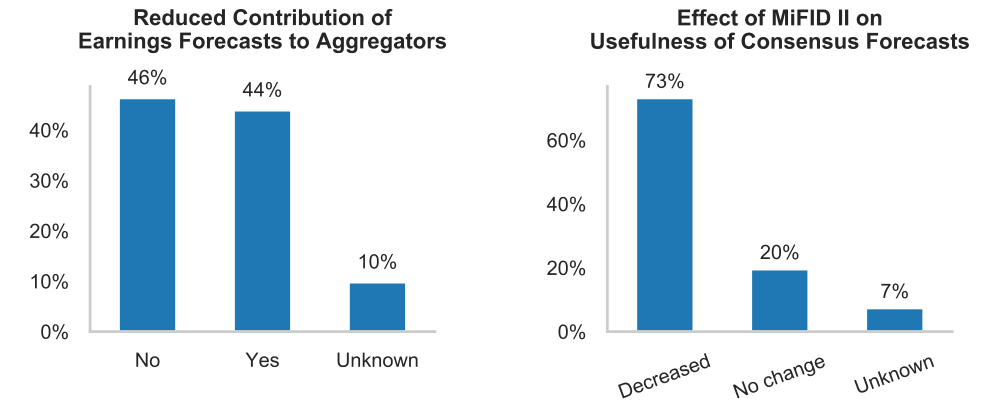
Note: The left panel corresponds to question no. 0: ‘Has your firm reduced the extent to which it contributes earnings forecasts to aggregators?’ The right panel corresponds to question no. 1: ‘In your view, how has MiFID II affected the usefulness of consensus forecasts?’
| EU | 13.4 | 44.8 | 64.2 | 89.0 | -5.4 | 0.1 | 1.0 | 0.0 | |
|---|---|---|---|---|---|---|---|---|---|
| EU excl. | UK | 9.2 | 40.8 | 65.1 | 89.8 | -6.3 | -0.4 | 1.5 | 0.1 |
| Eastern | Europe | 3.2 | 29.9 | 53.2 | 86.1 | -8.0 | -4.7 | 2.5 | 0.9 |
| Western | Europe | 30.2 | 55.0 | 66.6 | 88.0 | -4.5 | 1.4 | 0.0 | 0.1 |
| Southern | Europe | 4.8 | 28.3 | 55.3 | 91.1 | -9.8 | -3.3 | 2.5 | 0.0 |
| Northern | Europe | 14.7 | 46.5 | 67.9 | 90.3 | -5.8 | 0.8 | 1.9 | -0.1 |
| United | States | 5.6 | 33.2 | 60.5 | 93.1 | -7.3 | 1.5 | 1.0 | 0.0 |
| IBES | Reports per | Company | |||||||
| EU | 1.5 | 8.0 | 26.2 | 144.8 | -5.5 | -2.0 | -0.1 | -0.1 | |
| EU excl. | UK | 1.1 | 7.3 | 23.8 | 143.9 | -7.4 | -2.4 | -1.8 | 0.2 |
| Eastern | Europe | 0.2 | 2.9 | 12.5 | 72.9 | -12.9 | -8.8 | -10.6 | -12.1 |
| Western | Europe | 3.2 | 9.9 | 29.6 | 146.1 | -4.1 | 0.1 | 1.4 | 0.6 |
| Southern | Europe | 0.5 | 4.5 | 19.7 | 121.1 | -23.0 | -14.4 | -5.2 | -0.1 |
| Northern | Europe | 2.0 | 9.8 | 27.8 | 168.7 | -3.9 | -0.2 | 0.5 | -0.3 |
| United | States | 1.8 | 11.8 | 35.0 | 151.3 | -13.8 | -2.7 | 0.6 | 3.7 |
| IBES | Reports per Covered | Company | |||||||
| EU | 11.1 | 17.9 | 40.8 | 162.7 | -0.1 | -2.1 | -1.1 | -0.1 | |
| EU excl. | UK | 12.4 | 17.9 | 36.6 | 160.2 | -1.1 | -2.0 | -3.3 | 0.1 |
| Eastern | Europe | 7.6 | 9.7 | 23.6 | 84.8 | -5.3 | -4.2 | -12.7 | -12.9 |
| Western | Europe | 10.8 | 18.0 | 44.5 | 166.0 | 0.4 | -1.3 | 1.4 | 0.5 |
| Southern | Europe | 10.5 | 15.9 | 35.7 | 133.0 | -15.1 | -11.5 | -7.5 | -0.1 |
| Northern | Europe | 13.3 | 21.2 | 41.0 | 186.8 | 2.0 | -0.9 | -1.4 | -0.1 |
| United | States | 32.9 | 35.6 | 57.9 | 162.4 | -6.9 | -4.1 | -0.4 | 3.8 |
| IBES | Brokers per | Company | |||||||
| EU | 0.22 | 1.03 | 2.82 | 12.42 | -7.4 | -1.5 | 0.1 | -0.5 | |
| EU excl. | UK | 0.15 | 0.89 | 2.54 | 12.32 | -8.5 | -1.3 | -0.6 | -0.4 |
| Eastern | Europe | 0.05 | 0.48 | 1.86 | 8.14 | -8.1 | -4.5 | -5.4 | -8.0 |
| Western | Europe | 0.49 | 1.31 | 3.19 | 12.53 | -6.2 | -1.2 | 0.9 | 0.0 |
| Southern | Europe | 0.08 | 0.62 | 2.40 | 11.83 | -15.4 | -10.3 | -3.1 | -0.4 |
| Northern | Europe | 0.23 | 1.13 | 2.67 | 13.29 | -8.2 | 1.7 | 1.1 | -0.9 |
| United | States | 0.18 | 1.21 | 3.39 | 12.95 | -15.8 | -3.9 | -1.2 | 1.1 |
| IBES | Companies per | Broker | |||||||
| EU | 0.50 | 0.79 | 1.96 | 9.04 | -7.4 | -1.5 | 0.1 | -0.5 | |
| EU excl. | UK | 0.33 | 0.58 | 1.42 | 7.55 | -8.5 | -1.3 | -0.6 | -0.4 |
| Eastern | Europe | 0.53 | 0.64 | 1.63 | 3.19 | -8.1 | -4.5 | -5.4 | -8.0 |
| Western | Europe | 0.59 | 0.78 | 2.09 | 9.32 | -6.2 | -1.2 | 0.9 | 0.0 |
| Southern | Europe | 0.12 | 0.43 | 1.17 | 7.34 | -15.4 | -10.3 | -3.1 | -0.4 |
| Northern | Europe | 0.60 | 1.19 | 2.47 | 12.21 | -8.2 | 1.7 | 1.1 | -0.9 |
| United | States | 4.27 | 5.93 | 19.24 | 98.78 | -15.8 | -3.9 | -1.2 | 1.1 |
2.5.2 Research coverage for selected countries
Table 2.6 presents the investment research indicators for a selection of representative countries for each region. Three countries from Western Europe (Belgium, France, United Kingdom), two countries from Northern Europe (Germany, Sweden), one country each from Eastern (Poland) and Southern Europe (Italy) are considered.
The table shows that coverage rates differ significantly for Nano Caps but, for all larger company sizes, rates are high[32] and, in many cases growing over time. For Nano Caps, UK coverage is much higher than that of other countries while coverage in Poland is lowest. Surprisingly, Germany exhibits a strong negative trend in Nano Cap coverage rates. Other countries, except Sweden, show slight negative trends.
Reports per company vary more noticeably across countries. Germany, France and the UK have high numbers of reports per company for most size categories. France has relatively high numbers for Nano Cap and Small Caps. Belgium has a large number of reports per company for Nano Caps but not for other size categories relative to other leading countries. (For Small Caps and Non-SMEs, the reports per company for Belgium are lower than for Poland.) The figures on brokers per company shown in the fourth block of statistics in the table differ, in the overall pattern of results, from the findings for reports per company.
The numbers of reports per company decline for Nano caps in all example countries, with Italy and Belgium having the greatest declines, followed by Germany and Poland. Poland has an overall decline for all company sizes. Trends for brokers per company, as shown in the fourth block of the Table, show a similar pattern. However, for number of brokers per company, Germany’s Nano caps have the most negative trend.
Germany has higher number of reports per covered company for almost all company sizes, followed by France and UK. However, for Nano caps, Belgium covered companies have distinctively higher number of reports than other countries. Consistent with trend of reports per company, Italy and Poland companies have decreasing number of reports per covered companies for companies in almost all sizes.
From this table of selected countries, one can see a pattern which is roughly consistent with regional results. Representative countries of Southern and Eastern Europe, Italy and Poland, have lower values for multiple indicators than other countries, as well as more significant contractions. Whether the contraction is due to a single “2018 effect”, or a gradual trend over the time period, is a question to explore in subsequent sections.
Overall, the I/B/E/S data provide important perspectives on recent developments in the research environment for companies in Europe. We create a consistent and comprehensive dataset comprising all the EU firms included in the Eikon from Refinitiv dataset and then search to establish which of these are covered in I/B/E/S in the sense that earnings forecasts are available.
Our results show very marked variations across regions. Eastern and Southern European firms enjoy very substantially worse research coverage that more advanced regions, holding firm size constant. In addition, clearly negative trends are evident in the research coverage within these regions. There is some indication of a general contraction in research coverage across Europe in 2018. The magnitude of the contraction tends to be greater for smaller firms and again is most marked for Eastern and Southern Europe.
| Belgium | 13.0 | 53.3 | 78.2 | 89.5 | -3.6 | 0.0 | 2.8 | 2.0 |
|---|---|---|---|---|---|---|---|---|
| France | 24.8 | 51.7 | 72.8 | 90.9 | -3.9 | 2.4 | 0.8 | 0.0 |
| Germany | 17.1 | 54.1 | 68.9 | 87.9 | -11.1 | 2.1 | 0.0 | -0.9 |
| Italy | 11.8 | 43.0 | 66.3 | 92.9 | -5.8 | -6.0 | 3.6 | -0.5 |
| Poland | 5.6 | 45.1 | 75.0 | 94.8 | -4.9 | 3.2 | 6.1 | 1.5 |
| Sweden | 10.8 | 38.1 | 62.9 | 92.1 | -0.4 | -0.8 | 5.7 | 1.1 |
| United Kingdom | 37.8 | 57.2 | 62.0 | 86.7 | -4.1 | 1.2 | -0.4 | -0.1 |
| IBES | Reports per | Company | ||||||
| Belgium | 4.0 | 6.7 | 13.6 | 83.4 | -13.6 | 15.8 | 0.0 | 3.3 |
| France | 3.1 | 10.0 | 22.0 | 159.1 | -3.6 | 5.3 | 4.2 | 1.6 |
| Germany | 2.3 | 12.2 | 33.9 | 195.2 | -9.7 | -0.6 | -0.7 | 0.8 |
| Italy | 1.1 | 6.1 | 10.9 | 113.8 | -24.2 | -8.9 | 0.7 | 1.4 |
| Poland | 0.4 | 5.1 | 21.2 | 93.8 | -8.5 | -5.4 | -10.0 | -12.5 |
| Sweden | 1.1 | 6.0 | 17.6 | 130.3 | -0.2 | 8.5 | 7.4 | -4.6 |
| United Kingdom | 3.5 | 10.3 | 32.0 | 147.6 | -1.8 | -0.8 | 3.2 | -0.9 |
| IBES | Reports per Covered | Company | ||||||
| Belgium | 30.7 | 12.6 | 17.5 | 93.2 | -6.6 | 15.8 | -2.6 | 1.2 |
| France | 12.3 | 19.3 | 30.2 | 175.1 | 0.6 | 2.7 | 3.6 | 1.7 |
| Germany | 13.7 | 22.6 | 49.2 | 222.1 | 1.8 | -2.6 | -0.7 | 1.7 |
| Italy | 8.9 | 14.1 | 16.5 | 122.5 | -18.5 | -3.2 | -2.8 | 2.0 |
| Poland | 7.8 | 11.3 | 28.7 | 99.3 | -3.7 | -10.0 | -14.8 | -13.8 |
| Sweden | 10.6 | 15.8 | 27.9 | 141.5 | 0.0 | 9.8 | 1.6 | -5.7 |
| United Kingdom | 9.2 | 17.9 | 51.7 | 170.3 | 2.4 | -2.2 | 3.6 | -0.7 |
| IBES | Brokers per | Company | ||||||
| Belgium | 0.3 | 0.9 | 1.7 | 7.9 | -9.5 | 7.6 | 13.1 | 4.3 |
| France | 0.4 | 1.0 | 2.2 | 13.1 | -5.1 | 3.4 | 3.2 | 0.3 |
| Germany | 0.3 | 1.6 | 3.7 | 16.7 | -13.3 | 2.5 | 0.0 | -0.4 |
| Italy | 0.2 | 0.8 | 1.4 | 10.1 | -6.3 | -6.9 | -0.5 | 0.3 |
| Poland | 0.1 | 0.9 | 3.1 | 10.3 | -3.8 | 2.8 | -4.3 | -7.6 |
| Sweden | 0.1 | 0.5 | 1.4 | 9.3 | -0.5 | 3.4 | 7.8 | -4.1 |
| United Kingdom | 0.6 | 1.5 | 3.5 | 12.7 | -5.7 | -1.8 | 1.3 | -0.8 |
| IBES | Companies per | Broker | ||||||
| Belgium | 0.3 | 0.2 | 0.8 | 4.8 | -9.5 | 7.6 | 13.1 | 4.3 |
| France | 1.0 | 1.2 | 2.2 | 14.7 | -5.1 | 3.4 | 3.2 | 0.3 |
| Germany | 0.9 | 2.2 | 4.1 | 19.2 | -13.3 | 2.5 | 0.0 | -0.4 |
| Italy | 0.3 | 1.1 | 1.1 | 11.7 | -6.3 | -6.9 | -0.5 | 0.3 |
| Poland | 1.6 | 1.6 | 4.6 | 7.8 | -3.8 | 2.8 | -4.3 | -7.6 |
| Sweden | 0.6 | 0.7 | 1.9 | 9.8 | -0.5 | 3.4 | 7.8 | -4.1 |
| United Kingdom | 1.9 | 2.4 | 6.2 | 20.8 | -5.7 | -1.8 | 1.3 | -0.8 |
2.6 Research award winners
One may obtain interesting perspectives on the European market for investment research by studying the types of research providers that wins awards for their research and how this has changed over time. In this section, we analyse the winners of Refinitiv StarMine Analyst Awards and Extel Broker Awards. We focus on the distribution of awards across global-, large-, small-bank and non-bank brokers. The results show the relative numbers of these institutions and what fraction of elite researchers they contribute.
Note that StarMine and Extel represent very contrasting types of awards. StarMine awards are won for absolute forecasting performance (and, thus, are scientifically based) while Extel awards are survey based and, hence, are more indicative of general research reputation. It will prove interesting to consider how success for different types of research supplier has evolved in these two contrasting measures of research quality.
Specifically, Refinitiv StarMine Analyst Awards provide prizes for leading stock pickers and earnings forecasters for Europe as a whole and for some regions and individual countries. Their measure is based on actual analyst performance as reflected in data on earnings forecasts from the Refinitiv I/B/E/S database. The ‘Top Stock Pickers Award’ is derived from analysts' industry excess returns relative to an industry benchmark. The ‘Top Estimate Earnings Award’ is based on the industry estimate score, which measures the accuracy of the estimated earnings.
The Extel Broker Awards are a very different type of accolade for research in that brokers in different aggregations and regions are ranked based on a compilation of weighted votes received in the team/firm voting areas. Such a survey-based exercise is less scientific and statistical but gives an idea of broad shifts in the research reputations of analysts or their institutions.
Both StarMine and Extel awards relate to research performance in the year previous to the announcement year. Here, awards are labelled according to the year in which research performance is assessed. For StarMine Awards, currently available data consists of awards for the years 2007 to 2018 inclusive. For Extel Awards, currently available data consists of awards for the years 2014 to 2018. Four types of broker are differentiated namely: (i) Global banks and investment banks, (ii) Large banks and investment banks, (iii) Medium and small banks and (iv) Non-bank brokerages.
The objective of the current exercise is to characterise the type of institutions that supply high quality investment research for the European equity market and to establish what trends are discernible in the data. Box 2.4 provides detailed information on the StarMine and Extel awards data.
Table 2.7 shows the numbers of brokers studied broken down by type. Mid-sized and small banks constitute the largest category followed by non-bank brokers. Large banks and investment banks are almost eight times more numerous than the ten institutions that we include in the global bank and investment bank category. The fraction of midsized and small banks that win awards is small but they still make up the majority of award winners overall.
Figure 2.12 shows the number of awards won by different type of brokers. In all years, for both stock-picker and earnings estimator categories, the largest number of awards is won by the mid-sized and small banks. From Table 2.7, these institutions are numerically the largest category of research providers (being a hundred times more numerous that the global banks and investments banks in the case of the StarMine Awards). Mid-sized and small banks attract slightly more than half of all awards. Since they are so much more numerous, they are likely, just because of chance, to win a larger share of statistically based forecasting awards. Below, we will present regression results that shed more light on forecasting quality.
From the plots in Figure 2.12, we may observe that for top stock pickers and top earnings estimators, the number of awards won by global banks or investment banks exhibits a decreasing trend. The same is true of non-bank brokers. Mid-sized and small banks exhibit largely flat trends in numbers of awards won. Mid-sized and small banks exhibited an upward trend, particularly for top stock pickers, but this was reversed in the last period covered (2018), leaving long term trend close to flat. The regression analysis presented in a subsequent section will shed light on whether this observation is significant or lies within the range of year to year fluctuations one may expect to see in the data.
Results in Figure 2.13 suggest distinct trends in the accuracy of forecasts and the reputation of research providers. The StarMine awards reflect statistically generated rankings based on forecast accuracy. In this case, mid-sized and small banks have increased the number of awards they win suggesting growth in specialist, high-quality research by these providers. Global banks have enjoyed less success, suggesting the quality of their research, as measured by statistical accuracy, has declined. The Extel awards are survey-based and more reflective of general reputation. These have shown much less movement suggesting that large research providers with big brands retain a grasp that is hard to shift.
Box 2.4: Awards Data We downloaded the industry analyst awards data from the Refinitiv website (https://www.analystawards.com/). The data cover five European regions or countries: (i) Europe, (ii) France, (iii) Germany, (iv) Iberia and (vi) Nordic, and includes awards for the years 2008 to 2019. Awards are given to two analyst categories:
• Top stock pickers: The award result in each year is based on research performance pertaining to the previous calendar year.
• Top Earnings Estimators: Until 2011, the award result in each year was based on research performance in the previous calendar year. Since 2012, the result in each year has been based on performance in the previous financial year (usually from April 1st in the previous year to March 31st in current year).
The Extel broker award data in the analysis is the broker award data provided by Extel. The broker award is aggregated by different European regions or countries from year 2015 to 2019.
The awards we study include three types:
• Overall Research Award: data broken down by 5 region/countries- France, Germany, Italy, Nordic Countries and United Kingdom for all the 5 years.
• Economics & Strategy Research Award: data broken down by 3 region/countries- France, Germany and United Kingdom for all the 5 years.
• Equity Sector Research Award: data broken down by 5 region/countries- France, Germany, Italy, Nordic Countries and United Kingdom for all the 5.
The list of brokers we employ consists of:
• brokers who won at least 1 award in the StarMine Analyst awards in the period 2008 to 2018,
• brokers who won at least 1 award in the Extel broker award in the period 2015 to 2019, brokers who are involved in the Europe issuance between 2015 and 2019.
• The brokers involved in the European issuance are identified from Bloomberg League tables for brokers underwriting equity and corporate issues in Europe from 2015 to 2019, using the following criteria:
• We exclude Structured Notes, Asset Backed Securities, Schuldschein, Var Redemption, Convertible Securities and Retained Deal.
• The maturity length, call length and put length of the deal should be above 540 days.
• The deal should have no Self Led Transaction or the Self Led Transaction Amount should be greater than 5 million EUR. The deal should be creditable.
For all the brokers in the list, we download the organisation’s common name, registration country, industry and total assets from Eikon from Refinitiv. Based on the Refinitiv Industry Group and the total assets in 2018, we categorise the brokers into four groups:
1. Global banks or investment banks - These consist of the following 10 banks: Goldman Sachs, JP Morgan, Morgan Stanley, Citi, Bank of America Merrill Lynch, Deutsche Bank, UBS, Barclays, Credit Suisse, BNP Paribas
2. Other large banks or investment banks - These brokers satisfy the following criteria: a. The Refinitiv Industry Group is “Banking Services” or “Investment Banking & Investment Services” b. The total assets in 2018 is above 200 billion Euro c. They are not in the Global banks or investment banks list
3. Mid-sized and small banks - These brokers satisfy the following criteria: a. The Refinitiv Industry Group is “Banking Services” or “Investment Banking & Investment Services” b. Total asset in 2018 is below 200 billion Euro or is not available
4. Non-bank - These brokers satisfy the following criteria: a. The Refinitiv Industry Group is neither “Banking Services” nor “Investment Banking & Investment Services” or is null
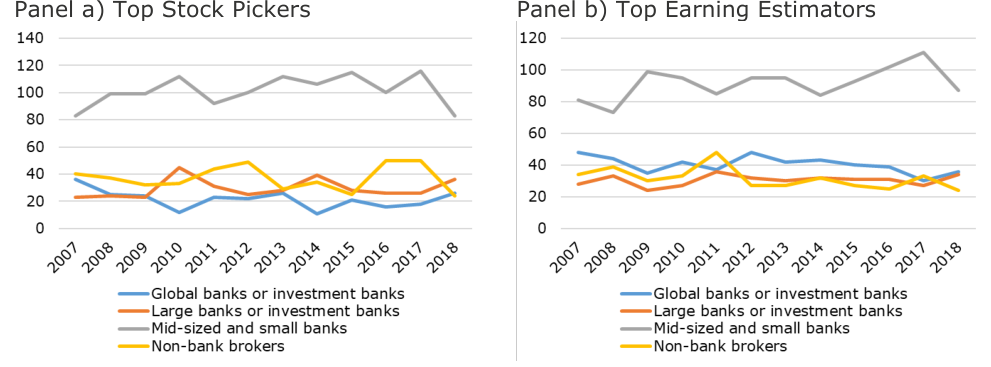
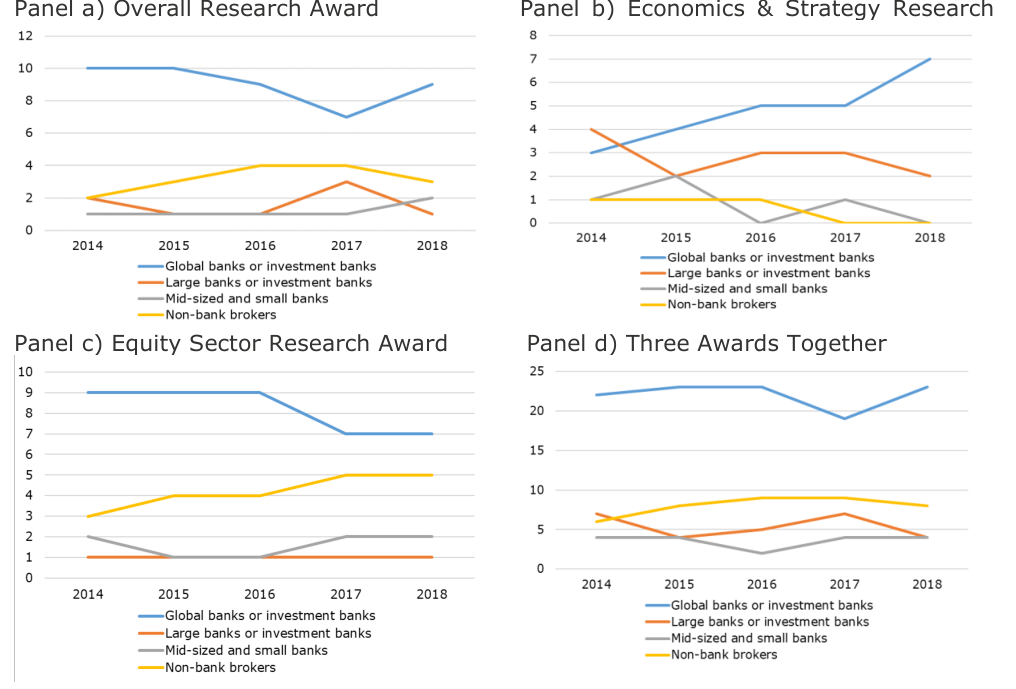
| Broker type No. of | total | No. of | Percent | No. of | Percent |
|---|---|---|---|---|---|
| Extel | of total | StarMine | of total | ||
| awards | awards | ||||
| winners | winners | (top | |||
| (top 3) | 3) | ||||
| Global banks or investment banks | 10 | 8 | 80.0% | 9 | 90.0% |
| Large banks or investment banks | 77 | 8 | 10.4% | 24 | 31.2% |
| Mid-sized and small banks | 1188 | 97 | 8.2% | 129 | 10.9% |
| Non-bank brokers | 356 | 38 | 10.7% | 57 | 16.0% |
| Total | 1631 | 151 | 9.3% | 219 | 13.4% |
Note: The percentages are with respect to the total shown in the second column.
2.6 Conclusions on market landscape
This section describes the market landscape for investment research in European corporate securities with an emphasis on SME equities and corporate bonds. Note again that this section aims to provide an overall picture of investment research in European markets. The focus will turn to the impact of MiFID II on investment research in Sections 4 to 11 below.
The first key conclusion of this section is the degree of heterogeneity both in the nature of the markets (amounts outstanding, new issue activity, concentration and domestic versus foreign origin of brokers) and in the research activity across highly developed, developed and less developed markets. The analysis underlines the challenges for companies in less developed markets in attracting investor interest and raising capital in that very little public research is conducted as all and coverage rates are extremely low. Remedying this situation represents a major challenge for policymakers and market participants in the countries in question.
A second major conclusion of this section is that, in all countries, including the US, there are noticeable negative trends in the volumes of research devoted to small companies. This general phenomenon is a systematic feature of the data. For seven prominent European countries for which we report individual country level results[33], all show negative trends for numbers of equity research reports per company per year and for coverage rates defined as the fraction of companies for which at least some research is performed within a given year.
A third conclusion of this section is that mid-sized and small banks increasingly gained in their share of StarMine awards in recent years but these gains were reversed in
2018. Global banks lost ground in numbers of StarMine awards obtained and similarly declined in Extel awards except for Extel Economics and Strategy which they came to dominate. These patterns reflect gradual evolution of the elite end of investment research provision. Of course, brokers dominate the research awards with only a handful of IRPs receiving mentioned.
3. The Legal Landscape for Investment Research
3.1 Introduction
This section describes the legal landscape of EU investment research in relation to the MiFID II rules. Insights are drawn from the surveys of industry participants conducted as part of this project, from analysis by Clifford Chance securities lawyers and from indepth interviews with market participants.
MiFID II has substantially changed the legal framework for investment research in Europe, requiring firms MiFID II-in scope firms to pay for research either through Research Payment Accounts (RPAs) (which entails use of client resources) or from the asset manager’s own resources (i.e., ‘from P&L’).
Whichever of these two approaches, asset managers must maintain careful standards in budgeting for and evaluating research because they must be able to demonstrate that they are not accepting ‘inducements’ from research providers. If they choose to pay via RPAs, they must apply strict reporting standards so that they can provide investors with transparent information on how research resources are being deployed.
The rules on inducements aim to boost transparency and reduce the scope for potential conflicts of interest in the procurement of research and other services that asset managers obtain from brokers such as Corporate Access activities.
3.2 Legal summary of MiFID II
The MiFID II framework restricts asset managers regulated under MiFID that provide portfolio management services from receiving any “fees, commission or any monetary or non-monetary benefits” from a third party involved in the services they are providing to clients. This restriction is commonly referred to as MiFID II's restriction on "inducements".
The restriction forms part of a broader obligation under MiFID II to act honestly, fairly and professionally in accordance with the best interests of clients. Whilst the MiFID II framework applies to “investment firms” (which includes portfolio managers), some regulators (such as the UK’s FCA) have also chosen to extend the application of the MiFID II research rules to Alternative Investment Fund Managers ("AIFMs", i.e., in broad terms, hedge funds) and Undertakings for the Collective Investment in Transferable Securities Management Companies ("UCITS ManCos", i.e., broadly mutual funds).
The MiFID II inducements regime restricts asset managers from receiving investment research for free from brokers that execute transactions on their behalf. Historically, research and execution costs have been bundled by brokers in equity markets while dealers in Fixed Income Currencies and Commodities (FICC) markets have provided research for free to asset managers with which they transact.
In the case of research, a specific subset of the inducements rules[34] stipulates that an asset manager will not be considered to have breached the inducements rule where it pays for research in one of two ways:
• Direct payments by the asset manager out of its own resources (sometimes called paying “with hard dollars" or “from P&L”);
• Payments from a separate research payment account (an "RPA") controlled by the asset manager. Use of an RPA is only permitted where certain conditions are met, including setting a research “budget” (agreed in advance with underlying clients), disclosure of the budget and research spend to clients and monitoring and review of the quality of the research being paid for.
If a benefit received by an asset manager can be classified as a “Minor Non-Monetary Benefit” (MNMB) then it falls outside the MiFID II inducements restrictions. A service can be considered to be an MNMB if it is capable of enhancing the quality of service provided to a client and if it is of a scale and nature such that it could not be judged to impair compliance with the investment manager’s duty to act in the best interests of the client[35].
This has stimulated debate in the market about the types of research material that are caught by the restriction on inducements and whether it is possible for any types of research-material to be characterized as an MNMB. Interpretation has varied between EU regulators as to the definition of research for the purposes of the restriction on inducements. This has led, for example, to differing approaches to Macroeconomic research, FICC research, and Corporate Access.
3.3 The legal framework
The Markets in Financial Instruments Directive (Directive 2004/39/EC) commonly referred as MiFID, is a European Union law that first came into force on 31st January 2007 replacing the previous framework of Investment Services Directive. MiFID covered provision of investment services in financial instruments by banks and investment firms and the operation of traditional stock exchanges and alternative trading venues.
In December 2010, the Commission began a public consultation on the review of MiFID and on 20th October 2011, it adopted formal proposals for the revision of MiFID through a revised MiFID Directive and a new Regulation. On 12th June 2014, the EU Official Journal published the Markets in Financial Instruments Directive 2014/65/EU (henceforth referred to as MiFID II or “EU/201 / 5”) and the Markets in Financial Instruments Regulation, commonly referred to as MiFIR. MiFID II and MiFIR became applicable to all member states in the EU from 3rd January 2018. Commission Delegated Directive (EU) 2017/593 and Commission Delegated Regulation (EU) 2017/565 then provided for further guidance on the implementation of Articles 16 and 24 MiFID II.
Since the adoption of the MiFID II rules by the EU in 2014, ESMA has published several guidelines and Questions and Answers documents (Q&As) providing additional clarification of the implementation of the MiFID II rules. Of these, the only one relevant for investment research is the Q&A on MiFID II and MiFIR Investor Protection Topics. This remains on the ESMA website and is updated periodically but the subsection on inducements and research was first published on 12th July 2018.
Some guidelines have been provided by individual regulators. In the UK, following an open consultation, the FCA issued two policy statements on the implementation of MiFID II rules- PS17/5 and PS-17/14 published in March and July 2017 respectively. PS17/5 covers rules on markets and organisational requirements. PS17/14 covers rules on conduct of business, client assets including the rules on research related inducements. In France, the AMF published a guide in relation to the definition of research and of corporate access and the operation of a research budget.
Other examples of relevant guidance from national regulators include (i) that provided by the Polish Financial Supervisory Authority (PFSA) related to inducements in the context of reception and transmission of orders related to units/shares in investment funds, and (ii) the guidance published by the Czech National Bank (CNB) concerning the interpretation of what is an allowed inducement. This latter guidance gives examples of Minor Non-Monetary Benefits and elaborates on the provision of an additional or higher-level service and how to proceed if in doubt as to whether the service is additional or higher level.
This study included a survey of Clifford Chance lawyers in different member states on the approaches that national regulators had taken in implementing the MiFID II rules on research and inducements. The results of the survey are included as an Annex to this section of the report. Each of the Member States included in the survey has taken out a “copy out” approach to implementation of the MiFID II Research Unbundling Requirements.
Many Member States have extended the application of the MiFID II Research Unbundling Requirements to both AIFMs and UCITS ManCos providing MiFID activities (in addition to those firms primarily subject to MiFID II). It was noted that in some Member States AIFMs and UCITs ManCos have also elected to comply with MiFID II Research Unbundling Requirements, even where local implementation has not extended the application to such firms.
3.4 Defining research
A key starting point for any regulation of investment research is the definition adopted. The Delegated Regulation EU 2017/565 defines investment research as follows[36]:
“For the purposes of Article 37 investment research shall be research or other information recommending or suggesting an investment strategy, explicitly or implicitly, concerning one or several financial instruments or the issuers of financial instruments, including any opinion as to the present or future value or price of such instruments, intended for distribution channels or for the public, and in relation to which the following conditions are met:
(a) the research or information is labelled or described as investment research or in similar terms, or is otherwise presented as an objective or independent explanation of the matters contained in the recommendation;
(b) if the recommendation in question were made by an investment firm to a client, it would not constitute the provision of investment advice for the purposes of Directive 201 / 5/EU.”
Note that this approach to defining research is based on its purpose. There is no presumption that research is conducted by particular departments or functional organisations within a sell-side institution. Generic communications on characteristics of securities would seem to fall outside the above definition although they could still represent inducements if they were not paid for. Other benefits might fall outside the definition because they are deemed minor. The European authorities clarify some of the boundaries of research by providing a list of what the rules term Minor Non- Monetary Benefits (MNMBs).[37]
Through its Q&A ESMA reiterates how the authorities view MNMB by citing the recital 2 of the MiFID II Delegative Directive. In particular, “non-substantive material or services consisting of short-term market commentary on the latest economic statistics or company results” may qualify as MNMB.
The ESMA Q&A further continue by pointing to Article 12(3)(b) of the Delegated Directive EU/2017/593 which allows the treatment of sponsored research as MNMB, provided it is generally accessible to investment firms or publicly available. In particular, “written material from a third party that is commissioned and paid for by a corporate issuer or potential issuer to promote a new issuance by the company, or where the third party firm is contractually engaged and paid by the issuer to produce such material on an ongoing basis” may be treated as MNMB.
Despite the clarification, interviews conducted as part of the project suggest that areas remain in which firms struggle to distinguish between MNMBs and services for which payment should be made. Particularly challenging is the area of Corporate Access. This issue is revisited in Subsection 3.11 below. Also, firms have interpreted differently what is the boundary between sales analysts and publishing researchers in the MiFID II sense. This issue will also be further discussed in Section 8.
3.5 Paying for research
Before focussing on MiFID II approaches, it is helpful to review the ways in which asset managers, out of scope for MiFID II, have paid for research. These approaches include those used by (a) asset managers in Europe before MiFID II came into force, and (b) asset managers not subject to MiFID II rules (typically either located outside Europe or excluded from MiFID II because of the nature of their activities).
Prior to MiFID II, most European asset managers paid for equity research through bundled payments to brokers covering both execution and research services. This approach remains the main approach used in most other jurisdictions and, in particular, the US.
What is the bundled payment method?[38] In equity markets, asset managers, executing client trades say through a stock exchange, may, without being charged an explicit separate fee, be offered services, such as investment research, by their brokers. A set price may be agreed between the investment manager and the executing broker for the bundled services and the fraction of trade execution costs that are applicable to the additional services. The asset manager then directs trades to a broker until the client commission multiplied by the fraction exceeds the agreed cost of the bundled services.[39]
In contrast, in FICC markets, asset managers typically execute trades with dealers within an over-the-counter market rather than a stock exchange. The dealers that act as counterparties do not charge any agency commission but quote separate bid and ask prices for clients that wish to sell or buy securities. Under the non-MiFID II spreadbased approach to paying for research, dealers provide research for free to clients with which they trade and, implicitly, the cost of research is priced into the bid-ask spread. In this case, asset managers are unable to observe the value of research provided by the dealer.[40]
A variant of the bundled method of payment is the Commission Sharing Agreement (CSA) (see Figure 3.1). (The equivalent in the US is called the Client Commission Arrangement (CCA)). In this case, a broker calculates a cumulative amount based on a fraction of commission earned from a particular client and this amount is available for that client to use in buying research not just from the broker but also from other research providers. This approach represents a partial form of unbundling since commission is not only applicable to research payments to the broker itself.
Figure 3.2 shows the research payment approaches employed by respondents to our buy-side survey before and after the introduction of MiFID II. Note first that both
38 FCA’s DP 1 / , IMA (201 ) and EuroIRP (200 ) discuss the use of dealing commission to purchase research. 39 It is instructive to consider how execution pricing is accomplished. One very large bank explained their approach which they thought was quite standard among large broker banks. They agree standard execution rates each year with clients. They have a pricing sheet in which rows are countries and columns are channels. Rates range from 80 bps for high touch transaction to 5 bps for electronic trading platforms. They might have different prices by clients or, for example, Small Cap stocks in a particular country, but the sheet is the starting point for all discussion. This bank also has execution only rates and believes that the cost implications of unbundling for different clients was fully understood well before the arrival of MiFID II. 40 The fact that FICC bid-ask spreads included the costs of research in pre-MiFID II market practice (and still do for MiFID II out-of-scope firms), encouraged the view that after the adoption of MiFID II, spreads might narrow. Market participants generally dispute that this has taken place, however.
before and after MiFID II, a wide range of approaches has been employed. Prior to MiFID II, almost all firms were using the bundled method, CSAs and (in fixed income) payment via spreads. (We believe that the firms that surprisingly said they used RPAs prior to MiFID II are using the term to indicate CCAs or other CSA-type arrangements.) Following MiFID II, 96% of the firms responding to the survey reported paying for research out of P&L and 67% said they used RPAs.[41] Additionally, post MiFID-II only 19% of the respondents pay via spreads for credit research compared to 94% before MiFID II.
Note that many of the firms in our sample are large, complex and indeed globally active asset managers. This explains why, as Figure 3.2 demonstrates, many use multiple approaches at any one time, since aspects of their businesses are covered by national regulations in different jurisdictions.
In equity markets, the hard link between research and execution payments is somewhat weakened if asset managers and brokers employ Commission Sharing Agreements (CSAs). A CSA consists of an agreement between an asset manager and a broker under which manager’s execution commission with the broker is held by the broker in a separate account that can be used by the manager to pay for research. Different brokers may have multiple CSAs in place with an investment manager resulting in different pools of research commissions. The manager may instruct the broker holding the accumulated balance for a single pool to pay for research from other brokers or IRPs.
Since CSAs can be employed to pay for research from brokers or IRPs other than the broker that executed the trades, the use of CSAs mitigates incentives to buy research and execution services from the same organisations. Nevertheless, participants in interviews reported anecdotally that managers may favour their execution brokers when they obtain research because this may be administratively simpler. Figure 3.2 provides a schematic depiction of how CSA work.
Under the MiFID II framework, firms may pay for research in one of the following two ways.[42]
i) Using a Research Payment Account (RPA) that would be charged directly to the client dedicated towards the purchase of research. ii) Direct payment using the firm’s own P&L.
Most of the firms we interviewed nevertheless described making a decision in the runup to MiFID II implementation between using RPAs or P&L as the predominant way of paying for research from the MiFID II in-scope part of their business. Their choices shall be further discussed below.
Figure 3.3 shows how RPAs operate. Investment firms can follow one of two approaches to collect charges from clients via an RPA: (i) the Accounting Method and
(ii) the Transactional Method (See AIMA (2019)). Under (i), the investment firm agrees a research charge with the client. This charge is directly transferred from the client account to the RPA and is then used to pay for research. Under approach (ii)), the RPA is funded using a mechanism similar to a CSA. In particular, under this method, an RPA is funded using research charge collected alongside execution commission, although the research charge should not be linked to the value or volume of the execution and should be separately identifiable.
AIMA (201 ) states that “Executing brokers have shown little or no desire to involve themselves in the RPA process but provide a cash sweep of accumulated research credits out of the broker’s account into the RPA. The RPA itself is most typically maintained and managed by specialist service providers commonly referred to as RPA accumulators or administrators.”
In paying for research using RPAs, investment firms must meet a number of requirements.[43] RPAs must be funded by a specific charge to the client, investment firms should agree the charge with individual clients and set and regularly assess their research budget. Using an RPA requires investment firms to assess the quality of research, thus, obliging firms to create mechanisms to assess the quality of research. Furthermore, there are additional requirements in relation to disclosure of research charges to clients and research budgets.
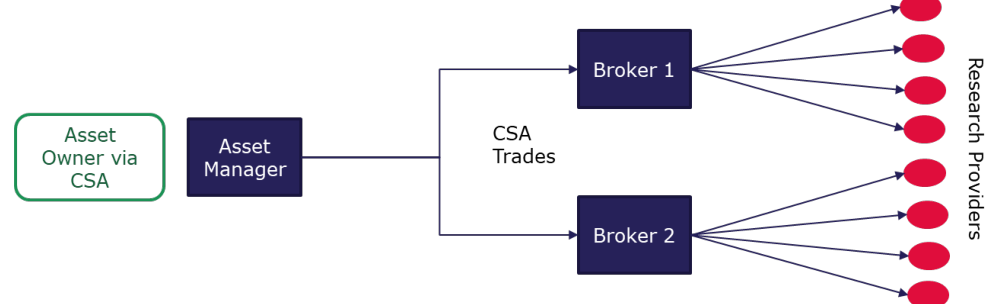
Note: Source is Frost Consulting.
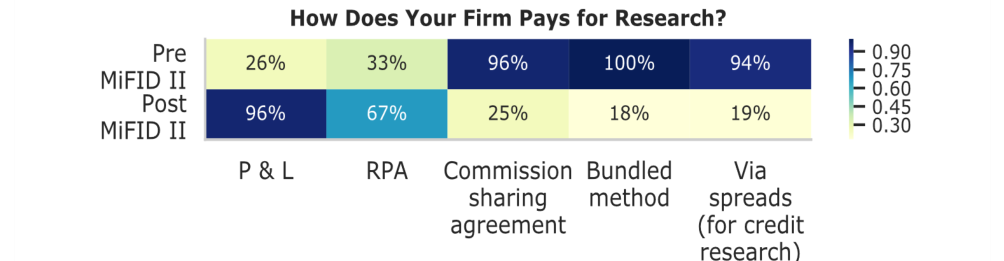
Note: The panel corresponds to question no. 2: ‘How does your firm pay for research currently and how did it pay before MiFID II?’
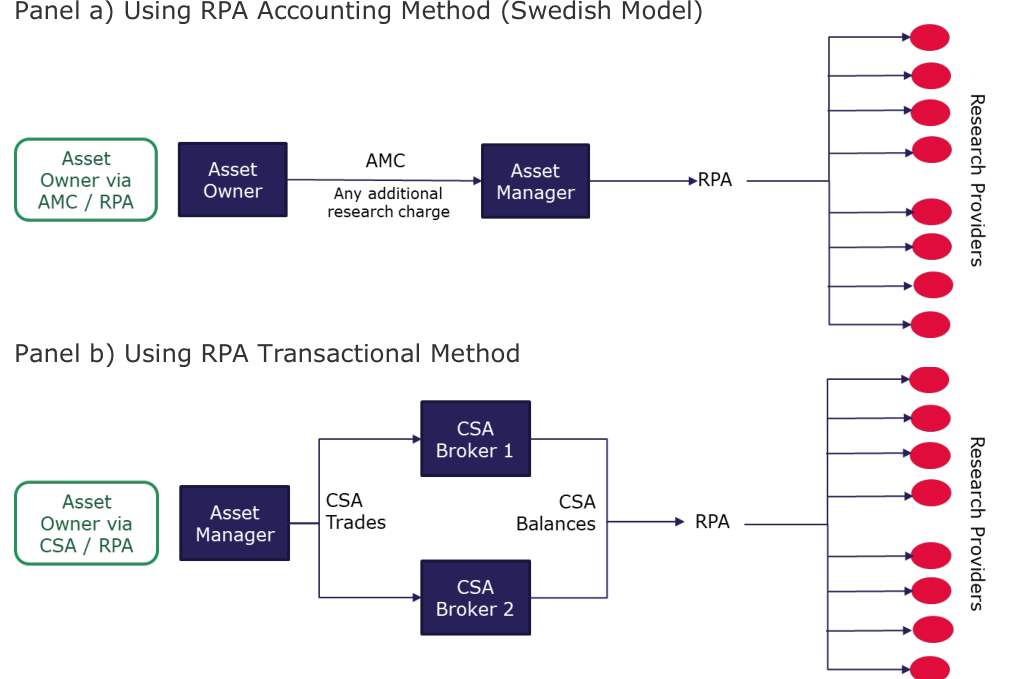
Note: Source is Frost Consulting. AMC stands for Annual Management Charge.
3.6 Research Payment Accounts
3.6.1 Transparency requirements under RPAs
A key motive for the MiFID II rules on research payment is to enhance transparency vis-à-vis the investment firm’s clients. The RPA rules enforce strict conditions on what information must be provided. Specifically, they state that: “where an investment firm makes use of the research payment account, it shall provide the following information to clients:
(a) before the provision of an investment service to clients, information about the budgeted amount for research and the amount of the estimated research charge for each of them;
(b) annual information on the total costs that each of them has incurred for third party research.[44]”
Furthermore, the rules require that, “Where an investment firm operates a research payment account, Member States shall ensure that the investment firm shall also be required, upon request by their clients or by competent authorities, to provide a summary of the providers paid from this account, the total amount they were paid over a defined period, the benefits and services received by the investment firm, and how the total amount spent from the account compares to the budget set by the firm for that period, noting any rebate or carry-over if residual funds remain in the account.[45]”
3.6.2 RPA budgets and charges
Article 13 (2)-(5) of the Delegated Directive EU/2017/593 include some of the rules on research charges. In particular, research charge should only be based on research budget set by the investment firm and should not be linked to execution charges. However, a client research charge may be collected alongside a transaction commission. In such cases, the client research charge should be clearly identifiable. Firms are still required to comply with all the requirements for operating an RPA. The article also requires that the total amount of client research charges should not exceed the research budget. In addition, investment firms are required to agree the research charges and frequency of deduction over the year. Research budget increase is allowed only after it has been clearly established with the clients. Furthermore, any surplus funds in the RPA at the end of period should be either rebated to the clients or offset against the research budget ad charge for next period.[46]
ESMA permits a research budget to be set for a group of client portfolios or accounts where the firm has established a similar need for third party research in respect of the investment services rendered.[47] A research budget for a group of client portfolios should not be set if they do not share sufficiently similar investment objectives and research needs. However, firms are still obligated to identify the specific research charge attributed to a client to fund the RPA.
The research budgets should be based on ex-ante estimates of research spending[48]. The firms should also maintain a clear audit trail of the payments made to research providers, place controls over how amounts paid are determined based on the quality criteria determined by the firm and well document any decisions in order to minimise any conflicts of interest.
ESMA has clarified that the inducements rules are still applicable when a firm intends to use the research from another group entity. In particular, firms have an obligation to assess the quality of research and maintain suitable controls and oversight over the amounts paid and ensure that a research budget is used and managed in the best interests of their clients and that the costs of research are allocated fairly between client portfolios.
3.6.3 The legal status of RPA monies
An RPA must be funded by a research charge to the client and controlled by the investment firm and used specifically for paying for research. Investment firms are also obliged to have a process through which it can rebate any surplus funds resulting from underspending.
On the legal status of money held in RPA, the ESMA Q&As state that the money held in an RPA belongs to the firm as it is funded by a research charge to the client. “Where an investment firm chooses to use an RPA, this must be funded by a research charge to the client. The nature of this deduction as a charge means that once it is deducted from a client, the funds belong to the firm. However, this research fund should be managed in an RPA controlled by the investment firm and it should be used specifically for purchasing external research to benefit the client. ESMA is of the opinion that it is important that the investment firm makes its best efforts to align as much as possible the timing of the charges paid by the client to the firm, and the expenditure on research paid from the RPA by the firm to the research provider…”
3.6.4 MiFID II choices between paying via P&L or RPAs
An important issue for this study is the choices made by MiFID II in-scope investment firms in their approaches to paying for research. MiFID II permits such firms either to use RPAs, as described above, or to pay for research out of P&L.
Figure 3.4 depicts the process of paying for research in this way. While the approach here depicted appears simple in that complex arrangements involving multiple parties are eliminated, it should be emphasised that, under MiFID II rules, even when investment firms pay for research via P&L rather than RPA, they remain obliged to avoid accepting research as an inducement. Regulators expect them, to this effect, to operate rigorous systems for budgeting and research quality monitoring and evaluation so that they can demonstrate, if this is required, that they obtain value for money from the research that they purchase.
In the event, most investment firms and certainly almost all large or global firms appear to have chosen to pay for MiFID II in-scope research purchases out of P&L rather than RPAs. From Figure 3.2, 96% of the firms that responded to our survey used P&L payments to meet some of the costs of research. A very large sell-side interview participant (and one representative of others) reported that, pre-MiFID II, they had approximately 250 clients in Europe operating with CSAs. Since MiFID II implementation, this had changed to a situation in which roughly 150 of their clients employ RPAs, many being smaller firms. In their view, RPAs represent a minor part of the market.
In fact, for large or global buy-side firms the choice of payment approach is complex since the infrastructure of research contract negotiation and administration is often centralised. Multiple payment approaches are, therefore, operated in parallel depending on the location of the funds for which research is being acquired. Large firms participating in interviews reported the complex choices and tasks they face in paying for research and their efforts to ensure comparability.[49]
An instructive example is a globally active European asset manager (representative of other very large firms). This firm reported in an interview that, in their systems, they aim to treat funds run out of US or London similarly within their system. They pay out of P&L for MiFID II in-scope parts of their operations and through commission from those parts that are out-of-scope. In the latter case, they either use CSAs or pay via full-service research commissions.
For in-scope activities, they use execution only commissions. For out-of-scope, the payments are made out of full commissions (inclusive of research) until they hit the budget cap. After the budget cap is hit, they switch to P&L. When research is paid for out of P&L, they apply different asset management fees for their ultimate investors. Pricing tools that they employ allow for whether the activity is in- or out-of-scope. They expect that clients will ultimately face the same charges (and, hence, obtain the same total net return) whether they are in scope or not.
Why did firms make the choices they did on research payment approaches and, specifically, why was P&L-based payment the predominant approach taken by larger firms? Several explanations were advanced in interviews and surveys:
1. Competitive pressure - A key factor that influenced larger firms was competitive pressure. On successive days three months before MiFID II came into force, two of the world’s largest buy-side firms, Blackrock and Invesco Perpetual, announced they would pay for research out of P&L. Pressure on asset management fees has been relentless in recent years so for many firms, asking investors to pay a new direct charge appeared to be impossible once prominent competitors had adopted P&L payments.
2. Administrative complexity – Larger firms are commonly executing complex block trades through multiple trading platforms or mechanisms on behalf of different funds. In this context, it is very complex to attribute the costs of research to multiple clients in a fully rigorous and transparent way that can then be documented and communicated to investors. These challenges are less severe for smaller asset managers and hedge funds that implement smaller trades on behalf of fewer funds.
3. Preparedness – Multiple participants in interviews reported that many mediumsized firms found it impossible to meet the strict transparency and investor reporting requirements of RPAs before the January 2018 deadline. These firms were obliged to employ P&L charging even if they had been actively considering implementing RPAs.
4. Practicality – Some investment activities are simply impossible to conduct in a way that is consistent with RPAs. A good example is wealth management. The numbers of investor clients that a buy-side firm may run into many thousands. The administrative costs created by RPA-based research payments in this context would likely exceed the bill paid for the research.
From the interviews conducted as part of this study numerous case studies illustrative of these arguments could be extracted. One large UK-based asset manager (representative of other similar firms) reported that they considered employing RPAs. It was feasible for them as they had lots of experience with CSAs. But, adopting RPAs would have been complex given the need to split block trades for multiple funds and executed across many platforms. Ultimately, they decided to pay out of P&L mainly for competition reasons. The announcements of major competitors precluded any alternative strategy. A medium-sized European asset manager reported that their several thousand wealth management clients would each have to pay EUR 10 per year if they operated an RPA. This would be operationally impossible.[50]
Figure 3.5 shows the survey results on the choice between P&L and RPA for the buyside respondents. Post MiFID II, payment using P&L is the method of choice for most buy-side firms. Regulatory burden emerges as the factor influencing the choice of payment method for a large majority of the buy-side firms (75%). This is followed by the fraction of firms that also consider factors such as competitive burden (66%) and administrative burden (60%).
Figure 3.6 presents the survey results on the topic of research payment methods. On the choice of research payment methods, it is interesting to note that majority of the firms (54%) believe that the choice between paying using their P&L and using an RPA is likely to affect the total cost to client. A smaller fraction (30%) do not believe the choice of research payment method has an impact on the total cost client. Of the firms that have chosen to pay using the firm’s P&L, a large majority (78%) have not adjusted their fees. Only a small fraction (16%) have increased their fees.
Of the firms that have chosen the RPA payment method, the mechanism of cost allocation is varied. 44% of the firms allocate the cost prorated by fund categories based on size and 22% prorated among all funds based on size. A large fraction (33%) has adopted other methods to allocate the RPA cost. Most of the firms (60%) have written guidelines for research cost allocation. A smaller fraction (15%) have not done so at the time of the survey. A large majority of the firms (67%) think that there is enough availability of guidance from their national regulators and ESMA and a smaller fraction (28%) think otherwise.
accordingly?’ The middle panel corresponds to question no. : ‘If your firm pays for external research via RPA, how is the cost allocated between funds?’ The bottom left panel corresponds to question no. : ‘Has your firm written guidelines for research cost allocation?’ and the bottom right to question no. 8: ‘Have you received sufficient guidance from your national regulators and ESMA on the application of the new rules?’
One relevant academic study in this context is Tata (2019a). The author presents an analysis of the choice of research payment methods between RPA and P&L. The author notes that although MiFID II allows asset managers to pay for research via RPAs, by the end of 2017, virtually all large asset managers had decided to pay for research directly out of P&L. The author proposes an explanation for this response based on a simple model of free-riding behaviour. Within the model, the author demonstrates that asset managers receive too little funds for research consumption. This reduces their ability to outperform the market. The author argues, on this basis, that replacing the RPA system by the P&L method leads to a better outcome for everyone.[51]
Finally, a decision that some EU firms have made is to adopt unbundled research payment approaches globally. Figure 3.7 shows the buy-side survey results where a firm has applied the MiFID II rules on external research. Almost half the respondents have applied the rule in the Europe outside of the EU and a lesser but large fraction (40%) have applied the rule in the US or Canada. This is closely followed by the application of rule in the buy-side firms in Asia excluding Japan (37%) and Japan (29%).
Global firms said that it would have been possible (though challenging) to implement and administer RPAs within the setting of a business that involves block trades through multiple execution platforms on behalf of numerous client mandates. But the decision was made as soon as a major competitor decided to use P&L. The current environment with constant year-on-year pressure on active fund management fees makes it very difficult for any firm to ask clients for highly visible new charges.
It is also the case, according to several accounts, that some small to medium firms planned to introduce RPAs but postponed delayed implementing the transparency requirements required with RPAs in the expectation that regulators would permit a delay. While regulators in some jurisdictions appear to have been very generous in permitting implementation delays, in others, the rules were brought into effect in January 2018 as planned, obliging any asset managers that were not fully prepared to follow the procedurally simpler route of payment out of P&L.
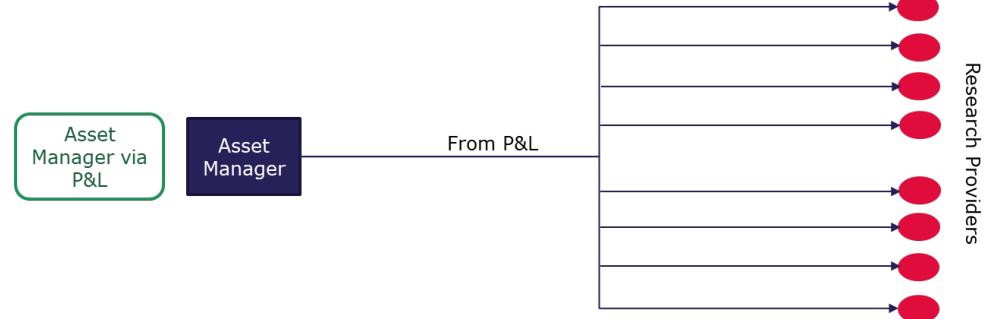
Note: Source is Frost Consulting.
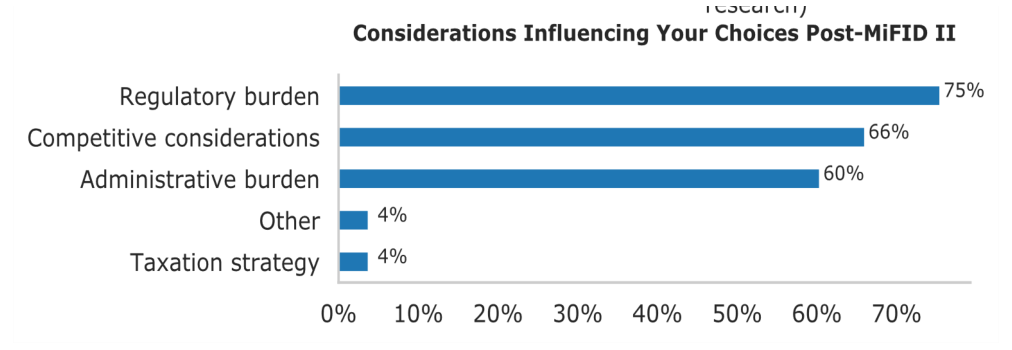
Note: The figure corresponds to question no. : ‘Which of the following considerations has influenced your choice post MiFID II?’
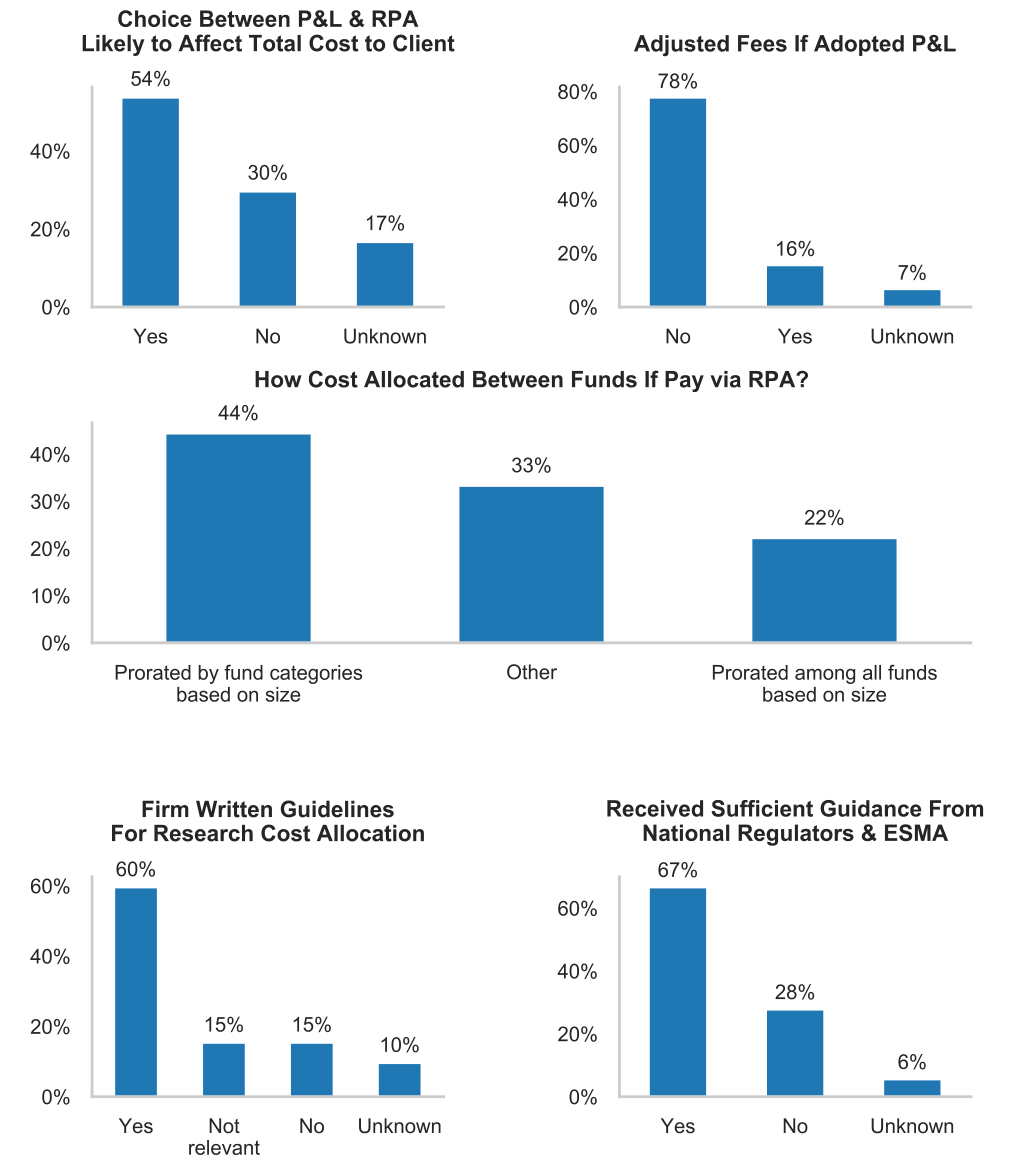
Note: The top left panel corresponds to question no. : ‘Is the choice between P&L and RPAs likely to affect the total cost to clients (including both direct and indirect charges)?’ and the top left to question no. 5: ‘If you have adopted the P&L method, have you adjusted your fees
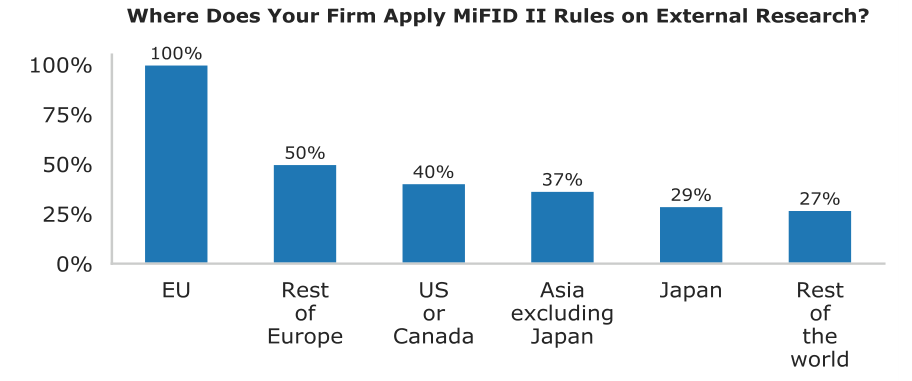
Note: The above figure corresponds to question no. : ‘Where does your firm apply the MiFID II rules on external research?’
3.7 MiFID II requirements on research quality assessment
MiFID II requires that asset managers, whether they pay via RPAs or out of P&L, must implement systems for assessing research quality. Many larger firms represented these requirements to us as no more that good practice for any organisation controlling its costs. thers, viewed the control of manager’s internal procedures implied by these provisions as unwarranted over-regulation.
ESMA views that firms should establish a clear methodology for what they expect to pay before they receive and consume services from research providers. One way to achieve this as suggested by ESMA employing measurable ex ante criteria for evaluating the type, level and quality of service. Furthermore, ESMA considers that regular ex-post assessment contributes to the assessment of the quality of research purchased and setting future procurement decisions and payments.
In the context of RPAs, The Delegated Directive (EU) 2017/593, Article 13 on “Inducements in relation to research” requires that investment firms align the research payment with the quality of the research. The relevant text from the Delegated Directive is as follows: “payments from a separate research payment account controlled by the investment firm, provided the following conditions relating to the operation of the account are met: (iv) the investment firm regularly assesses the quality of the research purchased based on robust quality criteria and its ability to contribute to better investment decisions…”
A traditional approach that asset managers have employed to evaluate the quality of research from providers is so-called broker votes. In some cases, the term is used to describe only the evaluation of research quality. But broker votes may also be associated with the determination of payments since, particularly before MiFID II, some asset managers determined the payments they would make to research providers ex post at the end of the period in which the research was received, based on broker votes. This approach is frowned upon by some regulators who emphasise the need for transparent ex ante budgeting.
An example of a broker vote approach was described to us by one large asset manager that we interviewed. This approach was implemented well before MiFID II. It involved working out how many stocks included in different funds fell into each sector and so what the sector weight should be in the budget. For each sector, at the start of each six-month period, analysts would provide a list of broker names and a ranking 1-5 (or 0 indicating a recommendation not to use). The analyst scores go into a formula leading to a number for each broker which was then aggregated across sectors for each broker. At the end of the six-month period, the asset manager would review the budget versus experience. If a fund had used a broker’s services more than expected, an ad hoc payment would be made to that broker. In the case of unspent money in CSA, the amount would be rolled forward. The manager reserved the right to make adjustments. When teams were small, a similar process would be used but using a coarser set of sector definitions.[52]
Note: The panels above correspond to question no. 5 : ‘Which methods do you use to assess the value of research and what is their relative importance in your overall assessment?’
Figure 3.8 shows the buy-side survey results on the methods used to assess the value of research and the chosen method’s relative importance. 1 denotes least important and 5 denotes the most important. Individual judgement or score card is regarded as most important by majority of the respondents. The number of times a research has been accessed is regarded moderately important by a third of the respondents. Use of public research rankings is regarded as least important by majority of respondents. Broker voting is considered most important by half of the respondents, although about a fourth view it as least important. Respondents have a more varied view on the importance of analyst rankings with only 11% of the respondents viewing it as most important.
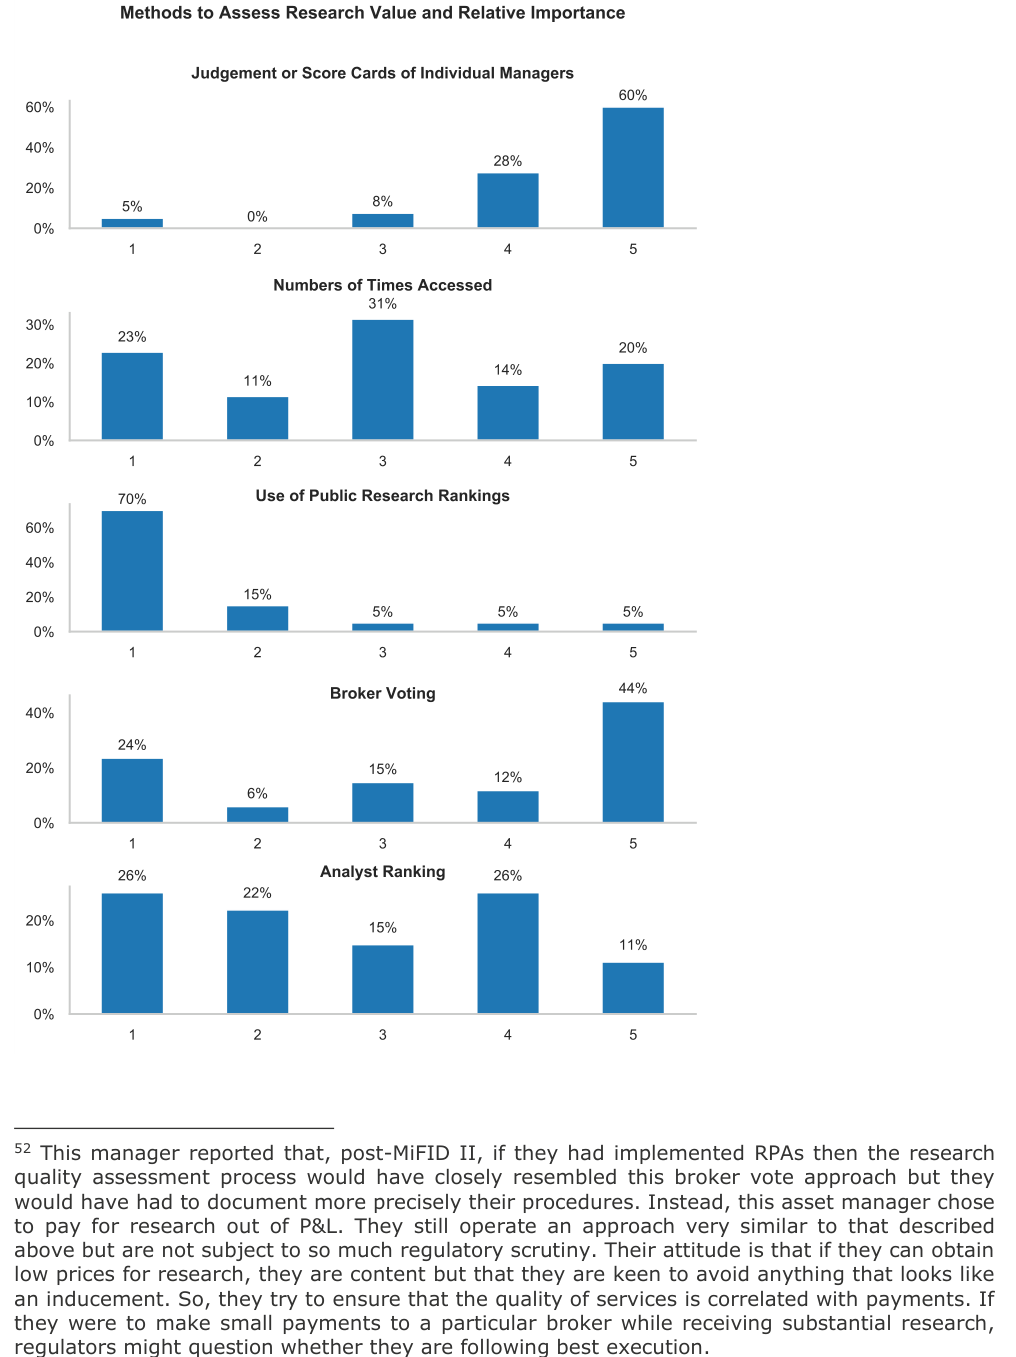
3.8 Free research and trial periods
In a system of rules like MiFID II requiring firms to pay for research in particular ways, the issue of what constitutes research that can be accepted without payment is a key issue for firms and regulators.
ESMA Q&As state that firms must be careful to adopt systems that avoid situations in which they are provided with unrequested research for free. In particular, ESMA has emphasised that firms should have set up “policies and systems” to evaluate the nature of any service, benefit or material from a third party. ESMA has stated that it is unacceptable to receive research for free when no assessment has been performed or no payment arrangement has been established. Furthermore, firms that do not want to accept research should take sensible steps to prevent receiving or benefitting from such material.
Figure 3.9 shows the results of the survey shedding light on steps taken by the buyside firms. Most of the firms (76%) have taken steps to stop unsolicited research. 16% of the firms have not taken any steps. Popular approach to stopping unsolicited research include requesting the providers to stop providing research (88%), providing adequate training or information to staff (83%) and establishing a process for reporting any cases of unsolicited research (57%).
To allow research consumers to evaluate new providers, ESMA Q&As allow for firms to accept research services without payment during trial periods. Provided certain requirements are met, ESMA states that such services may qualify as MNMB. These include requirements such as offering and agreeing of the trial period prior to obtaining research services for a fee, agreeing to the scope of research services to be provided during the trial before it begins, limiting the trial period to a maximum of three months and requiring that the trial does not begin within twelve months from the termination of any previous research services arrangement from the same provider and setting up of controls by firms to ensure that research received during the trial period is not billed to the clients.
The system of trials permitted by the ESMA advice is viewed by some as challenging to administer. A global asset manager told us that they are always evaluating new providers but that MiFID II has made trials more operationally burdensome. They now have to keep careful records. Another major buy-side firm told us that they do not use trials at all. It was reported above that a specialist broker in the Nordic bond market suggested that the most important issue for them with MiFID II is the inflexibility of trial periods. In their market, building relationships with new buy-side clients can take three years so a three-month trial period is not helpful.
For completeness, it is worth mentioning the other important category of research that may be accepted by MiFID II-in scope buy-side firms for free, namely sponsored research. The Delegated Directive (EU) 2017/593, Article 12 on “Inducements in respect of investment advice on an independent basis or portfolio management services” includes rules on that allows the sponsored research to be treated as “minor non-monetary benefits”.[53]
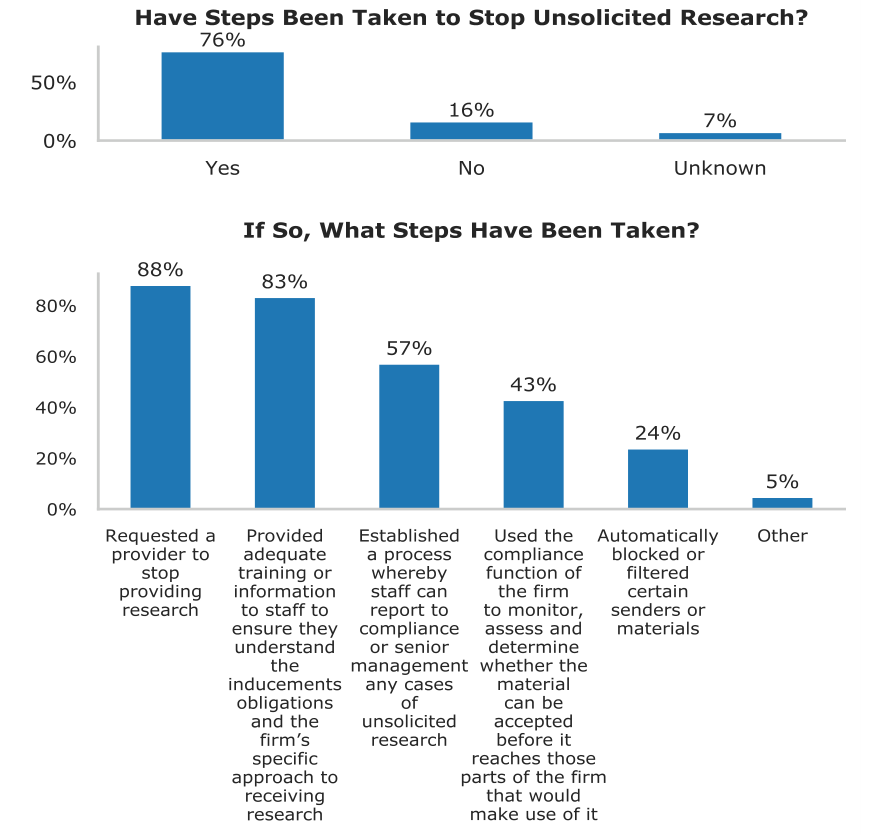
Note: The top panel corresponds to question no. 0: ‘Has your firm taken any steps to stop receiving any unsolicited research?’ The bottom panel corresponds to question no. 1: ‘What steps has your firm taken?’
3.9 International aspects of MiFID II
3.9.1 Introduction
MiFID II rules stipulate no exemptions to the MiFID II obligations for asset managers that do business with third country providers of research or execution services[54]. This potentially creates the scope for contradictions[55] with local regulatory requirements regarding the distribution of and charging for research in some non-EU jurisdictions.
In particular, the ‘unbundled’ approach for research payment was rare in the US prior to MiFID II, where broker-dealers are precluded from receiving “hard dollars” for research payments unless they are willing to register as investment advisors[56]. MiFID II is also hard to square with the nature of global firms that manage assets across operations straddling many countries. Strict policing of the sharing of research within such groups since research insights is extremely difficult and may, anyway, be viewed as undesirable.
This subsection discusses the challenges associated with international aspects of MiFID II.
3.9.2 Non-EU distributors of research
As already explained, local regulatory requirements in respect of research distribution in some non-EU jurisdictions conflict with the MiFID II Research Unbundling Requirements in that hard dollar (i.e. separate) payments for research material are not permitted. Examples include the US and Japan. This subsection explains the issues involved.
On US rules pertaining to research providers, US regulations specifically exempt US broker-dealers from the obligation to license as investment advisers even if they receive payments for research as long as the payments are made in the form of dealing commissions in accordance with the ‘soft dollars’ safe harbour. This exemption relies on a definition of investment adviser that excludes broker-dealers for which the provision of investment advice is “solely incidental” to its brokerage services and which receive no “special compensation” for providing such advice. If a US broker-dealer were to receive a separate payment for research (i.e., a ‘hard dollar’ payment), then leaving aside any other exemption, it would be obliged to register as an investment adviser since such a hard dollar payment would be characterised as “special compensation”[57].
To resolve the contradiction, in October 2017, the SEC issued a no-action letter (expiring on 3 July 2020)[58] stating that the SEC staff would not recommend enforcement action to the SEC under the Investment Advisers Act of 1940 (Advisers Act) against a broker-dealer that provides research services that constitute investment advice under the Advisers Act to an asset manager that is required by MiFID II, either directly or by contractual obligation, to pay for the research services from its own money, from a separate RPA or a combination of the two. In November 2019, the temporary no-action relief was extended for another 3 years to July 3, 2023[59]. In addition to the temporary no-action letter, the SEC issued two other related no-action letters in October 2017. One of these no-action letters provided relief to permit investment advisers to continue to aggregate client orders for the sale or purchase of securities, where some clients may pay different amounts of research because of MiFID II requirements, but all clients will continue to receive the same average price for the security and execution costs. The other no-action letter provided relief to allow money managers to operate within a safe harbour if the money manager makes payments for research to an executing broker-dealer out of client assets alongside payments for execution through the use of an RPA that conforms to the requirements for RPAs in MiFID II, and the executing broker-dealer is obliged to pay for the research.
On Japanese rules related to research providers, a similar contradiction exists in that, under Japan's Financial Instruments and Exchange Act, brokers advising investors on the "value of securities" in return for a fee are required to obtain an investment advisory business registration ("IA registration"). Advising investors on the value of securities is understood to capture at least some forms of research report.
Many broker-dealers in Japan hold a "Type 1 FIBO" registration in respect of their brokerage business. Prior to MiFID II, it was generally understood that research report distribution would be permissible as a part of business under Type 1 FIBO registration and IA registration was not needed if the research reports were distributed as part of brokerage business.
The Japanese Financial Services Agency has not issued any formal guidance as to whether or not charging a separate fee for research material would be activity outside of the scope of a Type 1 FIBO registration. However, such Japanese firms take the view that charging a separate fee for research would trigger for them an additional IA registration (and so, on that basis, are unwilling to charge a separate fee to EU firms for research).
3.9.3 Use of research from such non-EU distributors
The fact that non-EU distributors may be unable, under their own regulatory systems, to charge a separate fee to EU firms for research raises challenges for EU firms in two specific areas.
The first challenge is in receiving research from non-EU distributors and intra-group sharing of research. Many EU firms take research directly from non-EU distributors or receive such research from their own affiliates (who often are not subject to MiFID II obligations) under research agreements the affiliate (or the group as a whole) has with the non-EU distributor.[60] How can the EU firm comply with the MiFID II Research
Unbundling Requirements in such a scenario where it cannot make a separate payment to the non-EU distributor?
A second challenge arises in the case of delegation by an EU firm to a non-EU manager/cross-border delegation. EU firms often delegate some or all of portfolio management obligations in respect of a mandate to a non-EU provider. This can under MiFID II mean that the EU firm requires the non-EU delegate to comply with the MiFID II Research Unbundling Requirements. How can the non-EU delegate comply with the MiFID II Research Unbundling Requirements where receiving research from a non-EU distributor who cannot receive a separate payment for research[61]?
The European Commission clarified their view on the matter of implementation of MiFID II in the cross-border context through an FAQ published in 2017 (See European Commission (2017d)). The FAQ makes two clarifications.
First, the Commission made clear that a third country sub-advisor should employ MiFID II-compliant research payment methods when paying commission to a third country broker-dealer. In particular, a third country sub-advisor can combine its research and execution payments as long as the payment attributed to research is identifiable. The third country sub-advisor that operates an RPA is also required to comply with the additional requirements of using RPAs stipulated in the MiFID II rules such as managing research budgets and maintaining clear audit trails of payments.[62]
Second, the Commission spelt out that it is the responsibility of the third country subadvisor and not the third country broker-dealer to identify a separate charge for the research supplied by third country broker-dealers. When a separate research invoice is not available from the third country broker-dealer, the Commission suggests that the third country sub-advisor may decide the charge by consulting with third parties including the third country broker-dealer.[63] The FCA also published a statement (See FCA (2017c)) in 2017 welcoming the guidance from the Commission and the SEC’s noaction letters. In particular, Andrew Bailey described an alternative research payment
Delegated Directive, the requirement on the EU firm to ensure a research budget is used and managed in the best interests of their clients and that the costs of research are allocated fairly between client portfolios under Article 13(6) and 13(8) of the MIFID II Delegated Directive will be particularly important…” 61 We have seen that this is of course a more acute issue where the non-EU delegate is based in a jurisdiction where local research providers are not permitted to charge separately for research. 62 EC (201 d) states that “1. “a third country broker-dealer may receive combined payments for research and execution as a single commission when providing such services to a MiFID II Portfolio Manager or its Third Country Sub-Advisor, as long as the payment attributable to research can be identified. The MiFID II Portfolio Manager or its Third Country Sub-Advisor which operates a RPA is responsible for managing its research budget based on a reasonable assessment of the need for research and subject to appropriate controls, which include maintaining a clear audit trail of payments made to research providers. In addition, the MiFID II Portfolio Manager or its Third Country Sub-Advisor which operates a RPA must be able, at all times and based on its own internal allocation/budgeting process, to identify vis-à-vis its own clients the amount spent on research with a particular third country broker-dealer.” 63 EC (201 d) states that “Based on an interpretation of article 13(9) of MiFID II Delegated Directive, in both cases — where research is paid for by means of a RPA or directly out of the MiFID II Portfolio Manager’s or its Third Country Sub-Advisor’s own resources — the MiFID II Portfolio Manager/Third Country Sub-Advisor is responsible for ensuring compliance with the requirements of Article 13. These include the requirement to identify a separate charge for research supplied by third country broker-dealers. In the absence of a separate research invoice, the MiFID II Portfolio Manager or its Third Country Sub-Advisor may decide, among other things, to consult with third parties, including the third country broker-dealer, with a view to determining the charge attributable to the research provided. The supply of and charges for those benefits or services shall not be influenced or conditioned by levels of payment for execution services.”
arrangement in cross border-context which involves a UK asset manager paying the EU entity of a broker for global research content.
In fact, firms have taken various approaches to paying for research from providers of non-EU origins. First, some firms have sought to ring-fence research received by their in-scope EU firms under an RPA by only contracting with the European entity of a given research provider (i.e. only contracting with research providers who are able to make a separate charge for research).
Second, some firms have adopted a “global” (i.e. across the group) usage model under which a set percentage of the total global/group research use is allocated to the inscope EU firms and paid by those firms out of their own P&L. That methodology is often based on something like head-count (such as the proportion of a team's headcount domiciled in the relevant EU firm), with some form of internal charge/payment then made against/paid by the EU firm.
Many MiFID II-in scope firms have, however, continued to contract directly for research with US brokers, relying on the SEC’s no-action letters. An important question is whether MiFID II-in scope firms could purchase research originating from US brokers using an approach other than the two described above, i.e., (a) contracting with the brokers’ European subsidiaries or (b) transfer pricing within asset manager group?
In a speech on 28th March 2019, Jay Clayton, SEC Chairman, (see Clayton (2019)) suggests that: “It is our understanding that some market solutions have developed that may make extending the no-action relief unnecessary. For example, some asset managers have addressed the MiFID II unbundling requirement by absorbing the cost of research themselves and having their funds pay their brokers for trade execution services only. Other asset managers have created Research Payment Accounts to budget and track research costs at the fund level, permitting the funds to continue to pay for research through soft dollars and reconciling those payments to ensure compliance with MiFID II.”
In the first of these two solutions, Clayton is referring to the so-called ‘research rebate model’ adopted by several US asset managers[64] including, most notably, MFS Investment Management. (Several other firms have followed the MFS lead including TIAA and Capital Group according to Bragg (2019).)
Under the research rebate model, an asset manager pays for research from US brokers via soft dollars but then reimburses the funds it operates for the research payments made, in effect taking on the cost of the research itself. The primary challenge in this approach is that calculating the research element at the level of an individual fund may be difficult if a block trade is implemented for multiple funds simultaneously and if the block traded is directed across multiple trading platforms.
The operational problem is quite likely to raise major compliance issues if a rebate is calculated wrongly because this will undermine the correctness of the manager’s daily fund valuation (even if only slightly). For a fund to be confident in taking this approach, it either must have superior processes and systems so it can be sure of avoiding operational problems or it must be conducting a relatively simple business, for example managing assets for a small number of large internal funds. For complex, global asset managers, the feasibility of the rebate model, thus, remains to be established. Over time, if firms enhance the quality of their Information Technology systems, it may be more feasible to implement such approaches.
On the second solution mentioned by Clayton, establishing RPAs that permit one to calculate research costs at an individual client level is an option that has been rejected by almost all large MiFID II-in scope asset managers in Europe. As discussed in Subsection 3.6.4, these firms have almost universally chosen to pay for research via P&L in part for competition reasons but also because of the operational complexities of reconciling client-level research costs when making block trades across multiple platforms. The practical difficulties of operating RPAs for managers with complex business models parallel those created by the rebate model.
Blass (2019) (see footnote 57) also mentions the approach taken by Merrill Lynch of shifting research analysts into a separate entity which is registered as an investment advisor. (Bragg also suggests that other brokers are evaluating this approach.) US brokers that participated in interviews for this study reported that this approach would be difficult for them to adopt.
The restrictions that the US Investment Act place on brokers receiving payments for research from investors may be appropriate, on customer protection grounds, in the case of retail investors. They are less obviously justifiable in the case of institutional investors, however. Either a acceptance by the SEC of a broader interpretation of ‘special compensation,’ a law change in the US or a rule change for MiFID II in-scope firms allowing them exceptionally to buy research from US brokers via variants of CSAs/CCAs (rather than full RPAs) may ultimately be the only solutions to reconciling the US and European regulations, therefore.
In the short run of the next three years, the no-action letter approach appears the only practical solution. Large European asset managers interviewed for this report suggested that if the no-action letter were not renewed, rule changes possibly involving variants of the CSA or specific contracts for purchases of research from US broker dealers only might be required.
3.9.4 Intra-group research sharing
Our interviews with both buy- and sell-side firms suggested that sharing of research within firms is an important issue both for regulatory and commercial reasons. On the buy-side, in-scope firms are keen to show they are not receiving any research for free in order to satisfy restrictions on inducements. They are also concerned to comply with contracts if these do not provide for global access.
On the sell-side, some specialist brokers (for example, regional banks with particular geographical specialisations) told us they were concerned about how global asset managers control exchanges of information internally. Research ideas that are shared may be few but these may be the main source of value of the research service. Brokers see this as a commercial issue but think regulators should be policing exchanges of research within global groups.
How do major buy-side firms police internal sharing of research ideas? A typical policy within a global asset manager would restrict or control systematic sharing of research from a particular research provider but would permit exchanges if ideas and attaching of occasional documents to internal chat room messages.
A large European asset manager, representative of other comparable firms, told us that, in sharing research intragroup, they distinguish between equity and fixed income. Equity research consumption is global. Teams exchange information freely with other teams on the basis that clients benefit if information is shared. Research contracts are unrestricted in how research is received and shared. If a team consuming research is all in the UK, then payments are all made from P&L. If other clients use the same strategy, then an amount of spending may be allocated to them and this is paid out of commissions. Following this approach, there is no need to limit sharing of research. This firm, like others was unclear what they would do if they were prevented from paying a US broker with hard dollars. Their current model would be threatened.[65]
What can one conclude from the above discussion? The current MiFID II rules present both firms and regulators with some major challenges in squaring requirements with those imposed in other jurisdictions. As regards purchases of research by in-scope MiFID II firms from US research providers, current arrangements rely heavily on the SEC’s no-action letter and no straightforward alternative way of resolving the contradictions of European and US rules appears to be available.
3.10 MiFID II implementation
The experience of European buy-side firms in implementing MiFID II appears to have been bimodal for equity research. For large asset managers (examples include global firms located in the UK and some Swedish asset managers that unbundled early), there was considerable continuity pre- and post-MiFID II. On the other hand, MiFID II has represented a major shock to working practices and arrangements for smaller continental European firms.
The continuity is explained by the fact that many UK-based firms and large firms located in other European countries had implemented CSA arrangements and were already largely unbundled in their approaches. Large Swedish firms, in particular, made systematic efforts to unbundle in 2015 following 2014 guidance by the Finansinspektionen.
Several major Swedish asset managers described for us the unbundling process that occurred in Sweden in 2015. This involved the larger firms instituting transparent research budgets and making clear to brokers that they expected these budgets to be the basis for payment under bilateral invoices. Research providers were, in some cases, initially reluctant to price research explicitly but after several iterations of annual negotiation a satisfactory equilibrium was achieved. According to these firms, further clarity in research pricing has been assisted by the introduction of MiFID II.[66]
Many large UK-based asset managers had adopted CSA-based unbundling well in advance of MiFID II. One representative firm which unbundled with CSAs a decade ago and then progressively enhanced its procedures, told us that, through this process, it had accomplished 95% of the task of implementing the MiFID II research rules. Another UK-based asset manager explained they had unbundled through CSAs in 2012 and were very clear about the distinction between execution and research costs. They were compliant with MiFID II 90 days before deadline. This was simplified by the fact that they had already implemented systems for budgeting, paying and disclosing at a fund level for CSA purposes. Very large European asset managers were reportedly in a similar position having unbundled through the adoption of CSAs from 2014 onwards.[67]
In marked contrast to the large firms we interviewed, many small and medium firms emphasized the substantial fixed costs they faced in implementing systems and approaches. Several medium sized continental firms we interviewed found implementation costly and complex. Despite this, after putting the arrangements in place, they said were not so keen on any changes because this would entail more disruption.
3.11 Corporate Access
Corporate Access will be discussed at some length in Section 10 below but here it describes the guidance provided by the ESMA on the treatment of corporate access under the MiFID II regime.
Note: The figure above corresponds to question no. : ‘Does your firm find it challenging to distinguish which Corporate Access activities should be paid for and which are Minor Non-Monetary Benefits?’
Specifically, ESMA has clarified (i) that corporate access cannot be regarded as research and (ii) that corporate access services such as field trips, conferences and individual meetings involving a corporate issuer and facilitated by an investment firm that are material benefits cannot be treated as minor non-monetary benefit. Arranging a meeting itself does not amount to providing material or services that recommend an investment strategy or material view on the value of financial instruments or assets and therefore does not qualify as research, but a discrete service. ESMA expects firms to fully assess whether corporate access activities such as field trips, conferences and individual meetings involving issuers are material benefits or MNMB.
Figure 3.10 shows that a large majority of the buy-side respondents (61%) find it challenging to distinguish between corporate access activities and MNMB.
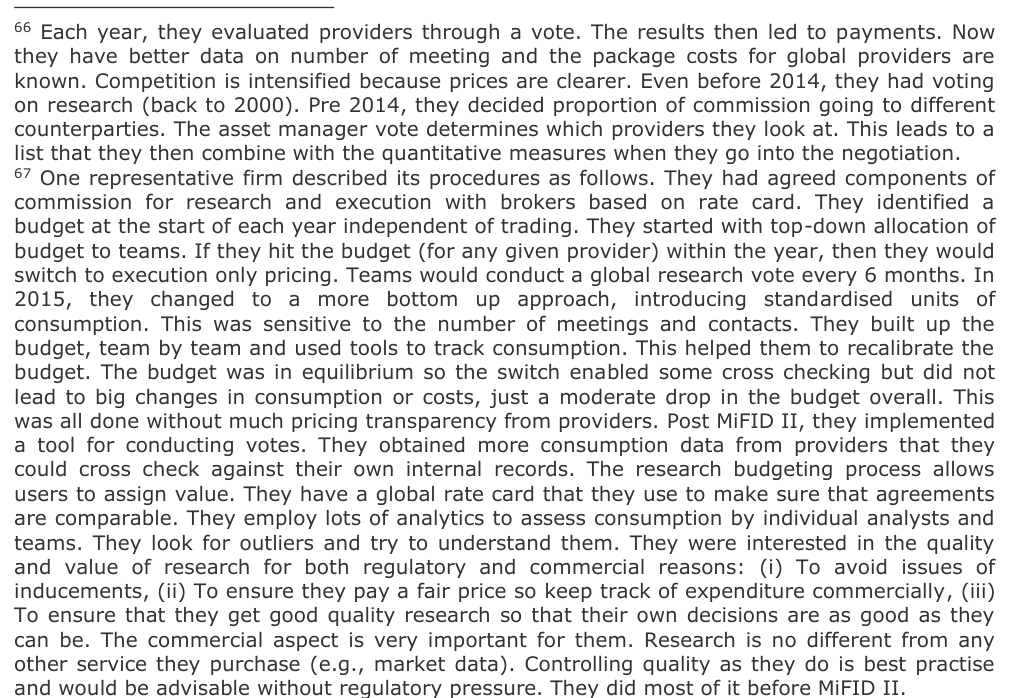
3.12 Conclusions on legal landscape
Interviews and surveys confirm that the large majority of European asset managers chose to pay for research through P&L.[68] Interviewees attributed the choice to competition considerations although administrative, reporting and operational considerations were regarded as serious for complex asset managers.
Even if asset managers choose to pay for research from their own P&L, they must monitor research usage and quality in order to avoid suggestions that they are accepting inducements. To evaluate research quality (an essential requirement under MiFID II) asset managers rely mostly on broker votes (aggregating judgment-based scores provided by portfolio managers) supplemented with usage data. Very few asset managers employ quantitative, statistical evaluations of research provider accuracy.
Inconsistencies between MiFID II and regulatory regimes for investment research in other jurisdictions, most notably the US, present challenges for European asset managers. These challenges include (i) policing intra-group research sharing that otherwise might expose European managers to infringing inducement rules and (ii) buying research from non-EU (specifically US) providers that might require the latter to infringe US restrictions on direct (non-bundled) research payments by brokers if the SEC’s current no-action letter were not to be extended.
Global asset managers reported that they had adopted approaches for limiting but not precluding intra-group research that they believed are compliant with regulations (although they seem to vary significantly across firms). No global firms interviewed had clear solutions to buying research from US providers in the absence of an SEC noaction letter.
The one possible solution that has been discussed by market participants and regulators is the research rebate model. Adopted by a small number of US asset managers, this ‘model’ involves repaying investors the fraction of broker commission attributable to research. The approach permits the manager to assume the research costs on their own P&L without paying hard dollars to brokers for research. But, like operating RPAs, the approach is very demanding of systems and processes for multifund asset managers that perform block trades across multiple transaction platforms. The practical challenge is that regulations and market practice require extremely accurate daily fund valuations so any inaccuracy in rebated amounts could interfere with contractual and regulatory requirements. Hence, the feasibility of the research rebate model for widespread adoption remains to be established.
4. The Impact of MiFID II on Budgets and Pricing
4.1 Introduction
This section focuses on the effects of MiFID II on budgets and pricing. MiFID II represented a major shock to the bargaining power of consumers and providers of research related to European corporates. The shock resulted from the fact that (i) some asset manager consumers of research adopted more transparent processes for buying research (RPAs) whereby investors could more clearly observe what was being spent on research, and (ii) because other asset manager consumers started buying research from their own P&L. Either approach plausibly led to lower willingness to pay for research consumers.
The impact of any shock to a market is likely to feed through in a sequence of observable effects. As supplier bargaining power fell, one might expect to see a decline in budgets and then prices paid for research, the topics covered by this section. Sequentially, one would expect the impact effects to affect coverage rates and volumes of research consumed (examined in Section 5), research quality (Section 6), provider numbers (Section 7), strategic decisions around research consumption and provision (Sections 8 and 9) and impacts on issuers (Sections 10 and 11).
Note that the nature and magnitude of the shock varied depending on the degree to which firms in different jurisdictions had already moved in the direction of unbundling. The UK subsidiary of one global firm told us that, in their case, the unbundling requirements of MiFID II were 90% complete before MiFID II because of its widespread use of CSAs and its implementation of best practice systems for research budgeting, monitoring and quality assessment. Similarly, large Swedish asset managers that we interviewed adopted an unbundled approach in 2015 in response to encouragement from the Finansinspektionen and regarded MiFID II as, in broad terms, straightforward to implement.
4.2 Impact on research budgets
Figure 4.1 presents evidence from our buy-side survey of the distribution of budgets and how research budgets evolved since the introduction of the MiFID II rules. The upper part of Figure 4.1 shows the distribution of 2017 budgets (measured on a log scale). In this as in some subsequent figures, the median appears as a line while the edges of the boxes represent the quartiles (i.e., the 25% and 75% quantiles, denoted Q[25] and Q[75]). The height of the box is, therefore, the Interquartile Range (IQR) defined as Q[75] −Q[25]. The so-called whiskers below and above the boxes represent, respectively, Q[25] −1.5 × IQR (the lower whisker end) and Q[75] + 1.5 × IQR (the upper whisker end). The dots beyond the whiskers in the figure indicate the outliers. The medians are labelled as Q2 in the figure.
The budgets range from over EUR 100 million to some budgets well below EUR 1 million. A few firms have large budgets for internal research but the median is close to zero as is the budget for credit research in 2017. The median budget for SME equities research is in the tens of thousands of Euros with slightly fewer than 25% of respondents reporting budgets greater than EUR 1 million. Only a single outlier respondent in the sample reports a credit related research budget in 2017 around EUR
1 million. This is striking in that our sample includes some of the largest global firms (as well as medium and small investment firms).[69]
The lower part of Figure 4.1 shows the distributions of changes in research budgets from 2017 to 2018 and from 2018 to 2019. In the distributions, the dotted lines indicate the position of the means and medians. These are labelled in the figure. The width of the graphs indicates the distributions with the wider regions corresponding to budget changes with high probability and narrower regions corresponding to lower probability. The dots within the graph show the individual data points.[70]
Overall budgets (inclusive of planned expenditure for both the internal and external research) shifted relatively little on average between 2017 and 2018 although one may observe extremely wide[71] variations in the research costs of some firms, both positive and negative. The relatively small average shift is striking because some have argued that MiFID II substantially reduced research costs. FCA (2019) reports the results of a survey 40 buy-side firms and interviews with 10 buy-side and sell-side firms. The findings include that MiFID II improves buy-side firms’ accountability and scrutiny over both research and execution costs. FCA estimate that the MiFID II unbundling rules result in savings of about GBP 70 million for investors in UK-managed equity portfolios in the first half of 2018 compared with 2017.
While research budgets may not have shifted much on average, the decrease in larger firms appears to have been larger. The results shown in Figure 4.1 do not differentiate between asset managers based on size of Assets under Management (AUM). So, one may still conclude that research budgets for the market in total were reduced by MiFID II.
Figure 4.1 shows that, between 2017 and 2018, mean percentage changes in budgets for equity research were distinctly negative both for Mid and Large Caps (-19%) and for SMEs (-13%)). Further percentage mean declines occurred between 2018 and 2019 but the magnitudes were lower at -6% for Large and Mid Cap and -2% for SME equities.[72] It is notable that SME research budgets declined less. This finding contradicts a common presumption that MiFID II disproportionately increased the pressure on research for small firms. FCA (2019) study also records a reduction in research budgets for equity research of around 20% to 30%.
In credit, there were some very substantial percentage changes between 2017 and 2018 as many firms counted their budget as zero pre-MiFID II. The mean budget change reported (ignoring infinite values) is 166% between 2017 and 2018 and 3% between 2018 and 2019. The survey results on credit research are slightly surprising as some firms that were interviewed as part of the project reported that costly subscriptions to ratings agency services made up a lot of their credit research budgets before and after MiFID II. Note that in the picture shown in Figure 4.1, the distribution for credit budget percentage changes is truncated since otherwise the length of the positive tail made the distribution hard to view.
Figure 4.2 shows buy-side estimates of changes in their research consumption since
2018. On the consumption of SME equities half of the respondents reported decrease. However, on credit research consumption, only 40% reported a decrease which is closely followed by the percentage of respondents who did not change their credit research consumption (35%). For the consumption of large and mid-cap equities research, majority of the respondents (54%) reported a decrease. Additionally, while a small percentage of respondents reported increase in the SME equities research consumption (4%) and large and mid-cap equities (2%), none of the respondents reported an increase in their consumption of research on credit securities.
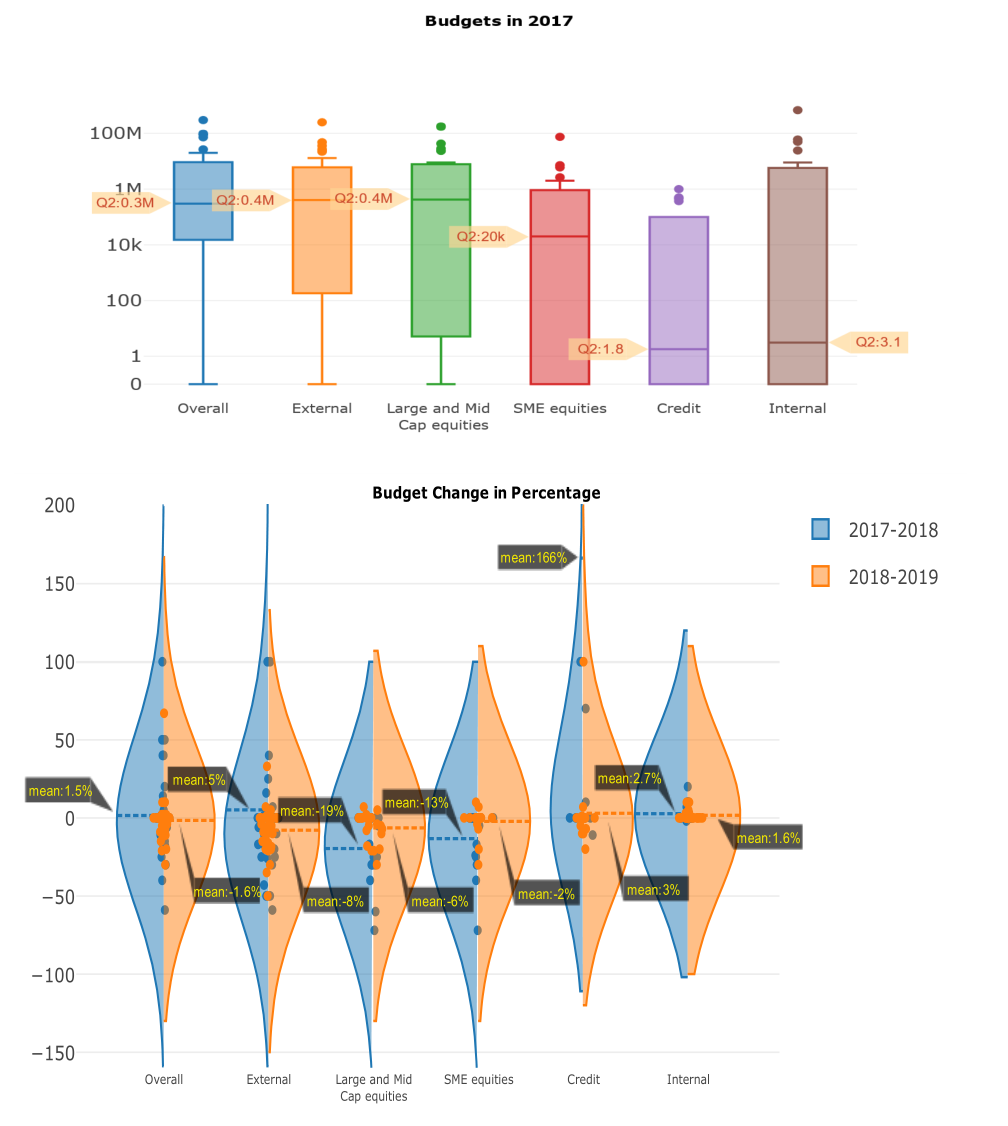
Note: The figure above corresponds to question no.19 from the buy-side survey: ‘By your estimate, how much were your firm's research budgets in 2017, and how did research budgets evolve in 2018 and 2019?’.
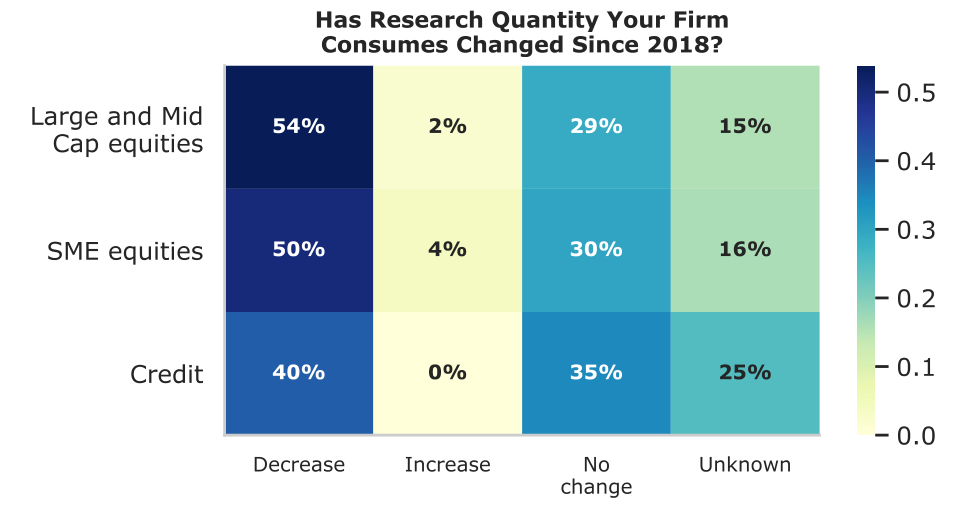
Note: This Figure corresponds to buy-side survey questions no.58: ‘Has the quantity of research that your firm consumes on (i) Large and Mid Cap Equity, (ii) SME Equity and (iii) Credit changed since January 2018?’
4.3 Impact on research pricing and broker profitability
Now, consider research pricing and the costs. Illustrating how the market works, a representative bulge bracket bank told us that they have somewhere in excess of 1,000 research clients in Europe. The large majority pay less than EUR 50,000 but some pay up to EUR 0.75 million (including read-only and high touch services). This may be contrasted with the widely discussed offer by JP Morgan to its customers for read-only research access of USD 10,000 per annum.
The process that brokers followed in negotiating research prices in the post-MiFID II environment as laid out for us by several large firms. Negotiation took the form of horse-trading, starting with a target amount (from the broker’s point of view) and with distinctions between cases in which the client wants read and analyst access. Some clients volunteered a rate card which the broker would generally accept. For small clients, brokers determine a price based on judgment subject to price minima.
In 2017, brokers derived target amounts from historical usage and aimed to keep continuity in revenues. The larger, better organised brokers had Customer Relationship Management (CRM) systems prior to MiFID II which showed the research consumption of different clients. This was not possible for Fixed Income research so prices were deduced for clients based on a reasonable split.
What is the evidence on how pricing evolved from per- to post-MiFID II? The leftmost panel of results in Figure 4.3 shows buy-side survey responses on the impact of MiFID II on research pricing and costs. On the cost of external SME equity research, a large fraction, 37%, report that the cost was stable following MiFID II, 25% of the respondents believe that the cost has decreased and 12% view that the cost has increased. These figures may be contrasted with buy-side responses on Large and Mid Cap equity research for which more firms reported decreased costs. On credit research, again, a large fraction of firms, 37%, believe that the cost has been stable but 27% take the view that the cost has increased and only 10% say it has declined.
Figure 4.3 also presents results on buy-side perceptions of the relative costs of broker and IRP research and research supplied by EU or US brokers. Among respondents who reply (many select the answer “Unknown”), the largest fractions report that IRP research is priced at a premium in all three categories of Large and Mid Cap equities, SME equities and Credit. This finding is consistent with comments made by buy-side interviewees. Where firms purchase corporate-related research (on equities or credit) from IRPs, they typically do so with the idea that this research is unusually expert or specialised and, therefore, are willing to pay a premium. Again, in all three categories, the largest fraction of firms that reply (rather than selecting “Unknown”) see EU and US broker research as being equally costly.
Interviews with buy-side firms provided interesting perspectives on how research pricing was determined in the early period of MiFID II. Some buy-side firms told us that equity brokers initially tried to increase equity research prices in 2017 but pressure from large asset managers that were paying for research out of P&L prevented this. Buy- -side firms reported that very large, global buyside firms managed to reduce their research costs by 30% from 2017 to 2018. Most buy-side firms interviewed (which were non-global even if, in some cases large, gained much less if at anything and medium and small firms typically had rather stable costs.
Figure 4.3: Buy-Side View on Research Pricing
Note: The left panel corresponds to question no.24 from the buy-side survey: ‘In your view, has the all-in cost of external research changed since January 2018 in the cases of: Large and Mid Cap Equity research, SME Equity research, Credit research?’ The middle panel corresponds to question no.25: ‘In your view, is comparable research offered by IRPs more or less expensive than that of brokers in the three cases: Large and Mid Cap Equities, SME Equities, Credit research?’ The right panel corresponds to question no.2 : ‘In your view, is the all-in cost of comparable research from EU brokers more or less than the all-in cost of research from US brokers in the three cases: Large and Mid Cap Equities, SME Equities, Credit?’
Interviews with buy-side institutions provided further perspectives on research pricing. A typical account from a global asset manager with a large UK business was that the top 20 of their research providers take 80% of their budget. They are expected by regulators to ensure that payments are highly correlated with the top ranked provider (even though perfect correlation would be surprising in a market context).
Several global asset managers interviewees reported that they were able to reduce their overall research budget by 20% mainly through renegotiation. Another told us that they used a rate card as this protects them against suspicion of accepting inducements. Between 2017 and 2018, they were able to achieve a 40% reduction in budget, reflecting (i) a contraction in volumes (which subsequently stabilised), (ii) reduction in research prices and (iii) investment in internal research. Another large (but not global) asset manager told us they achieved a cut of about 5% in their budget from 2017 to 2018. This was much lower than the 30-40% that they had heard some other large firms had obtained.[73]
Figure 4.4 provides sell-side perspectives on research pricing from participants in the survey. The upper part of the figure presents results on how sell-side firms charge for their research. For clients that are subject to MiFID II, the majority of the sell-side (74%) provide access to their research via an all-inclusive annual access to a research platform. But, about half of sell-side firms also use (a) a vote approach whereby charges are made ex post depending on data or evaluation by the client of the contribution of the research or (b) an annual fee and a rate card for services. Global firms may use multiple charging approaches in different contexts. For clients out-ofscope for MiFID II, 60% of respondents report charging using a bundled approach and 31% report charging via credit spreads.
The lower part of Figure 4.4 presents the distribution of the minimum yearly fee for accessing research. The dotted lines appearing in the distributions indicate the positions of first, second (median) and third quartiles. These are labelled by Q1, Q2 and Q3 in the figure. The shape of the plots indicates distribution of the yearly fees reported with width of the sections indicating the probability the yearly annual fees will take on the given value on the y-axis. Wider sections are regions of high probability and narrow sections are regions of low probability. In the cases of credit and equity research the minimum fees range up to EUR 25,000 and EUR 100,000, respectively. While the equity research median is around EUR 10,000 that for credit research is closer to EUR 2,500.[74][75]
In interviews, brokers reported that the price pressure was greatest from the two extremes of the spectrum of clients. Large buy-side firms pushed aggressively for reduced costs while small asset managers had difficulties with proposed pricing and, hence, tried to negotiate hard. A very large global buy-side firm managed to negotiate reductions in payments from major brokers exceeding 40% and accounts from different firms (large and small and on both of the market) suggest that the main gainers were global buy-side institutions.[76]
Interviewees from some of the largest bank brokers told us that their MiFID II-in scope clients had cut the amounts they were willing to pay on average by 30%. The impact on sell-side firms was greater because the largest proportional declines were actually among the largest research consumers. But, the effect of these changes on the large brokers was substantially mitigated even within Europe by the fact that a surprisingly large fraction of research clients were out-of-scope for MiFID II and remained unbundled. Hence, the total revenue effect in Europe was only about half of the 30% figure.
Brokers interviewees reported specific regional patterns. For example, some Nordic brokers told us that credit research pricing in their area is very low and that some firms treat components of research as MNMBs not subject to charging and are less scrupulous about accepting research for free than asset managers elsewhere in Europe.
Buy side firms were much more concerned about the pricing of research from brokers than from IRPs but, for completeness, it is worth considering IRP experience on this issue. Figure 4.5 provides IRP perspectives on the effects of MiFID II on research pricing. 79% of IRPs say that they have reduced their prices following the introduction of MiFID II. A large fraction (64%) also report that buy-side clients are evaluating research quality more carefully following MiFID II. While they represent a small fraction of most buy-side firms’ research budgets, the experience of IRPs dramatically reveals the price pressure on research suppliers.
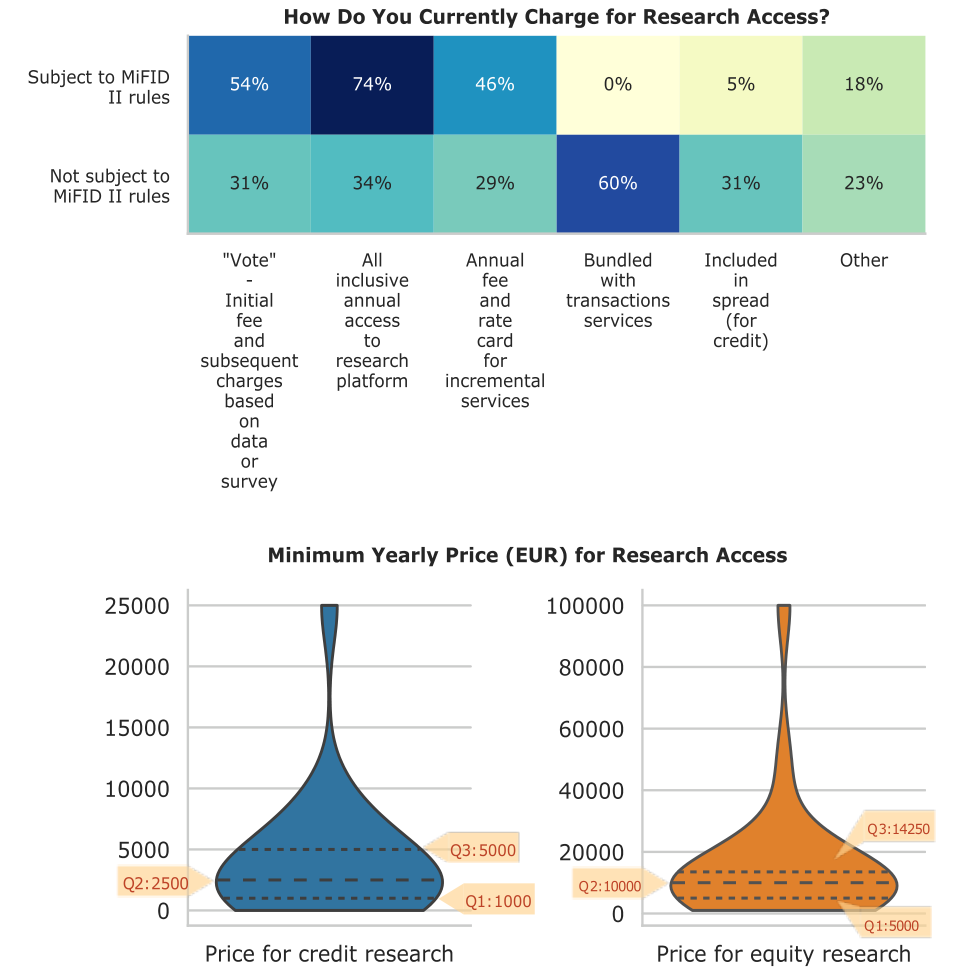
Note: The top panel corresponds to question no. : ‘How do you currently charge for access to research for clients (i) subject to MiFID II rules and (ii) not subject to MiFID II rules?’ The bottom panel corresponds to question no. 5: ‘What is the minimum yearly price for accessing your research?’
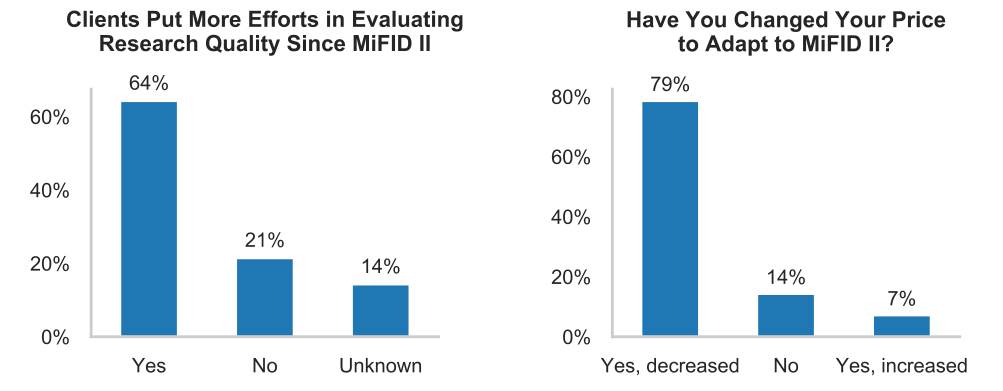
Note: The left panel corresponds to question no. ‘Have your clients put more efforts in evaluating the quality of research since January 2018?’ The right panel corresponds to the question no. 5 ‘Have you changed your price to adapt to MiFID II?’
4.4 Financial pressures on research providers
While the price shocks described above appear very considerable, the effect on research providers was mitigated by the fact that a large fraction of asset manager clients even within Europe remained out-of-scope for MiFID II. One very large bank told us that of its European clients, half remain out-of-scope for MiFID II. Outside the
commonly expressed the expectation that research fees would decline in future but a few commented that the price of expert, specialist research may well harden as providers became more aware of their own value.
UK, mutual funds and hedge funds are out-of-scope. The split varies a lot across countries. One bank told us that, in Germany, two third of its clients were out-ofscope.
Other brokers also reported that many of their European research clients are out-ofscope for MiFID II. In some cases, for example Finland, this reflects the fact that there are substantial funds that are out of scope, for example pension funds. A large Nordic bank told us about clients in their region. They estimate that 90% are in-scope for MiFID II. By value, the percentage falls to 75-80% because of the presence of some very large pension funds.
In other cases, in Southern Europe, brokers say they do not fully understand why some asset managers are out of scope. One broker identified a large and well-known Southern European asset manager that took steps to organise its activities and payments across multiple European entities, reportedly with the objective of being out of scope for MiFID II even though it has a substantial classical asset management business. Some buy-side firms also told us that they believed some were using the fact that they had mutual fund activities to declare themselves out-of-scope even when the fact that they had pension mandates might mean they should be in-scope.
One very large bank interviewed as part of the project made the interesting comment that the decline in research revenue attributable to MiFID II had in their view been offset by a rise in execution revenues. They believe that asset managers became laxer about controlling execution costs when the focus shifted to research costs. Other brokers did not substantiate the comment. But, if true, it would have implications for the incidence of MiFID II impact on different research providers since clearly large firms with strength in execution services would be less affected by a MiFID II induced fall in research income.
On the cost side of research production, MiFID II undoubtedly placed additional burdens on research providers who were faced with the challenge of negotiating numerous legal contracts and monitoring research production to a greater extent. In interviews, firms talked about the very substantial legal and administrative burden of negotiating and putting in place, in the case of some brokers, hundreds of contracts.
Figure 4.6 shows the sell-side survey results on the evolution of the cost of producing research since MiFID II. Many respondents report that cost pressures are unchanged but about three times more report an increase than a decrease and more respondents flag up cost increases in SME equity research costs than in other areas. Specifically, for SME equities research, a large fraction reports no change in the costs of producing research (41.7%) while a significant fraction report increased costs (33.3%). On credit research costs of production, fewer than half of the sell-side respondents (44.1%) report no change. A smaller fraction (20.6%) report an increase and fewer still (14.7%) report a decrease since the application of MiFID II.
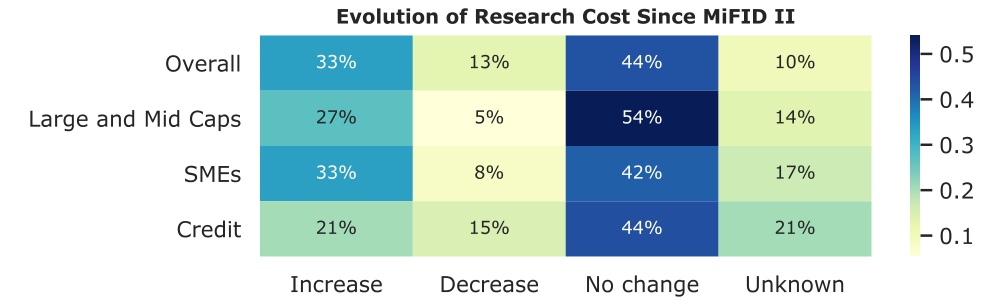
Note: The table above corresponds to question no.22 from the sell-side survey: ‘In the EU, since the introduction of MiFID II, how has the cost of producing research evolved in your organization. verall? For Large and Mid Caps? For SMEs? For Credit?’
4.5 Relative cost of investment research in EU and US
A natural control case for evaluating investment research in the EU is the state of research in the US. In the statistical analysis presented below, results for US firms will be displayed in order to provide perspective. Here, the relative costs of SME-related equity investment research in the EU and US as perceived by buy- and sell-side firms is examined.
Figure 4.7 presents the buy-side survey results on the cost of SME equity research in the US and EU. The majority of buy-side respondents (60%) have no view on the relative cost in the US and the EU. A fraction (17%) view research to be equally expensive between the US and EU, although this is closely followed by the fraction of respondents (13%) that view research to be more expensive in the EU. Only 10% consider that SME research is less expensive in the EU.
More than half (52.9%) of the respondents (excluding those who reported “Unknown” in the previous question) view greater regulatory burden in the EU as a factor in influencing the relative cost and 26.9% consider the greater competition in the US as a factor.
Figure 4.8 presents the results of the sell side survey on the comparative cost of the SME equities research in the US and EU. 28% view SME equity research to be more expensive in the EU. A smaller fraction (13%) view it to be more expensive in the US. A very small fraction (3%) see no difference between the cost of SME equity research between the US and the EU. On the factors driving the relative cost of research between EU and US, 31.4% of respondents attribute the higher degree of competition in the EU as a factor driving the cost differential. Majority of the respondents (54.1%) view greater regulatory burden in the EU as another factor. And 27.8% view the quality of research in the US and the EU as equal.
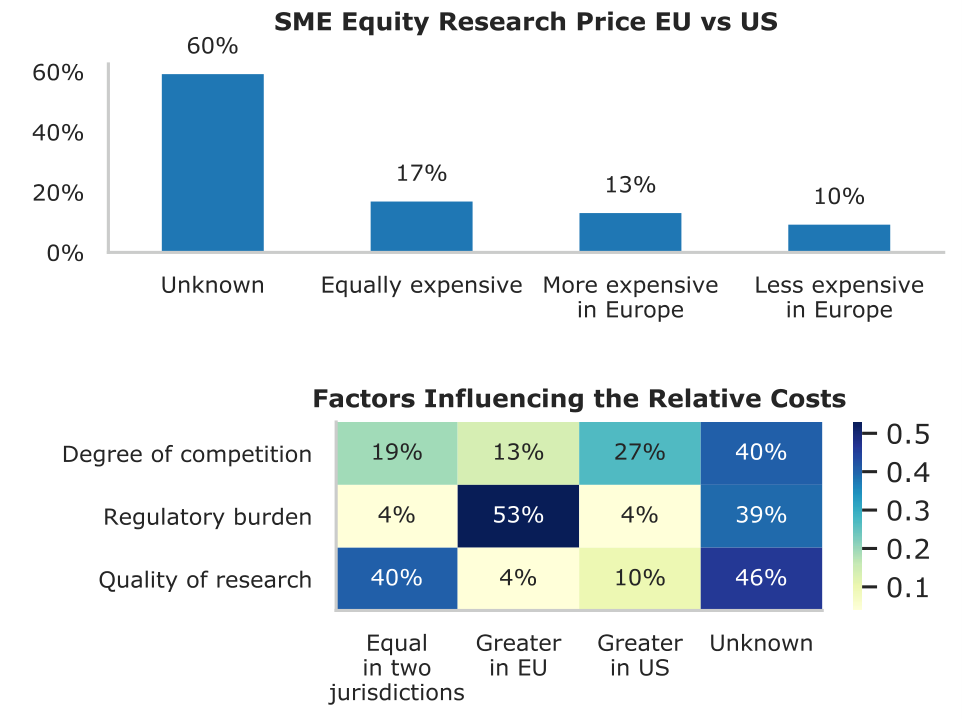
Note: The top panel corresponds to question no. 2 : ‘In your view, is Equity research for EU SMEs more or less costly than for US SMEs?’ The bottom panel corresponds to question no.28: ‘Which factors influence the relative cost across the two jurisdictions?’
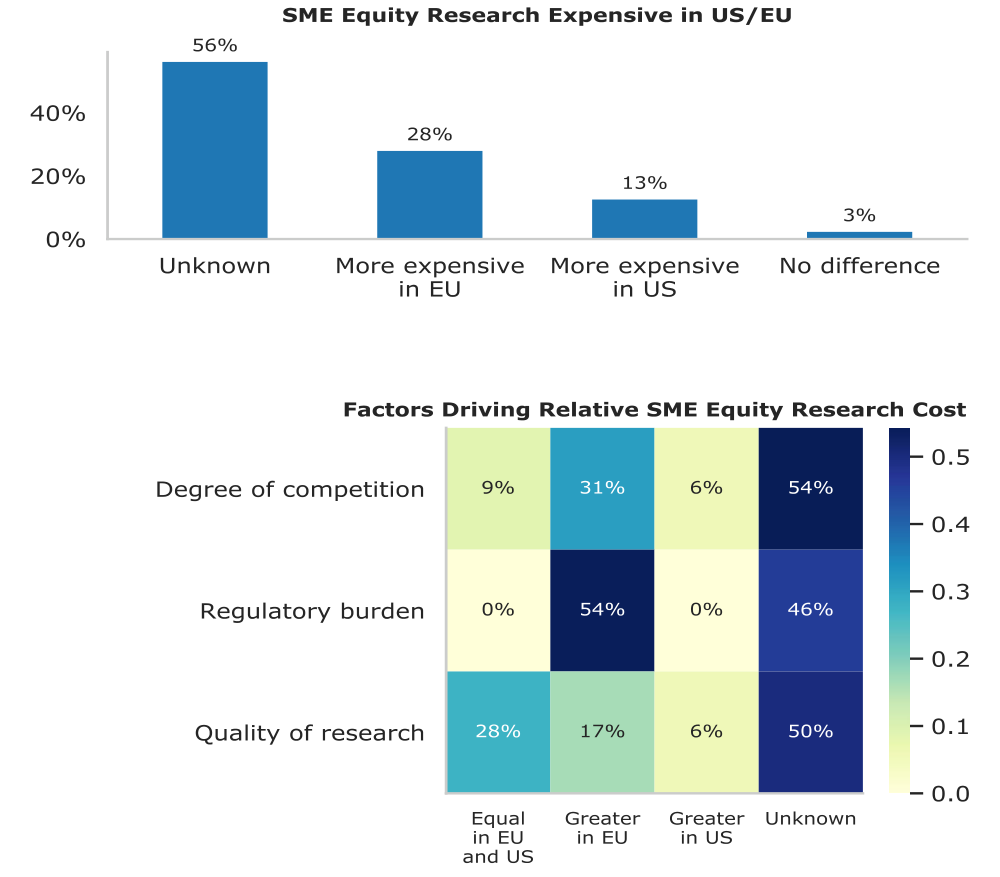
Note: The top panel corresponds to question no. : ‘In your view, is SME equity research more expensive in the US or EU?’ The bottom panel corresponds to question no. : ‘Which factors drive the relative cost of SME equity research in the EU and US?’
4.6 Under-pricing and customer numbers
Many interview participants were strongly of the view that major providers price their research below cost. Specialist brokers and IRPs made the point particularly strongly and argued that regulators should intervene to ensure that large firms were not able to abuse their position.
Figure 4.9 shows the survey results on under-pricing and numbers of customers. A large majority (72%) of sell-side firms believe that sell-side firms tend to under-price research. But the sell-side firms are split between those who believe that prices will tend to rise (41%) or not (48%).
(Small/Micro/Nano Cap) equities changed since January 2018?’ & ‘In your view, have MiFID II inducement rules affected transactions costs for SME (Small/Micro/Nano Cap) equities (by affecting either commissions or prices)?’The bottom two panels correspond to questions no. 1& 2: ‘How has the number of customers for which you deal in Credit securities evolved since January 2018?’ & ‘In your view, have MiFID II inducement rules affected execution spreads for Credit securities?’
The area in which scope for under-pricing appears most obvious is in Fixed Income. Since sell-side companies are making markets, research providers are highly motivated to maintain links with the buy-side to understand demand-side developments. They are, therefore, willing to provide research cheaply.
A typical comment from a global asset manager was that Fixed Income represents no more than 5% of their research budget. A large continental asset manager mentioned that some Fixed Income brokers offer research for $2,000 a year. This attracted the attention of their compliance colleagues who required them to avoid paying too little.
One European broker reportedly proposed a subscription fee of EUR 400,000 in April 2017 but this had fallen to EUR 4,000 by December of that year. One might think that the collapse in prices for Fixed Income research in 2017 after brokers had initially over-estimated what they could obtain means that current prices are too low.
Some brokers argue strongly that there is no under-pricing. One typical comment was that in his firm (which is a top-rated research house across asset classes), there is a team of credit analysis covering the same European bond issuers that are covered by a team of equity analysts that is 20 times larger.
The lower part of Figure 4.9 shows sell-side survey results on numbers of customer. A large fraction of sell-side firms (38%) report a decrease in the number of buy-side customers dealing in SME equities since 2018. A smaller number of firms report an increase (15%). On credit securities, most respondents report unknown or no change in the number of customers dealing while a small fraction (24%) report a decrease. More than half (51%) of the sell-side respondents believe that MiFID II has affected SME equities transaction cost. A small majority (49%) of the sell-side respondents do not believe that MiFID II has affected the credit securities execution spreads. Only 18% believe that the credit securities execution spreads have changed.
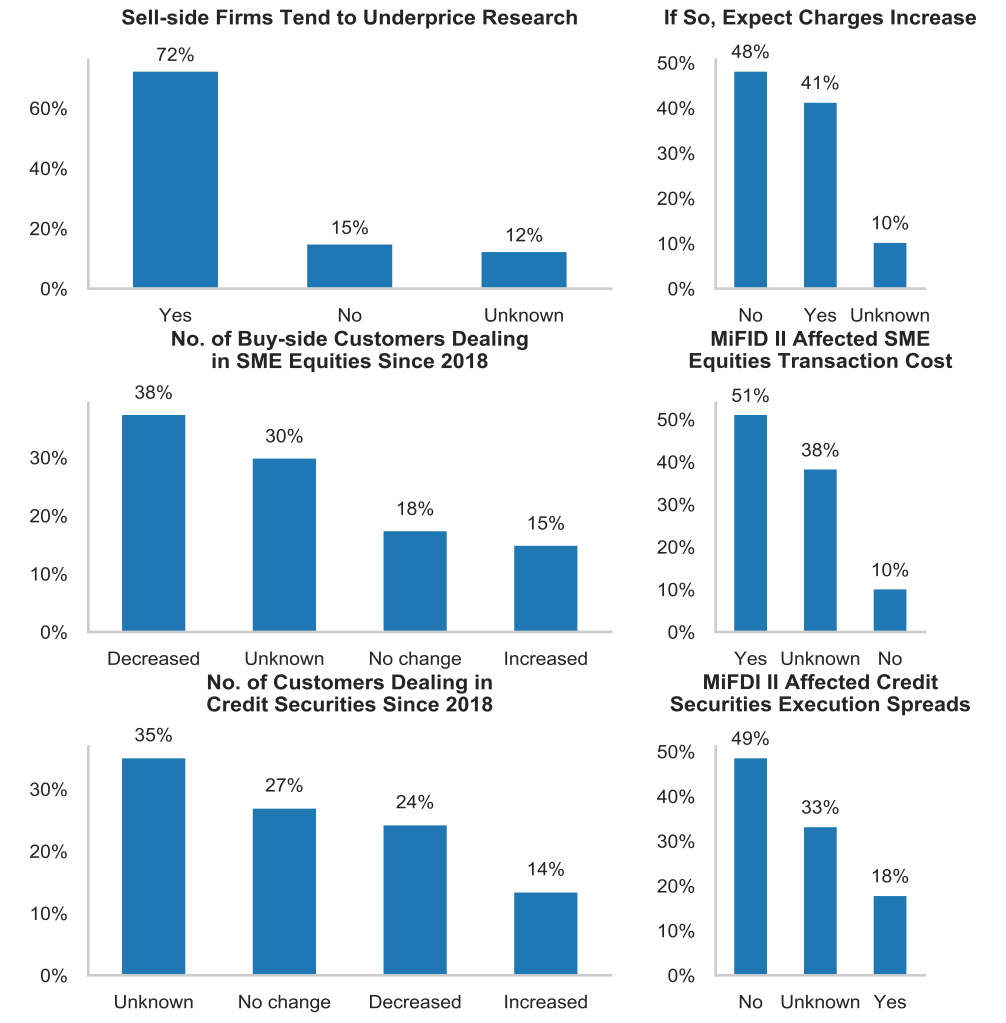
Note: Top two panels correspond to questions no. & 8: ‘In your view, across the market, do sell-side firms tend to under-price research?’ and ‘If so, do you expect the charges for research across the industry to increase over time?’ The middle two panels correspond to questions no. & 0: ‘How has the number of buy-side customers for which you deal in SME
4.7 Conclusions on MiFID II, research budgets and pricing
The greater transparency of research pricing and the adoption of P&L payments for research had a substantial impact on research provider-purchaser bargaining power and, hence, on buy-side budgets for external research.
From 2017 to 2019, budgets for external research on equities fell particularly for Large and Mid Caps. SME equity research budgets fell less. One may note that this finding runs counter to the common view that research on SMEs was disproportionately affected by MiFID II.
The biggest gainers from lower Large and Mid Cap equity research costs were global buy-side firms. Their external research budgets declined by 20 to 40% between 2017 and 2018 while the research budgets of medium and smaller asset managers changed little if at all.
As with budgets, research prices fell most for Large and Mid Cap equity research. Most buy-side respondents reported that prices of SME research were stable over the period of MiFID II implementation although somewhat more reported declines than increases.
While they take up only a small fraction of research consumers’ budgets, IRP survey responses reveal substantial price pressure in that 79% report dropping their prices in response to MiFID II. Sell-side firms report that the costs of producing research have increased since MiFID II with greater regulatory and administrative costs being frequently cited in interviews.
5. The Impact of MiFID II on Coverage and Volume
5.1 Introduction
This section analyses how MiFID II affected research coverage and volume. This topic is central to the current study, the motivation for which in part stems from a concern raised by some that MiFID II unbundling adversely affected research coverage for SME equity issuers and companies issuing corporate bonds.
To shed light on coverage and research volume, evidence based on surveys, interviews and statistical analysis is presented. Combining evidence from these sources raises issues of interpretation. Survey and interview respondents necessarily include nonspecialists so responses on particular points may reflect general market perceptions rather than fully reliable evidence.
5.2 Sell- and buy-side views on MiFID II, coverage and volume
5.2.1 Survey evidence
Figure 5.1 shows the results of the sell-side survey on the impact of MiFID II on research availability. 71% of sell-side respondents report that MiFID II decreased the availability of research on SME equities for buy-side firms while only 2% said it increased. 54% report that MiFID II had a negative impact on the availability of Large and Mid Cap equities research availability.
83%, 74% and 94% of sell-side respondents, respectively, identify reduced broker research as the main factor influencing SME equity, Large and Mid-cap equity and Credit research. Additionally, 12%, 25% and 6% of respondents report that reduced IRP research is a factor influencing SME equity, Large and Mid Cap equity and Credit research, respectively.
61% of sell-side respondents reported that MiFID II resulted in an increase in sponsored research for SME equities. However, for Credit securities and Large and Midcap equities, most respondents hold no view on the impact on sponsored research. 13% and 29% of respondents report an increase in sponsored research for Credit securities and Large and Mid-caps, respectively.[77]
Figure 5.2 presents the results of the sell-side survey on the firms’ own SME research coverage. The number of SMEs covered by the sell-side firms ranges up to 1,803 with the mean number of SMEs covered being 182. Additionally, some firms reduced while others increased their coverage after MiFID II, with the percentage changes ranging from -30% to 300%. Despite this considerable volatility, it is striking that the median percentage change is 0%.
has MiFID II affected the amount of sponsored research on for (i) Large and Mid Cap Equity,
(ii) SME Equity and (iii) Credit?’.
Figure 5.3 presents the sell-side survey results on the access to their research. Before MiFID II, 78% of the sell-side respondents provided access to their research on the client’s business potential and 52% based on the client’s Assets under Management (AUM). After MiFID II, AUM has become less important with a smaller fraction of the respondents (2 %) considering it as factor. Additionally, “other” factors have gained more prominence after MiFID II. Concurrently, a little more than half of the sell-side respondents (66%) report a decrease in customers accessing their research and only 22% reported an increase.
Figure 5.4 shows the views of IRP respondents on the impact of MiFID II. Equal and small percentages of IRP respondents report juniorization or seniorization in their research staff post MiFID II, while most report no changes. The figure also shows that an equal fraction of IRP respondents report increases or decreases in the number of customers that access their research since MiFID II, whereas only 14% report no change. For macroeconomic research, a large majority of the respondents report no change in the research production since MiFID II. For non-credit Fixed Income research, half of the IRP respondents report no change. For Large and Mid-cap equities and SME credit, a small majority report no change, this is followed by an equal fraction of IRP respondents that report increase and decrease in their research production.
"juniorization" or "seniorization" trend within your analyst staff since entry into force of MiFID II?’ Top right panel corresponds to question no. 26 ‘How has the number of customers accessing your research evolved since January 2018?’ Bottom panel corresponds to question no. 28 ‘In your view, how has the introduction of MiFID II affected your production of research?’
Figure 5.5 shows the results of the buy-side survey on their access to research. A large majority of the buy-side respondents (63%) report that MiFID II has reduced their overall access to EU SME equities research. While the investments in SME equities did not change for 52% of the buy-side respondents, 36% reported that the change in their access to SME equities had affected their investments in the same way. Additionally, although a little more than a third of the respondents did not report an impact on their funds’ performance, 25% cite a negative impact from the reduction in their access to SME equities research.
For credit securities, half the respondents (50%) reported reduction in their access to credit research. About a fifth of the respondents (22%) reported that their change in access to credit research had impacted their investments in credit securities and only 12% reported a negative impact on their funds’ performance.
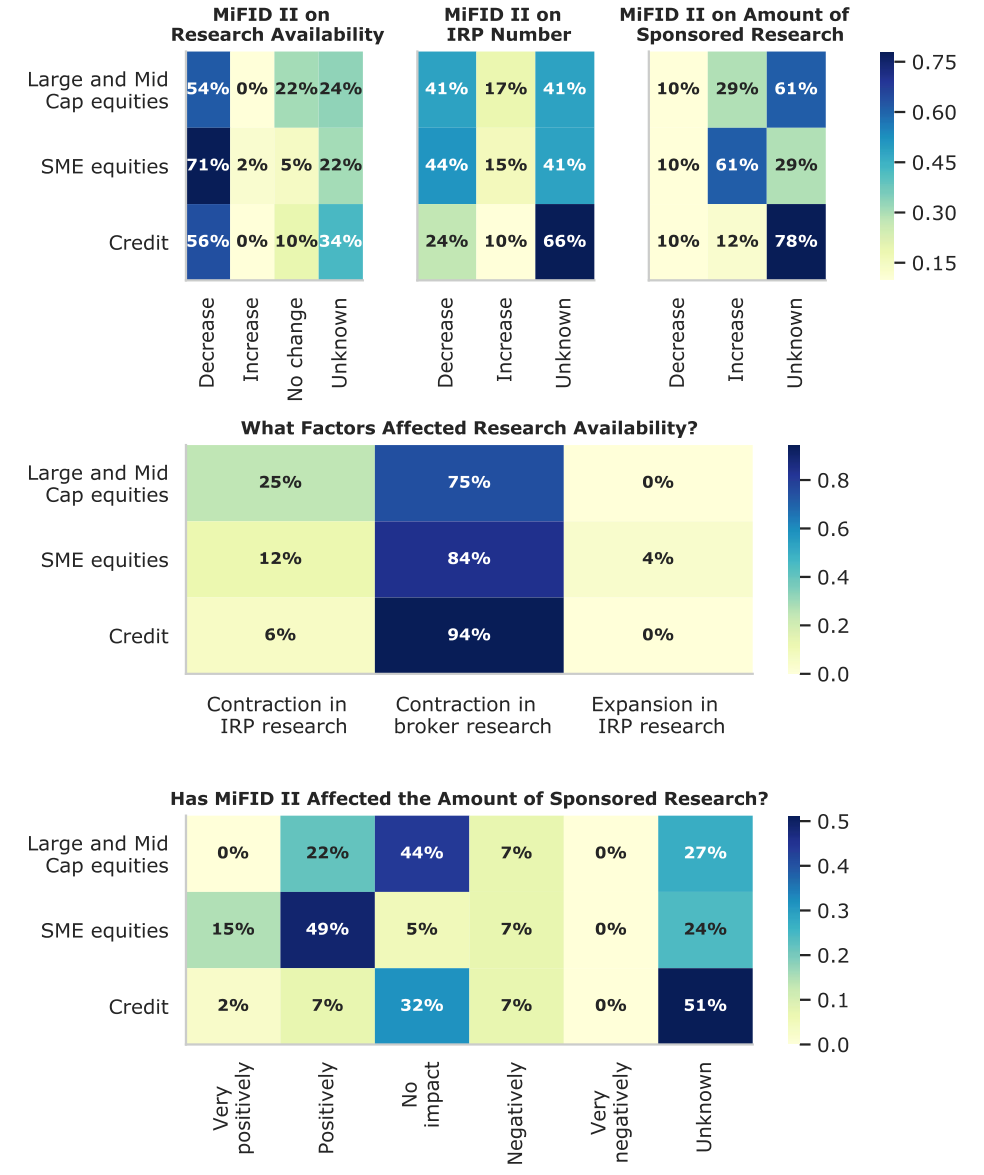
Note: Top left panel corresponds to question no.28: ‘In your view, for buy-side firms, how has the introduction of MiFID II affected the availability of research on: Large and Mid Cap Equities, SME Equities and Credit?’ Top middle panel corresponds to question no. 2: ‘Has MiFID II changed the number of Independent Research Providers for Large and Mid Cap Equities, SME Equities and Credit? Top right panel corresponds to question no. : ‘Has MiFID II changed the amount of sponsored research for Large and Mid Cap Equities, SME Equities and Credit? Middle panel corresponds to question no.2 : ‘In your view, for buy-side firms, which factors have influenced changes in the availability of research for: Large and Mid Cap Equities, SME Equities and Credit?’ Bottom panel corresponds to question no.50: ‘In your view,
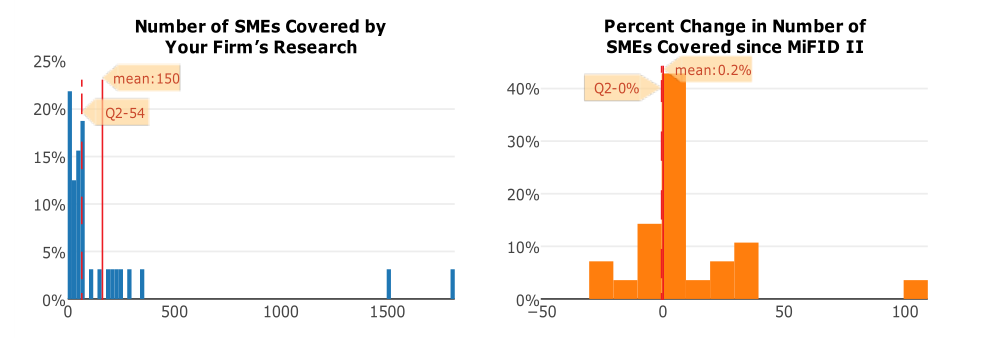
Note: Left panel corresponds to question no.20: ‘Please estimate the number of European SME firms (Small/Micro/Nano Caps) covered by your firm's research.’ Right panel corresponds to question no.21: ‘Please estimate how the number of European SME firms covered by your firm's research has changed since January 2018?’
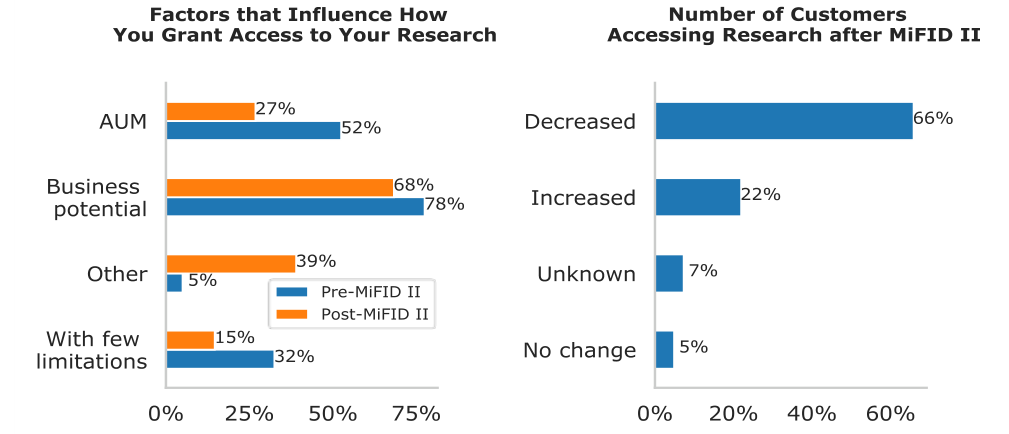
Note: Left panel corresponds to questions no.25&2 : ‘Prior to January 2018, what factors influenced how you granted access to your research to your clients?’ and ‘What factors influence the terms on which you grant access to your research to your clients currently?’ The right panel corresponds to question no.2 : ‘How has the number of customers accessing your research evolved since January 2018?’
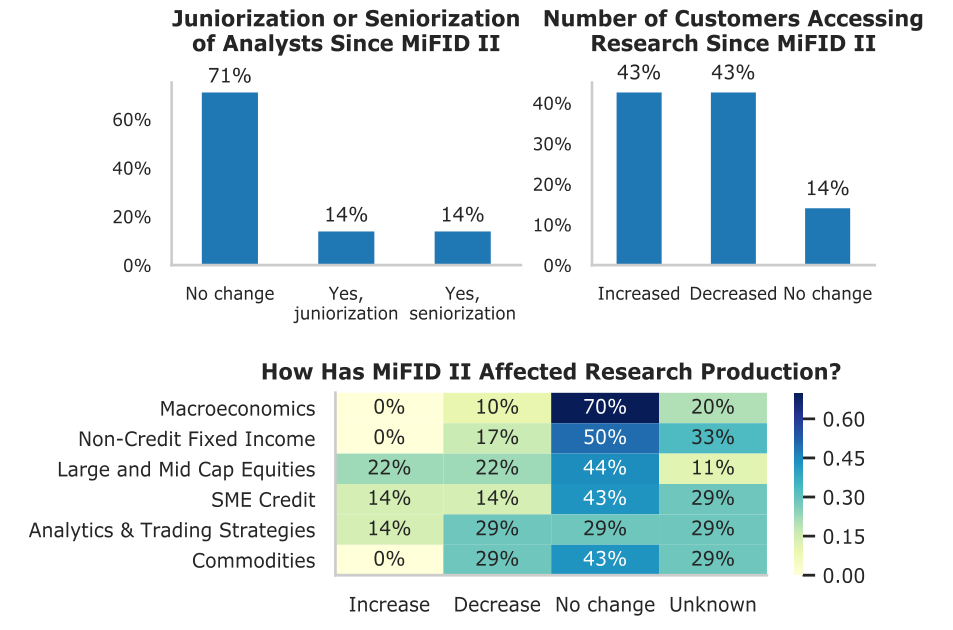
Note: The top left panel corresponds to question no. 12 ‘Have you observed a
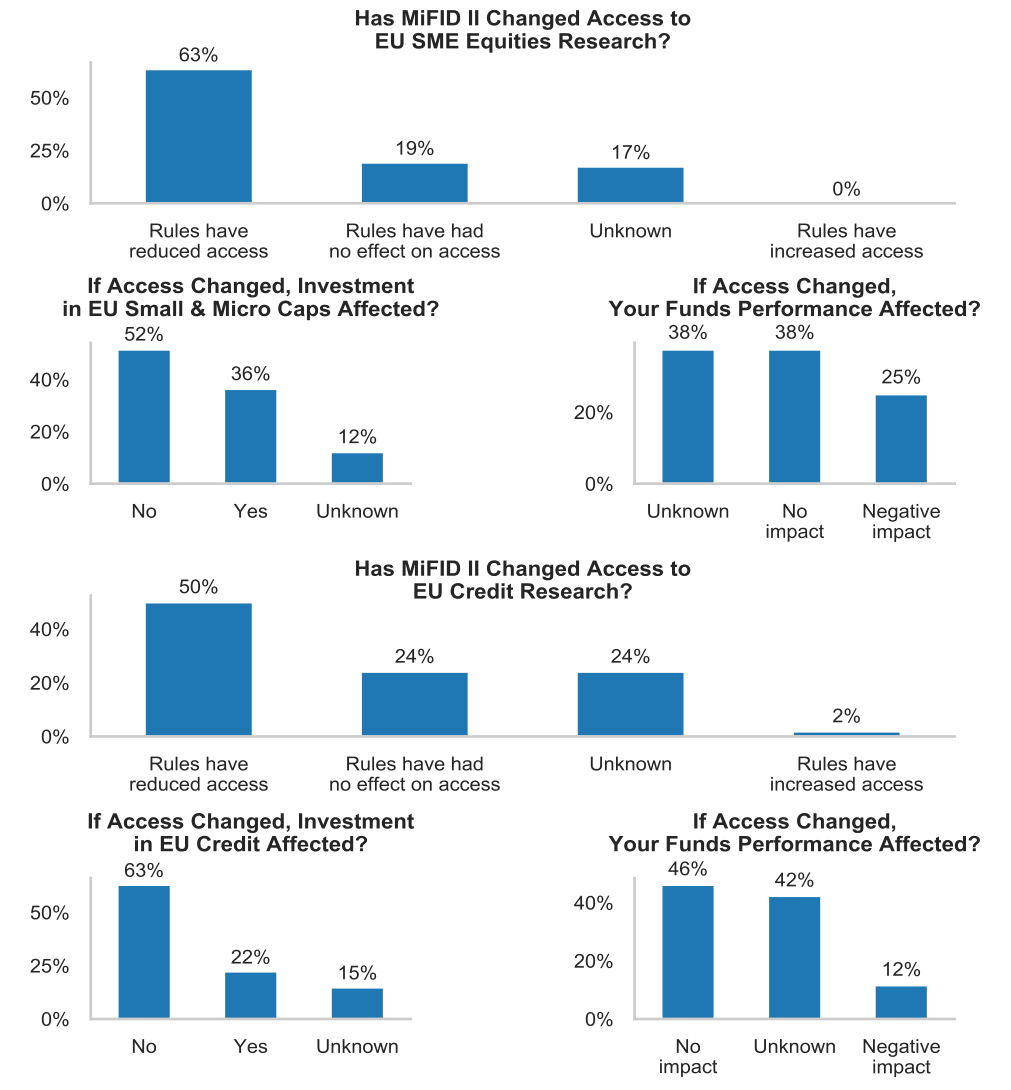
Note: The top panel corresponds to question no. 2: ‘ verall, would you say that the MiFID II research unbundling rules have changed your access to research on EU SME Equities?’ The middle left panel corresponds to question no. : ‘If you answered "Rules have increased access" or "Rules have reduced access", did this affect your investments in EU Small and Micro Caps?’ The middle right panel to question no. : ‘If you answered "Rules have increased access" or "Rules have reduced access", did this affect the performance of your funds?’ The lower central panel to question no. 5: ‘ verall, would you say that MiFID II research unbundling rules have changed your access to research on EU Credit?’ The bottom left to question no. : ‘If you answered "Rules have increased access" or "Rules have reduced access", did this affect your investments in EU Credit?’ The bottom right panel to question no. : ‘If you answered "Rules have increased access" or "Rules have reduced access", did this affect the performance of your funds?’
5.2.2 Interview evidence
Of buy-side interview respondents, most reported no impact on equity research coverage for Large Caps but that Mid and Small Cap coverage had fallen. Strong regional patterns were evident in the views of interview participants. Multiple asset managers in the Nordic region reported a shift in the institutions that are providing coverage, particularly among smaller local brokers. The large banks have not changed their coverage much although some have stopped covering micro caps. Asset managers said that Nordic banks understand their need for broad coverage and, hence, have maintained their teams.
Large German asset managers told us that, so far, they had seen no sign of drop in coverage or research quality. French respondents were consistent in arguing that SME coverage had been markedly reduced by MiFID II. Specialist UK-based SME investors told us that in Europe, adjusted for cycle, SME research had been stable for some years. Some consolidation and decline have been evident in the UK because the market was previously “over-broked”. SME research, according to these funds, is highly cyclical, drying up in bear markets as liquidity and new issuance disappear.
Interview evidence on credit research coverage suggested that MiFID II had little impact on coverage but respondents were concerned about a gradual trend contraction as brokers reduced research activity. Some also emphasised the shift away from publishing to sales analysts by brokers (see Section 8.4 below). Continental European asset managers with bond funds reported seeing cuts in High Yield coverage that concerned them, citing the exit by a prominent research provider and the cutting of lists by others without any announcement.
On the trend deterioration, some bond-focussed asset managers reported that no research provider now covers more than 10-20% of issuers and coverage is intermittent so that, when events occur affecting an issuer, they are not guaranteed to find a note interpreting developments in timely fashion. Respondents emphasised that the trend deterioration in research commenced before MiFID II and reflected cost pressure on dealing activities and decreased liquidity. Some firms spoke of responding to these developments by working more with IRPs specialised in credit and seeking more direct access to issuers. Coverage problems are greatest for smaller bond issuers. Many companies are only covered by no more than a single bank credit analyst.[78]
FCA (2019) reports results from surveys and interviews that it has conducted. Most asset managers, according to the FCA, find themselves still able to access the research they need. A few firms report they have seen a reduction in SME research but the majority report no reduction. Similarly, the study gathers from UK corporate issuers that there is little change in research coverage although they are concerned about potential deterioration in the future.
5.3 Statistical analysis of MiFID II and research coverage
This subsection presents statistical evidence on research volume and coverage. The analysis is based on the same I/B/E/S data described in Section 2 (where cross sectional pattern and descriptive statistics only were presented).
Here, a more elaborate statistical analysis is presented to ascertain (a) whether any declines in the first year of MiFID II, i.e., 2018, represented statistically significant declines in excess of whatever trends are evident in the data, and (b) whether, after allowing for other ‘cyclical’ influences on research coverage and volumes, a statistically significant ‘2018 effect’ remains evident.
The analysis is performed using regression methods. Logistic regressions are employed to examine the behaviour of an indicator for whether companies have any research coverage at all in a given year. Panel data regressions, using company level data, are employed to analyse the behaviour of Earnings per Share (EPS) forecast reports per annum. This measure of research volume is regressed on trends and dummies.
Box 5.1 describes the details of the regression methodology.
Box 5.1: Regression Methodology
Research coverage data is obtained from I/B/E/S database of Refinitiv, which has been described elaborately in Box 2.3. The number of Earnings per Share (EPS) reports conducted on an individual company is a given year is counted. If there is no report, an observation of which number of reports is zero is included. A binary indicator which takes value 1 if there is at least one report and 0 otherwise is also created. Two sets of regressions are run on number of reports and the binary indicator respectively. The set of companies which have earnings forecasts and the brokers that provide them are fixed throughout the regression analysis. We consider public companies registered in EU as our sample, while companies registered in the United States are also included for comparison purposes. The number of US firms is actually of the same order as the number for all EU 28 countries.
The same explanatory variables are employed for all regressions. Region dummies indicate whether a company is registered in United States or the European regions: Western, Eastern, Southern and Northern Europe. A time variable, which is the observation year (after demeaning) is created to capture a linear time trend. This variable is then multiplied with region dummies to create interaction variables that account for different time trends for each region.
which takes value 1 for observation in 2018 and 0 for year 2015 to 2017 is included.
Similar to the time variable, the post_mifid dummy is multiplied to region dummies to form interaction variables. We also account for sectoral difference by including a growtℎ_industry dummy variable. This variable equal 1 if the company is in a high-growth industry and equal 0 otherwise. We consider high-growth industries to be those, under MSCI Global Industry Classification Standard (GICS) definitions, listed in Table 5.1.
All explanatory variables apart from the constant are demeaned so that the constant equals the unconditional mean of the dependent variable. Regressions for number of reports and number of brokers are estimated using Ordinary Least Squares (OLS) with robust standard errors to yearspecific and company-specific clusters. Four separate regressions are performed for categories of company grouped by their size at end of 2018. The model is specified in the form below.
j n yi,t = constant+ ∑j=1 βjxi,t + εi,t (5.1)
j is independent Here yi,t is number of reports or number of brokers for company i in year t. xi,t variable j’s value for company i in time t. εi,t is the error term which is clustered in the company and time dimensions. constant and {βj, j= 1, … , n}, where n is the number of independent variables excluding constant, are coefficients to estimate.
Regressions for the binary variable are estimated using Logistic model specified below.
pi,t n j log (1−pi,t) = constant+ ∑j=1 βjxi,t + εi,t (5.2)
In equation (5.2), pi,t is the conditional probability that company i has coverage in year t. Notation is the same as in OLS regression. The model is estimated using Maximum Likelihood Estimation (MLE). Similarly, we run a Logistic regression for the four company size categories.
Tables 5.2 and 5.3 present regression results in which the dependent variable is either
(i) the number of reports per company per year or (ii) an indicator of whether a companied has any coverage within the year in question. In case (i), panel data regressions with clustered error terms are employed. In case (ii), a logistic regression is employed. Both regressions are conducted for European companies. Annex 6 presents results for regressions in which both European and United States companies are included.
Note that the sample includes a large number of companies for which there are no reports at all. This is particularly true of the smaller firm categories. Typically, there are around 10% of Non-SME companies that have no earnings forecast reports. These firms are generally investment or property companies. Key implications of the results on numbers of reports shown in Table 5.2 include:
• Because all regressors other than region dummies are demeaned, the average numbers of reports per company per year within each region may be directly read from the region dummies. The region dummies show that the average number of reports per company increase dramatically as the size of company increases.
• Southern and Eastern Europe have markedly smaller mean numbers of reports compared to Northern and Western Europe, showing that the research environment is less developed. For example, for Nano Caps, the Eastern Europe dummy coefficient is 0.3, which is about 10% of Western Europe dummy. For Non-SME, the dummy for Eastern Europe has a coefficient of 70 compared to a dummy for Northern Europe of 147.
• Time trends suggest that with the exception of Nano Caps, numbers of reports have been growing for Western Europe at a statistically significant rate. The growth rate is perhaps not economically significant, however. Time trend is scaled to a range from -1.5 in 2015 to 1.5 in 2018. So, a time trend coefficient of 4.36for Western Europe implies that over a four-year period, the number of reports for Western European companies increased by around 13 whereas the unconditional mean number of reports for Non-SME companies is 147.
• For Northern Europe, time trends are positive for Non-SME but negative for all other categories and statistically significant for Nano and Micro Caps. For Southern Europe, time trends are negative and statistically significant for all except Non-SME. For Eastern Europe, all trends are negative for all and statistically significant for all except for Micro. An important issue for this study is whether there is evidence of a MiFID II
• effect over and above time trends. We represent such a MiFID II effect in the regression by including a 2018 dummy interacting with region dummies. The coefficient on the 2018 effect for Western Europe is negative and significant for all company size categories. For Northern Europe, for Nano, Micro and Small Caps, the effect is actually positive (although it is statistically significant only for Nanos). This may reflect the fact that some of Northern Europe and Sweden, unbundled research in 2015, well before the introduction of MiFID II. For Non-SME Northern Europe companies, there is a statistically significant MiFID II effect.
• For Southern Europe, there are statistically significant negative MiFID II effects for all size categories. For Eastern European companies, there are negative and statistically significant declines (over and above trend) for all categories except for Non-SME.
• The last lesson one may draw from the table is the effects of MiFID II on the numbers of reports for Growth Industry companies as defined them above. The dummy for Growth Industry is positive or negative for different categories and is not statistically significant except for Nanos (for which the effect is significant). When combined with a MiFID II 2018 dummy, however, the coefficients are uniformly positive, statistically significant and material economically. This suggests that MiFID II was associated with a shifting of resources towards companies for which, one might think, research is highly relevant, those involved in new technologies.
Table 5.3 presents results on the probability that given companies will have at least one earnings forecast within a given year. The sign conventions employed in formulating the statistical model mean that when coefficients are positive, increases in the explanatory variable are associated with increases in the likelihood that a company has coverage.
Key conclusions to draw from Table 5.3 are as follows:
• Trends and MiFID II effects do not contribute in a statistically significant way to the probability that companies will receive at least one earnings report in a year. (The only statistically significant effects are the region dummies and the dummies for Growth Industry.)
• Western European companies are the most likely to have some coverage. The likelihood of having no coverage is increasing from Western to Northern to Southern to Eastern European companies.
• Growth Industry companies are distinctly more likely to have coverage.
To condition on company-specific variables that might have an impact on the number of reports per company for a given year, we added two variables to the regression specified in Table 5.2. The first variable is an indicator variable which equals 1 when the number of common shares of a given company increased within a year and equals 0 otherwise. As stock splits normally signal growing prospect of the company, it is expected to bring more attention from researchers and more forecast revisions. The second variable is volume which is calculated as:
Number of sℎares tradedt volume= average( Number of sℎares outstandingt) × 250 (5.3)
Here t is a trading day within a given year, and 250 trading days per year is assumed for all markets. Daily number of shares traded and number of shares outstanding data is obtained from Eikon from Refinitiv.
It is expected for companies with high volume, investors are more interested in research about them. On the other hand, high number of researches can increase the transparency of a company, thus lead to more trading activities. For this reason, volume is deemed as an endogenous variable and the regression is estimated in a 2 Stage Least Squares (2SLS) framework. Since volume has a high autocorrelation coefficient of 70%, the 1-year lag of volume is chosen as the instrumental variable.
Key information learned from Table 5.4 are:
• Time trends have almost the same signs as in Table 5.2, but become mostly insignificant. Southern Europe still shows a negative time trend for Nano and Micro Caps.
• Significant 2018 effect (over the trend) for Non-SMEs appear in all regions apart from Eastern Europe.
• All region dummies are at comparable levels with region dummies in Table 5.2, with the exception of Eastern Europe. For example, Eastern Europe dummy for Non-SMEs is 70 in Table 5.2, and 94 in Table 5.4. This means that, if the trading activity of Eastern Europe company increase to a level similar to other regions, Eastern Europe companies should receive more reports than currently.
• In the previous regression, significant 2018 effect for SMEs appear in almost all regions apart from Northern Europe. It is interesting that, after including company-specific variables, none of the 2018 regional dummies for SMEs are significantly negative anymore. This indicates that the research activity in 2018 might drop as a result of drop in trading activities, rather than MiFID II. This point, which is clearly very important for the present study, will be discussed later in this section.
• Growth industry companies have higher number of reports than non-Growth industry on average, with the exception of Small Caps. Growth industry receive more reports in 2018 than before.
• Increased number of shares leads to higher number of reports per company. This effect is significant for Nano and Micro companies.
• High volume lead to significantly high number of reports per company, for company of all sizes. There are sizeable boosts in R-squared compared to regressions without
• company-specific variables indicating their explanatory power.
Table 5.5 shows the average values of volume variable for each region-year-size category. The table displays a decrease in trading volume for Europe regions for almost all company size category in 2018. This partly explains the decrease in number of reports per company in 2018. It also shows in the Table that the volume ratio in Eastern Europe is lower than all other European regions for all company sizes. This explains the increase in the coefficient of Eastern Europe dummy variable when the volume variable is conditioned upon.
| Industry | Industry | Sub-Group | ||
|---|---|---|---|---|
| 351030 | Health Care Technology | 35103010 | Health Care Technology | |
| 352010 | Biotechnology | 35201010 | Biotechnology | |
| 352020 | Pharmaceuticals | 35202010 | Pharmaceuticals | |
| 352030 | Life Sciences Tools & | 35203010 | Life Sciences Tools | & Services |
| Services | ||||
| 451010 | Internet Software & | 45101010 | Internet Software | & Services |
| Services | ||||
| 451020 | IT Services | 45102010 | IT Consulting & Other | Services |
| 45102020 | Data Processing & | Outsourced | ||
| Services | ||||
| 451030 | Software | 45103010 | Application Software | |
| 45103020 | Systems Software | |||
| 45103030 | Home Entertainment | Software | ||
| To find out | whether there is additional | change to | time trend in | 2018, a post_mifid |
| Coeff. | t-stat. | Coeff. | t-stat. | Coeff. | t-stat. | Coeff. | t-stat. | ||||||
|---|---|---|---|---|---|---|---|---|---|---|---|---|---|
| Western | Europe | 3.23 | 11.77 | ** | 10.07 | 17.83 | ** | 29.85 | 15.37 | ** | 146.74 | 33.77 | ** |
| Time and | Western Europe | -0.10 | -5.59 | ** | 0.43 | 7.09 | ** | 0.99 | 7.67 | ** | 4.36 | 9.14 | ** |
| 2018 and | Western Europe | -0.13 | -3.68 | ** | -1.42 | -13.12 | ** | -2.36 | -6.90 | ** | -14.19 | -10.67 | ** |
| Northern | Europe | 1.84 | 8.24 | ** | 9.54 | 12.70 | ** | 27.47 | 14.08 | ** | 166.53 | 23.23 | ** |
| Time and | Northern Europe | -0.13 | -8.32 | ** | -0.15 | -2.98 | ** | -0.23 | -1.59 | 0.97 | 1.65 | ||
| 2018 and | Northern Europe | 0.13 | 3.81 | ** | 0.17 | 1.73 | 0.07 | 0.21 | -7.97 | -6.34 | ** | ||
| Southern | Europe | 0.55 | 4.38 | ** | 4.39 | 5.77 | ** | 19.49 | 6.97 | ** | 121.09 | 16.76 | ** |
| Time and | Southern Europe | -0.11 | -3.81 | ** | -0.82 | -7.42 | ** | -0.67 | -3.25 | ** | 1.47 | 2.31 | * |
| 2018 and | Southern Europe | -0.06 | -8.61 | ** | 0.28 | 2.90 | ** | -1.12 | -2.47 | * | -8.31 | -6.74 | ** |
| Eastern | Europe | 0.30 | 7.88 | ** | 3.07 | 6.61 | ** | 12.51 | 7.88 | ** | 70.31 | 10.33 | ** |
| Time and | Eastern Europe | -0.02 | -7.91 | ** | -0.06 | -0.69 | -1.06 | -5.17 | ** | -10.13 | -12.62 | ** | |
| 2018 and | Eastern Europe | -0.03 | -6.84 | ** | -0.65 | -9.25 | ** | -1.56 | -5.79 | ** | 0.34 | 0.31 | |
| Growth | industry | 1.12 | 3.25 | ** | 1.88 | 1.59 | -2.36 | -0.82 | 16.57 | 1.17 | |||
| 2018 and | Growth industry | 0.07 | 2.79 | ** | 1.40 | 15.89 | ** | 5.43 | 75.79 | ** | 19.01 | 17.30 | ** |
| Number of | observations | 13,292 | 4,348 | 3,944 | 4,128 | ||||||||
| R-squared | 0.038 | 0.041 | 0.016 | 0.033 | |||||||||
| Adjusted | R-squared | 0.037 | 0.039 | 0.013 | 0.030 |
Note: The regressions are estimated using Ordinary Least Squares. Standard errors are robust to time-specific clusters and company-specific clusters. Regressions are conducted on companies in four different size categories, based on their market capitalisation in February 2019. Dependent variable is number of EPS forecast report on a certain company in a year. Companies without any report coverage are also included. All independent variables except the region dummies are demeaned. T- statistics which indicate 0.05 and 0.01 significance levels are indicated by * and **.
| Table | 5.3: Logistic | Regression | Results | for | Whether | a | Firm | Has | Coverage | ||||
|---|---|---|---|---|---|---|---|---|---|---|---|---|---|
| Nano | Micro | Small | Non-SME | ||||||||||
| Coeff. | t-stat. | Coeff. | t-stat. | Coeff. | t-stat. | Coeff. | t-stat. | ||||||
| Western | Europe | -0.90 | -16.31 | ** | 0.21 | 3.68 | ** | 0.72 | 12.69 | ** | 1.99 | 26.02 | ** |
| Time and | Western Europe | -0.07 | -1.28 | 0.07 | 1.07 | 0.00 | 0.07 | 0.00 | 0.00 | ||||
| 2018 and | Western Europe | -0.03 | -0.21 | -0.13 | -0.77 | -0.05 | -0.31 | 0.02 | 0.09 | ||||
| Northern | Europe | -1.90 | -25.59 | ** | -0.17 | -2.24 | * | 0.70 | 8.30 | ** | 2.21 | 16.76 | ** |
| Time and | Northern Europe | -0.10 | -1.41 | 0.03 | 0.42 | 0.03 | 0.28 | 0.00 | 0.00 | ||||
| 2018 and | Northern Europe | 0.08 | 0.39 | -0.08 | -0.34 | 0.07 | 0.30 | -0.06 | -0.17 | ||||
| Southern | Europe | -3.04 | -19.32 | ** | -0.93 | -8.51 | ** | 0.31 | 2.54 | * | 2.34 | 12.86 | ** |
| Time and | Southern Europe | -0.08 | -0.50 | -0.04 | -0.36 | 0.07 | 0.51 | 0.00 | 0.00 | ||||
| 2018 and | Southern Europe | -0.05 | -0.10 | -0.01 | -0.03 | 0.00 | -0.01 | 0.00 | -0.01 | ||||
| Eastern | Europe | -3.37 | -36.39 | ** | -0.85 | -7.29 | ** | 0.17 | 1.24 | 1.69 | 6.09 | ** | |
| Time and | Eastern Europe | -0.04 | -0.33 | -0.11 | -0.87 | 0.06 | 0.43 | 0.08 | 0.29 | ||||
| 2018 and | Eastern Europe | -0.18 | -0.61 | 0.12 | 0.38 | -0.02 | -0.05 | -0.11 | -0.15 | ||||
| Growth | industry | 0.95 | 11.37 | ** | 0.68 | 6.26 | ** | 0.97 | 6.54 | ** | 0.45 | 1.88 | |
| 2018 and | Growth industry | 0.09 | 0.53 | 0.17 | 0.77 | 0.32 | 1.00 | 0.11 | 0.23 | ||||
| Number of | observations | 13,292 | 4,348 | 3,944 | 4,128 | ||||||||
| Pseudo | R-squared | 0.157 | 0.048 | 0.024 | 0.006 |
Note: The Logistic regression is conducted for a binary variable taking value 1 only if a company received forecast coverage within a certain year and value 0 otherwise. Regressions are conducted on companies in four different size categories, based on their market capitalisation in February 2019. Pseudo R-square is estimated based on log likelihood function. All independent variables except the region dummies are demeaned. T-statistics which indicate 0.05 and 0.01 significance levels are highlighted with * and **.
| Table | 5.4: 2SLS | Regression | Results | for | Number | of | Reports | per | Company | ||||
|---|---|---|---|---|---|---|---|---|---|---|---|---|---|
| Nano | Micro | Small | Non-SME | ||||||||||
| Coeff. | t-stat. | Coeff. | t-stat. | Coeff. | t-stat. | Coeff. | t-stat. | ||||||
| Western | Europe | 3.02 | 9.51 | ** | 9.44 | 14.53 | ** | 29.01 | 13.97 | ** | 146.74 | 30.94 | ** |
| Time and | Western Europe | -0.15 | -1.92 | 0.23 | 1.00 | 0.23 | 0.48 | 2.25 | 1.96 | ||||
| 2018 and | Western Europe | -0.03 | -0.23 | -0.84 | -1.64 | -0.94 | -0.95 | -9.99 | -4.66 | ** | |||
| Northern | Europe | 1.74 | 6.58 | ** | 9.83 | 10.89 | ** | 26.82 | 13.26 | ** | 165.14 | 21.21 | ** |
| Time and | Northern Europe | -0.19 | -1.73 | -0.29 | -1.11 | 0.48 | 0.69 | 6.89 | 4.26 | ** | |||
| 2018 and | Northern Europe | 0.21 | 1.08 | 0.59 | 1.18 | 0.04 | 0.03 | -15.98 | -5.44 | ** | |||
| Southern | Europe | 0.67 | 4.25 | ** | 4.18 | 4.59 | ** | 19.91 | 6.22 | ** | 117.50 | 14.25 | ** |
| Time and | Southern Europe | -0.14 | -2.14 | * | -1.32 | -3.44 | ** | -1.06 | -1.54 | 8.18 | 3.46 | ** | |
| 2018 and | Southern Europe | 0.01 | 0.11 | 0.98 | 1.47 | -2.08 | -1.32 | -12.63 | -3.15 | ** | |||
| Eastern | Europe | 0.49 | 8.58 | ** | 4.67 | 7.18 | ** | 17.87 | 7.27 | ** | 94.04 | 12.14 | ** |
| Time and | Eastern Europe | -0.02 | -0.95 | -0.26 | -0.95 | -1.57 | -1.96 | -5.23 | -1.51 | ||||
| 2018 and | Eastern Europe | 0.00 | 0.04 | -0.38 | -0.84 | -0.31 | -0.20 | -0.84 | -0.13 | ||||
| Growth | industry | 0.96 | 2.26 | * | 0.26 | 0.21 | -6.27 | -1.98 | * | 15.90 | 1.01 | ||
| 2018 and | Growth industry | 0.03 | 0.14 | 1.66 | 2.15 | * | 3.66 | 2.01 | * | 16.91 | 3.00 | ** | |
| Increased | number of shares | 0.88 | 3.78 | ** | 2.63 | 3.46 | ** | 3.66 | 1.67 | 2.63 | 0.44 | ||
| Volume | 0.61 | 2.36 | * | 6.86 | 4.87 | ** | 26.19 | 4.62 | ** | 76.33 | 7.78 | ** | |
| Number of | observations | 13,260 | 4,348 | 3,944 | 4,124 | ||||||||
| R-squared | 0.044 | 0.087 | 0.132 | 0.149 | |||||||||
| Adjusted | R-squared | 0.042 | 0.084 | 0.128 | 0.146 |
Note: All variables except for region dummy variables are demeaned. Regressions are estimated by Two Stage Least Squares (2SLS) model, in which volume is the endogenous variable and its one-year lagged observation is the instrumental variable. Robust standard errors are estimated, and clustered by equities. T-statistics which indicate 0.05 and 0.01 significance levels are highlighted with * and **.
| Year | Nano | Micro | Small | Non-SME | |
|---|---|---|---|---|---|
| United | 2015 | 0.16 | 0.23 | 0.38 | 0.57 |
| States | 2016 | 0.20 | 0.24 | 0.42 | 0.65 |
| 2017 | 0.36 | 0.30 | 0.42 | 0.60 | |
| 2018 | 0.49 | 0.32 | 0.45 | 0.64 | |
| Western | 2015 | 0.30 | 0.31 | 0.35 | 0.57 |
| Europe | 2016 | 0.36 | 0.32 | 0.38 | 0.61 |
| 2017 | 0.48 | 0.37 | 0.41 | 0.63 | |
| 2018 | 0.42 | 0.31 | 0.39 | 0.61 | |
| Northern | 2015 | 0.29 | 0.30 | 0.48 | 0.77 |
| Europe | 2016 | 0.34 | 0.27 | 0.38 | 0.66 |
| 2017 | 0.41 | 0.32 | 0.43 | 0.62 | |
| 2018 | 0.33 | 0.25 | 0.39 | 0.64 | |
| Southern | 2015 | 0.20 | 0.32 | 0.37 | 0.80 |
| Europe | 2016 | 0.13 | 0.25 | 0.30 | 0.70 |
| 2017 | 0.25 | 0.46 | 0.40 | 0.64 | |
| 2018 | 0.18 | 0.36 | 0.42 | 0.60 | |
| Eastern | 2015 | 0.14 | 0.09 | 0.17 | 0.41 |
| Europe | 2016 | 0.13 | 0.08 | 0.19 | 0.34 |
| 2017 | 0.16 | 0.15 | 0.20 | 0.29 | |
| 2018 | 0.12 | 0.11 | 0.18 | 0.24 |
Note: This table shows average annualised trading volume to share outstanding ratio in its natural unit.
5.4 Conclusions on research coverage and volume
Both sell-side and buy-side surveys suggest that there is a strong industry consensus that MiFID II has adversely affected coverage for SMEs and, to a lesser extent, for corporate bond issuers. This must be interpreted with care since, when sell side firms were questioned about numbers of SMEs they cover with their research, they do not report reductions since MiFID II. Equally, when buy-side firms are asked about the effects on their funds of reductions in SME coverage, few say that it has affected the performance of their funds.
Interview participants from both side of the industry also reflected the prevalent industry view. But some Fixed Income specialists interviewed said they did not perceive a reduction in coverage and some SME fund specialists that were interviewed said they did not think reductions in coverage and research volume were more than the usual cyclical fluctuations that they see as a long-standing feature of the market.
Turning to statistical evidence, it is undoubtedly true that standard measures of coverage and equity research volume turned down in 2018 for many company size and region categories of firm. For SME (Nano, Micro and Small Cap) reports per company per year, statistically significant 2018 downturns occur for all size and country regions except for Northern Europe (and Southern European Micro Caps). For non-SMEs statistically significant downturns occur for all except Eastern Europe. For reports per company per year, the economic magnitudes of these downturns are material although not very substantial, a typical 2018 dummy coefficient being about 10% of the constant in the regressions, the latter representing the unconditional average number of reports per company.
When one allows for the ‘cyclical’ influences of changes in secondary market turnover and primary market issuance, the results change markedly, however. The statistically significant 2018 downturns for smaller firms disappear and the statistically significant negative 2018 effects remain only for non-SMEs in Western, Northern and Southern Europe. (Western European SMEs, Small and Micro Caps in Eastern Europe and Small Caps in Southern Europe also exhibit negative 2018 effects but these are not statistically significant.) The economic magnitudes of the Large and Mid Cap 2018 downturns are, again, significant, equalling roughly ten percent of the unconditional mean level of reports.
Why are the results so different depending on whether one conditions on cyclical influences? The explanation is that research activity was relatively low in 2018 but this reflected a downturn on trading activity that year compared with earlier periods. As the specialist SME fund managers that participated in interviews put it, SME research is intrinsically cyclical, always being the first to be cut when activity levels are low.
6. The Impact of MiFID II on Research Quality
6.1 Introduction
In this section, we present findings on the possible effects of MiFID II unbundling on research quality. As is true for other impact effects studied in this report, the findings are based on survey, interview and statistical evidence.
When industry participants, or indeed regulators, are asked about research quality, they often focus on research quantity instead. A commonly expressed view is that the SME research environment has suffered because some firms have ceased to be covered by broker analysts. Some regulators argue that the research that may have been squeezed out by MiFID II changes, for example by non-specialist mid-sized banks makes relatively little contribution to the market’s understanding of larger corporates.
On the other hand, academic studies have examined in some detail biases that may arise when payments for research are bundled with commission for execution services.
A typical hypothesis is that researchers may be incentivised to generate views that encourage trading rather than simply to produce the most accurate forecasts possible.
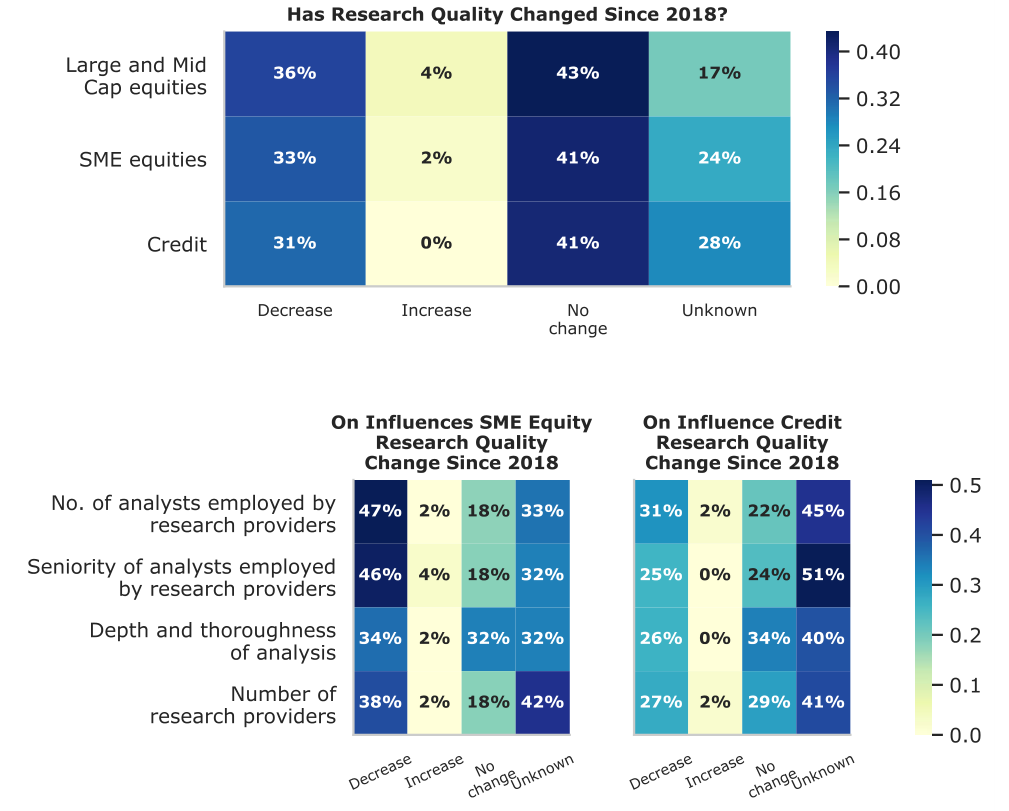
Note: The top panel correspond to questions no. 5 : ‘Has the quality of (i) Large and Mid Cap Equity, (ii) SME Equity and (iii) Credit research changed since January 2018?’The bottom two panels correspond to questions no. 0& 1: ‘How have the following influences on SME Equity research quality evolved since January 2018?’ and ‘How have the following influences on Credit research quality evolved since January 2018?’
6.2 Survey evidence on research quality
Figure 6.1 presents buy-side views on the impact of MiFID II on research quality. Large fractions of respondents do not see any change in research quality: 41% on SME equities, 41% on Credit securities and 43% for Large and Mid Cap equities. About one third of respondents, however, perceive that the quality of research quality has fallen: 33% for SME equities, 31% for Credit securities and 36% for Large and Mid Cap equities. Only small fractions of respondents report an increase in the quality of research on SME equities and Large and Mid Cap equities. No respondents report an increase in the quality of credit research.
degree to which it sponsors any research on your firm?’ Bottom right corresponds to question no. 8: ‘Do you intend to sponsor more research on your firm in the future?’ Almost half of respondents identify as factors influencing research quality post MiFID II: (i) a decrease in analyst numbers (47%) and (ii) a reduction in the seniority of analysts (46%). Most respondents are less sure about factors affecting the quality of credit research with only about a third reporting factors such as decrease in the number of analysts and seniority of analysts. Figure 6.2 presents the issuer survey results on research quality. While about a half of the respondents (49%) reported no change in the quality of investment research on their firms since MiFID II, 44% reported a decrease in the investment research quality. None of the respondents reported an increase in the quality of investment research. Additionally, a large majority of the issuers (62%) expect a decrease in the quality of research over the next three years.
Only 18% of the issuers reported emergence of new IRPs covering their firm. With the emergence of new IRPs covering research on issuers, more than half (55%) view that the research quality is unchanged. This is followed by 36% of the respondents that view that the quality has decreased. Only a small fraction (9%) reported increased research quality.
On sponsored research, only 9% of the issuer respondents reported an increase in the degree to which they sponsor research since MiFID II. A large majority (80%) have not changed the degree to which they sponsor research on their firms. Additionally, about a fifth of the issuers expect to sponsor more research in the future and 80% expect no change in the sponsored research in the future.
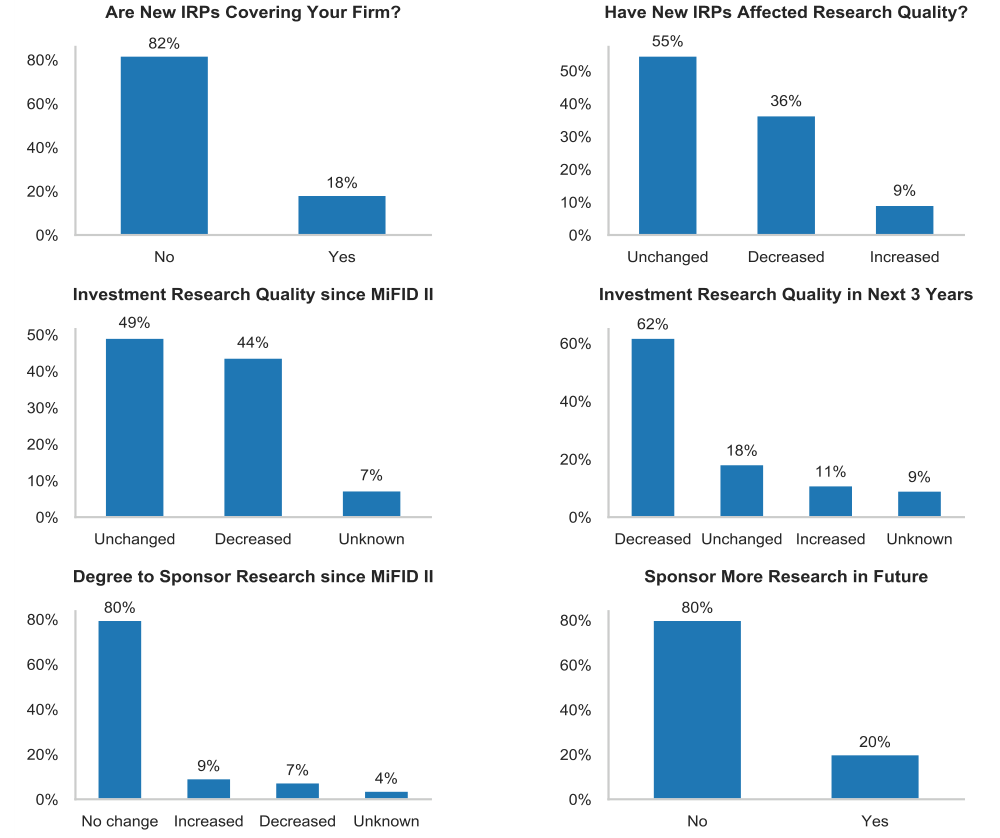
Note: The top left panel corresponds to question no.2 : ‘Have you noticed the emergence of new Independent Research Providers (IRPs) covering your firm?’ Top right corresponds to question no. 5: ‘If new Independent Research Providers (IRPs) covering your firm have emerged, has this affected the quality of this research?’ Middle left corresponds to question no. : ‘How has the quality of investment research on your firm evolved since the introduction of MiFID II?’ Middle right corresponds to question no. : ‘What do you expect to happen to the quality of investment research related to your firm over the next three years?’ Bottom left corresponds to question no. : ‘Since January 2018, has your firm changed the
6.3 Statistical evidence of EPS forecast accuracy
This section analyses equity research quality in Europe and how it evolves over time. Specifically, forecast errors in Earning per Share (EPS) is employed as an indicator of research quality. We present descriptive statistics of forecast errors averaged across firms for different years, regions and countries. We then run panel regressions for different company size groups to condition forecast errors upon exogenous variables such as region, time and industry.
The result shows wide difference across European regions, with Western European companies receiving much more accurate forecasts than Eastern European companies. We observe an overall reduction in standard deviation of forecast errors across all regions in 2018. Overall, there is a trend towards more accurate forecasts.
Our results contrast with those of some recent papers that seek to identify increases in EPS forecast accuracy after research cost unbundling. Pope, Tamayo, and Wang
(2019) finds forecast error decrease by 0.33% after adoption of RPA model at the beginning of 2015 by large Swedish asset managers. Fang, Hope, Huang and Moldovan
(2019) observe that less experienced analysts with greater historical forecast error and optimism are more likely to drop their coverage. Recommendations from remaining analysts cause greater market reactions and are more profitable. Guo and Mota (2019) argue that a ‘competition channel’ drives their results where the redundant analysts drop out and analysts with stronger incentive to produce high-quality research remain thereby explaining the simultaneous decrease in coverage quantity and increase in coverage quality. Lang, Pinto and Sul (2019) find that the remaining analysts after MiFID II are more focused and produce more accurate EPS forecast.
Box 6.1: Data Used in Forecast Accuracy Analysis
Actual EPS data is obtained from Refinitiv I/B/E/S dataset as well. Actual EPS is denominated in the equity’s default financial report currency. EPS forecasts are received in all currencies by I/B/E/S. Forecasts not made in the report currency are converted into report currency by I/B/E/S using prior day’s currency conversion rate.
Both actual and estimated EPS in I/B/E/S data set are adjusted for new shares after corporate actions which affect number of shares (such as spin offs, mergers or cash payments/special payments). We use actual EPS excluding extra dentary items (as defined by the accounting conventions of the Financial Accounting Standards Board (FASB), e.g. discontinued operations, early retirement of debt, cumulative effect of FASB accounting changes) and some items which are deemed non-operating and non-recurring, as the majority brokers always provide their forecasts on this basis. These details regarding the nature of data eliminate factors other than analyst’s research quality contributing to forecast error.
Date of financial year ends for each company and each year are also downloaded. EPS forecasts submitted 12 months to 3 months prior to financial year end date are included in the analysis. Forecast error is calculated as the difference between forecast EPS and actual EPS. The error is then divided by the equity’s bid price 2 days prior to forecast submission date. Prices are converted to the same currency as EPS using exchange rate on the day when the forecast is submitted, where price and EPS are in different currencies.
The analysis is carried on a report basis. To avoid changes in forecast errors caused by inconsistent samples, we also keep companies and brokers unchanged throughout the period from 2015 to 2018. For each year, outliers are excluded by truncating lower 0.5 percent and upper 0.5 percent forecast error observations.
Figure 6.3 presents histograms of EPS forecast errors for firms from different regions and for two individual countries, the US and UK. The distributions are plotted against forecast errors as fractions of share values 2 days before the date forecast is made. The errors are measured then over the period from the forecast date to the publication of the earnings to which the forecast relates. (Hence, the period of the forecast varies in length.)
The contrast between the histograms for different regions is very striking indeed. The UK distribution is very concentrated with little volatility and significant peakedness. Western Europe’s forecast error is more dispersed when UK is removed from this region. Even though, Western Europe without UK still has more peaked forecast error distribution than EU regions. The distribution for Eastern Europe companies, on the other hand is dispersed but still has obvious outliers. The Northern Europe distribution appears markedly right skewed. Some element of right skew (although of a lesser magnitude) appears evident in the Southern and Western Europe distributions.
Tables 6.1 and 6.2 present descriptive statistics average EPS forecast errors for EU regions and selected countries. A bias towards forecast optimism is apparent in Table 6.1 in that, for all regions apart from Eastern Europe, mean forecast errors are positive. The magnitude of the positive bias is greatest for Southern Europe and smallest for the UK. Western Europe has a smaller bias than the US.[79] The optimism bias increases in 2018 for all European regions except Southern Europe.
Western European companies have the lowest standard deviation of forecast errors, followed by Northern European companies. This partly reflects the influence of UK companies for which standard errors deviations are extremely low. Excluding UK, the standard deviation of Western Europe is similar to that of Northern Europe, and is still lower than Southern and Eastern Europe. Standard errors for Western Europe are slightly lower than those for the United States. The standard deviations of forecast errors decline in 2018 for all regions. The distributions of forecast errors are positively skewed, meaning there are more extreme over-estimates than extreme underestimates.
Table 6.2 shows descriptive statistics for particular European countries. Mean errors are mostly positive with the exception of Poland. Again, the UK standard deviations are extremely low. Sweden, France and Germany usually exhibit relatively low yearly standard deviations although there are exceptions in particular years.
To investigate the behaviour of forecast errors over time and to see if 2018 was an unusual year over and above trend, we run panel regressions with time, region and industry variables. All these regressors are obviously exogenous. The dependent variable in the regression is the absolute value of the forecast error multiplied by 100. The dependent variable, therefore, takes non-negative values and lower values correspond to higher research quality. All independent variables apart from region dummies are demeaned.
The coefficients of region dummies decrease as company size grows showing a clear improvement in accuracy for larger companies. For SMEs, Southern European companies have the highest absolute forecast errors, followed by Eastern, Northern and Western Europe. For non-SMEs, Eastern European companies have higher forecast errors than Southern Europe. The coefficients of time trend dummies are negative in the majority of cases. Trends tend to more significant for larger company size categories. This suggests a tendency towards greater forecast accuracy and, hence, increase in research quality over time.
From Table 6.3, one may conclude that there is no clear and consistent 2018 effect. A few region-2018 dummies have significant coefficients. Western Europe has a decrease in forecast error, or increase in accuracy, in 2018 for Nano Caps. While Northern Europe experiences a declining trend in forecast error throughout the period for all size categories, it has deteriorating forecast accuracy above trend in 2018. Changes in Southern and Eastern Europe do not have a uniform pattern, and are mostly insignificant. The growth-industry-2018 dummy is statistically significant in three of four cases but the signs are not consistent.
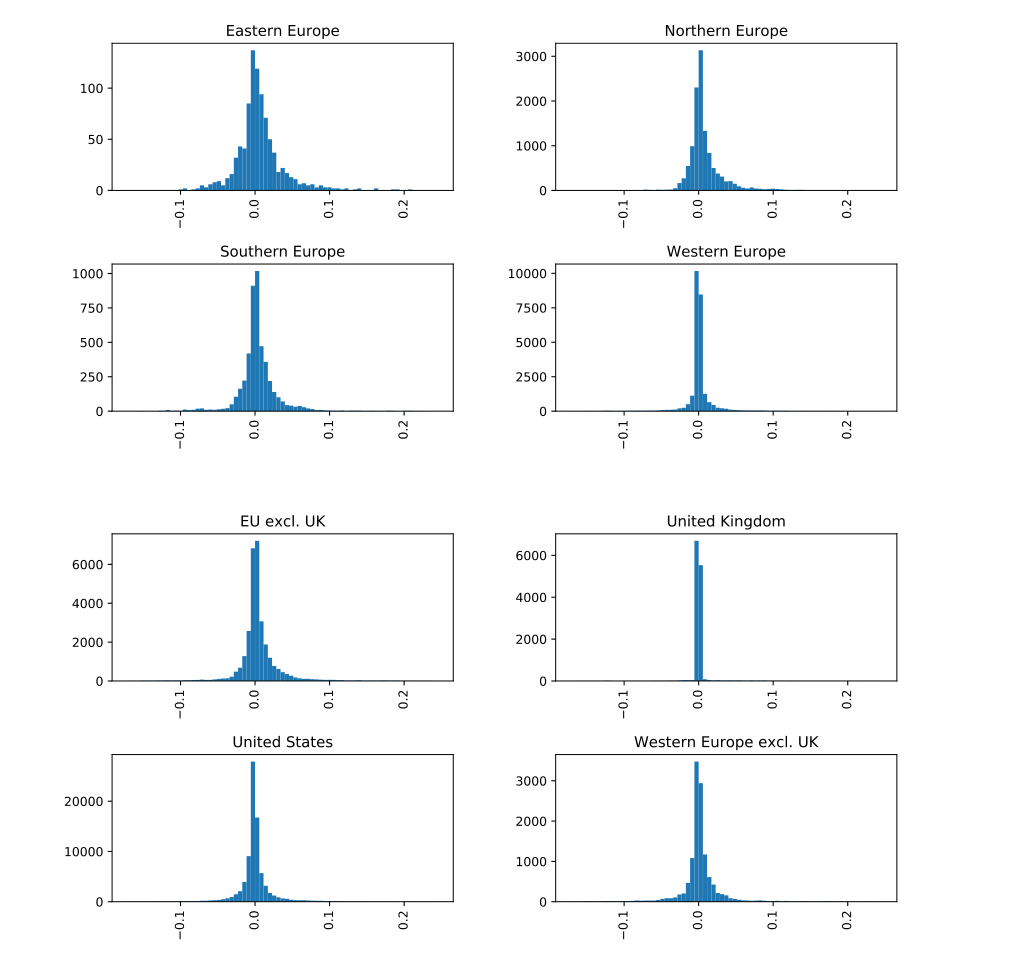
Note: Y-axis is number of observations. X-axis is forecast error in natural units.
| Count | Mean (%) | |||||||||||
|---|---|---|---|---|---|---|---|---|---|---|---|---|
| 2015 | 2016 | 2017 | 2018 | 2015 | 2016 | 2017 | 2018 | |||||
| EU | 44,289 | 48,542 | 47,967 | 43,118 | 0.50 | 0.30 | 0.20 | 0.38 | ||||
| EU excl. UK | 31,722 | 34,729 | 34,009 | 30,213 | 0.74 | 0.36 | 0.27 | 0.48 | ||||
| Eastern Europe | 1,289 | 1,350 | 1,152 | 913 | 0.58 | -0.83 | -0.38 | 0.62 | ||||
| Western Europe | 25,032 | 27,652 | 27,857 | 25,344 | 0.12 | 0.19 | 0.12 | 0.18 | ||||
| Southern Europe | 5,205 | 5,624 | 5,522 | 4,704 | 1.50 | 0.85 | 0.47 | 0.37 | ||||
| Northern Europe | 12,763 | 13,916 | 13,436 | 12,157 | 0.82 | 0.40 | 0.30 | 0.79 | ||||
| Western Europe excl. UK | 12,465 | 13,839 | 13,899 | 12,439 | 0.35 | 0.23 | 0.20 | 0.21 | ||||
| United States | 70,802 | 82,459 | 82,569 | 82,961 | 0.41 | 0.24 | 0.08 | 0.05 | ||||
| Std (%) | Skewness | |||||||||||
| 2015 | 2016 | 2017 | 2018 | 2015 | 2016 | 2017 | 2018 | |||||
| EU | 3.63 | 3.90 | 2.91 | 2.56 | 3.14 | 2.64 | 2.46 | 2.05 | ||||
| EU excl. UK | 4.18 | 4.38 | 3.32 | 2.87 | 2.74 | 2.25 | 2.17 | 1.55 | ||||
| Eastern Europe | 5.39 | 4.56 | 4.05 | 3.25 | 1.78 | 1.94 | 1.32 | 1.42 | ||||
| Western Europe | 2.67 | 3.35 | 2.45 | 2.39 | 3.59 | 2.74 | 2.72 | 2.18 | ||||
| Southern Europe | 5.22 | 5.80 | 3.57 | 2.72 | 2.74 | 2.76 | 2.79 | 1.19 | ||||
| Northern Europe | 4.12 | 3.86 | 3.33 | 2.72 | 2.38 | 1.63 | 1.93 | 2.21 | ||||
| Western Europe excl. UK | 3.52 | 4.14 | 3.13 | 3.02 | 3.09 | 1.87 | 2.23 | 1.28 | ||||
| United States | 2.77 | 3.89 | 2.79 | 2.76 | 2.60 | 2.02 | 1.68 | 1.63 |
Note: Mean and standard deviation are shown in percentages, while other statistics are in their natural units.
| Count | Mean (%) | |||||||||||
|---|---|---|---|---|---|---|---|---|---|---|---|---|
| 2015 | 2016 | 2017 | 2018 | 2015 2016 | 2017 | 2018 | ||||||
| Belgium | 895 | 936 | 983 | 870 | 0.05 | 0.60 | 0.63 | 0.26 | ||||
| France | 5,703 | 6,475 | 6,476 | 5,565 | 0.64 | 0.37 | 0.33 | 0.69 | ||||
| Germany | 7,246 | 7,877 | 7,722 | 6,797 | 0.71 | 0.44 | 0.17 | 0.85 | ||||
| Italy | 1,991 | 2,060 | 2,107 | 1,847 | 1.91 | 1.20 | 0.30 | -0.06 | ||||
| Poland | 934 | 923 | 799 | 675 | 0.96 | -0.64 | -0.04 | 1.21 | ||||
| Sweden | 2,808 | 3,045 | 2,909 | 2,684 | 1.02 | 0.03 | 0.31 | 0.45 | ||||
| United Kingdom | 12,567 | 13,813 | 13,958 | 12,905 | -0.10 | 0.16 | 0.04 | 0.14 | ||||
| Std (%) | Skewness | |||||||||||
| 2015 | 2016 | 2017 | 2018 | 2015 2016 | 2017 | 2018 | ||||||
| Belgium | 3.47 | 5.05 | 3.26 | 1.84 | 4.38 | 3.41 | 2.74 | 1.61 | ||||
| France | 3.82 | 4.03 | 3.10 | 2.78 | 3.90 | 3.69 | 2.68 | 2.99 | ||||
| Germany | 4.35 | 3.89 | 3.36 | 2.62 | 2.22 | 1.35 | 1.59 | 2.02 | ||||
| Italy | 6.00 | 5.82 | 3.09 | 2.62 | 2.72 | 3.35 | 2.74 | -1.22 | ||||
| Poland | 5.70 | 4.66 | 4.26 | 3.33 | 1.88 | 2.20 | 1.53 | 1.60 | ||||
| Sweden | 3.60 | 3.05 | 3.32 | 2.76 | 2.91 | 0.35 | 3.30 | 2.72 | ||||
| United Kingdom | 1.34 | 2.30 | 1.49 | 1.57 | -1.99 | 5.88 | 3.04 | 6.25 |
Note: Mean and standard deviation are shown in percentages, while other statistics are in natural units.
| Coeff. | t-stat. | Coeff. | t-stat. | Coeff. | t-stat. | Coeff. | t-stat. | ||||||
|---|---|---|---|---|---|---|---|---|---|---|---|---|---|
| Western Europe | 3.14 | 5.91 | ** | 2.21 | 7.48 | ** | 1.46 | 6.65 | ** | 0.79 | 9.36 | ** | |
| Time and Western | Europe | -0.06 | -0.44 | -0.01 | -0.09 | 0.05 | 0.51 | -0.09 | -2.26 | * | |||
| 2018 and Western | Europe | -1.40 | -2.24 | * | 0.18 | 1.44 | -0.42 | -1.81 | 0.01 | 0.18 | |||
| Northern Europe | 5.73 | 8.74 | ** | 3.47 | 13.79 | ** | 2.57 | 17.02 | ** | 1.50 | 14.57 | ** | |
| Time and Northern | Europe | -0.91 | -1.86 | -0.62 | -5.98 | ** | -0.72 | -4.36 | ** | -0.07 | -2.57 | * | |
| 2018 and Northern | Europe | 3.88 | 4.89 | ** | 1.02 | 6.82 | ** | 0.60 | 2.93 | ** | -0.22 | -3.99 | ** |
| Southern Europe | 16.43 | 2.48 | * | 6.39 | 9.31 | ** | 3.45 | 5.41 | ** | 1.82 | 8.70 | ** | |
| Time and Southern | Europe | 1.35 | 0.43 | -1.73 | -2.94 | ** | -0.61 | -6.46 | ** | -0.23 | -1.57 | ||
| 2018 and Southern | Europe | -12.26 | -1.14 | 0.58 | 0.67 | 1.19 | 1.78 | -0.26 | -0.71 | ||||
| Eastern Europe | 5.68 | 4.04 | ** | 4.12 | 7.79 | ** | 2.99 | 10.72 | ** | 2.11 | 8.67 | ** | |
| Time and Eastern | Europe | 1.52 | 2.32 | * | -0.24 | -0.91 | -0.44 | -1.07 | -0.34 | -3.16 | ** | ||
| 2018 and Eastern | Europe | -0.54 | -0.26 | -1.28 | -1.38 | 0.25 | 0.38 | 0.08 | 1.41 | ||||
| Growth industry | -0.66 | -0.72 | -0.20 | -0.59 | -0.50 | -1.47 | -0.48 | -3.79 | ** | ||||
| 2018 and Growth | industry | 0.52 | 0.73 | -0.64 | -10.84 | ** | 0.63 | 3.71 | ** | 0.32 | 5.19 | ** | |
| Number of observations | 4,884 | 9,205 | 27,188 | 151,245 | |||||||||
| R-squared | 0.128 | 0.105 | 0.066 | 0.033 | |||||||||
| Adjusted R-squared | 0.126 | 0.104 | 0.066 | 0.033 |
Note: The regressions are estimated using Ordinary Least Squares. Standard errors robust to time-specific clusters and company-specific clusters are estimated. Regressions are conducted for companies falling into four different size categories based on market capitalisation in February 2019. The dependent variable is the absolute value of forecast error for a given EPS forecast report, multiplied by 100. T-statistics which indicate 0.05 and 0.01 significance levels are highlighted with * and **.
6.4 Statistical analysis of awards data
In this last subsection, we examine trends and 2018 effects in the firms that win investment research awards. In so doing, we are further studying the StarMine and Extel Awards data introduced in 2.6. Logistic regressions are formulated for the binary variable of whether a particular firm wins an award in a given year.
In each year, we assume brokers of different types all participate in the competition. Yearly data points are stacked together to form panel data for regressions. All the independent variables apart from the constant are demeaned. A Logistic model is estimated for the probability that a given broker will receive at least one award. The model is specified as shown in equation (6.1).
pi,t n j log ( j=1 βjxi,t + εi,t (6.1) 1−pi,t) = constant+ ∑
j Here, pi,t is the conditional probability that company i will win any award in year t. xi,t is independent variable j’s value on company i in time t. εi,t is the error term. constant and {βj, j= 1, … , n}, where n is the number of independent variables excluding constant, are coefficients to estimate. To avoid collinearity, the dummy variable for large banks and investment banks is omitted. The Logistic model is estimated using Maximum Likelihood Estimation (MLE).
Table 6.4 shows the regression results for StarMine top stock pickers (columns 2 and 3) and top earnings estimators (columns 4 and 5) with pooled data from the four regions: France, Germany, Iberia and Nordic. The table also shows (in columns 6 and 7) results for the Extel Awards. In this case, we pooled the data of three Extel awards from 5 regions (France, Germany, Italy, Nordic and UK) for the years 2015 to 2019.
Both for stock pickers and earnings estimators, averaging across the sample period, it is much more likely that global institutions, followed by other large banks and investment banks, will win one or multiple awards. Mid-sized and small banks are least likely as individual institutions to pick up awards.
The probability of winning StarMine awards has evolved over the sample period as one may see from the coefficients on the products between time and broker-type dummies. But the only statistically significant trends apparent are decreases in the probability of winning Earnings Estimator awards for Mid-sized and small banks and non-bank brokers. There are statistically significant and negative 2018 effects for midsized and small banks and non-bank brokers for Stock Pickers but not for Earnings Estimators.
There are significant positive coefficients both on domestic dummies and on time trend for domestic researchers for both StarMine Stock Pickers and Earnings Estimators. This suggests domestic researchers have informational advantages and that this is intensifying over time.
Our findings on domestic region may be compared to those of Orpurt (2004). He investigates the local analyst earnings forecast advantages in Europe in terms of forecast accuracy. The majority of non-local analysts are based in the UK (London). rpurt’s results indicate a negative analyst location accuracy effect for UK (London) based analysts. They produce statistically less accurate earnings forecasts than non-UK (London) based analysts.[80]
The results for Extel contrast with those for StarMine. No time trends or 2018 effects are statistically significant suggesting that the nature of these awards has remained fairly homogeneous over time. While the domestic region dummy again has a statistically significant, positive coefficient, there is no time trend in the advantage that domestic researchers enjoy. There is also a statistically significant domestic dummy but no domestic time trend effect.
It is important to note the very different nature of StarMine and Extel awards. StarMine awards are conferred for superior forecasting performance. These constitute statistically driven performance indicators. On the other hand, Extel, as survey- or vote-based awards reflect the reputations of different research houses. It is apparent from the results that reputations have little changed across institution-types while the forecasting performance of different types of researcher has changed.
| Pickers | pooled logit | Estimators | pooled | logit | regression | for all | ||||
|---|---|---|---|---|---|---|---|---|---|---|
| regression | for country | regression | for country | research | awards | |||||
| awards | awards | |||||||||
| Coeff. | t-stat. | Coeff. | t-stat. | Coeff. | t-stat. | |||||
| Constant | -3.47 | -70.73 | ** | -3.47 | -70.46 | ** | -5.57 | -26.32 | ||
| Global banks | or investment | banks | 2.08 | 4.87 | ** | 3.07 | 7.56 | ** | 5.22 | 5.18 |
| Mid-sized | and small banks | -1.87 | -8.49 | ** | -1.88 | -8.90 | ** | -3.44 | -4.05 | |
| Non-bank | brokers | -1.80 | -7.10 | ** | -1.58 | -6.43 | ** | -1.73 | -2.39 * | |
| Time and | global banks or | investment banks | -0.11 | -0.18 | -0.81 | -1.27 | -0.06 | -0.05 | ||
| Time and | large banks or | investment banks | -0.49 | -1.28 | -0.39 | -1.08 | 0.12 | 0.09 | ||
| Time and | mid-sized and | small banks | -0.43 | -1.67 | -0.64 | -2.50 | * | -0.30 | -0.19 | |
| Time and | non-bank brokers | -0.01 | -0.04 | -0.98 | -2.84 | ** | 0.61 | 0.48 | ||
| Domestic | region | 1.91 | 12.18 | ** | 1.68 | 10.96 | ** | 2.19 | 2.92 | |
| Time and | domestic region | 0.77 | 2.89 | ** | 1.13 | 4.26 | ** | 0.02 | 0.01 | |
| 2018 and | global banks or | investment banks | -0.37 | -0.49 | -0.52 | -0.76 | 0.00 | 0.01 | ||
| 2018 and | large banks or | investment banks | 0.40 | 1.16 | -0.01 | -0.04 | -0.43 | -0.56 | ||
| 2018 and | mid-sized and | small banks | -0.45 | -2.32 | * | -0.33 | -1.77 | 0.28 | 0.33 | |
| 2018 and | non-bank brokers | -0.88 | -2.64 | ** | -0.39 | -1.15 | -0.30 | -0.55 | ||
| Number of | observations | 19,939 | 19,983 | 8,197 |
Note: T-statistics which indicate 0.05 and 0.01 significance levels are highlighted with * and **.
6.5 Conclusions on research quality
As with the effects of MiFID II on coverage and research volume, there are some striking contrasts between survey and statistical evidence. Survey evidence suggests that MiFID II has been associated with a decrease in research quality for both SME and large companies. Respondents attributed this particularly to reductions in researcher numbers and the seniority of analysts. Respondents report similar views for factors driving declines in Credit research quality although the fractions of respondents suggesting these factors are an issue are lower for Credit research.
Issuer survey respondents also suggest research quality for their own firms has declined because of MiFID II. They are pessimistic in the sense that they expect research quality to continue to deteriorate in the next three years.
Statistical evidence, however, yields very different results. The statistical analysis consists of (i) and examination of the accuracy of Earnings per Share estimates based again on I/B/E/S data, and (ii) logistic regression analysis of which research providers have won awards for their investment research, based in this case on the StarMine and Extel Awards previously discussed in Section 2.
For both datasets, trends and 2018 effects are estimated in order to see if there is evidence that the year in which the MiFID II rules came into force differed to a statistically significant degree from earlier years. The accuracy of Earnings per Share (EPS) forecasts has not been systematically affected by MiFID II. A striking finding is the degree to which the accuracy of forecasts varies across different national markets. This cross-sectional variation swamps individual year-to-year including that observed in 2018, the MiFID II implementation year.
7. The Impact of MiFID II on Provider Numbers
7.1 Introduction
In this section, we examine the effects of MiFID II on the number of research providers. To do so, we draw on survey and statistical evidence. The survey evidence contains indications of how many research providers are employed by different buyside firms. The statistical evidence, on the other hand, concerns the number of research providers that follow particular firms.
Clearly, the two ways of looking at research provider numbers are very different as the same numbers of providers may be following individual companies while buy-side firms could significantly reduce the number of research providers that they employ.
Background to the analysis of this section is anecdotal evidence that there have been significant reductions in the numbers of research analysts employed by broker research providers. Walker and Flood (2018) report an ‘exodus’ of sell-side analysts. Some IRPs and medium and small brokers participating in interviews reported significant reductions in the analyst teams of competitors although larger brokers tended to report stability in the sie of their research teams.
7.2 Survey evidence on research provider numbers and domiciles
Figure 7.1 presents the buy-side survey results on the impact of MiFID II on the number of investment research providers used for research. The upper part of the figure shows the distribution of numbers of research providers overall split between total, brokers overall, IRPs overall and intragroup. The lower part of the figure shows corresponding results for research providers on Large and Mid Cap equity research.
The results show that the total number of research providers decreases significantly with the median falling from about 35 to 26 from before to after MiFID II. Most of this drop is accounted for by a reduction in the number of brokers with the median falling from 31 to 21. The median number of IRPs employed drops from 5 to 4. The majority of buy-side firms had no intra-group research providers zero before and after MiFID II (so the median in both cases is zero).[81]
From the lower part of the figure, one may see that the median number of providers for Large and Mid Cap equity research falls from the low 20s to about 15. The decline entirely reflects changes in the number of broker providers in that there is no change in the median number of IRP providers.[82]
Figure 7.2 shows the evolution from before MiFID II to the survey date in 2019 in the numbers of research providers for SME and Credit research. From the upper part of the figure which relates to SME equity research, one may observe a decline in the median total number of providers from 10 to just over 5 (almost a halving of the number of providers). This is all the result of a drop in the number of broker providers. The median number of IRP providers remains unchanged.[83] From the lower part of the figure, one may observe that median numbers of Credit research providers decline slightly from 14 to 10. This is again the result of reduced reliance on brokers. The median number of IRP providers actually rises from 2 to 3.[84]
Figure 7.3 shows the buy-side survey results on how many of their research providers are domiciled in the EU currently and before MiFID II. The median number of EU-based research providers remains flat for Large and Mid Cap equities at 12 but declines significantly for SME equities (from 8 to 5) and slightly for Credit (from 9 to 8).[85]
Figure 7.4 shows the buy-side survey result on their view on the emergence of new research providers due to MiFID II. The majority of buy-side respondents report that MiFID II did not lead to emergence of new research providers for SME equities (63%) and credit securities (62%). Only a small fraction holds the view that MiFID II led to increase in the research providers for SME equities (12%) and credit securities (10%).
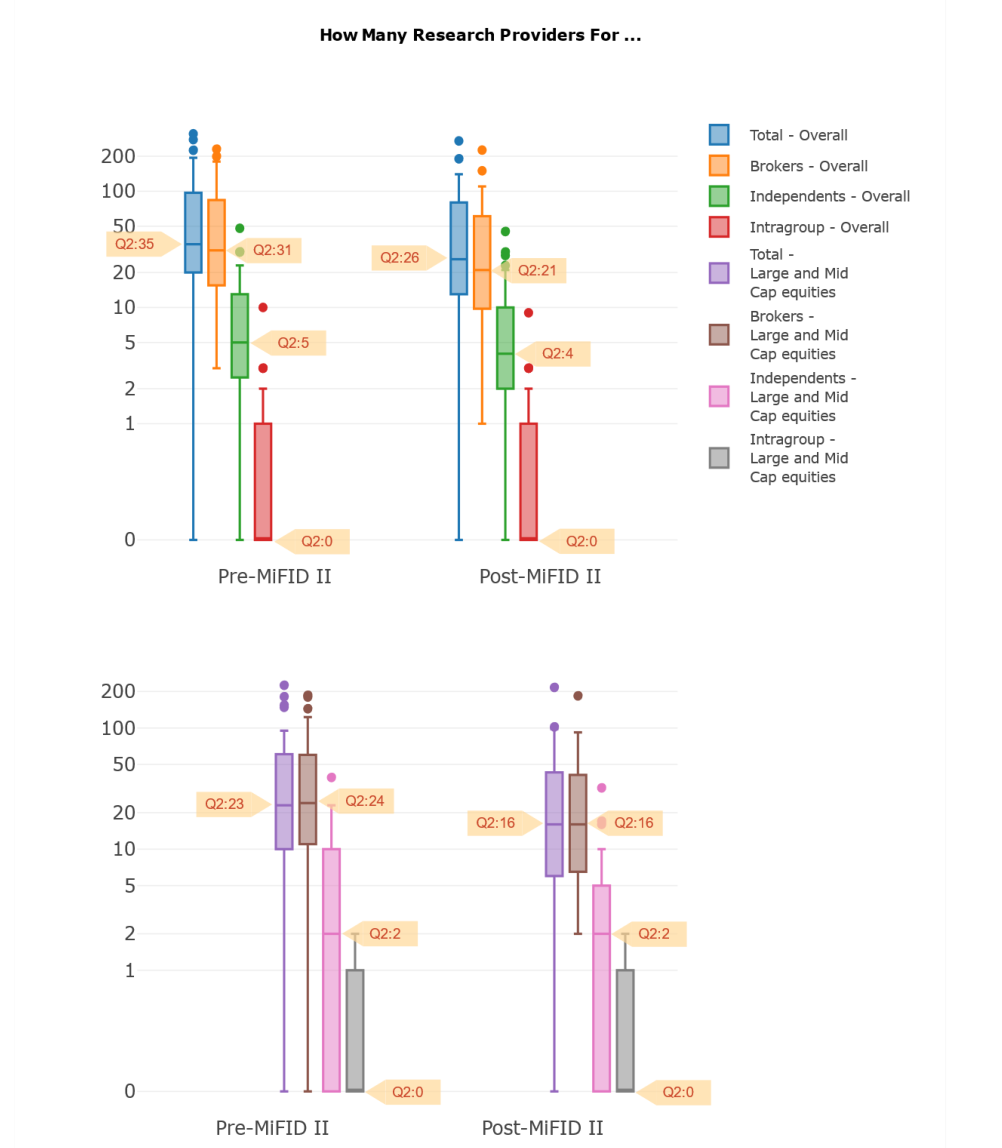
Note: The figure employs a log scale. The top panel corresponds to question no.45 from the buy-side survey: ‘How many investment research providers do you currently use overall and how many are brokers/independent providers/other entities within your own group? Same question prior to the introduction of MiFID II in January 2018?’ The bottom panel corresponds to question no. : ‘How many investment research providers do you currently use for Large and Mid Cap Equities and how many are brokers/independent providers/other entities within your own group?’ Same question prior to the introduction of MiFID II in January 2018?
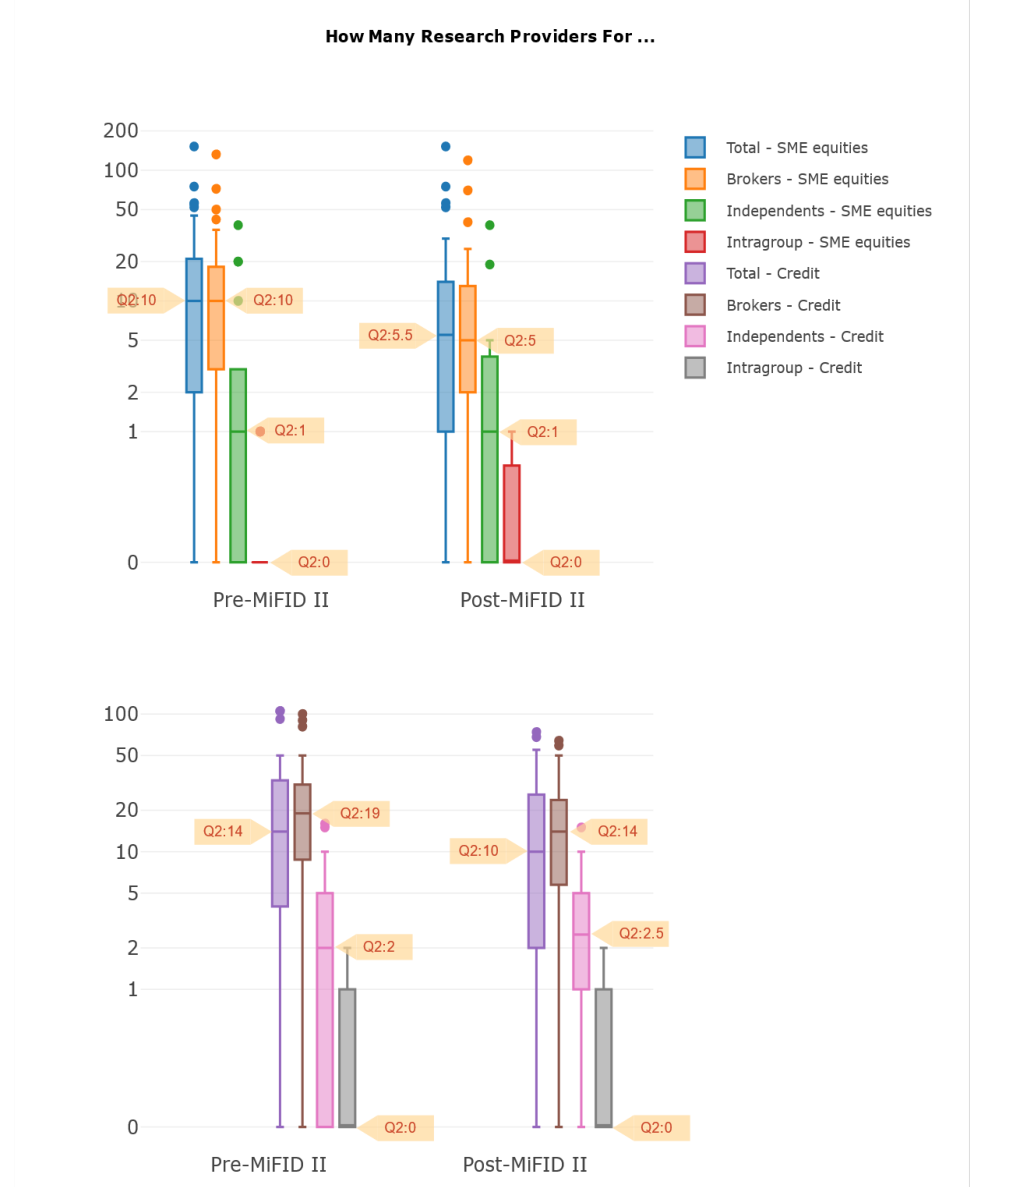
Note: The figure employs a log scale. The top panel corresponds to question no. : ‘How many investment research providers do you currently use for SME Equities (Small/Micro/Nano Caps) and how many are brokers/independent providers/other entities within your own group? Same question prior to the introduction of MiFID II in January 2018?’ The bottom panel corresponds to question no. 8: ‘How many investment research providers do you currently use for Credit and how many are brokers/independent providers/other entities within your own group? Same question prior to the introduction of MiFID II in January 2018?’
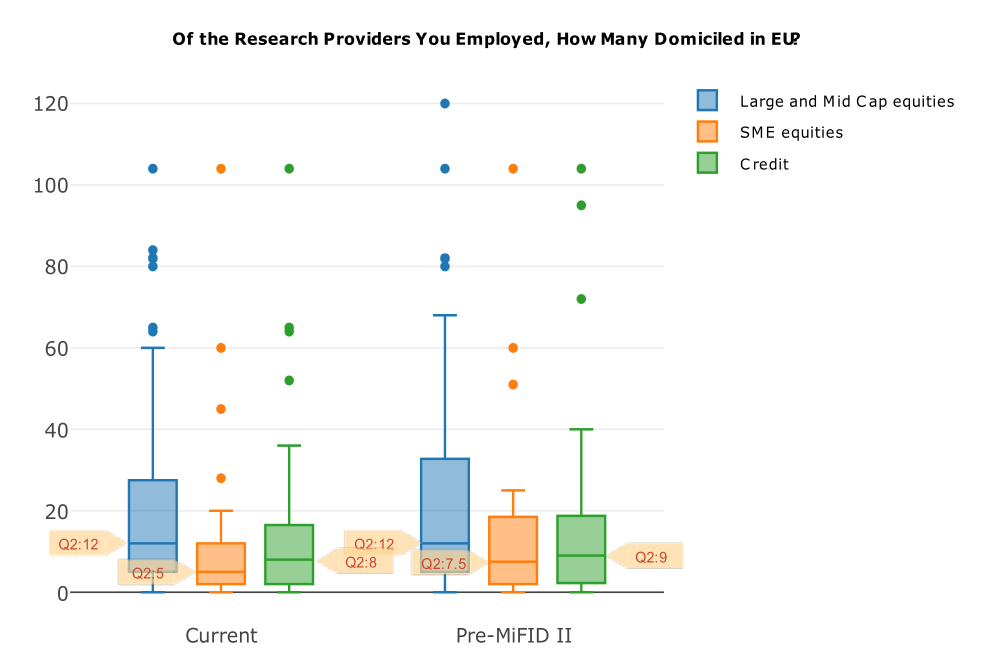
Note: The panel above left corresponds to question no.51 ‘Of your current research providers, how many are domiciled in the EU?’ And the right panel from question no.52: ‘Of the research providers you employed before January 2018, how many were domiciled in the EU?’
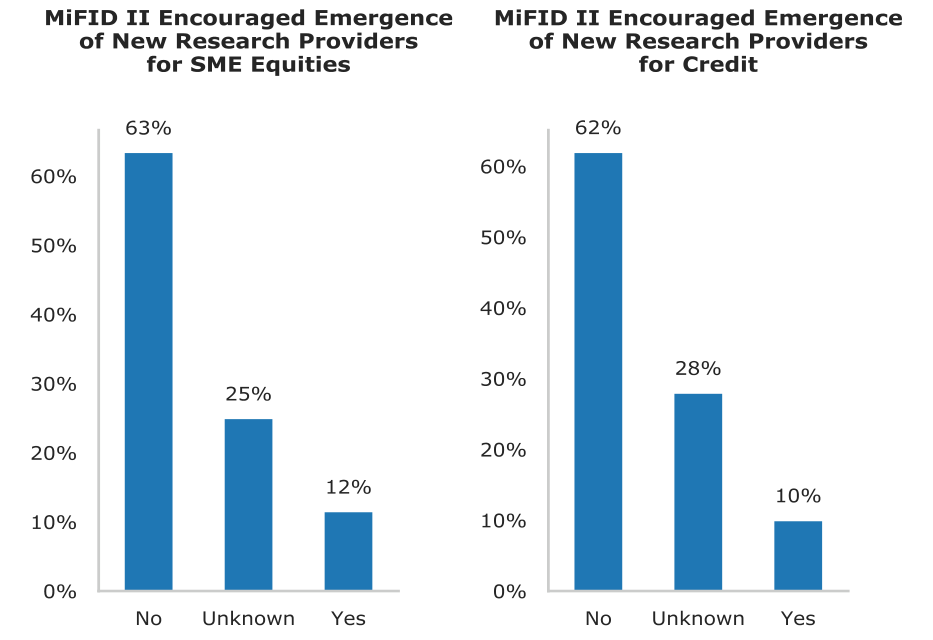
Note: The left panel corresponds to question no.5 : ‘Has MiFID II encouraged the emergence of new research providers for SME Equities (Small/Micro/Nano Cap) research?’ The right panel from question no.55: ‘Has MiFID II encouraged the emergence of new research providers for Credit research?’
7.3 Statistical analysis of research provider numbers
Table 7.1 shows the results for regressions of the number of brokers providing reports on companies per year. As with earlier regressions, we keep companies and brokers fixed throughout sample period. If there is no report, an observation of which number of brokers is zero is included. Similarly, regressors except for region dummy variables are demeaned.
Key conclusions are as follows. Non-SME companies have about 25 to 138 times more coverage by this measure than Nano Caps, depend on the region. On average, Micro Caps have 5 times more coverage than Nano Caps, and Small Caps have 19 times more coverage than Nano Caps. Western Europe have the highest number of brokers per company for non-SMEs, followed by Northern Europe, Southern Europe and Eastern Europe.
Time trends are somewhat mixed for Western and Northern Europe (although both negative and statistically significant for Nano Caps). Time trends for Southern and Eastern European companies are negative in most (although not all) cases. But the magnitudes do not appear economically very material.
Negative MiFID II effects are apparent for Western Europe for all except Nano Caps. For Northern and Southern Europe, they are negative for Small Caps and Non-SMEs but positive for smaller firms. For Eastern Europe, the effects are negative for all four company size categories. In most cases, the magnitudes of the effects are small.
The results suggest that Nano and Micro Growth Industry stocks are followed by more brokers. In both cases, the effects are statistically significant and economically material. As with coverage measured by the number of reports, the number of brokers for Growth Industry companies in Europe increases significantly in 2018.
We adopt the same data sample[86] as the Section 5 regressions. Exogenous variables are inherited from the other regressions. Two company-specific regressors, volume and a dummy for increases in the number of shares (as in Section 5) are added and the model is estimated under a 2-stage least squared (2SLS) approach.
Table 7.2 shows regression results for the number of brokers per company per year. As coefficients for regional dummy variables represent regional means conditional on firm and time specific variables, Western and Northern Europe have higher conditional mean brokers than other regions as one might expect.
Negative trends for SMEs are apparent in most regions with some being significant. The trend for the number of brokers is pronounced. Over and above the trend, there is no significant 2018 effect for SMEs, except a positive change for Nano Caps in Northern Europe. Non-SMEs in Northern and Southern Europe experienced a significant decrease in broker number in 2018.
Significantly positive coefficients for increased number of shares and volume variables show that stock split and increased trading activities both lead to more brokers covering a company.
| Table 7.1: | Regression | Results | for | Number | of | Brokers | per | Company | |||||
|---|---|---|---|---|---|---|---|---|---|---|---|---|---|
| Nano | Micro | Small | Non-SME | ||||||||||
| Coeff. | t-stat. | Coeff. | t-stat. | Coeff. | t-stat. | Coeff. | t-stat. | ||||||
| Western Europe | 0.49 | 16.71 | ** | 1.31 | 19.91 | ** | 3.19 | 20.49 | ** | 12.51 | 41.92 | ** | |
| Time and Western | Europe | -0.04 | -17.56 | ** | 0.01 | 1.97 | * | 0.03 | 2.79 | ** | 0.02 | 0.88 | |
| 2018 and Western | Europe | 0.01 | 2.52 | * | -0.09 | -7.83 | ** | -0.06 | -1.73 | -0.21 | -2.68 | ** | |
| Northern Europe | 0.21 | 9.13 | ** | 1.10 | 13.41 | ** | 2.67 | 14.66 | ** | 13.20 | 25.87 | ** | |
| Time and Northern | Europe | -0.03 | -13.37 | ** | 0.00 | -0.47 | 0.02 | 1.32 | -0.03 | -1.07 | |||
| 2018 and Northern | Europe | 0.03 | 9.62 | ** | 0.05 | 3.57 | ** | -0.02 | -0.57 | -0.40 | -4.87 | ** | |
| Southern Europe | 0.09 | 5.12 | ** | 0.62 | 7.45 | ** | 2.39 | 8.14 | ** | 11.87 | 20.42 | ** | |
| Time and Southern | Europe | -0.01 | -5.81 | ** | -0.07 | -8.60 | ** | -0.06 | -3.03 | ** | 0.05 | 1.35 | |
| 2018 and Southern | Europe | 0.00 | 0.33 | 0.02 | 1.34 | -0.07 | -1.47 | -0.47 | -5.29 | ** | |||
| Eastern Europe | 0.06 | 8.82 | ** | 0.51 | 8.19 | ** | 1.90 | 8.62 | ** | 8.17 | 12.10 | ** | |
| Time and Eastern | Europe | 0.00 | -3.75 | ** | 0.00 | 0.00 | -0.04 | -1.97 | * | -0.52 | -8.25 | ** | |
| 2018 and Eastern | Europe | -0.01 | -5.54 | ** | -0.07 | -8.52 | ** | -0.23 | -6.83 | ** | -0.54 | -5.42 | ** |
| Growth industry | 0.20 | 5.44 | ** | 0.28 | 2.46 | * | -0.20 | -0.82 | -0.04 | -0.04 | |||
| 2018Growth industry | 0.02 | 4.43 | ** | 0.16 | 18.72 | ** | 0.50 | 38.15 | ** | 0.73 | 6.46 | ** | |
| Number of observations | 13,292 | 4,348 | 3,944 | 4,128 | |||||||||
| R-squared | 0.067 | 0.044 | 0.013 | 0.014 | |||||||||
| Adjusted R-squared | 0.066 | 0.041 | 0.010 | 0.011 |
Note: The regressions are estimated using Ordinary Least Squares. Standard errors are robust to time-specific clusters and company-specific clusters. Regressions are conducted on companies in four different size categories, based on their market capitalisation in February 2019. Dependent variable is number of EPS forecast report on a certain company in a year. Companies without any report coverage are also included. All independent variables except the constant are demeaned. T-statistics which indicate 0.05 and 0.01 significance levels are highlighted with * and **.
| Coeff. | t-stat. | Coeff. | t-stat. | Coeff. | t-stat. | Coeff. | t-stat. | ||||||
|---|---|---|---|---|---|---|---|---|---|---|---|---|---|
| Western | Europe | 0.45 | 13.78 | ** | 1.24 | 16.93 | ** | 3.10 | 18.77 | ** | 12.49 | 37.94 | ** |
| Time and | Western Europe | -0.04 | -4.16 | ** | -0.02 | -0.65 | -0.04 | -0.94 | -0.14 | -1.87 | |||
| 2018 and | Western Europe | 0.02 | 1.33 | -0.02 | -0.42 | 0.07 | 0.88 | 0.11 | 0.82 | ||||
| Northern | Europe | 0.20 | 7.03 | ** | 1.13 | 11.72 | ** | 2.62 | 13.41 | ** | 13.12 | 23.07 | ** |
| Time and | Northern Europe | -0.04 | -3.95 | ** | -0.02 | -0.66 | 0.08 | 1.45 | 0.42 | 3.96 | ** | ||
| 2018 and | Northern Europe | 0.04 | 2.43 | * | 0.10 | 1.77 | -0.01 | -0.11 | -1.00 | -5.05 | ** | ||
| Southern | Europe | 0.11 | 5.13 | ** | 0.59 | 5.87 | ** | 2.45 | 7.17 | ** | 11.62 | 17.49 | ** |
| Time and | Southern Europe | -0.02 | -2.11 | * | -0.14 | -3.23 | ** | -0.09 | -1.24 | 0.55 | 3.24 | ** | |
| 2018 and | Southern Europe | 0.01 | 0.79 | 0.10 | 1.25 | -0.17 | -1.23 | -0.79 | -2.80 | ** | |||
| Eastern | Europe | 0.09 | 9.64 | ** | 0.71 | 8.12 | ** | 2.40 | 8.08 | ** | 9.99 | 13.10 | ** |
| Time and | Eastern Europe | 0.00 | -0.44 | -0.02 | -0.81 | -0.09 | -1.29 | -0.16 | -0.56 | ||||
| 2018 and | Eastern Europe | 0.00 | -0.38 | -0.03 | -0.64 | -0.12 | -0.89 | -0.63 | -1.21 | ||||
| Growth | industry | 0.17 | 3.90 | ** | 0.09 | 0.63 | -0.58 | -2.17 | * | -0.10 | -0.10 | ||
| 2018 and | Growth industry | 0.01 | 0.34 | 0.19 | 2.32 | * | 0.35 | 2.36 | * | 0.56 | 1.74 | ||
| Increased | number of shares | 0.16 | 5.39 | ** | 0.31 | 3.65 | ** | 0.47 | 2.41 | * | 0.35 | 0.83 | |
| Volume | 0.09 | 2.64 | ** | 0.85 | 5.14 | ** | 2.32 | 5.16 | ** | 5.74 | 8.23 | ** | |
| Number of | observations | 13,260 | 4,348 | 3,944 | 4,124 | ||||||||
| R-squared | 0.080 | 0.093 | 0.133 | 0.134 | |||||||||
| Adjusted | R-squared | 0.079 | 0.090 | 0.130 | 0.131 |
Note: All variables except for region dummy variables are demeaned. Regressions are estimated by Two Stage Least Squares (2SLS) model, in which turnover is the endogenous variable and its one-year lagged observation is the instrumental variable. Robust standard errors are estimated, and clustered by equities. T-statistics which indicate 0.05 and 0.01 significance levels are highlighted with * and **.
7.4 Conclusions on provider numbers
Survey evidence shows that the number of providers used by particular buy-side firms. Buy-side firms report a sizeable drop in numbers of research providers that they employ overall, with the median dropping from 35 to 26. Almost all of the decline is explained by a reduction in numbers of broker providers.
For Mid and Large Cap equity research, the number of providers declines but by less than the total. Buy-side firms use smaller numbers of research providers for SME research and the proportional decline is greater here with the median number of researchers falling from 10 to 5. Credit research providers also decrease significantly with the median declining from 14 to 10.
We also examine in this section statistical indicators or broker numbers per company. Note that the number of providers in this sense is different from what appears in the survey data since these represent the providers available for each company rather than those actually accessed by buy-side firms.
Based on the statistical measure, 2018 did indeed see significant declines in broker numbers particularly for non-SME and Small Cap companies across multiple regions. The evidence of declines is less strong for Micro and Nano Caps. Some of the decline appears to be cyclical in the sense that when one conditions on increased number of shares and volume, several of the more significant effects are diminished in magnitude and become less statistically significant.
8. MiFID II and Non-equity Research Issues
8.1 Introduction
In this section, we discuss issues related to MiFID II and non-equity research. The first of these issues is whether Fixed Income research volumes have been affected by MiFID II. Obtaining systematic data about volumes and quality of non-equity research is quite challenging. For Credit research, forecast accuracy is hard to assess as there is no metric, comparable to Earnings per Share that is regularly reviewed by multiple analysts. Again, for Credit research, there are no consensus forecasts such as those encountered in equity markets and no aggregators providing organised datasets.
One data supplier, Refinitiv, does, however, collect some information on Fixed Income research reports for use in a text mining application. This supplier kindly provided us with time series data on the numbers of European-issuer-related Fixed Income (FI) reports published by a set of major research houses. Using this data, we examine, in this section, how the number of FI research reports behaved around the period of MiFID II implementation.
The second issue examined in this section is evolution in the organisation or categorisation of Credit research which seems to have occurred in some bank brokers. Partly in response to MiFID II, it seems, banks have increased the extent to which they operate sales analyst teams rather than publishing researchers servicing MiFID II-inscope asset managers under the legal framework described in Section 3. This development, which was flagged up by multiple interview participants, appears to be a significant side-effect of the MiFID II unbundling requirements.
The third issue discussed in this section is the question of whether macro and FICC research is really susceptible of the unbundled approach of MiFID II. Firms making markets have to operate with research teams since they are assuming risk on their own books. It is important for dealing firms to interact extensively with buy-side firms in order to understand market views and tendencies. For these reasons, it is very hard for research to be offered as a free-standing product. Macro research is similarly hard to commoditise. Much of the work of typical bank economics departments is aimed at internal audiences and a significant fraction of the remainder represents general promotional activities intended to promote the bank’s visibility and reputation for competence.
8.2 Credit research volumes since MiFID II
The statistical analysis of research volumes presented in Section 5 focusses on equity research. It is much harder to obtain statistical evidence on developments in nonequity research. We were able, however, to obtain data on the production of Fixed Income research[87] by European-Union-domiciled research houses that contribute their research to Refinitiv.
Of all the research houses that contribute to the Refinitiv Research Document database, 14 research houses were identified by Refinitiv that are domiciled in the EU, have a non-trivial level of Fixed Income research contribution, are not global or supraregional contributors and continued to contribute throughout the sample period of Q1/2017 to Q2/2019.
Figure 8.1 shows the number of Fixed Income research documents contributed by the top 5 research houses and the rest over the period Q1/2017 to Q2/2019. Overall, there is a clear downward trend in the number of research documents provided to Refinitiv since Q1/2017, with the average number of reports dropping from 178 at the beginning of the period to 128 at the end of the sample period.
Figure 8.2 compares the numbers of Fixed Income research reports contributed by the 14 different research houses at the beginning and the end of the sample period. The total number of research documents contributed per quarter falls from 2,497 in Q1 2017 to 1,799 in Q2 2019, a decline of 28%. The figure shows that the big drop in the number of research documents is largely driven by reductions in the number of research documents provided by the larger research houses. In contrast to the bigger research houses, some of the smaller research houses actually increased their research contribution. Overall, 9 out of 14 research providers saw a reduction in their contribution to Refinitiv from Q1/2017 to Q2/2019.
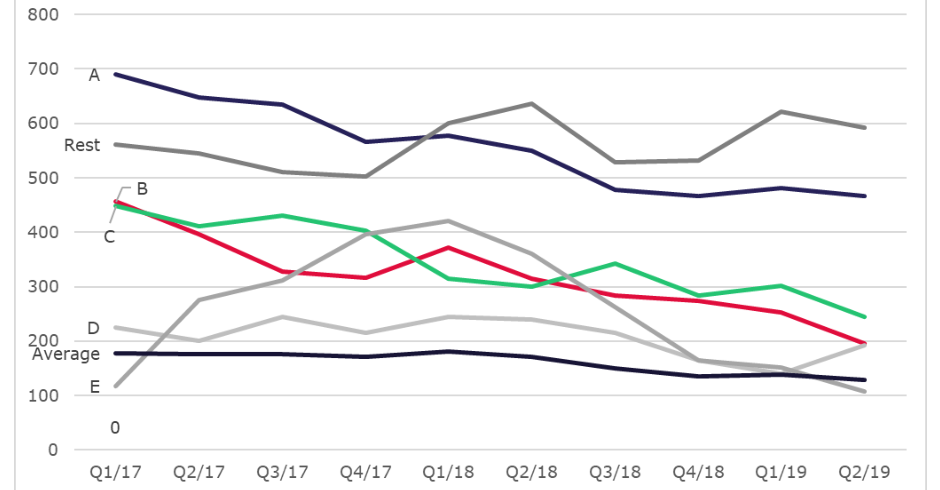
Note: This figure shows the number of Fixed Income research documents contributed to Refinitiv over Q1/2017 to Q2/2019 from the top 5 and other contributors. The source is Refinitiv.
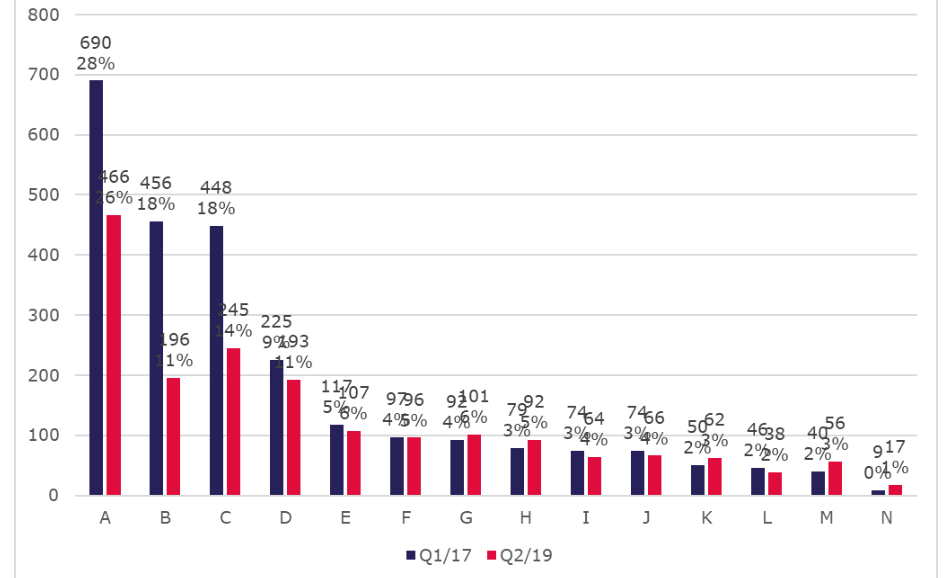
Note: This figure shows the contribution level of the different research houses at the beginning and end of the period of Q1/2017 to Q2/2019. Source is Refinitiv.
8.3 MiFID II implementation for Credit research
MiFID II implied even more radical changes in working practices for Fixed Income research than it did for Equity research. In interviews, large continental European asset managers reported that MiFID II has been a revolution. Determining prices and estimating values was more challenging than for Equity research. (Benchmarking of prices was easier in Equity research because many larger firms operated CSAs prior to MiFID II.)
High prices quoted by brokers early in 2017 collapsed later that year as FI brokers, very keen to maintain information channels open with the buy-side, proved very flexible on price. Asset managers interviewed argued that their FI research are coherent in the cross-section although they are at the lower limit of what seem prices related to costs. The low prices and the fact that FI spreads have not changed mean that aside from the administrative burdens of implementing MiFID II systems, the new rules do substantively change the market.
Some brokers offer research for $2,000. MiFID II provisions suggest that providers have to set prices based on cost. Some asset managers said that prices appeared excessively low. Others said that their compliance departments we questioned, keen to ensure there was no hint of inducements, had pushed them not to pay too little. Several asset managers commented that the focus of regulation is on Equity not FI research and that regulators should pay more attention to FI.
Even if FI research charges are low, MiFID II has created new costs in the form of staff for monitoring contracts, maintaining relations on research with brokers and operating more elaborate budgetary and research evaluation operations. Since there is no change in spreads, interview respondents suggested that the impact of MiFID II on their operations is negative. As in the case of equity research, FI-focussed asset managers employ techniques like broker votes to asset research quality, monitor interactions and employ statistics from brokers and data providers like Bloomberg to assess activity. These processes were typically operated already by firms prior to MiFID II before MiFID II but were extended to the FI area after the rules came into effect.
Box 8.1: Nordic bond market The implementation of MiFID II rules in the Nordic bond market provides an interesting case study. The two primary dimensions of the market are
1. Large Eurobond benchmark issues of companies such as Volvo. These issues are traded extensively by large banks.
2. The local Nordic market in SKr and DKr for which market share is dominated by local brokers. In the local market, the Norwegian market is specialised in oil related firms. The Swedish market is tilted towards real estate related issues. Typical issues are EUR 120 million.
Access to the Eurobond market requires a rating but, in the local market, many unrated issuers are present. In the latter case, analyst coverage is very important. In the past, Nordic banks issued shadow ratings. This facilitated issuance by many small companies. Mandates were written so that if an issue had two bank shadow ratings, it was treated as equivalent to having an agency rating. In 2016, discussion with ESMA suggested that banks issuing shadow ratings would be subject to ESMA supervision. Nordea ceased issuing such shadow ratings and other banks followed suit.
Although there has never been a crisis in the Nordic bond market, there are some intrinsic vulnerabilities. Nordic issues have grown considerably over time. Interview respondents expressed some concerns that new issuance may disappear in a downturn. The open-ended nature of funds increases vulnerability to a drying up of liquidity in downturn. In such a case, the market would be closed to all but the strongest issuers and one might expect that secondary market prices would drop considerably. The Nordic market is particularly vulnerable because many smaller bonds that are not actively quoted.
Some Nordic bank interview participants reported that coverage in the local Nordic bond market is declining significantly. They argued that this is not only due to MiFID II but instead reflects cost and price pressure affecting the whole industry. Banks said they were cutting staff and doing more ad hoc research. They expected coverage would decline and that the quality of Credit research would fall. Some banks reported that they were insulated from MiFID II by the fact that some of the largest buy-side institutions, such as major pension funds, are out-ofscope for MiFID II.
Research teams in some parts of the local Nordic market (for example energy related issues) spend considerable time on new issue research. (In the case of one bank, the fraction was 75%.) This is the opposite of equity research and very unlike the rest of European corporate bond market where research is driven by trading. It means that much of research costs are borne by issuers. Buy-side consumers of research include many non-EU and non-MiFID II clients. So, the fraction of research costs paid for by MiFID II clients is small. For specialised sub-sectors like energy related issuance, a problem with MiFID II is the restriction on free trials. Building relationships with asset managers takes significant time (up to 3 years). This is scarcely possible within the MiFID II rules which allow only for 3-month trial periods.
8.4 Sales analysts versus publishing credit researchers
An important development that seems to have occurred in Fixed Income research as a response to MiFID II is an increasing emphasis within large banks on the use of sales or strategy analysts rather than conventional ‘publishing researchers’. This appears to be very much a debt market phenomenon but it represents a significant change in practice.
The background to the development is as follows. Dealing operations are obliged to employ research staff to support their trading teams. Such research, however, represents a very small contributor to total costs in most FICC brokerage businesses. (The major costs for dealers are those relating to capital and liquidity.) To be effective, research staff must interact with clients, exchanging information and contributing to a bi-directional flow of information.
In response to MiFID II, many brokers have reduced their generation of published research. Published research is less attractive an activity for brokers as it must be charged for and is covered by regulatory and compliance requirements. Instead, some brokers have expanded their strategy- and sales-analyst activities. Firms that follow the strategy and sales analyst approach often restrict the length or distribution channels of written output that their analysts generate (so they are not captured by MiFID II requirements).
These developments, however, mean that there are two classes of credit analyst doing very similar jobs: analysing and forecasting issuer-company prospects, presenting at conferences, talking to issuers, issuing forecasts (at least verbally in the case of sales analysts) and generating trade ideas. Both types of research activity may be performed to the same level of quality. But, while publishing analysts work within a transparent regulatory and compliance framework, sales analysts are invisible to regulators and generate research the status of which is sometimes unclear.
Some brokers that run teams of publishing researchers suggested that MiFID II had had the effect of driving part of FICC research underground. Whether houses follow one approach or the other depends on the attitudes taken by their regulators and their compliance and legal departments. While large brokers participating in interviews described this phenomenon from different viewpoints (correlated with whether their institutions were following the publishing- or sales-analyst business model), all were clear that it was highly material to the development of their business.
Some institutions that had maintained significant publishing research teams suggested that regulators should pay attention to what is happening. Some saw the fact that competitors provided FICC research for free as a major threat to their own conventional MiFID II business model of publishing research and attributed to it the fact that they were being obliged to cut back their research activities. Some FICC brokers believed that the two models ultimately cannot coexist: either the publishingresearch-model or the sales-analyst-model will ultimately prevail.[88]
Other banks that follow a sales-analyst approach to Credit Research (often from before the introduction of MiFID II) defended the practice which they believe to be a consequence of the nature of the business. Desk and sector strategists provide nonindependent research, analysing corporations and forming views on the pricing of risk. They do not charge and their work is considered to be MNMB. Outputs are made available to all. Access to sector strategists is not chargeable because interactions mutually beneficial. The two-way exchange promotes discussion with clients. This model amounts to having researchers working for traders. When MiFID II was implemented, these firms debated whether to follow a charging or a strategy analyst approach. They did not wish to ask clients to subsidise what is needed internally in any case.[89]
Contributing to the differing interpretations across firms and jurisdictions of what is possible for FICC broker research is a lack of clarity about what constitutes credit research. ESMA documents might suggest that a sales person pitching a trade constitutes research. Some continental investors follow this interpretation, for example, requiring that research agreements be in place for sales analysts to talk to asset managers. Some brokers interpret the rules as distinguishing based on the organisational position of the analyst. Even if a sales person comes up with a 5-page piece on why to buy the bond, they do not regard that as research.
The distinction between publishing and non-publishing analysts is less extreme in equity markets but there nevertheless remains some lack of clarity. Large specialist bank-linked brokers told us that their sales people commonly talk to analysts and curate the results to clients in emails. This is not charged for currently. They would like to evaluate emails from sales people possibly to refine their approach. They are not analysts but they play an important role.
8.5 Macro research
While our primary focus in Non-equity research is on Credit research, it is worth considering the impact of MiFID II on Macro research. Macro researchers in major banks reported that they saw MiFID II as designed for commission-based equity markets. In FICC markets, spreads are unrelated to research costs which are anyway low. The costs of liquidity and capital are much more important than those of services to clients.
Researchers themselves argued that Macro research, in particular, is in part a marketing activity and otherwise serves multiple internal audiences. In a major European bank, representative of other global institutions, Macro research is performed by a team of approaching 40 people round the world. Through its analysis, the team obtains visibility and coverage for the bank (including media coverage) and provides input to (i) bank investment committees (ii) traders in global markets, (iii) risk functions (iv) and others (such as briefing notes for top management). If this team (which it should be emphasised is within a European institution) were to cease all contact with EU clients, the head count might drop by 2 or 3.
The task of monetising Macro research is challenging but client relationships on the part of Macro researchers have numerous benefits to a large bank through the contribution they make to account manager activities. Under MiFID II, Macro researchers have to fit in with compliance needs of clients, charging based on the number of analyst meetings in Europe. (Researchers may not charge for meetings outside the EU or for MiFID II out-of-scope clients.) Written materials may be offered for free to all investment firms. Access to analysts may be charged at USD 10,000- 80,000 per annum. But the administration creates extra friction.[90]
8.6 Conclusions on non-equity research issues
This section considers the effects of MiFID II on non-equity research, specifically Fixed Income and Macro. These areas were less of a focus in the development of MiFID II and yet the new rules were perhaps more clearly radical in affecting market practices than they were for equity research (particularly for larger buy-side firms that had partially unbundled through the use of CSAs).
In the case of Fixed Income research, data is hard to come by but information provided by a data provider suggests a rather striking decline in the number of research reports from larger research houses. At the same time, many respondents in interviews reported significant structural shifts in the way brokers organise research and some highlighted concerns that the new rules had pushed elements of research outside the framework of review provided by supervisors and compliance.
In the case of Macro research (in contrast, for example, to those involved in Equity research), no interlocutors we encountered in interviews could identify improvements in the functioning of the research market attributable to MiFID II. Most saw it as an unhelpful distraction, adding to administrative burdens and hampering interactions with other market participants.
Respondents differed in their views on whether the pricing of research in these areas is in line with costs. But it is hard to resist the impression that, in some cases, market participants are trying to maintain compliance with the rules while charging the minimum possible in order to keep contact with clients. This raises the issue of whether it is sensible to retain Fixed Income and Macro within the MiFID II framework or whether these activities might be carved out.[91] Several of the issues and points discussed in this section might suggest the need for reconsideration or at least further clarification of regulatory attitudes. The implementation of MiFID II for FICC research in firms appears in some cases to have been done so as to impinge as little as possible on the interactions of dealer banks and their clients (for example by labelling researchers as strategy analysts). In other cases, where firms have tried carefully to adhere to the spirit of the rules, the charging is so low that one may question whether the administrative burden serves any purpose. If inducements were present before MiFID II in this area of research, it is unlikely that they have been eliminated by the new framework.
9. Other Effects of MiFID II on Investment Research
9.1 Introduction
This section looks at some implications of MiFID II for the internal operations of buyside firms. These issues include the administrative burden faced by firms. Inevitably, this has been a major aspect of the regulations, enforcing the adoption by the industry as a whole of elaborate contracting, budgeting and research evaluation processes which may be viewed as best practice in large firms.
The section also considers how they have responded internally to the MiFID II changes in their research strategies. Although less obvious, one might expect that adding additional infrastructure and elaborate processes around research might encourage some firms to move to less research-intensive investment approaches such as passive strategies or algorithmic approaches.
Finally, the section examines evidence on how the MiFID II rules have influenced the channels that the sell-side use to distribute research, notably aggregators and use of research market places. The distribution of research has evolved in recent years as technology has changed and research producers have attempted to protect their intellectual property.
9.2 MiFID II and administrative costs on the buy-side
As mentioned in Section 3, MiFID II implementation required relatively little effort for some large buy-side firms that had already implemented CSA approaches as part of a pre-MiFID II move towards unbundling. For such firms, the additional administrative burden of satisfying the new rules was relatively light, especially because many decided to pay for research out of P&L rather than by introducing RPAs. But, for other asset managers, the new arrangements required extensive investment in revised administrative arrangements and systems.
Figure 9.1 shows that for a large majority of the buy-side firms, there has been an increase in the administrative burden of obtaining external research on large and midcap equities, SME equities and credit securities. None of the respondents reported a decrease. It is noticeable that respondents made little distinction between the effects on different asset classes.
One may obtain an idea of the key challenges that firms faced organisationally in implementing MiFID II rules by looking at text comments survey respondents submitted on the nature of the additional administrative burden. Figure 9.2 presents the buy-side survey results on their opinion on the most material changes in their administrative burden. To generate the graphic in Figure 9.2, a machine learning approach called “a bag of words”[92] is employed to extract keywords from text entries provided by firms describing the effects of MiFID II on their administrative burden. The most prominent keywords reported are “contracts”, “broker” and “management”. ther words that appear with slightly less prominence are “implementation”, “resources”, followed by “governance” and “information”.
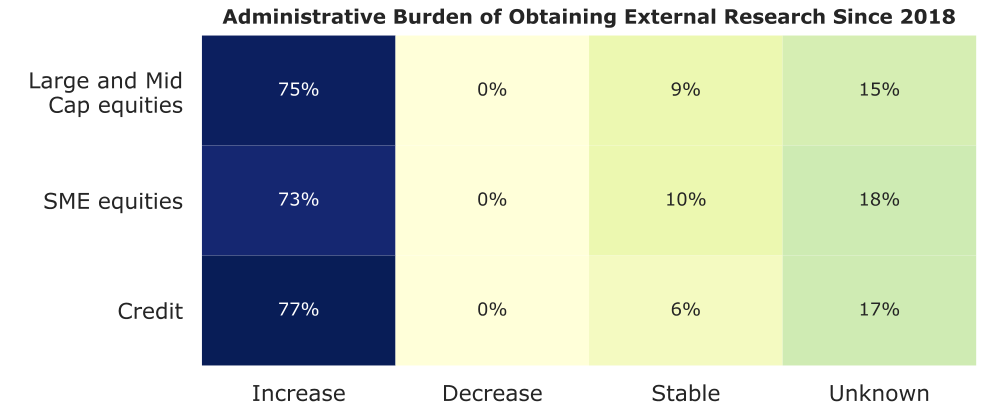
Note: The table above corresponds to answers from question no.2 : ‘In your view, has the administrative burden of obtaining external research changed since January 2018 in the three case: Large and Mid Cap Equities? SME Equities? Credit?’

Note: The figure above corresponds to buy-side survey response to the second part of question no. 2 ‘If you wish, please provide text on what changes in the administrative burden have been most material for your business.’
9.3 MiFID II and internal research strategies for the buy-side
In response to MiFID II, one might expect that buy-side firms would, at least in part, alter their research strategy, either by changing their reliance on internal versus external researchers or by adopting investment strategies that rely more or less on research.
Figure 9.3 shows the buy-side survey results on how MiFID II has impacted internal research strategies. The majority of the buy-side firms see no change in their internal research (59.3%), quantitative strategies (74.5%), passive strategies (82.0%) and fundamental-based strategies (75.0%), more than a third of the respondents (37.0%) suggest that they have increased their reliance on internal research. There is some suggestion in Figure 9.3 that the reforms have increased quantitative research but, on the other hand, they may have reduced passive strategies.
Note that the responses suggesting greater reliance on internal researchers in Figure 9.3 are perhaps surprising as the common view is that MiFID II reduced the direct cost of research for buy-side firms (although it may have increased administrative costs). However, one should note that the largest gains in budget reductions were enjoyed by very large buy-side firms. Medium and small firms may even have experienced higher research costs.
In any case, the responses displayed in Figure 9.3 are somewhat belied by those in Figure 9.4 which shows that for most firms the number of internal analysts has remained unchanged following MiFID II. Only a very few report changes in numbers of internal researchers and the changes reported include both increases and decreases.
Another perspective on reliance on internal researchers is provided by Figure 9.5 which presents buy-side views on whether post-MiFID II changes in the number of internal researchers is above or below trend. While majority of the respondents aren’t sure about the trend of change, about a fourth of the respondents view that their change is same as trend. A small fraction reported their change as above the trend. None of the respondents reported their change to be below their trend.
The different responses may be reconciled by the hypothesis that, even if little has so far changed in the balance between internal and external research, firms plan to expand internal research. This is consistent with the comments of interview participants.
A very large and representative continental European asset manager reported no real change in their own internal research activities. They expect to boost internal research teams in future, offsetting this with reductions in external research purchases. A global firm (representative of others) reported that they have invested in more internal research. Size permits them to benefit from scale in the development of strategies while convergence between sell- and buy-side salaries assists hiring. Large Nordic asset managers reported expecting to need more internal researchers following MiFID II but, in the event, this had not proved to be the case.
Some firms operate with portfolio managers that spend a large fraction of their time acting as analysts so the boundary between internal researchers and managers is blurred. Such firms make rather complex decisions about buying more or less external research.
For completeness, we show in Figure 9.6, the levels of internal research teams operated by survey respondents broken down the area of focus employed at the buyside firms. A large majority of the buy-side respondents have between 0 to 10 internal analysts covering SME equities (82%), credit securities (75%) and large and mid-cap equities (71%). While a very small fraction of respondents has between 50 to 200 analysts covering credit securities and large and mid-equities, none of the respondents have a similar number of analysts covering SME equities.
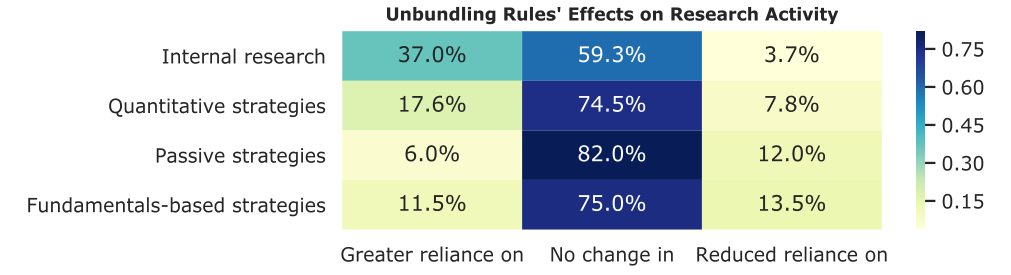
Note: The above panel corresponds to question no.20: ‘How have the MiFID II unbundling rules induced your firm to change its own overall research activity?’
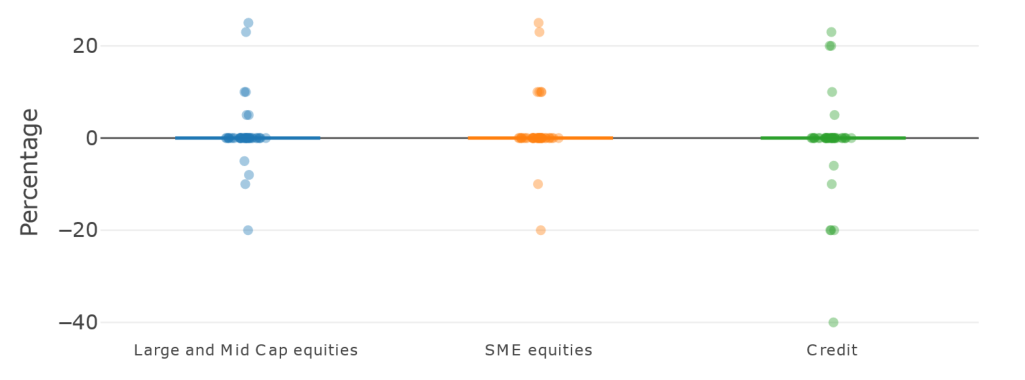
Note: The panel above corresponds to question no.22: ‘What is the percentage change in the number of internal researchers within your firm since January 2018 for Large and Mid Cap Equities? SME Equities? Credit?’
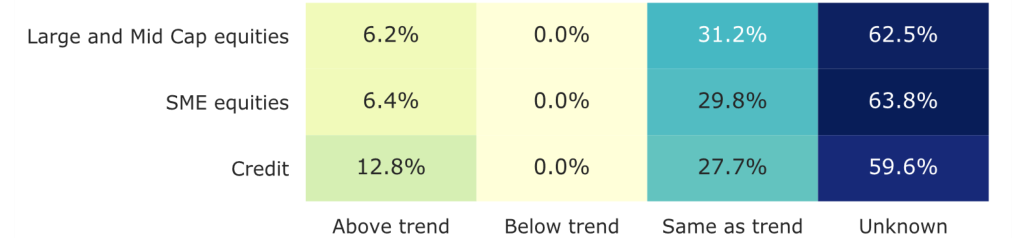
Note: The figure above corresponds to question no.2 : ‘Is the change in the number of your firm's internal research analysts since January 2018 above or below trend? Large and Mid Cap Equities? SME Equities? Credit?’
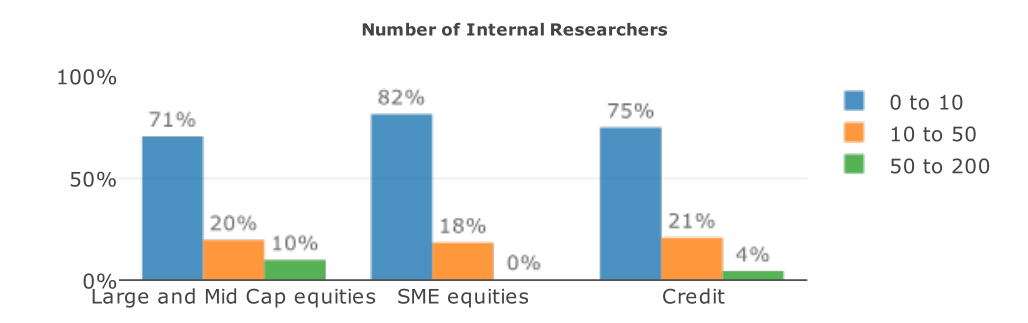
Note: The figure above corresponds to question no.21: ‘What is the number of internal researchers within your firm for Large and Mid Cap equities, SME equities, Credit?’
9.4 On-line research marketplaces
Finally, we turn to the use of distribution channels for research. Figure 9.7 shows the buy-side survey results on their consumption of research from online research marketplaces (ORMs). A large majority of the buy side respondents (75%) have reported that MiFID II has not led them to change their consumption of research from Online Research Marketplaces (ORMs). Additionally, 22% reported that MiFID II actually led to a decrease. Only a very small fraction (4%) of the buy side firms reported an increase in consumption of research from ORMs.
On the other hand, a small majority of the buy-side firms (42%) reported a decrease in their use of broker platforms for consuming research. This is closely followed by a smaller percentage of buy-side respondents that reported no change. About a fifth of the respondents reported to an increase in their consumption of research from broker platform.
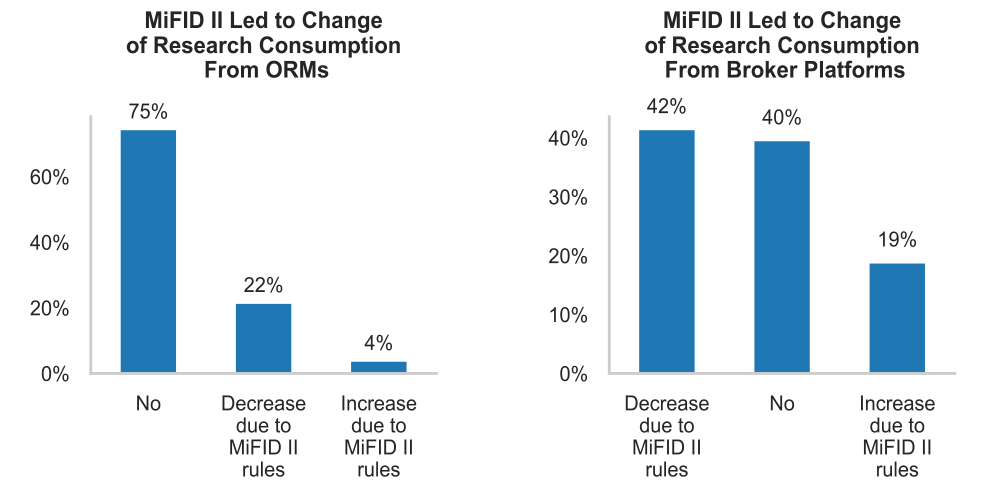
Note: The panel on the left corresponds to question no. : ‘Have MiFID II rules led you to change your consumption of research from Online Research Marketplaces (ORMs)?’ The panel on the right corresponds to question no.50: ‘Have MiFID II rules led you to change your consumption of research from Broker Platforms?’
9.5 Conclusions on other MiFID II effects
This section examines possible effects of MiFID II unbundling on administrative burden, research strategies and the use of internal versus external research.
Three quarters of survey respondents reported an increase in administrative burden attributable to MiFID II. It might perhaps be surprising that the fraction is not higher. Respondents made no distinction between different asset classes (large and SME equity and credit) in identifying greater administrative burdens.
On research strategies, survey respondents largely reported little change in research focus or style although there was some indication of an increase in quantified strategies and, perhaps surprisingly, a minor reduction in passive strategies. Quite a large fraction of respondents suggested they were relying more on internal research although this was not borne out by a more detailed question about changes in numbers of internal researchers. One interpretation consistent with interview responses is that firms expect to boost their use of internal researchers in future although little change had occurred up to time of survey.
On use of research platforms, the survey results reported here suggest MiFID II has mostly reduced reliance on broker platforms but so far has led to a small reduction in the use of online research marketplaces.
10. MiFID II and Investor Relations
10.1 Introduction
Investor Relations (IR) are a key concern for many companies as they regard communication with equity and corporate bond investors as key to managing their standing in stock and bond markets and, thereby, to retaining access to favourable financing terms. Mid Cap and SME companies are typically much less visible to capital market participants than large companies and, hence, have to exert themselves more in relative terms to maintain good IR.
The counter-part to Investor Relations from the standpoint of investment firms is Corporate Access (CA). For portfolio managers, effective CA is an important input to investment decisions. Again, it is most challenging for managers to obtain information regarding Mid Cap and SME companies.
Firms of any size have specialist IR departments or groups. These organise interactions between management and investors and may themselves represent their firms in meetings with the buy-side. The two main ways in which IR activities are pursued by firms are conferences and roadshows. Conferences are typically organised by brokers who invite audiences of investors to meet issuer firm representatives, often top management either in multi-investor or on-on-one sessions. Roadshows consist of series of visits by a single issuer firm to individual investors within a given financial centre typically organised and facilitated by a broker.
10.2 Investor Relations activities by issuer survey respondents
Figure 10.1 shows, for issuer respondents to our survey, the size of their IR departments and the number of brokers that each firm employs in its IR activities. The figure shows that the majority of issuer respondents (which were mostly in the SME or Mid Cap range) have between 1 and 3 IR staff members. The number of brokers used by the respondents for corporate access varies considerably, with anything up to twenty brokers involved.
Figure 10.2 shows that, for issuers, the most popular factor (93%) for selection of brokers for organizing road shows is the access that brokers have to investors. Quality of the research is factor identified by the second largest fraction (67%) of issuers. A much smaller percentage of issuers (19%) consider their banking relationship with the broker.
In interviews, issuer respondents reported that the major challenge they face is conducting Investor Relations (IR) in foreign financial centres. Continental European Small and Mid Cap companies reported that arranging road-shows was more complicated now in that, post MiFID II, the lists of asset managers to which brokers have access are shorter. In some cases, this had led issuers participating in interviews to cancel road-shows. In other cases, issuers reported that MiFID II had increased the costs of IR because they are now obliged to arrange their own meetings that run in parallel with road-shows organised by brokers.
The resource cost of MiFID II is significant for many issuer IR departments as (i) they must organise more meetings themselves and (ii) they are more frequently approached directly by asset managers. Several IR heads said they had either taken on more staff or were considering doing so.
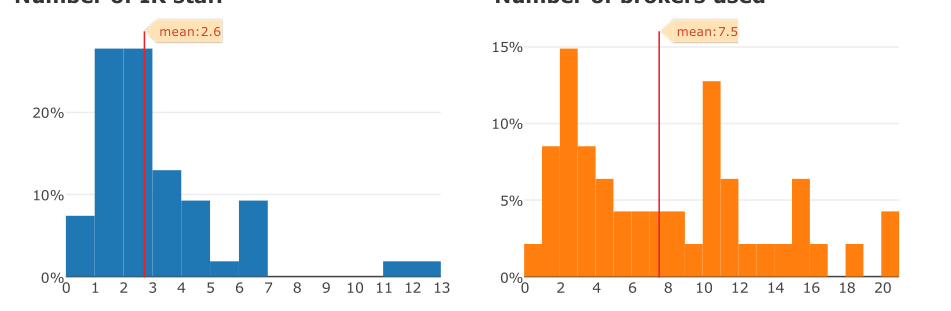
Note: the left panel corresponds to question no. : ‘How many staff are employed in your Investor Relations department?’ and the right panel to question no. 2: ‘How many brokers do you use for corporate access?’
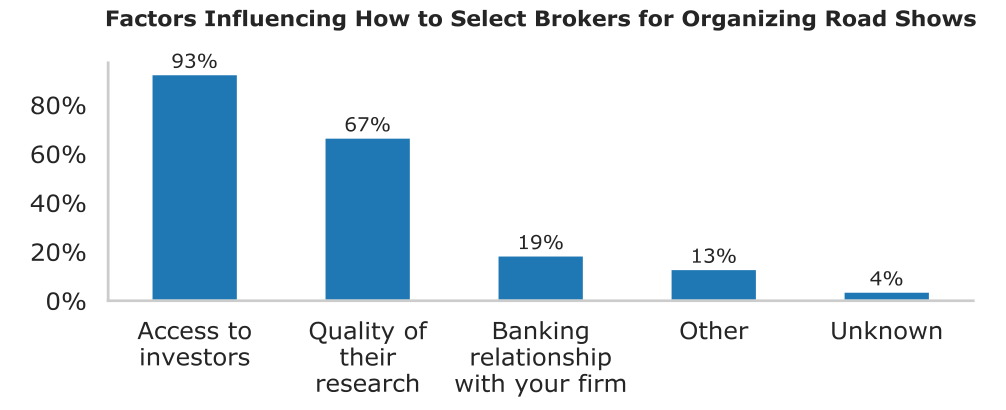
Note: The figure above corresponds to question no. : ‘Which factors influence how you select brokers to organize roadshows?’
10.3 Studies of the effects of IR
Issuer firms interviewed as part of this study explained the importance of effective IR. Particularly important in the view of several Mid and Small Cap respondents was the degree to which firms could diversify their investor base internationally. One issuer argued that they perceived a premium on the share price of competitors that were able to tap investments from international investors.
Several academic studies tend to confirm the importance of effective IR. Chapman, Miller and White (2018) examines whether investor relations officers provide value by facilitating the assimilation of firm information by the market. They find that firms with IR officers have lower stock price volatility, lower analyst forecast dispersion, higher analyst forecast accuracy, and quicker price discovery, consistent with IR officers aiding market participants in their assimilation of firm information. The authors demonstrate that these effects are stronger for firms with longer-tenured IR officers.
Bushee and Miller (2012) examine the impact of increasing investor relations activities by investigating the effects on a sample of 210 small- and mid-cap companies that increased IR activities. The authors find that such companies show increases in disclosure, media coverage, and analyst following and substantial and ongoing increases in institutional investor ownership. The authors find that the companies in the sample experience a shift in investor composition toward institutions that are more geographically distant and that tend to invest in larger companies, consistent with the IR activities creating visibility to a different type of investor. The authors also find that there are improvements in the valuation in the year following IR imitation activities.
Agarwal, Liao, Taffler and Nash (2008) examine the market value of investor relations (IR) activity. The authors use data from the Investor Relations Magazine Investor Relations Awards from 2000 to 2002 to proxy for the quality of firm investor relations. The authors find that firms perceived to have the most effective IR strategies earn superior abnormal returns, both before and after the nominations. The authors also find that liquidity of nominated firms increases in the year subsequent to the nominations.[93]
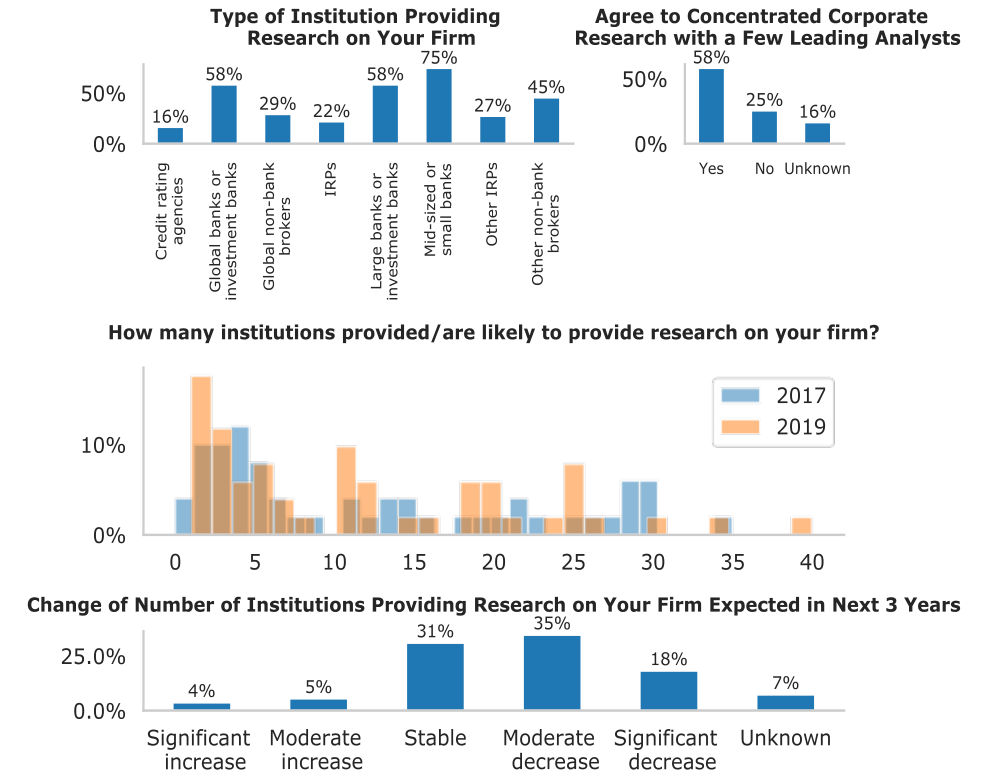
Note: The top left panel corresponds to question no.1 from the issuer survey: ‘What types of financial institutions provide research on your firm?’ The top right panel corresponds to question no.32 on the issuer survey: ‘Some observers predicted that company research would become more concentrated with MiFID II and that a few leading analysts would have a larger role shaping the consensus. Would you agree with this statement in relation to your firm?’ The centre panel from questions no.20&21: ‘Overall, please estimate how many institutions are likely to provide research on your firm in 2019.’ And ‘Please estimate how many institutions provided research on your firm in 2017.’The bottom panel to question no.22: ‘Over the next 3 years, how do you expect the number of institutions providing research on your firm to change?’
10.4 Issuer views on MiFID II and research coverage
Figure 10.3 presents the results of the issuer survey on their research coverage. The results signal some general disquiet among issuer firms about the coverage they expect to receive and a likely concentration of expertise about their company. More of this appears to be concerns about the future than issuers reporting changes that have already occurred. According to issuers, the main providers of research on the respondent issuer firms are mid-sized or small banks (75%) which is closely followed by large banks or investment banks (58%) and global banks or investment banks (58%).
The majority of the issuers (58%) believe that the research on their firm will become more concentrated with a few leading analysts having a larger role in shaping the consensus. A smaller percentage of issuers (25%) have the opposite view. Almost a third of the issuers (35%) expect a moderate decrease in the number of institutions providing research on their firm in the next three years and a further 18% of the issuers expect a significant decrease. A smaller fraction of issuers (31%) expect stability in the number of institutions. Only a small fraction expects a moderate increase (5%) or significant increase (4%) in the number of institutions covering them.
Figure 10.4 shows how issuers are managing their IR activities in the context of MiFID II. To summarise, the responses suggest higher costs accompanied by some fall in coverage for a fraction of companies. Issuers expect to reply more on conferences in future and to engage more directly with asset managers. These responses are all consistent with comments made by issuers in interviews.
For most of the issuer respondents (58%), the size of their investor relations team has been stable between 2017 and 2019. A small percentage of issuers (24%) report an increase in their IR department size (against 11% that report a decrease). Only 42% of firms report having stable IR costs and 44% report an increase. Additionally, for most of the issuer respondents (55%), the number of brokers used for corporate access has remained stable. 22% of the respondents report a decrease in the number of brokers used for corporate access and only 11% report an increase.
A large fraction 40% of respondents report decreased levels of corporate access while 36% report stable levels. Additionally, 30% of issuers believe that MiFID II will increase their reliance on roadshows to build their investor base and 26% believe that their reliance will decrease. Slightly larger fraction of respondents (28%) believe that their reliance on roadshows will be stable.
More than half the respondents (56%) reported that MiFID II has affected their use of the brokers to organize roadshows and only 29% reported to MiFID II having no effect. A large majority (73%) reported to not having been charged by brokers to cover the cost of organizing road shows since MiFID II. Only a small fraction (18%) reported to having been charged for such services since MiFID II. A large majority of the issuer respondents (62%) have increased their participation in conferences and a larger percentage of respondents (69%) have increased direct engagement with investors since MiFID II.[94] While the majority of the issuer respondents (58%) view that their knowledge of investor base has not changed since MiFID II, a smaller percentage (25%) view that their knowledge has worsened. Only a small percentage (9%) believe that their knowledge of investor base has improved since MiFID II.
Firms are endeavouring to contact investors more directly. Figure 10.5 shows that 26% of the firms increased the information available about them on their company website after MiFID II. Most prominent factors prompting this change are- change in what investors expect (57%) and reduction in corporate access (50%). Only 21% attributed the change to decrease in the number of analysts covering their firm.
Figure 10.6 shows that a majority (47%) of the issuers see no change in the number of news articles on their firms attributed to research coverage change. This is followed by 25% of the issuers who reported a decrease in such news articles. While majority of the issuers (43%) do not know whether the quality of research on their firms influences their cost of issuance securities, 31% report that quality has no influence.
Figure 10.7 presents the issuer survey results on the number of analysts accessing the firm’s management. Most of the firms’ management were accessible to 10 or less analysts in 2018. Majority of the firms (62%) report stable levels of the number of analysts having access to their management. A smaller percentage (27%) reported decreased levels of number of analysts having access to their management. In determining the criteria for access of analysts to their management, the most popular criterion is the analyst’s research quality with 5 % of the issuer respondents selecting this option. This is followed by factors such as the analyst’s influence ( %) and broker’s coverage of investors (33%).
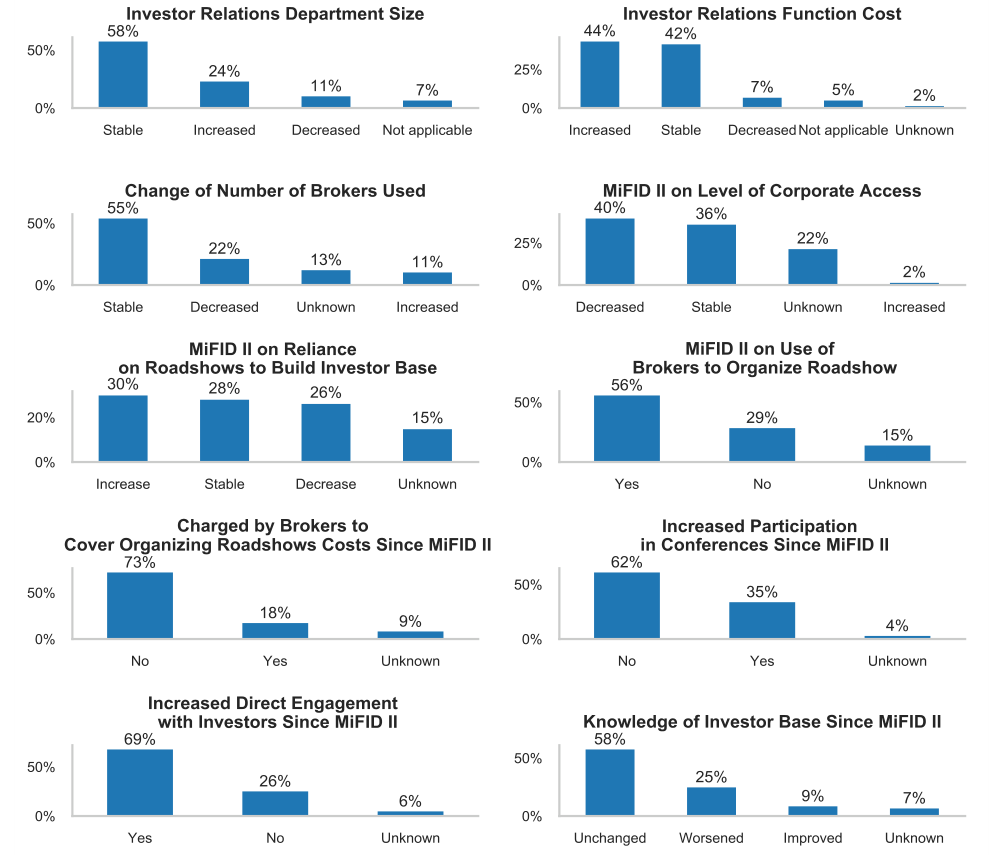
Note: The top left panel corresponds to question no. 0: ‘Has the size of your Investor Relations department changed between 2017 and 2019?’ The top right to question no. 1: ‘Has the cost of the Investor Relations function changed between 2017 and 2019?’ The left, second row panel corresponds to question no. : ‘How has this number evolved between 2017 and 2019?’ regarding the number of brokers used for corporate access and the right, second row panel to question no. : ‘Has MiFID II changed the level of corporate access for your firm?’ The left, middle row panel corresponds to question no. 5: ‘Is MiFID II likely to increase your reliance on roadshows to build your investor base?’ and the middle right panel to no. : ‘Has MiFID II affected your use of brokers to organize roadshows on your behalf?’ The fourth row, left panel corresponds to question no. 8: ‘Since MiFID II, have you been charged by brokers to cover some of the costs of organizing roadshows?’ and the fourth row, right panel to question no. : ‘Since MiFID II, have you increased your participation in conferences?’ The bottom left panel corresponds to question no.50: ‘Has your company increased its direct engagement with investors since MiFID II?’ and the bottom right to question no.51: ‘Overall, since MiFID II, how do you consider your knowledge of your investor base has changed?’
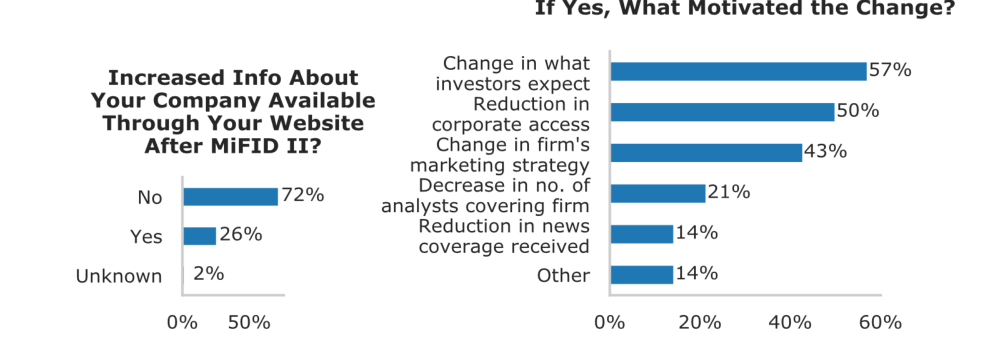
Note: The left panel corresponds to question no. 0: ‘After MiFID II, have you increased the information about your company that is available through your website?’ and the right panel to question no. 1: ‘If "Yes", what motivated this change?’
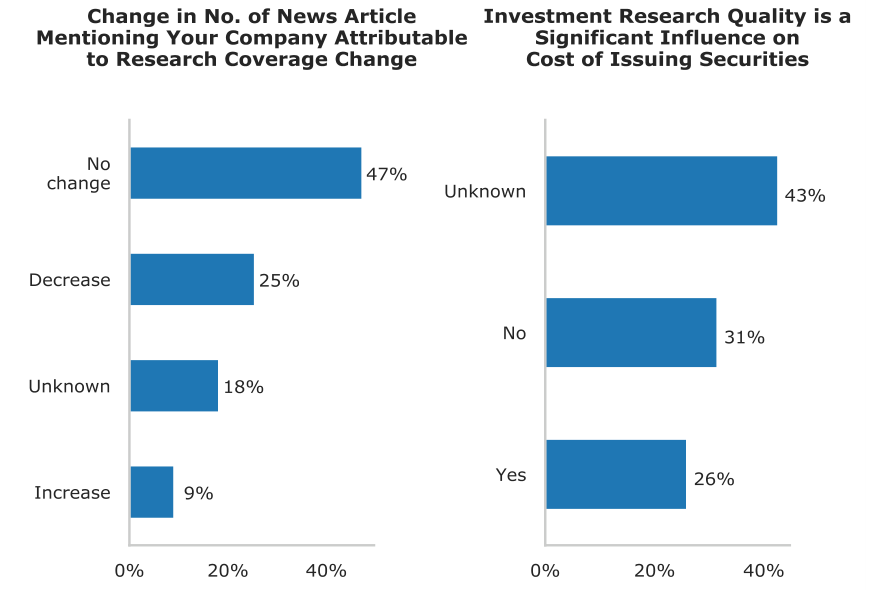
Note: The left panel corresponds to question no.2 : ‘Has there been a change in the number of news articles mentioning your company that you believe is attributable to changes in research coverage of your firm?’ and the right panel to question no. : ‘Is the quality of investment research on your firm a significant influence on your cost of issuing securities?’
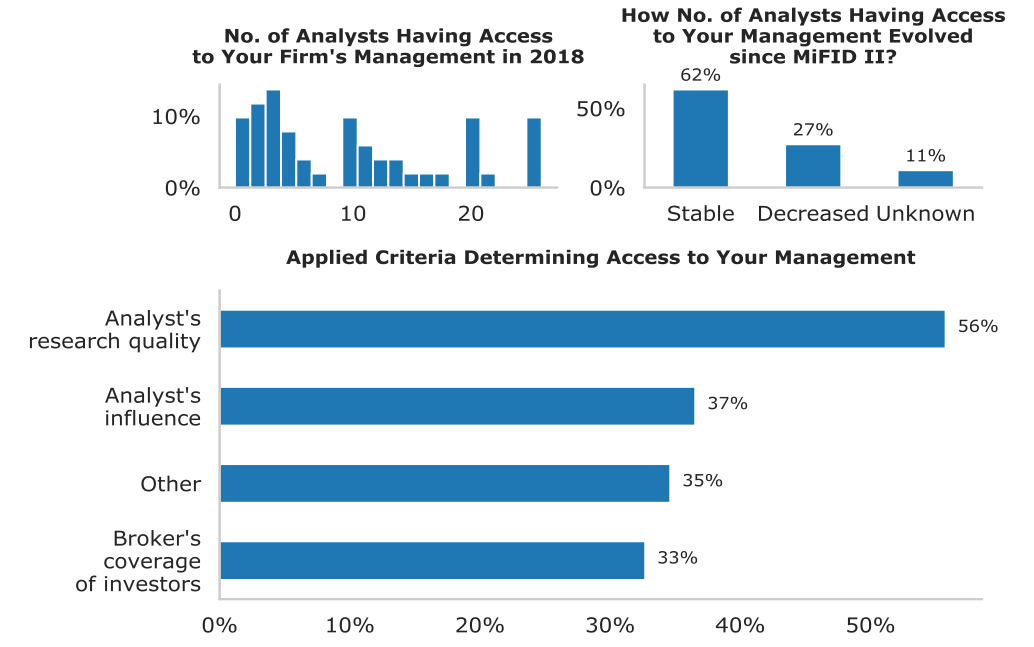
Note: The top left panel corresponds to question no. 2 : ‘In your view, how has MiFID II affected the usefulness of consensus forecasts?’ The top right panel corresponds to question no.28 ‘With the introduction of MiFID II, how would you say the number of analysts with access to your management has evolved?’ The bottom panel corresponds to question no.2 : What criteria were applied in determining which analysts had access to your management?’
10.5 Sell-side views on MiFID II and Corporate Access
Different perspectives on IR/Corporate Access may be gained from sell-side firm survey responses. Many broker respondents to the survey are involved in organising conferences and roadshows for issuers. For roadshows, the majority of sell-side firms charge investors while fewer charge issuers. Most sell-side respondents believe that MiFID II has hampered investor contacts with SMEs.
Figure 10.8 presents the results of the sell-side survey on the impact of MiFID II on corporate access. 80% of the sell-side respondents organize road shows for corporates and a slightly larger percentage (87%) organize investor meetings for corporates. Majority of the sell-side respondents do not charge corporates (67%) but charge investors (61%) for the road shows. This pattern is similar for corporate meetings with 62% of the respondents not charging the corporates and 64% charging the investors for corporate meetings. More than half (52%) of sell-side respondents perceive that corporates are organising their own investor relations activities more after MiFID II and a smaller percentage (28%) perceive otherwise. A larger majority (66%) believe that MiFID II inducement rules have reduced the direct access of investors on information about SMEs.
Bulge bracket banks told us that MiFID II had not affected their corporate access activities.[95] In 2018, one such banks had run more than 80,000 analyst meetings and approaching 140,000 corporate access meetings. This was in line with earlier years. Similarly, a prominent specialist broker told us they had expected problems in organising roadshows. But in 2018 they did about 70 roadshows and this number represented a significant increase on 2017.[96]
Firms like these tend to have a lot of market power in organising Corporate Access. Other brokers described the challenges of arranging corporate access post-MiFID II for non-European firms wishing to do roadshows in London. The invoicing and organising are arduous, bargaining and organisational demands have increased and so there has been a need to increase staff. ne firm in particular said “the big point is that MiFID II has made non-EU management consider whether to come to EU. Asset managers are constrained by rate cards and all the regulatory constraints. Non-EU management may cease to visit.”
Other European brokers reported that MiFID II has hardly affected standard Corporate Access activities such as group meetings and 1-on-1’s. But that lots of clients are treating Corporate Access as MNMB. Some clients have rate cards but they ask clients how they treat corporate access whereupon some pay but some do not. Most geographies have a common approach to corporate access payments. For example, German funds tend to treat Corporate Access as MNMB.
Corporate bond brokers reported that FI-related Corporate Access had been unaffected by MiFID II. Investors reach out to analysts just as they did before. Credit teams organise meetings between company management and investors just as equity research teams do. Many European bond issuers are private and so they have no contact with equity research teams. Credit teams organise road shows and conferences and charge for these activities. They use rate cards that differentiate between different types of client, arranging meetings with CFOs, Treasurers, and CEOs. The volume of the activity is smaller than on the equity side and is not so organised. There is less problem of partial lists since large brokers retained broad coverage of many asset managers after MiFID II.
In some regions like the Nordics, meetings between issuers and investors are organised by debt advisory teams including roadshows especially for new issuers. Meetings associated with issues are not charged for. Research is paid for by issuers and so can be shown to everyone.
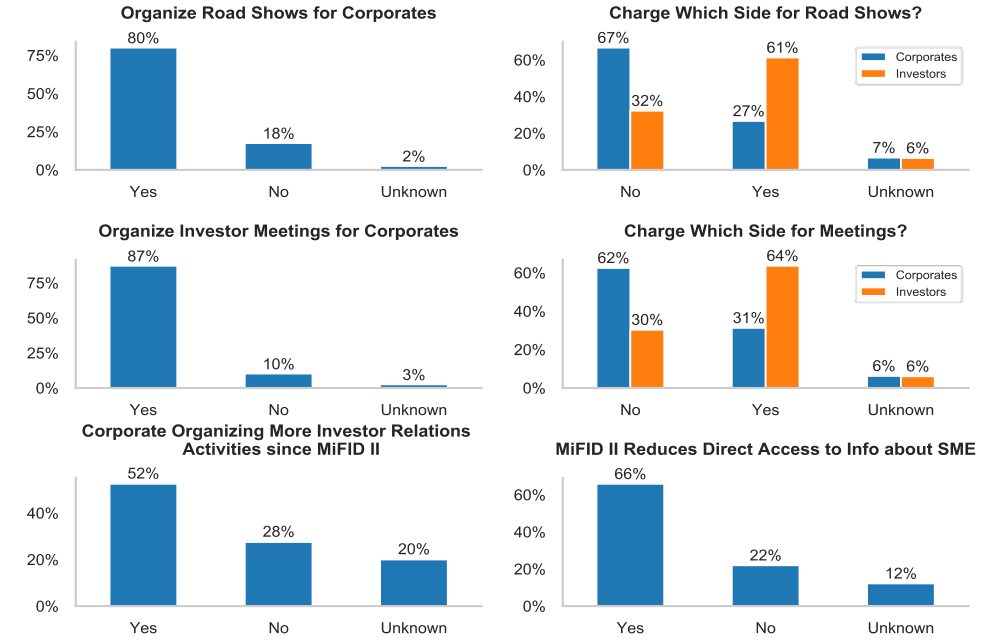
Note: The top left panel corresponds to question no.45 of the sell-side survey: ‘Does your firm organise road shows for corporates?’ The top right to question no. : ‘If you answered "yes", does it charge either (i) corporates or (ii) investors for this service?’ The middle left corresponds to question no. : ‘Does your firm organise investor meetings for corporates?’ and the middle left to no. 8: ‘If you answered "yes", does it charge either (i) corporates or (ii) investors for this service?’ The bottom left corresponds to question no. : ‘Do you perceive that corporates are organising their own investor relations activities more than before January 2018?’ and the bottom left to question no. 51: ‘In your view, have the MiFID II inducement rules reduced the direct access that investors have to information about SME companies (via investor- management contacts, for example)?’
10.6 Buy-side views on MiFID II and Corporate Access
Some asset manager interviewees did not perceive that MiFID II had disrupted IR or Corporate Access but they did comment on significant cost inflation as brokers have pushed up the price of attending conferences to inflated levels. And in survey responses many buy-side firms reported decreased participation in road-shows. Figure 10.9 shows buy-side survey results on the impact of MiFID II on participation in roadshows. Most of the firms see a decreased participation (46%) or no change in the participation level (43%). Only a small fraction (4%) of the firms see an increase in investor participation.
Figure 10.9: Buy-Side Survey Results on Roadshow Level
Some specialist Small Cap asset managers that are close to SME and Mid Cap companies told us that Corporate Access is in flux for smaller issuers. One said “Companies have found it difficult to get the desired level of interaction with investors.” A French company that wants to meet London based investors would ask a French broker to organise its roadshow. The broker would write notes, arrange meetings and, in the past, was rewarded by broking commission. Now with MiFID II, the broker asks for concierge fees for organising meetings. But funds may be unwilling to pay and may prefer to approach issuers directly.[97] For the moment, outcomes are confused. In the longer run the solution may be the emergence of non-broker intermediaries.
Multiple buy-side interviewees described substantial inflation in the prices that bulge bracket brokers charge for conferences. At a recent conference, a major bank offered 40 meetings for a charge of $140,000. The meetings end up being taken by prominent hedge funds for which research budgets have shrunk less. Buy-side firms attribute the inflation to multiple causes but believe MiFID II has contributed: brokers are under pressure to make returns and budgets for hedge funds have not declined. The result is that asset managers are sending fewer people to conferences.
Other asset managers believe that sell-side firms are increasing conference costs to push buy-side firms into subscribing for research packages. Some European asset managers told us that from early 2019 they started to be charged for conferences even if they had a full research package. They might have to pay EUR 1500 to meet management. For one conference in January, they had a full package but were asked to pay EUR 150-200 in addition per attendee.
10.7 Conclusions on IR and Corporate Access
Issuer, buy-side and sell-side survey respondents and interview participants gave somewhat different and contrasting perspectives on the effects of MiFID II on Investor Relations. Issuers were the most concerned about the effects of MiFID II on IR. Many issuers argued that the regulatory changes had significantly impaired their ability to interact with investors, particularly across borders.
Buy-side firms reported some challenges as brokers, possibly under financial pressure, seek to extract increased revenue from Corporate Access activities. A few buy-side firms specialising in SME funds and close to smaller companies reported problems.
Large sell-side firms were the least concerned about developments in IR and Corporate Access although some specialists said that organisation of road shows had been disrupted by the new environment and complained that Corporate Access was nolonger profitable for them. Overall, the conclusions on Investor Relations are that MiFID II has altered the role that brokers play in intermediating contacts between issuers and investors.
Particularly for SMEs, IR appears to be in flux with firms on different sides of the industry exploring different ways of proceeding. This aspect of the effects of MiFID II deserves attention from regulators as the implications for smaller firms of losing access to international investors are significant.
11. MiFID II, Financing Costs and Liquidity
11.1 Introduction
Assessing the effects of MiFID II on liquidity and financing costs is challenging. To provide convincing answers, a long chain of reasoning must be established. The chain consists of: rule change leading to reduced coverage leading to higher trading costs or worse financing terms.
Each link in this chain is subject to debate. The statistical analysis we present on coverage and research volumes in Section 5 itself suggests that the 2018 decline in research volumes is partly cyclical (reflecting low trading volumes) and so even the first stage of the argument is questionable.
An alternative way to assess these questions is to examine responses by industry participants. These surveys register prevalent opinion rather than reality but they are helpful in understanding the context for policy making.
This subsection presents issuer views (i) on the liquidity and financing costs of SMEs in general and (ii) on the liquidity and financing costs of the respondents themselves. A large majority of issuers surveyed report that MiFID II has impaired the coverage and liquidity of SME equities. Somewhat fewer are concerned about corporate bond coverage and liquidity. While still negative about the effects of MiFID II, respondents express less forthright views on the effects of MiFID II on their own firm’s equity and bond issues than they do about the effects of the rules on the securities of SME firms in general.
The section also presents information about sell-side views on the impact of MiFID II on liquidity and access to finance for European SMEs and access to bond market liquidity and access to finance for bond issuers. The views of buys-side institutions are noticeably negative on these impacts.
11.2 Issuer views on MiFID II effects on liquidity and financing costs
Figure 11.1 presents issuer views on MiFID II and the coverage and liquidity of SME equity and bond securities and the financing costs faced by SMEs in general. A large majority of issuers report that MiFID II has decreased SME coverage and visibility (76%) and the liquidity of their shares (64%) and increased their equity financing costs (64%).
In contrast, only 26% of the corporate bond issuers report a decrease in their coverage and visibility and only 20% reported a decrease in the liquidity of bond issues and only 20% reported an increase in their bond issuing cost. Most issuer respondents do not hold a view on the impact on issuing corporate bonds and its cost.
Figure 11.1: Issuer View on the General Impact of MiFID II
Figure 11.2 presents issuer views on how their own bonds and equity liquidity and financing costs have been affected by MiFID II. 42% state that the unbundling rules have worsened equity liquidity while 40% say that there is no material change. 25% say their access to equity or bond financing has worsened between 2017 and 2019 while 55% report no material change. When issuers are asked to identify factors that have affected their own firm’s access to financing between 201 and 2018, % identify the MiFID II unbundling rules as a negative influence while 30% say the effects of these rules is neutral. ther factors such as capital market ‘mood’ and firmspecific developments also contribute substantially with 43% saying the latter was a positive influence.
Figure 11.2: Issuer View on Access to Bond and Equity Financing
One should note how often the issuer respondents to the survey are typically involved in securities issuance. Figure 11.3 shows the number of times the issuer respondents have issue bonds in the last five years vs in 2018. The majority of the firms have issued bonds once or less in the last five years. A smaller fraction of firms has issued bonds six times or less. Additionally, most firms have issued bonds once or less in 2018.
Figure 11.3: Bonds Issued Reported by Issuers
Note: The figures above correspond to question no.10: ‘How many times have you issued bonds in the last five years or in 2018?’
Figure 11.4 shows that a majority (63%) of the issuer respondent do not expect to issue bonds in the next two years.
Figure 11.4: Issuer View on Bond Issuance in Next Two Years
11.3 Sell-side views on MiFID II effects on liquidity and financing costs
Figure 11.5 shows sell-side survey responses on the impact of MiFID II unbundling on EU SMEs access to bond and equity financing and liquidity.
Figure 11.5: Sell-Side Response on Impact on Access to Market and Liquidity secondary market liquidity of SME equities in the EU?’ The bottom left panel corresponds to question no.5 : ‘In your view, have the MiFID II rules on research affected EU firms' access to corporate bond markets?’ and the bottom right to question no.55: ‘In your view, have the MiFID II rules on research affected the liquidity of EU corporate bonds ?’
A small majority of the sell-side respondents (38%) take the view that MiFID II negatively affected access to equity market funding for EU SMEs while 18% believe that the impact has been very negative. 26% believe that there has been no impact. In addition, 43% and 22%, respectively, take the view that market liquidity has been negatively or very negatively affected, while 19%believe that there has been no impact.
On access to the corporate bond market for EU firms, 45% the sell-side respondents (45%) view no impact of MiFID II rules although 29% view the impact as negative and 3% view the impact as very negative. On the liquidity of corporate bond market, 37% view no impact and 24% as the impact to be negative and 8% view the impact to be very negative. None of the respondents believed that MiFID has had a positive impact on the equity and corporate bond market access and liquidity.
11.4 Conclusions on financing costs and liquidity
This section presents survey evidence on issuers’ perceptions of how MiFID II has affected the coverage of SME firms. The issuers are also questioned about the experience of their own firms over the period of MiFID II implementation.
Issuers surveyed express very negative views about the impact of MiFID II on SME research coverage and on the liquidity and pricing of SME equity and bond securities. Most respondents are also negative about the effects of MiFID II on the equity and bond securities issued by their own firms although somewhat less than they are for the market as a whole.
The section also presents sell-side survey evidence on the effects of MiFID II unbundling on the access to equity finance and the liquidity of equity securities for European SMEs and the access to bond finance and the liquidity of bond issues for European firms. In all cases, sell-side firms view the effects of the regulations as negative. This is particularly the case for SME equities for which a fifth of respondents say the effects on liquidity and access to finance are very negative.
12. Conclusion
This study examines the effects of the MiFID II restriction on inducements on investment research and European securities issuers of Small and Medium Enterprise (SME) equities and corporate bonds. To some extent, we also examine investment research for Mid and Large Cap equities since corporate bond investors typically make use of equity research reports as well as pure Credit research.
In conducting the study, we employ an interdisciplinary approach that combines statistical analysis, detailed surveys of sell-side firms, buy-side asset managers, IRPs and issuers, in-depth interviews of a variety of market participants and legal analysis, for which we have partnered with Clifford Chance.
We begin with an examination of the market landscape for investment research in Europe. The very considerable variation in bond and equity markets across European countries is striking. Based on equity outstanding, one may conclude that the UK, France, Germany and the Netherlands represent highly developed European markets. Italy, Ireland, Spain and Sweden comprise second tier countries. Austria, Luxembourg, the other Nordics, Belgium and Poland represent the third tier. The equity markets in the remaining countries including other Eastern European countries are much smaller.
Variation in the research landscape across countries is dramatically revealed by the statistics on reports per company and coverage ratios (the fraction of firms followed by at least one analyst). This suggests that research conditions in Eastern and Southern Europe are strikingly worse than in other countries for given ranges of company size.
Our study also sets out the legal landscape of investment research in Europe focussing on some of the key aspects of the MiFID II rules and discuss their implementation in Europe. MiFID II has substantially changed the legal framework for European investment research by requiring the firms to separate payments for research and execution. Firms opting to pay for research using RPAs will need to implement strict standards in research budgeting, evaluating and reporting to investors. Even if investment managers choose to pay using P&L, they will still need to monitor their consumption in order to prevent any inducements.
The survey and the interview responses show that majority of the firms have adopted the P&L approach with interviewees attributing this choice to competition reasons although for complex asset managers, administrative, reporting and operational factors are equally serious. Evaluation of research quality is one of the essential requirements within the MiFID II framework. Most of the investment managers use formal broker votes often involving elaborate processes supplemented with usage data to evaluate the quality.
European investment managers face challenges reconciling contradictions between MiFID II and regulatory regimes for investment research in other jurisdictions, particularly the US. The challenges include (i) buying research from non-EU (specifically US) brokers that might require the latter to infringe US restrictions on direct (non-bundled) research payments and (ii) policing intra-group research sharing.
n (i), the contradiction has so far been managed by the SEC’s issue of no-action letters, recently extended to 2023, which allow US brokers to accept direct payments for research from clients subject to MiFID II rules. US regulators have referred in public statements about possible alternatives to the no-action letter (see Clayton (2019). A small number of large US asset managers have adopted a rebate model approach to paying for research. This involves recompensing investors for the fraction of commission attributable to research. In so doing, these managers are effectively paying for research out of P&L without making hard dollar payments to brokers. Like RPAs, these rebate arrangements are regarded by managers with complicated, multifund business models as difficult to implement with existing systems and daily valuation reporting obligations. Thus, reconciling US and EU rules given the operational complexities of multi-platform block trades on behalf of multiple clients remains a difficult task requiring further assessment.
On (ii), interviews with global asset managers indicated that they had adopted approaches for limiting but not precluding intra-group research that they believed are compliant with regulations. Some specialised broker research providers are concerned (for commercial reasons) that these internal arrangements are not watertight and argue that the most valuable research may consist of insights that be passed on within groups even if, say, sharing of written reports on any scale is precluded. While such arguments reflect commercial rather than regulatory perspectives, they do signal the great difficulty in rigorously enforcing MiFID II style unbundling internationally when most asset management is offered by major global groups.
After setting out the market and legal landscapes, we address a series of questions about the possible impact of MiFID II on different aspects of European investment research, particularly pertaining to SME equities and to corporate bonds. These questions concern the impact on budgets and pricing, the effects on coverage and volumes of research, the impact on research quality and numbers of research providers, structural effects of MiFID II on FI research and on internal research strategies of buy-side firms and the effects of MiFID II on Investor Relations and the liquidity and financing terms of issuers.
Buy and sell-side respondents and issuers perceive deteriorating coverage and research quality for SMEs and worsening liquidity and financing terms for equity and bond securities. Issuer respondents are more pessimistic about developments when they describe outcomes for companies in general than when they talk about their own companies’ experiences. We also encountered numerous interviewees who questioned the conventional view that MiFID II had generated a deterioration in investment research.
In the statistical analysis, we ask whether the behaviour of research indicators was statistically different from what one would expect from their trend evolution before MiFID II was implemented. We also ask whether any apparently ‘special’ (beyond trend) behaviour in 2018 was, in fact, the result of cyclical developments. Since research is closely related to secondary and primary market activity, we can condition on these (with appropriate use of instrumental variables) to remove the effects of cyclical influences.
It appears that the beyond-trend declines in research activity levels (coverage ratios, reports per company, brokers per company) observed in 2018 may have been in part cyclical and the significant declines that remain after making allowance for the cycle were greater for non-SMEs than for small companies. We also find little evidence of a systematic change in the quality of research over the period of MiFID II implementation.
The statistical analyses we perform underline the substantial variation in the quality and quantity of research across regions and countries. Policy makers aiming at enhancing the capital markets union could therefore assess how to improve the quantity and quality on SME research across the Union.
The interviews were also a primary source for two other more structural effects of MiFID II that we describe in the report: (i) the impact of MiFID II on FI research and the switch from the publishing analyst model to the strategy/sales analyst model that many large brokers have adopted, and (ii) the impact of MiFID II on Investor Relations.
On (i), strategy/sales research analysis is often quite similar in nature and quality to the analysis performed by publishing researchers. To the extent that MiFID II has encouraged brokers to rely more on strategy/sales analyst teams, some interviewees argued that credit research has in part been driven underground. Though this may be an extreme way of stating the issue, concerns about the lack of clarity regarding the boundary between (a) analysts supporting dealing teams, (b) strategy/sales analysts, and (c) publishing researchers is clearly a legitimate concern. Possibly related to the structural changes just described, non-public data provided to us by a major data supplier, Refinitiv, suggest that major research houses cut back Fixed Income research significantly over the period 2017 to 2019.
On (ii), European SMEs issuers have faced greater difficulties post-MiFID II in obtaining access to asset managers in foreign financial centres. The nature of intermediation between issuers and asset managers appears to be still evolving and new service providers or approaches may emerge. In any case, this aspect of information flows between issuers and investors merits careful monitoring as a potential problem for European SMEs.
References
Agarwal, V., A. Liao, R. Taffler and E. Nash (2008) “The impact of effective investor relations on market value,” available at: https://papers.ssrn.com/sol3/papers.cfm?abstract_id=1102644
Alternative Investment Management Association (201 ) “Paying for Research: A Comparative Guide,” available at: https://www.aima.org/resourceLibrary/preview/?resource=paying-for-research-acomparative-guide&showPublishedDate=true
Autorité des marchés financiers (2018) “Guide on new rules for the funding of research within MiFID 2,” available at: https://www.amffrance.org/en_US/Publications/Guides/Professionnels?docId=workspace%3A%2F%2FS pacesStore%2Ffe72932d-b7f2-4652-b166-1eea67126a70
Asgari, N. (201 ) “Reform helps to flip cost of research on to small companies,” Financial Times, available at: https://www.ft.com/content/f746ed3c-5f84-11e9-a27afdd51850994c
Baele, L., C. Pungulescu and J. Ter Horst (200 ) “Model uncertainty, financial market integration and the home bias puzzle,” Journal of International Money and Finance, 26(4), pp.606-630.
Barber, B.M., R. Lehavy and B. Trueman (200 ) “Comparing the stock recommendation performance of investment banks and independent research firms,” Journal of Financial Economics, 85(2), pp.490-517.
Blass, D. (2019) Speech to the ICI Mutual Funds and Investment Management Conference, San Diego, CA, 18th March, available at: https://www.sec.gov/news/speech/speech-blass-031819
Bragg, S. (201 ) “SEC Points towards Market Solutions in the US to Resolve MIFID II Conflict,” 5th June, Integrity Research blog, available at: http://www.integrityresearch.com/sec-points-towards-market-solutions-us-resolve-mifid-ii-conflict/
Brennan, M.J. and A. Subrahmanyam (1 5) “Investment analysis and price formation in securities markets,” Journal of Financial Economics, 38(3), pp.361-381.
Bushee, B.J. and G.S. Miller (2012) “Investor relations, firm visibility, and investor following,” The Accounting Review, 87(3), pp.867-897.
CFA Institute (201 ) “MiFID II: ne Year n | An Assessment,” available at: https://www.cfainstitute.org/-/media/documents/survey/cfa-MiFID-II-surveyreport.ashx
CFA Institute (201 ) “MiFID II: A New Paradigm for Investment Research| Investor Perspectives on Research Costs and Procurement,” available at: https://www.cfainstitute.org/-/media/documents/support/advocacy/MiFID_ii_newparadigm-for-research-report.ashx
Chan, K., V. Covrig and L. Ng (2005) “What determines the domestic bias and foreign bias? Evidence from mutual fund equity allocations worldwide,” The Journal of Finance, 60(3), pp.1495-1534.
Chang, M., G. D'Anna, I. Watson and M. Wee (2008) “Does disclosure quality via investor relations affect information asymmetry?” Australian Journal of Management, 33(2), pp.375-390.
Chang, X., S. Dasgupta and G. Hilary (200 ) “Analyst coverage and financing decisions,” The Journal of Finance, 61(6), pp.3009-3048.
Chapman, K.L., G. S. Miller and H. D. White (2018) “Investor relations and information assimilation,” The Accounting Review.
Clayton, Jay (201 ) “Remarks to the SEC Investor Advisory Committee,” SEC Public Statement, available at: https://www.sec.gov/news/public-statement/claytonremarks-investor-advisory-committee-032819
Commission Expert Group on Corporate Bonds (201 ) “Improving European Corporate Bond Markets,” available at: https://ec.europa.eu/info/sites/info/files/171120corporate-bonds-report_en.pdf
Cowen, A., B. Groysberg and P. Healy (200 ) “Which types of analyst firms are more optimistic?” Journal of Accounting and Economics, 41(1-2), pp.119-146.
Czech National Bank (201 ) “CNB Guidance,” available at: https://www.cnb.cz/export/sites/cnb/cs/legislativa/.galleries/Vestnik- CNB/2014/vestnik_2014_01_20114560.pdf
Darvas, Z. and D. Schoenmaker (201 ) “Institutional investors and home bias in Europe’s Capital Markets Union,” Bruegel Working Paper, No. 2017/02.
Derrien, F. and A. Kecskés (201 ) “The real effects of financial shocks: Evidence from exogenous changes in analyst coverage,” The Journal of Finance, 68(4), pp.1407- 1440.
Ernst & Young and Exane BNP Paribas (201 ) “MiFID2 IR Survey,” available at: https://www.ey.com/Publication/vwLUAssets/ey-MiFID2-ir-survey/$FILE/ey-MiFID2-irsurvey.pdf
Edison Investment Research (201 ) “The future of equity research,” available at: https://www.edisoninvestmentresearch.com/?ACT=19&ID=17211&dir=sectorreports&f ield=19
European Association of Independent Research Providers (2018) “Euro IRP Members Study 2018,” available at: https://euroirp.com/wp-content/uploads/2018/08/Euro-IRP- FINAL-Members-Study-Report-2018.pdf
European Association of Independent Research Providers (201 ) “Euro IRP Members Study 201 ,” available at: https://euroirp.com/wp-content/uploads/2017/10/Euro-IRP- Members-Study-Reduced-2017-Report-FINAL.pdf
European Commission (2017a) “Communication from the Commission to the European Parliament, the Council, the European Economic and Social Committee and the Committee of the Regions on the Mid-Term Review of the Capital Markets Union Action Plan,” Brussels.
European Commission (2017b) “Commission Delegated Directive (EU) 201 /5 of 7 April 2016 supplementing Directive 2014/65/EU of the European Parliament and of the Council with regard to safeguarding of financial instruments and funds belonging to clients, product governance obligations and the rules applicable to the provision or reception of fees, commissions or any monetary or non-monetary benefits,” Official Journal of the European Union.
European Commission (2017c) “Commission Delegated Regulation (EU) 2017/565 of 25 April 2016 supplementing Directive 2014/65/EU of the European Parliament and of the Council as regards organisational requirements and operating conditions for investment firms and defined terms for the purposes of that Directive,” Official Journal of the European Union.
European Commission (201 d) “MiFID II: FAQs on obtaining brokerage and research services from non-EU brokers,” available at: https://ec.europa.eu/info/files/mifid-iifaqs-obtaining-brokerage-and-research-services-non-eu-brokers_en
European Commission (2016) “Communication from the Commission to the European Parliament, the Council, the European Economic and Social Committee and the Committee of the Regions. Call for Evidence - EU regulatory framework for financial services. COM/2016/0855 final,” Brussels.
European Commission (2015) “Communication from the Commission to the European Parliament, the Council, the European Economic and Social Committee and the Committee of the Regions on Action Plan on Building a Capital Markets Union,” Brussels.
European Commission (2014) “Directive 201 / 5/EU of the European Parliament and of the Council of 15 May 2014 on markets in financial instruments and amending Directive 2002/ 2/EC and Directive 2011/ 1/EU,” Official Journal of the European Union.
European Commission (2004) “Directive 200 / /EC of the European Parliament and of the Council of 21 April 2004 on markets in financial instruments amending Council Directives 85/611/EEC and 93/6/EEC and Directive 2000/12/EC of the European Parliament and of the Council and repealing Council Directive /22/EEC,” Official Journal of the European Union.
European Securities and Markets Authority (2018) “Questions and Answers on MiFID II and MiFIR Investor Protection and Intermediaries Topics,” available at: https://www.esma.europa.eu/sites/default/files/library/esma35-43- 349_MiFID_ii_qas_on_investor_protection_topics.pdf
European Securities and Markets Authority (2017) “MiFID II: Interaction with Third Country Broker-Dealers,” available at: https://ec.europa.eu/info/files/mifid-ii-faqsobtaining-brokerage-and-research-services-non-eu-brokers_en
Fang, B., .K. Hope, Z. Huang and R. Moldovan (201 ) “The Effects of MiFID II on Sell-Side Analysts, Buy-Side Analysts, and Firms,” Rotman School of Management Working Paper, available at: https://papers.ssrn.com/sol3/papers.cfm?abstract_id=3422155
Financial Conduct Authority (201 ) “Implementing MiFID II – Multi-firm review of research unbundling reforms”, available at: https://www.fca.org.uk/publications/multifirm-reviews/implementing-mifid-ii-multi-firm-review-research-unbundling-reforms
Financial Conduct Authority (201 a) “Markets in Financial Instruments Directive II Implementation – Policy Statement I,” PS17/5, available at: https://www.fca.org.uk/publication/policy/ps17-05.pdf
Financial Conduct Authority (201 b) “Markets in Financial Instruments Directive II Implementation – Policy Statement II,” PS17/14, available at: https://www.fca.org.uk/publication/policy/ps17-14.pdf
Financial Conduct Authority (2017c) “FCA statement on MiFID II inducements and research – Speech by Andrew Bailey,” available at: https://www.fca.org.uk/news/statements/fca-statement-mifid-ii-inducements-andresearch
Financial Conduct Authority (201 ) “Discussion on the use of dealing commission regime: Feedback on our thematic supervisory review and policy debate on the market for research,” Discussion Paper, DP14/3, available at: https://www.fca.org.uk/publication/discussion/dp14-03.pdf
Foad, H.S. (200 ) “Equity home bias and the Euro,” available at: https://papers.ssrn.com/sol3/papers.cfm?abstract_id=959270
Frost Consulting “Research Payments,” available at: http://www.frostrb.com/researchpayments.php
FTSE Global Markets (201 ) “Edison and Morningstar to provide research reports for Deutsche Börse SME segment,” available at: http://www.ftseglobalmarkets.com/news/edison-and-morningstar-to-provide-researchreports-for-deutsche-borse-sme-segment.html
Galanti, S. and A.G. Vaubourg (201 ) “ ptimism bias in financial analysts' earnings forecasts: Do commissions sharing agreements reduce conflicts of interest?” Economic Modelling, 67, pp.325-337.
Green, T.C., R. Jame, S. Markov and M. Subasi (201 ) “Access to management and the informativeness of analyst research,” Journal of Financial Economics, 114(2), pp.239-255.
Guo, Y. and L. Mota, (201 ) “Unbundling and Analyst Research Production: The Impact of MiFID II,” available at: https://papers.ssrn.com/sol3/papers.cfm?abstract_id=3399506
International Capital Market Association (2018) “AMIC FICC Research Unbundling Survey results,” available at: https://www.icmagroup.org/assets/documents/Regulatory/AMIC/AMIC-FICC-Research- Unbundling-Survey-Results-2018-231118.pdf
International Capital Market Association (201 ) “AMIC FICC Research Unbundling Survey results,” available at: https://www.icmagroup.org/assets/documents/Regulatory/MiFID-Review/AMIC-FICC- Research-Unbundling-Survey-Results-081117.pdf
Lang, M.H., J. Pinto and E. Sul (201 ) “MiFID II Unbundling and Sell Side Analyst Research,” available at: https://papers.ssrn.com/sol3/papers.cfm?abstract_id=3408198
Lee, J. (2018a) “This Stock Research is Paid for by the Company. Do You Trust It?,” Bloomberg, 28 September, available at: https://www.bloomberg.com/news/articles/2018-09-28/this-stock-research-is-paidfor-by-the-company-do-you-trust-it
Lee, J. (2018b) “Can’t Finance Equity Research after MiFID? Try Crowdfunding,” Bloomberg News, 5 September, available at: https://www.bloomberg.com/news/articles/2018-09-05/can-t-get-clients-to-buyresearch-after-MiFID-try-crowdfunding
Liquidnet (2018) “Liquidnet MiFID II Research – Unbundling,” available at: https://www.scribd.com/document/370583406/Liquidnet-MiFID-II-Research- Unbundling
Maier, M. and H. Scholz (201 ) “Determinants of Home Bias: Evidence From European Equity Funds,” available at: https://papers.ssrn.com/sol3/papers.cfm?abstract_id=3354503
Maier, M. and H. Scholz (2018) “A return-based approach to identify home bias of European equity funds,” The European Journal of Finance, 24(15), pp.1288-1310.
Murphy, H. and L. Noonan (2018) “UK banks and brokers face MiFID II reckoning,” Financial Times, available at: https://www.ft.com/content/53c9d7f4-39c0-11e8-8b98- 2f31af407cc8
Murphy, H. and . Walker (2018) “MiFID reforms spur companies seeking investors to bypass brokers,” Financial Times, available at: https://www.ft.com/content/9ef5da00- 4ee9-11e8-9471-a083af05aea7
rpurt, S.F. (200 ) “Local analyst earnings forecast advantages in Europe,” available at: https://papers.ssrn.com/soL3/papers.cfm?abstract_id=515723
Peel Hunt and QCA (2018) “Unintended Consequences- Mid & Small-Cap Investor Survey,” available at: https://s3-eu-west-1.amazonaws.com/peel-huntwebsite/QCAPeel+Hunt+Mid+and+Small-Cap+Investor+Survey+2018.pdf
Peel Hunt and QCA (2019) “The search for research- Mid & Small-Cap Investor Survey,” available at: https://www.theqca.com/article_assets/articledir_356/178156/QCA- Peel_Hunt_Investor_Survey_2019_Report.pdf
Polish Financial Supervision Authority (2018) “ Stanowisko UKNF w sprawie przyjmowania i przekazywania „zachęt” w związku ze świadczeniem usług przyjmowania i przekazywania zleceń, których przedmiotem są jednostki uczestnictwa funduszy inwestycyjnych,” available at: https://www.knf.gov.pl/knf/pl/komponenty/img/Stanowisko_UKNF_ws_przyjmowania_ i_przekazywania_zach%C4%99t_64186.pdf
Pope, P.F., A.M Tamayo, and Y.H Wang (201 ) “The impact of separating research payments from dealing commissions: Evidence from Sweden,” available at: https://www.nhh.no/globalassets/departments/accounting-auditing-and-law/seminarpapers/jmp-yangwang.pdf
Risk Control (201 ) “Drivers of Corporate Bond Market Liquidity in the European Union,” European Commission Publications, available at: https://ec.europa.eu/info/sites/info/files/171120-corporate-bonds-study_en.pdf
Royal Bank of Canada Capital Markets (201 ) “RBC MiFID II Survey,” available at: https://www.rbccm.com/assets/rbccm/docs/news/2017/MiFID-ii-survey-resultsbrochure.pdf
Securities and Exchange Commission (201 ) “SEC Announces Extension of Temporary Measure to Facilitate Cross-Border Implementation of the European Union's MiFID II's Research Provisions,” available at: https://www.sec.gov/news/press-release/2019-229
Securities and Exchange Commission (2017a) “SEC Announces Measures to Facilitate Cross-Border Implementation of the European Union's MiFID II's Research Provisions,” November 26, available at: https://www.sec.gov/news/press-release/2017-200-0
Securities and Exchange Commission (2017b) “Investment Advisers Act of 1940 - Section 202(a) (11) Securities Industry and Financial Markets Association. Response of The Chief Counsel's Office Division of Investment Management,” November 2 , available at: https://www.sec.gov/divisions/investment/noaction/2017/sifma-102617- 202a.htm
Securities and Exchange Commission (2017c) “Investment Company Act of 1940 and Rule 17d-1 thereunder, and Section 206 of the Investment Advisers Act of 1940 Investment Company Institute. Response of The Chief Counsel's Office Division of Investment Management,” November 2 , available at: https://www.sec.gov/divisions/investment/noaction/2017/ici-102617-17d1.htm
Securities and Exchange Commission (2017d) “Reply to SIFMA No-Action Request – MiFID II, regarding Section 28(e) of the Securities Exchange Act of 1934 and MiFID II,” November 2 , available at: https://www.sec.gov/divisions/marketreg/mrnoaction/2017/sifma-amg-102617-28e.pdf
Securities Industry and Financial Markets Association (2019) “Staff Letter: Investment Advisers Act of 1940 - Section 202(a) (11),” available at: https://www.sec.gov/investment/sifma-110419#_ftn1
Securities Industry and Financial Markets Association (201 ) “SIFMA No-Action Request – MiFID II, regarding Section 28(e) of the Securities Exchange Act of 1934 and MiFID II,” November 25, available at: https://www.sec.gov/divisions/marketreg/mr-noaction/2017/sifma-amg-102617- 28e.pdf
Securities Industry and Financial Markets Association (1 0) “Investment Advisors Act of 1 0.”
Strong, N. and X. Xu (200 ) “Understanding the equity home bias: Evidence from survey data,” Review of Economics and Statistics, 85(2), pp.307-312.
Suh, J. (2005) “Home bias among institutional investors: a study of the Economist Quarterly Portfolio Poll,” Journal of the Japanese and international Economies, 19(1), pp.72-95.
Svirydzenka, K. (2016) "Introducing a New Broad-based Index of Financial Development," IMF Working Papers.
Tata, F. (2019a) “Explaining asset managers preference for the P&L method over RPAs when paying for research under MiFID II,” Finance Research Letters.
The Investment Association (201 ) “MiFID II Research an Industry Readiness Review,” available at: https://www.theinvestmentassociation.org/assets/files/webinars/MiFID%20II%20Rese arch%20An%20Industry%20Readiness%20Review.pdf
Van Lelyveld, I., W. F. Verschoor, and G. Rubbaniy (2010) “Home Bias and Dutch Pension Funds’ Investment Behaviour,” In 23rd Australasian Finance and Banking Conference.
Walker, . and C. Flood (2018) “MiFID II leads to exodus of sellside analysts,” Financial Times, available at: https://www.ft.com/content/1f56cf42-7550-11e8-aa31- 31da4279a601
Annex 1: Legal Survey of MiFID II Implementation
Clifford Chance has provided responses from seven of their country offices, namely from: the Czech Republic, France, Germany, Luxembourg, Poland, the Netherlands and the United Kingdom.
Czech Republic MiFID II – Research unbundling requirements
Question Response
1. Have the MiFID II requirements in The requirements regarding the "ban on respect of banning investment inducements" and "research unbundling" under managers providing portfolio MiFID II[98] have been implemented in Czech management services from receiving Republic by the Capital Market Business Act[99] in "fees, commission or any monetary a "copy out" approach. or non-monetary benefits" from a More detailed requirements stipulated in the third party relating to the service Commission Delegated Directive[100] were they are providing to clients (the so- implemented in Czech Republic by the called "ban on inducements" and Investment Services Decree[101] also in a "copy "research unbundling", Article 24 out" approach. MiFID II) been implemented in your Czech National Bank ("CNB") also provided jurisdiction? If so, has a "copy out" guidance (the "CNB Guidance[102]") regarding approach been taken to interpretation of what is an allowed implementation of those MiFID2 inducement. The guidance mostly describes requirements or has the national above mentioned provisions of the Capital regulator provided its own guidance? Market Business Act and the Investment If the latter, what are the most Services Decree. Besides that, the guidance material aspects of that guidance? gives couple of examples of minor nonmonetary benefits and elaborates on provision of an additional or higher-level service and how to proceed in doubt whether the service is additional or higher level. We attach the guidance below (please note the guidance is only in Czech language).
2. Have these MiFID II requirements Yes, the requirements have been extended to been extended in your jurisdiction to AIFMs or UCITS management companies and apply to non-MiFID regulated firms, self-managed funds when providing services of such as AIFMs or UCITS management portfolio management as a supplementary companies? activity.
3. Has "investment research" been "Investment research" has not been specifically specifically defined in your defined. However, the explanatory note to the jurisdiction in respect of the MiFID II Investment Services Decree states the following ban on inducements? If so, please regarding a research in connection with the provide the text of the definition.
MiFID II ban on inducements:
"A research should be understood as to include materials or research services which relate to one or more investment instruments or other asset or issuers or potential issuers of investment instruments or which are so closely related to an industry or a market in order to help to form an insight on investment instruments, assets or issuers in a sector. This type of material or service explicitly or implicitly recommends or proposes an investment strategy and provides justified opinion on the present or future value or price of these instruments or assets, or otherwise includes analysis and original insights and conclusions based on new or existing information which could be used to supplement information when creating an investment strategy, could be relevant and could add value to the investment firm's decision made on behalf of the customer charged for the research.
Material which is created and paid for by a corporate issuer or potential issuer in order to promote a release of a new product of a company or where a third party is contractually bound and paid by the issuer for the continuous creation of such material should be considered acceptable as a minor non-monetary benefit if publicly disclosed and made available to others.
Similarly, it may be considered as a minor nonmonetary benefit if a material or service consisting in a short-term market commentary on the latest economic statistics or company results or a material containing only a brief summary of the third party's opinion on the published information is made, where, for example, the existing opinion based on existing recommendations or research material or services is only repeated".
4. Has any regulatory guidance been Please see 3 above. Outside of this, we are not provided in your jurisdiction as to aware of any other regulatory guidance. what research material is or is not inscope of the ban on inducements? Have regulators enforced any distinctions they have made to your knowledge?
5. Has any regulatory guidance been There has not been any regulatory guidance provided in your jurisdiction as to the provided besides the CNB Guidance, which only treatment of corporate access or describes minor non-monetary benefits (which expert networks under the ban on also covers, among others, participation in inducements? If so, could you briefly conferences, seminars and other training events state what it is providing text if or hospitality of minor value offered during a feasible? business meeting or a conference, seminar or other training).
6. In respect of firms paying for Detailed requirements provided in the research, has your jurisdiction taken Commission Delegated Directive under Article a copy-out approach to the 13 have been implemented under the conditions to be satisfied by an asset Investment Services Decree in a "copy out" manager when directly paying for approach. research out of its own resources or by when using a research payment account to pay for research? If not, could you briefly explain what approach has been taken?
7. Has any regulatory guidance been Under the Investment Services Decree the provided in your jurisdiction on the provision regarding disclosure of the operational controls to be used in information basically copies Article 13 (2) of the respect of the ban on inducements Commission Delegated Directive: and paying for research (such as on "An investment firm that operates a research disclosure to clients of research payment account shall, upon request by its budgets, or review of research client or CNB, provide a summary of the material paid for)? providers paid from this account, the total amount they were paid over a defined period, the benefits and services received by the investment firm, and how the total amount spent from the account compares to the budget set by the investment firm for that period, noting any rebate or carry-over if residual funds remain in the account."
8. Are there any regulatory market or There have not been published any market or regulatory summaries in your regulatory summaries. jurisdiction in respect of whether asset managers in your jurisdiction are favouring direct payment for research or use of a research payment account? There were no specific rules regarding research
9. Prior to MiFID II were there any specific rules or requirements in your under the Capital Market Business Act prior to jurisdiction in respect of receipt or MiFID II. We are not aware of situations of use of research by an asset asset managers taking measures to reject manager? Are you aware of asset unsolicited research. managers taking measures to reject unsolicited research?
France
MiFID II – Research unbundling requirements
Question Response
1. Have the MiFID II requirements in Article 24(8) of MiFID II states the inducement respect of banning investment laws in respect of portfolio management services managers providing portfolio for third parties. This law has been implemented management services from receiving into French law through the French Financial "fees, commission or any monetary Code[103] and the [104]AMF General Regulation[105]. or non-monetary benefits" from a third party relating to the service Please note that Articles 314-18 to 314-20 of the they are providing to clients (the so- AMF General Regulation fully and substantially called "ban on inducements" and restates the provisions of the Commission "research unbundling", Article 24 Delegated Directive[106] in relation to inducements MiFID II) been implemented in your in respect of investment advice on an jurisdiction? If so, has a "copy out" independent basis or portfolio management approach been taken to services. implementation of those MiFID II requirements or has the national regulator provided its own guidance? If the latter, what are the most material aspects of that guidance?
2. Have these MiFID II requirements a. MiFID II requirements have been been extended in your jurisdiction to extended to apply to AIFMs and/or UCITS apply to non-MiFID regulated firms, management companies in the following such as AIFMs or UCITS management circumstances: companies? i. When providing investment services to clients, pursuant to article L. 532-9 VII of the Financial Code, together with article 316-2 and 321-1 of the AMF General Regulation, to the extent that AIF or UCITS management companies provide investment services, the MiFID 2 requirements, including on inducements and investment research, would apply and must be complied with. ii. When marketing shares and units of AIFs or UCITs, and pursuant to articles 421-26 (in respect of AIFs) and 411-129 (in respect of UCITS) of the AMF General Regulation, the MiFID 2 requirements related to conduct of business rules (règles de bonnes conduite) in accordance with in Commission delegated regulation (EU) no. 2017/565 of 25 April 2016 would also apply to management companies which distribute units of shares of AIFs or UCITS in France.
Insofar as AIF and UCITS management companies provide only AIFs or UCITS management services, such management companies would be subject to specific requirements in relation to inducements[107] in order to prevent any risk of conflict of interests[108] and would not be subject as such to the provisions on inducements in the context of investment research.
b. Whilst the MIFID II requirements, implemented into French law, in relation to inducements in respect of investment research would not be applicable in the context of AIFs or UCITS management, AIFs or UCITS management companies are nevertheless free to extend (it though being noted that the AMF would recommend to do so) the MIFID II provisions in relation to investment research to collective management services, provided that: (i) holders of the collective investments are clearly informed in advance; and (ii) practical arrangements comply with specific provisions of UCITS and AIF regulations relating to client information[109].
Generally speaking, it is worth noting that, in its feedback on the public consultation in relation to the MiFID II rules on the funding of investment research, the AMF
107 Requirements related to inducements applicable to AIFs or UCITS companies are set out in specific provisions of the Financial Code and the AMF General Regulation: (i) in respect of UCITS, the relevant provisions on inducements of the management company are set out in articles 321-116 of the AMF General Regulation; and (ii) the relevant provisions in relation to AIFs are set out in articles 24 of the Commission Delegated Regulation (EU) no. 231/2013 of 19 December 2012 supplementing Directive 2011/61/EU with regard to exemptions, general operating conditions, depositaries, leverage, transparency and supervision. 108 Please refer to article L. 533-10 of the Financial Code. 109 Please refer to the AMF Guide on new rules for the funding of research within MiFID II, published on 17 January 2018, p. 7.
clearly stated that it did not intend to go beyond the requirements of MiFID II, which would otherwise amount to goldplating of European rules[110].
Quite interestingly, out of a pool of 18 French asset management companies which responded to the MifidVision survey conducted, notably, by the French Association française de la gestion financière ("AFG"), 16 management companies have indicated that they have applied MiFID II requirements in relation to investment research in the context of collective management services[111].
3. Has "investment research" been Article 314-21 of the AMF General Regulation specifically defined in your sets out a specific definition of "research", as jurisdiction in respect of the MiFID2 follows: ban on inducements? If so, please provide the text of the definition. "In this paragraph, “research” means research material or services concerning:
1° one or several financial instruments or other assets; or 2° the issuers or potential issuers of financial instruments; or 3° a specific industry or market; such that it informs views on financial instruments, assets or issuers within that sector or market.
That type of material or services:
1° explicitly or implicitly recommends or suggests an investment strategy and provides a substantiated opinion as to the present or future value or price of such instruments or assets; or
2° contains analysis and original insights and reaches conclusions based on new or existing information that could be used to inform an investment strategy and be relevant and capable of adding value to the decisions by the investment services provider on behalf of clients being charged for that research"[112].
4. Has any regulatory guidance been Yes. Building upon the recitals of the Commission provided in your jurisdiction as to Delegated Directive, ESMA Q&A and article 314what research material is or is not in- 21 of the AMF General Regulation, the AMF has scope of the ban on inducements? provided some guidance in relation to what type
Have regulators enforced any of research material is in scope of the "ban on distinctions they have made to your inducements"[113]. Such guidance notably knowledge? elaborates on the notion of "non-substantive material or services", the characterisation of research material, etc. We are not aware of any sanction decision having been delivered by competent courts or regulatory authorities specifically referring to such guidance or distinguishing in-scope and out of scope research materials.
5. Has any regulatory guidance been Yes. Building upon the recitals of the Commission provided in your jurisdiction as to the Delegated Directive and ESMA Q&A, the AMF has treatment of corporate access or provided some guidance in relation to corporate expert networks under the ban on access[114]. inducements? If so, could you briefly state what it is providing text if Such guidance notably states, without purporting feasible? to be exhaustive, that, if the corporate access is similar to a purely "concierge" service, consisting of the mere physical setting up of a meeting, it does not meet the definition of research within the meaning of recital no. 28 of the Commission Delegated Directive, to the extent that it does not explicitly or implicitly recommend or suggest an investment strategy or provide a substantiated opinion as to the present or future value or price of instruments or assets. However, services of an intellectual nature may be included in the research budget, unless the research consumer decides to assume these costs from its own resources.
6. In respect of firms paying for Articles 314-21 to 314-29 of the AMF General research, has your jurisdiction taken Regulation fully and substantially restate the a copy-out approach to the provisions of article 13 of the Commission conditions to be satisfied by an asset Delegated Directive on inducements in relation to manager when directly paying for investment research. research out of its own resources or by when using a research payment account to pay for research? If not, could you briefly explain what approach has been taken?
7. Has any regulatory guidance been Yes. Building upon the recitals of the Commission provided in your jurisdiction on the Delegated Directive, ESMA Q&A and, in operational controls to be used in particular, article 314-26 of the AMF General respect of the ban on inducements Regulation, the AMF has provided some guidance and paying for research (such as on in relation to the operation of the research disclosure to clients of research budget[115]. budgets, or review of research material paid for)? The AMF has therefore notably specified that a research consumer must determine and monitor the overall research budget (and revise such budget, from time to time, where necessary), and further stated that the client must be informed regularly by the research consumer with respect to the research costs incurred in light of the agreed research budget (such information notifications including ex-ante, expost and additional information at the request of the client).
8. Are there any regulatory market or It should first be noted that the AMF, in its public regulatory summaries in your consultation on MiFID II requirements in respect jurisdiction in respect of whether of funding of investment research, asked for asset managers in your jurisdiction feedback on the two possible types of research are favouring direct payment for payment accounts ("RPA") (i.e. the simple RPA research or use of a research model[116] and the RPA model based on a payment account? commission sharing agreement ("CSA")[117]). It is worth noting that respondents to the said AMF public consultation generally (and in particular from the buy-side, i.e. consumers of research) reacted positively to the proposed two types of research payment account and in particular appreciated the flexibility fund managers will have in selecting the type of account[118]. Some concerns were however raised as to the operational burden of such RPAs[119].
However, it is worth noting that, out of the pool of 18 management companies interviewed as part of MifidVision survey, 9 management companies have opted for financing research on their profit and loss account ("P&L"), i.e. through direct payment of research, and not via a RPA (the type of RPA retained being different from one asset manager to the other depending notably on their respective size), in particular because the investor information requirements and process linked to the RPA model is burdensome and entails important operational constraints[120].
Some asset managers have however opted for a mixed model for the financing of research. By way of example, we understand that Groupama Asset Management has opted for a RPA for equity-related research, whereas it chose to finance directly other types of research, notably in respect of credits, rates, etc[121]. Similarly, we understand that, whilst the Banque Postale Asset Management ("LBPAM") opted, as a matter of principle, for the RPA model[122], its research financing policy also enables LBPAM to pay directly for research for commercial, contractual or technical reasons[123].
9. Prior to MiFID 2 were there any Prior to MiFID II, there was no specific provision specific rules or requirements in your under French law with respect to inducements in jurisdiction in respect of receipt or relation to investment research. Pursuant to use of research by an asset MiFID II, the French legal framework on manager? Are you aware of asset inducements and funding of investment research managers taking measures to reject has been enhanced, notably in relation to unsolicited research? portfolio management (to the exclusion of collective portfolio management) and investment advice provided on an independent basis.
In this context, it is worth noting that the AFG and the French Association française des marchés financiers ("AMAFI") jointly published on 9 November 2017 a template of a convention for the provisions of investment research services in order to provide guidance to asset managers as to the possible way to contractualise their relationship to ensure compliance with MiFID II requirements.
Schedule 1: AMF guide on the new rules[124] governing the funding of research by investment service providers under MiFID II, January 2018.
Germany
MiFID II – Research unbundling requirements
Question Response
1. Have the MiFID II requirements in Whereas there are differences in the wording of respect of banning investment the respective provisions, the German regulator managers providing portfolio claims to have implemented MiFID2 on a one to management services from receiving one basis into German law. We are not aware of "fees, commission or any monetary any further guidance by BaFin or Bundesbank. or non-monetary benefits" from a For details please see items 3 to 7 below. third party relating to the service they are providing to clients (the socalled "ban on inducements" and "research unbundling", Article 24 MiFID II) been implemented in your jurisdiction? If so, has a "copy out" approach been taken to implementation of those MiFID II requirements or has the national regulator provided its own guidance? If the latter, what are the most material aspects of that guidance?
2. Have these MiFID II requirements Pursuant to section 5 para 2 of the Capital been extended in your jurisdiction to Investment Code (Kapitalanlagegesetzbuch, apply to non-MiFID regulated firms, "KAGB"), certain MiFID II requirements, such as AIFMs or UCITS management including the inducements requirement which companies? include the requirements on ban on inducements and research unbundling, apply if the AIFM or UCITS management company undertake financial portfolio management.
3. Has "investment research" been Whereas the German Securities Trading Act specifically defined in your (Wertpapierhandelsgesetz, "WpHG") has jurisdiction in respect of the MiFID II implemented the MiFID II provisions on ban on inducements? If so, please inducements also with regard to "research" provide the text of the definition. (Analyse), there is no specific definition of the term under German law.
However, Article 36 para 1 Regulation (EU) 2017/565, which is directly applicable in Germany provides that investment research is:
"research or other information recommending or suggesting an investment strategy, explicitly or implicitly, concerning one or several financial instruments or the issuers of financial instruments, including any opinion as to the present or future value or price of such instruments, intended for distribution channels or for the public, and in relation to which the following conditions are met
(a) the research or information is labelled or described as investment research or in similar terms, or is otherwise presented as an objective or independent explanation of the matters contained in the recommendation;
(b) if the recommendation in question were made by an investment firm to a client, it would not constitute the provision of investment advice for the purposes of Directive 2014/65/EU."
Pursuant to Article 36 para 2 Regulation (EU) 2017/565 a recommendation pursuant to Article 3 para 1 no. 35 MAR which does not meet the conditions set out in Article 36 para 1 above is to be treated as a marketing communication and investment firms that produce or disseminate that recommendation must ensure that it is clearly identified as such.
In addition, for undertakings, which do not fall within the scope of Articles 36 et seq. Regulation (EU) 2017/565, section 85 WpHG refers to investment recommendations (Article 3 para 1 no. 35 Regulation (EU) No 596/2014 ("MAR")) and information recommending or suggesting an investment strategy (Article 3 para 1 no. 34 MAR), which in our view are to be construed as investment research.[125]
4. Has any regulatory guidance been To our knowledge there is no further guidance provided in your jurisdiction as to by BaFin on research materials and we are not what research material is or is not in- aware of any enforcement actions which have scope of the ban on inducements? made any distinctions. Have regulators enforced any distinctions they have made to your knowledge?
5. Has any regulatory guidance been There is no guidance by BaFin. However, BaFin provided in your jurisdiction as to the follows guidance given by the ESAs unless treatment of corporate access or expressly stated otherwise. We are not aware of expert networks under the ban on any such statement by the BaFin with respect inducements? If so, could you briefly to corporate access under the ban on state what it is providing text if inducements.[126] In Q7 of the ESMA Q&As, last feasible? updated on 28 March 2019,[127] the service of a third party arranging meetings with the management of a corporate issuer for an investment firm (‘corporate access’) does not constitute providing material or services which "explicitly or implicitly recommend or suggest an investment strategy and provide a substantiated opinion as to the present or future value or price of such instruments or assets" and therefore, does not constitute research. However, ESMA expects investment firms to carefully assess whether corporate access services such as field trips, conferences and individual meetings involving a corporate issuer and facilitated by an investment firm are material benefits, or alternatively could qualify as an acceptable minor non-monetary benefit.
We are not aware of any guidance as regards "expert networks". However, we understand that "expert networks" mean connecting investors with subject-matter experts for background conversations. As mentioned above, arranging a meeting itself is not providing research. However, all circumstances of the activity must be assessed to ensure that no material non-monetary benefits or even investment brokerage are provided.
6. In respect of firms paying for Whereas the wording of the German provisions research, has your jurisdiction taken and the provisions of the Delegated Directive a copy-out approach to the are not identical, the German legislator claims conditions to be satisfied by an asset to have implemented the provisions one by one. manager when directly paying for research out of its own resources or Section 70 para 2 WpHG has implemented by when using a research payment Article 13 para 1 Delegated Directive (EU) account to pay for research? If not, 2017/593 and section 70 para 3 WpHG has could you briefly explain what implemented Article 13 para 2 sentence 1 approach has been taken? Delegated Directive (EU) 2017/593. Section 7 para 1 sentence 1 German Investment Services Conduct of Business and Organisation Regulation (Wertpapierdienstleistungs- Verhaltens- und Organisationsverordnung, "WpDVerOV") implements Article 13 para 2 sentence 2 Delegated Directive (EU) 2017/593 and section 7 para 1 sentence 2 and 3 WpDVerOV implement Article 13 para 3 and para 4 Delegated Directive (EU) 2017/593. Section 7 para 2 and 3 WpDVerOV implement Article 13 para 5 Delegated Directive (EU) 2017/593. Section 7 para 4 and para 5 WpDVerOV implement Article 13 para 6. Section 7 para 6 implements Article 13 para 7. Section 7 para 7 and section 70 para 2 sentence 4 WpHG implement Article 13 para 8. Section 70 para 6
WpHG implements Article 13 para 9.
7. Has any regulatory guidance been Besides the requirements set out in item 6 and provided in your jurisdiction on the the additional organisational requirements operational controls to be used in under Article 37 Regulation (EU) 2017/565, the respect of the ban on inducements record-keeping obligations for inducements and paying for research (such as on under item BT 10.1 of BaFin Circular 5/2018 – disclosure to clients of research Minimum requirements for the Compliance budgets, or review of research Function and Additional Requirements material paid for)? Governing Rules of Conduct, Organisation and Transparency under Sections 63ff. of the Securities Trading Act (MaComp)[128] must be complied with.[129]
8. Are there any regulatory market or We are not aware of any such information. regulatory summaries in your jurisdiction in respect of whether asset managers in your jurisdiction are favouring direct payment for research or use of a research payment account?
Before MiFID II was implemented into German
9. Prior to MiFID II were there any specific rules or requirements in your law, inducements were covered by section 31d jurisdiction in respect of receipt or WpHG. Financial research (Finanzanalysen) was use of research by an asset considered to be a non-monetary manager? Are you aware of asset inducement.[130] Section 31d WpHG was designed managers taking measures to reject to mitigate conflicts of interests and provided unsolicited research? for organizational and disclosure requirements. Section 31 WpHG is partially reflected by the wording of section 70 WpHG. However, the new provisions implementing MiFID2 are more detailed and provide for further requirement, as described above.
We are not aware that there have been any statements to reject unsolicited research.
Luxembourg
MiFID II – Research unbundling requirements
Question Response
1. Have the MiFID II requirements in MiFID II was implemented in Luxembourg by respect of banning investment the law of 30 May 2018 on markets in financial managers providing portfolio instruments (the "MiFID2 Law"). management services from receiving "fees, commission or any monetary The Luxembourg legislator has faithfully or non-monetary benefits" from a implemented the wording of Article 24 MiFID II. third party relating to the service The provision in question has been they are providing to clients (the so- implemented into Article 37-3 of the FSL[131]. called "ban on inducements" and "research unbundling", Article 24 MiFID II) been implemented in your jurisdiction? If so, has a "copy out" approach been taken to implementation of those MiFID2 requirements or has the national regulator provided its own guidance? If the latter, what are the most material aspects of that guidance?
2. Have these MiFID II requirements We have assumed that the reference above to been extended in your jurisdiction to MiFID II regulated firms shall include credit apply to non-MiFID regulated firms, institutions when providing investment services such as AIFMs or UCITS management or activities[132] and we have therefore not companies? discussed this point further herein, but confirm that the Article 24 MiFID II rules as implemented do not extend to other credit institution activities, over and above to what is required by MiFID II in this respect.
a) Luxembourg UCITS ManCos/AIFMs are not themselves directly subject to MiFID II and are therefore not directly subject to MiFID II inducement rules. Indeed, an exemption is expressly provided for investment funds and their managers by MiFID II. It is correct that there have been discussions in the Fund Industry and that ESMA has also recommended reflecting the MiFID II inducement requirements in the UCITS Directive and AIFMD in order to ensure a level playing field between MiFID entities, UCITS ManCos and AIFMs. However, for the time being, the UCITS Directive and the AIFMD do not reflect nor extend to UCITS ManCos/AIFMs the inducements rules introduced by MiFID II. To the same extent, the Luxembourg UCI Law of 17 December 2010 and AIFM Law of 12 July 2013 have not been amended so far to introduce and/or impose MiFID II inducements rules on Luxembourg UCITS ManCos/AIFMs.
1. Consequently, for the time being in Luxembourg, the rules governing the payment and receipt of inducements by Luxembourg UCITS ManCos/AIFMs providing collective portfolio management activities are those UCITS/AIFMD inducements rules contained in article 32 of CSSF Regulation 10-04 for UCITS ManCos and article 24 of AIFMD.[133]
b) Notwithstanding the above, Luxembourg UCITS ManCos/AIFMs may be indirectly impacted by the new MiFID II inducements restrictions if: i. These Luxembourg UCITS ManCos/AIFMs use MiFID firms for the provision of MiFID services (e.g. distributor, portfolio manager, etc.). Indeed, depending on the type of services provided by the relevant MiFID firms, such payments vis-à-vis these MiFID firms may be prohibited. Thus, for example, if a MiFID firm is acting as independent adviser and/or provides discretionary portfolio management services, it may no longer accept and retain fees, commissions monetary and/or non-monetary benefits for these services under MiFID II; or if such MiFID firm receives such fees, commissions monetary and/or non-monetary benefits, it will be obliged to transfer them to its clients (this MiFID II inducement rule is generally referred to as the "inducements ban"). MiFID II also specifies that the receipt of research materials by a MiFID firm providing portfolio management or other investment or ancillary services must be regarded as an inducement, and it is therefore subject to the new inducement restrictions introduced by MiFID II. Accordingly, a MiFID firm may only receive research if it is received in exchange for either of the following: (i) direct payments by the MiFID firm out of its own resources, or (ii) payments from a separate research payment account controlled by the MiFID firm and subject to specific conditions.
2. As you know, the MiFID II ban on inducements has an indirect impact, among others, on the distribution models for investment funds. In particular, MiFID firms providing independent investment advice or discretionary portfolio management services to investment funds can no longer be compensated for their services by investment funds and/or their ManCos/AIFMs, for example via kickbacks or retrocessions. These MiFID firms need to change their business models and derive their income from their end clients under the form of advisory fees. These firms therefore require "clean" share classes, i.e. with an unbundled fee model and no distribution fees. ii. These Luxembourg UCITS ManCos/AIFMs provide additional MiFID services (socalled Top-up MIFID licence) as mentioned in article 6 (3) a) and b) of the UCITS Directive respectively article 6 (4) a) and
b) of the AIFMD. In this case, they must comply with certain MiFID II requirements, including MiFID II inducement rules.
Indeed, considering that articles 13 and 19 of MiFID I[134] correspond to articles 16 and 24 of MiFID II that has repealed and replaced MiFID I, it may be concluded that MiFID II inducement rules apply to these UCITS ManCos/AIFMs providing additional MiFID services. This is also the position of the CSSF in paragraph 560 of Circular 18/698 concerning the substance and organisational requirements applicable to Luxembourg UCITS ManCos/AIFMs and which indicates that Luxembourg UCITS ManCos/AIFMs providing additional MiFID services must comply, among other things, with the MiFID II inducement rules contained in article 37-3 of the FSL[135].
3. Has "investment research" been No. Investment research (recherche en specifically defined in your investissements) has been listed in Annex II, jurisdiction in respect of the MiFID II section C, of the FSL (which implements Annex ban on inducements? If so, please I of MiFID II), but no further definition is provide the text of the definition. provided under Luxembourg law.
4. Has any regulatory guidance been The related parliamentary documents provide provided in your jurisdiction as to no further specification with regard to the exact what research material is or is not in- scope of the ban on inducement, and we are scope of the ban on inducements? not aware (to the best of our knowledge) of Have regulators enforced any official administrative positions in Luxembourg distinctions they have made to your (notably from the Luxembourg financial sector knowledge? supervisory authority, the Commission de Surveillance du Secteur Financier, ("CSSF")) providing further specification. From our experience, the CSSF would normally apply ESMA/EU Commission Q&A positions on EU level, if any (which we have not separately checked). We are not aware of specific CSSF enforcement action undertaken so in this area.
5. Has any regulatory guidance been The related parliamentary documents provide provided in your jurisdiction as to the no further specification with regard to the exact treatment of corporate access or scope of the ban on inducement, and we are expert networks under the ban on not aware (to the best of our knowledge) of inducements? If so, could you briefly official administrative positions in Luxembourg state what it is providing text if (notably from the CSSF) providing further feasible? specification. From our experience, the CSSF would normally apply ESMA/EU Commission Q&A positions on EU level, if any (which we have not separately checked).
6. In respect of firms paying for The Luxembourg legislator has faithfully research, has your jurisdiction taken implemented the wording of Article 13 of a copy-out approach to the Commission delegated directive (EU) 2017/593 conditions to be satisfied by an asset of 7 April 2016 supplementing MiFID II with manager when directly paying for regard to safeguarding of financial instruments research out of its own resources or and funds belonging to clients, product by when using a research payment governance obligations and the rules applicable account to pay for research? If not, to the provision or reception of fees, could you briefly explain what commissions or any monetary or non-monetary approach has been taken? benefits. The provision in question has been implemented by Article 12 of the GDR 2018. Pursuant to Article 12 GDR 2018, research by third parties are not regarded as inducements if it is received in return to:
a) Direct payments by the credit institution or the investment firm out of its own resources;
b) Payments from a separate research payment account controlled by the credit institution or the investment firm, provided the following conditions relating to the operation of the account are met: i. The research payment account is funded by a specific research charge to the client; ii. As part of establishing a research payment account and agreeing the research charge with their clients, the credit institution or the investment firm sets and regularly assesses a research budget as an internal administrative measure; iii. The credit institution or the investment firm is held responsible for the research payment account; iv. The credit institution or the investment firm regularly assesses the quality of the research purchased based on robust quality criteria and its ability to contribute to better investment decisions.
7. Has any regulatory guidance been The related parliamentary documents provide provided in your jurisdiction on the no further specification with regard to the operational controls to be used in operational controls to be used in respect of the respect of the ban on inducements ban on inducements and paying for research, and paying for research (such as on and we are not aware (to the best of our disclosure to clients of research knowledge) of official administrative positions in budgets, or review of research Luxembourg (notably from the CSSF) providing material paid for)? further specification. From our experience, the CSSF would normally apply ESMA/EU Commission Q&A positions on EU level, if any (which we have not separately checked).
8. Are there any regulatory markets or We are not aware of any such summaries. regulatory summaries in your However, please find enclosed hereto a general jurisdiction in respect of whether Q&A published by ALFI on the impact of MiFID asset managers in your jurisdiction II for investment funds. are favouring direct payment for research or use of a research payment account?
9. Prior to MiFID II were there any We are not aware of any specific rules or specific rules or requirements in your requirements in Luxembourg in respect of jurisdiction in respect of receipt or receipt or use of research by an asset manager use of research by an asset prior to the implementation of MiFID2, nor are manager? Are you aware of asset we aware of asset managers taking measures managers taking measures to reject to reject unsolicited research. unsolicited research?
Poland
MiFID II – Research unbundling requirements
Question Response
1. Have the MiFID II requirements in Yes, the MiFID2 requirements in respect of respect of banning investment banning investment managers providing managers providing portfolio portfolio management services from receiving management services from receiving "fees, commission or any monetary or non- "fees, commission or any monetary monetary benefits" from a third party relating or non-monetary benefits" from a to the service they are providing to clients (the third party relating to the service so-called "ban on inducements" and "research they are providing to clients (the so- unbundling", Article 24 MiFID II) have been called "ban on inducements" and implemented in Poland. Generally, a "copy out" "research unbundling", Article 24 approach had been taken to implement hose MiFID II) been implemented in your MiFID II requirements. The national supervisory jurisdiction? If so, has a "copy out" authority provided its guidance[136] related to approach been taken to inducements in the context of reception and implementation of those MiFID2 transmission of orders related to units/shares in requirements or has the national investment funds. regulator provided its own guidance? If the latter, what are the most material aspects of that guidance?
2. Have these MiFID II requirements The ban on inducements applies also to entities been extended in your jurisdiction to established/domiciled in Poland which distribute apply to non-MiFID regulated firms, units/shares in investment funds and which are such as AIFMs or UCITS management not the fund management company of a given companies? investment fund, other fund investment companies which provide the service of reception and transmission of orders with respect to units/shares in investment funds, investment firms and banks authorised to provide the service of reception and transmission of orders.
The ban on inducements applies to an investment fund company (towarzystwo funduszy inwestycyjnych) that extended the scope of its activity to asset management, investment advice or reception and transmission of orders. (The ban on iducements also applies to other investment fund companies subject to Article 24 of Regulation 231/2013.)
3. Has "investment research" been Yes, investment research has been defined in specifically defined in your Poland in respect of the MiFID II ban on jurisdiction in respect of the MiFID II inducements and the definition is as follows: ban on inducements? If so, please "Research services – analytical actions with the provide the text of the definition. objective of creating documents and other analytical materials related to one or more financial instruments, assets or asset, issuers or potential issuers of financial instruments which could be grounds for developing an opinion on the financial instrument, its issuer, the sector or market, and which contain, in particular, direct or indirect recommendations or suggestions regarding investment strategies, an assessment of the current or future value of a financial instrument or asset, or observations and conclusions based on existing or new information that could be used when developing an investment strategy and could be material when making investment decisions".
4. Has any regulatory guidance been We are not aware of any regulatory guidance provided in your jurisdiction as to provided in Poland as to what research material what research material is or is not inis or is not in-scope of the ban on inducements, scope of the ban on inducements? nor are we aware of any enforcement actions Have regulators enforced any which have made any distinctions. distinctions they have made to your knowledge?
5. Has any regulatory guidance been We are not aware of any regulatory guidance provided in your jurisdiction as to the provided in Poland as to the treatment of treatment of corporate access or corporate access or expert networks under the expert networks under the ban on ban on inducements. inducements? If so, could you briefly state what it is providing text if feasible?
6. In respect of firms paying for Yes, in respect of firms paying for research, research, has your jurisdiction taken Poland has taken a copy-out approach to the a copy-out approach to the conditions a firm must satisfy when directly conditions to be satisfied by an asset paying for research out of its own resources or manager when directly paying for when using a research payment account to pay research out of its own resources or for research. by when using a research payment account to pay for research? If not, could you briefly explain what approach has been taken?
7. Has any regulatory guidance been Certain aspects related to operational controls provided in your jurisdiction on the are covered in the guidance related to operational controls to be used in inducements in the context of receipt and respect of the ban on inducements transmission of orders related to units/shares in and paying for research (such as on investment funds. For example, pursuant to the disclosure to clients of research guidance, the fund management company budgets, or review of research should verify how proceeds from inducements material paid for)? are spent by the distributors and such verification cannot rely on the distributors' statements only but must to be based on accounting documents. The amount of inducements in respect of additional services or quality-enhancement services provided by distributors may not be specified only by the possibility itself of clients' or potential clients' using this type of accessory services of the distributor, if the possibility is abstract, i.e. is not supported by appropriate analyses and monitoring of the level of use of services. The client of a relevant distributor should have the opportunity to decide to use or give up using the additional services or quality-enhancement services that the distributor is offering it.
8. Are there any regulatory market or We are not aware of any such market or regulatory summaries in your regulatory summaries. jurisdiction in respect of whether asset managers in your jurisdiction are favouring direct payment for research or use of a research payment account?
9. Prior to MiFID II were there any Prior to MiFID II, there were no specific rules or specific rules or requirements in your requirements in Poland in respect of receipt or jurisdiction in respect of receipt or use of research by an asset manager. use of research by an asset We are not aware of statements rejecting manager? Are you aware of asset unsolicited research.
managers taking measures to reject unsolicited research?
The Netherlands MiFID II – Research unbundling requirements
Question Response
1. Have the MiFID II requirements in The Netherlands have taken a copy out respect of banning investment approach in respect of the ban on inducements managers providing portfolio and research unbundling in the context of management services from receiving service provision to professional clients. There "fees, commission or any monetary is therefore no Netherlands specific guidance. or non-monetary benefits" from a This is different in respect of service provision third party relating to the service to retail clients but understand that this does they are providing to clients (the so- not need to be discussed herein. called "ban on inducements" and "research unbundling", Article 24 MiFID II) been implemented in your jurisdiction? If so, has a "copy out" approach been taken to implementation of those MiFID2 requirements or has the national regulator provided its own guidance? If the latter, what are the most material aspects of that guidance?
2. Have these MiFID II requirements Yes, to the extent that they provide MiFID been extended in your jurisdiction to services. apply to non-MiFID regulated firms, such as AIFMs or UCITS management companies?
3. Has "investment research" been No. The Netherlands implementation of MiFID II specifically defined in your simply refers to article 13 of the Delegated jurisdiction in respect of the MiFID II Directive. ban on inducements? If so, please provide the text of the definition. No. Dutch guidance simply refers back to article
4. Has any regulatory guidance been provided in your jurisdiction as to 13 of the Delegated Directive. what research material is or is not inscope of the ban on inducements? Have regulators enforced any distinctions they have made to your knowledge?
5. Has any regulatory guidance been No. provided in your jurisdiction as to the treatment of corporate access or expert networks under the ban on inducements? If so, could you briefly state what it is providing text if feasible?
6. In respect of firms paying for Yes. research, has your jurisdiction taken a copy-out approach to the conditions to be satisfied by an asset manager when directly paying for research out of its own resources or by when using a research payment account to pay for research? If not, could you briefly explain what approach has been taken?
7. Has any regulatory guidance been No. provided in your jurisdiction on the operational controls to be used in respect of the ban on inducements and paying for research (such as on disclosure to clients of research budgets, or review of research material paid for)?
8. Are there any regulatory market or No. That is most likely due to the fact that most regulatory summaries in your Dutch asset managers have decided not to jurisdiction in respect of whether charge for research anymore, and have instead asset managers in your jurisdiction absorbed the costs themselves. are favouring direct payment for research or use of a research payment account?
9. Prior to MiFID II were there any Prior to MiFID II, research was also regarded as specific rules or requirements in your an inducement in the Netherlands and therefore jurisdiction in respect of receipt or fell under the inducement prohibition as it use of research by an asset applied at the time. Prior to MiFID II, the manager? Are you aware of asset Netherlands had an inducement ban in the managers taking measures to reject context of service provision to retail clients (not unsolicited research? in relation to professional clients) and it was explicitly stated by the regulator at the time that research was also to be regarded as an inducement.
Further to MiFID II, we are aware of Dutch asset managers having entered into specific research agreements with parties from whom they want to receive research, and having written to others that they do not wish to receive research anymore.
The United Kingdom
MiFID II – Research unbundling requirements
Question Response
1. Have the MiFID II requirements in The United Kingdom transposed the MIFID II respect of banning investment requirements in respect of a ban on managers providing portfolio inducements and research unbundling for firms management services from receiving providing portfolio management services to "fees, commission or any monetary professional clients through a 'copy out' or non-monetary benefits" from a approach, implemented in the UK by new rules third party relating to the service in the Financial Conduct Authority's (FCA) they are providing to clients (the so- Conduct of Business Sourcebook (COBS), called "ban on inducements" and primarily in COBS 2.3A and COBS 2.3B. "research unbundling", Article 24 MiFID II) been implemented in your jurisdiction? If so, has a "copy out" approach been taken to implementation of those MiFID2 requirements or has the national regulator provided its own guidance? If the latter, what are the most material aspects of that guidance?
2. Have these MiFID II requirements Yes, these MiFID II requirements have been been extended in your jurisdiction to extended to non-MiFID firms carrying out apply to non-MiFID regulated firms, collective portfolio management including fullsuch as AIFMs or UCITS management scope UK AIFMs and incoming EEA AIFM companies? branches[137], most small authorised UK AIFMs and residual CIS operators[138] and UCITS management companies[139].
3. Has "investment research" been FCA Handbook's definition of "research" derives specifically defined in your from recital 28 of the Commission Delegated jurisdiction in respect of the MiFID II Directive (EU) 2017/593 being: ban on inducements? If so, please provide the text of the definition. research material or services:
(1) concerning one or several financial instruments or other assets; or
(2) concerning the issuers or potential issuers of financial instruments; or
(3) closely related to a specific industry or market such that it informs views on financial instruments, assets or issuers within that sector,
and which explicitly or implicitly recommends or suggests an investment strategy and provides a substantiated opinion as to the present or future value or price of such instruments or assets, or otherwise contains analysis and original insights and reaches conclusions based on new or existing information that could be used to inform an investment strategy or be capable of adding value to a firm’s decisions on behalf of clients.
4. Has any regulatory guidance been The following materials, among others, are provided in your jurisdiction as to stipulated to be acceptable minor non-monetary what research material is or is not in- benefits (and, hence, may not be research): scope of the ban on inducements? Have regulators enforced any COBS 2.3.A.19R: distinctions they have made to your written material from a third party that is knowledge? commissioned and paid for by a corporate issuer or potential issuer to promote a new issuance by the company, or where the third party firm is contractually engaged and paid by the issuer to produce such material on an ongoing basis, provided that the relationship is clearly disclosed in the material and that the material is made available at the same time to any firms wishing to receive it, or to the general public; and
COBS 2.3A.22: non-substantive material or services consisting of short term market commentary on the latest economic statistics or company results or information on upcoming releases or events which are provided by a third party and which:
(1) contain only a brief unsubstantiated summary of the third party’s own opinion on the information; and
(2) do not include any substantive analysis (e.g. where the third party simply reiterates a view based on an existing recommendation or substantive research).
COBS 2.3B.23G also sets out the following examples of goods or services that the FCA does not regard as research:
• Post-trade analytics.
• Price feeds or historical price data that have not been analysed or manipulated in order to present the firm with meaningful conclusions.
• Services relating to the valuation or performance measurement of portfolios.
• Seminar fees.
• Corporate access services.
• Subscriptions for publications.
• Travel, accommodation or entertainment costs.
• Order and execution management systems.
• Membership fees to professional associations.
• Direct money payments.
• Administration of an RPA.
We are not aware of the FCA enforcing the distinctions they have made in this respect.
5. Has any regulatory guidance been Subject to the aformentioned list of services provided in your jurisdiction as to the listed in COBS 2.3B.23G not constituting treatment of corporate access or research, including corporate access, the FCA expert networks under the ban on has not provided any other guidance in this inducements? If so, could you briefly respect. state what it is providing text if feasible?
6. In respect of firms paying for Yes. research, has your jurisdiction taken a copy-out approach to the conditions to be satisfied by an asset manager when directly paying for research out of its own resources or by when using a research payment account to pay for research? If not, could you briefly explain what approach has been taken?
7. Has any regulatory guidance been In COBS 2.3B, the FCA sets out detailed provided in your jurisdiction on the conditions and requirements relating to how a operational controls to be used in research payment account needs to be operated respect of the ban on inducements by a firm. These derive from Article 13 of the and paying for research (such as on Commission Delegated Directive (EU) disclosure to clients of research 2017/593. We set out some of the conditions budgets, or review of research and requirements below. material paid for)?
These include that a firm must set and regularly assess a research budget as an internal administrative measure as part of establishing a research payment account and agreeing the research charge with its clients (in accordance with COBS 2.3B.4R(2)(a)) and that a firm must regularly assess the quality of the research purchased, based on robust quality criteria, and its ability to contribute to better investment decisions for the clients who pay the research charge (in accordance with COBS 2.3B.4R(4)).
COBS 2.3B.9 specifies that information on increases in the research budget (under COBS 2.3B.8R(2)) should be provided to relevant clients in good time before such increases are to take effect.
COBS 2.3.B11 to COBS 2.3.B16 deal with governance and oversight of research payment accounts, stipulating that a firm must ensure that:
(1) the research budget is managed solely by the firm and is based on a reasonable assessment of the need for third party research; and
(2) the allocation of the research budget to purchase third party research is subject to appropriate controls and senior management oversight to ensure it is managed and used in the best interests of the firm’s clients.
The controls under (2) include a clear audit trail of (i) payments made to research providers; and (ii) how the amounts paid were determined with reference to the quality criteria (COBS 2.3B.4R(4)) and the firm’s policy for using third party research (COBS 2.3B.12).
COBS 2.3B.20 references article 13(2) of the Commission Delegated Directive (EU) 2017/593, outlining that:
(1) Where a firm operates a research payment account, it must provide on request to its clients a summary of:
(a) the providers paid from this account;
(b) the total amount they were paid over a defined period;
(c) the benefits and services received by the firm; and
(d) how the total amount spent from the account compares to the budget set by the firm for that period, noting any rebate or carry-over if residual funds remain in the account.
(2) A firm must also be able to provide the information in paragraph (1) to the FCA on request for all research payment accounts.
8. Are there any regulatory market or A survey published by the CFA Institute regulatory summaries in your indicates that the majority of the firms jurisdiction in respect of whether surveyed absorb the research costs and charge asset managers in your jurisdiction these to the firm's P&L, with between 65% and are favouring direct payment for 84% of the firms doing so depending on the research or use of a research AUM size category.[140] payment account? In a keynote speech on MIFID II, Andrew Bailey, the Chief Executive of the FCA, further indicated that the vast majority of traditional asset managers now fund research from their own revenues instead of using their clients’ funds.[141]
FCA's multi-firm review of research unbundling reforms found that most buy-side firms in the UK have chosen to absorb research costs themselves.[142]
9. Prior to MiFID II were there any The FSA (FCA's predecessor) previously specific rules or requirements in your implemented dealing commission rules as part jurisdiction in respect of receipt or of COBS 11.6. These were designed to ensure use of research by an asset that investment managers control the costs manager? Are you aware of asset from the use of dealing commission managers taking measures to reject appropriately, and ensure that the goods and unsolicited research? services acquired in return for commissions meet the FSA's rules and are in the best interests of investment managers' customers.
We are not aware of asset managers taking measures to reject unsolicited research. https://www.cfainstitute.org/-/media/documents/survey/cfa-mifid-II-surveyreport.ashx Providers Association'. https://www.fca.org.uk/news/speeches/andrew-bailey-keynotespeech-mifid-ii-european-independent-research-providers-association 142 FCA 'Implementing MiFID II – multi-firm review of research unbundling reforms' https://www.fca.org.uk/publications/multi-firm-reviews/implementing-mifid-ii-multifirm-review-research-unbundling-reforms
Annex 2: Survey
Methodology The surveys on investigating the impact of MiFID II regulations on investment research consist of four different sets of questions, each targeting respondents from four different categories of market participant: buy-side, sell-side, issuer and IRP (Independent Research Provider). The surveys for buy-side, sell-side and issuer were launched on 30th April, 2019, while the one for IRPs commenced on 31st May, 2019.
The surveys were hosted on the website of Risk Control Limited by JavaScript embedding, providing both online and off-line options to answer the corresponding answers. The online versions were built utilising the services supported by SurveyGizmo. The version employed included advanced features such as question logic branching and data validation. These features aim to reduce ambiguities as far as participants are concerned and, hence, to increase the quality of the resulting survey data.
For the off-line versions, respondents could choose freely to prepare their responses by filling out a PDF or a Word file. This was important as for many participants, multiple sign off was required for an organisation to submit a set of question responses. Before the official launch, the surveys were widely tested among Risk Control staff to ensure logical correctness. They were also tested on different operating systems including Windows, iOS and macOS, and using different browsers including IE, Chrome, Safari, Firefox and Edge.
By 7th August, 2019, the numbers of responses for the four surveys are 55 for buy side, 41 for sell side, 55 from issuers and 14 for the IRP survey. The buy-side respondents were almost all asset managers with only a very few hedge funds, pension funds and private banks. Buy-side respondents were domiciled in over ten European countries. The sell-side survey collected data from banks and investment banks of different sizes, and non-bank brokers, domiciled both in Europe and North America.
Due to the sensitivity of the data, Risk Control Limited ensured all responses were treated as anonymous, strictly limited access to the data, and maintained tight data security policies. For example, to prevent identity leaks during the data analysis stage, company names, IP addresses, email addresses were filtered out. The domiciles of the respondents were mapped to larger regions instead of countries in order to prevent possible reverse identification due to being a major or only player in the country.
The data analyses of the answers collected from the survey were conducted using Python and widely-accepted open source packages such as Numpy and Pandas for data manipulation, and Matplotlib, Seaborn and Plotly for figures.
Buy-Side Survey Respondent Description Figure A2.1 shows the distribution of the buy-side respondents by the domicile of the firm and the parent firm. The majority of respondents (56%) are domiciled in Western Europe. A smaller percentage (24%) are domiciled in Northern Europe, followed by Southern Europe (13%). Only 4% of the buy-side respondents are domiciled in Eastern Europe.
Western Europe also dominates as the domicile of the parent firm at 25%. This is followed by Northern Europe at 15%. A small fraction of parent firms is domiciled in
Southern Europe (5%) and Eastern Europe (2%). Additionally, 4% of the buy-side parent firms are domiciled in North America.
Figure A2.1: Domicile of Buy-Side Firm vs Parent Firm
Note: The figure above corresponds to questions no. & : ‘In which country is your firm domiciled?’ and ‘If your firm is domiciled in the EU and is a subsidiary of another firm, what is the domicile of your firm's parent?’
Figure A2.2 shows that only a small fraction (18%) of the buy-side respondents that are domiciled in the EU are a subsidiary of firms domiciled outside the EU.
Figure A2.2: Buy-Side Firm Subsidiary Outside EU
Note: The figure above corresponds to question no.5 from the buy-side survey: ‘If your firm is domiciled in the EU, is it a subsidiary of a firm domiciled outside the EU?’
Figure A2.3 shows the distribution of the buy-side respondents by the AUM of their firm and group.
Figure A2.3 Buy-Side Assets under Management (EUR, billions)
0% Firm
Group of firm
0%
20%
10%
0%
Note: The figure above corresponds to question no. 11: ‘What is the size of your firm’s Assets under Management (AUM)?’
Sell-Side Survey Respondent Description Figure A2.4 shows the domicile of the sell-side firms that provide investment research.
Figure A2.4: Domicile of Sell-Side Research Providers
Note: The first panel corresponds to question no. : ‘In which country or region is your firm domiciled?’ The second panel corresponds to question no.5: ‘If, post Brexit, your group plans to provide research on European securities from firms domiciled in multiple countries, where will they be domiciled?’
The sell-side respondents are mostly domiciled in Western Europe (39%). This is closely followed by Northern Europe (34%) and Southern Europe (20%). Only a small fraction (2%) of the sell-side research providers are domiciled in Eastern Europe. A similar small fraction (9%) of respondents are domiciled in North America. On research coverage, majority of the respondents provide European securities research for firms in Western Europe (45%) and Northern Europe (34%). In contrast only 9% of the sellside research providers cover securities Southern Europe and 2% cover Eastern Europe.
Figure A2.5 shows the survey results describing the respondent firm size. Most of the respondents (29%) are a large bank or investment bank, global bank or investment bank (24%) or mid-sized or small bank (22%). Fewer respondents identify themselves as global non-bank brokers (10%) or other brokers (15%). A large majority of the respondents (76%) have significant bond or equity underwriting or placing activities in the EU. More than half of the respondents (56%) have more than 10,000 employees across their group.
Figure A2.5: Sell-Side Group Employees
Note: The top panel corresponds to question no.11: ‘Which of the following best describes the group of companies within which your firm is a member?’ The bottom left panel to question no.12: ‘Does your firm have significant equity or bond underwriting or placing activities in the EU?’ The bottom right to question no.1 : ‘How many employees work in the group of companies within which your firm is a member?’
Figure A2.6 shows the results on the results of the sell-side survey on their revenue compositions. 26% of the sell-side respondents attributed between 1 and 5 million EUR of their revenue to EU equity and credit research activities in 2018. This is followed by firms whose revenue from such activities was between 5 and 20 million EUR (18%) and less than 1 million EUR (15%). Additionally, for about a fourth of the sell-side firms the fraction of revenue coming from bundled charging was less than 7.5%.
Figure A2.6: Sell-Side Question on Revenue Fraction
Note: The two panels correspond to question no. : ‘What are the total worldwide revenues generated directly by your firm's EU Equity and Credit-related research in 2018?’ and ‘What fraction of these revenues do you estimate come from bundled charging?’
Issuer Survey Respondent Description Figure A2.7: Domicile of Issuer Firm and Main Listing Exchange
Note: The figure above corresponds to questions no. 3, 4, 5 & : ‘In which country is your firm domiciled?’, ‘Please state the country in which your firm is domiciled’, ‘In which exchange is your company's main listing?’ and ‘Please specify the exchange in which your company is mainly listed’.
Figure A2.7 shows the domiciles of issuer firms and their main listing exchange. Most of the firms are domiciled in Western Europe (56%) and this is closely followed by Northern Europe at 40%. Additionally, Euronext (51%) and Deutsche Börse (36%) dominate as the main listing exchanges of the issuer respondents.
Figure A2.8 describes the characteristics of the issuer respondents of the survey. A large majority (87%) of the issuer respondents were first listed more than five years ago. Additionally, 29% of the respondents have market capitalization between 1 to 5 billion EUR, this is followed by a fourth of the firms that have market cap between 200 million EUR and 1 billion EUR. A large majority of the firms (78%) use lines of credits to finance their activities and about a half make use of other loans (50%) and syndicated loans (48%) also. Only 41% of the respondents finance their activities through equity issuance.
Figure A2.8: Issuer Respondent Firm Characteristics
Note: The top left panel corresponds to question no. : ‘When was your company first listed?’ The top right panel to no.8: ‘What is the market capitalization of your firm?’ The bottom panel corresponds to question no. : ‘How do you finance your activities?’
IRP Survey Respondent Description Figure A2.9 shows the domicile and area of research of the respondent IRPs. Most of the respondent IRPs are domiciled in Western Europe (57%), followed by North America (36%) and Southern Europe (7%).
Additionally, half of the IRP respondents cover large and mid-cap equities, 36% cover macroeconomics, 29% cover SME equities and 21% cover credit securities.
Figure A2.9: IRP Domicile and Area of Research
Note: The top panel corresponds to question no. ‘In which country or region is your firm domiciled?’ The bottom panel corresponds to question no. 8 ‘ n which areas of research do you focus? Choose one or more of the following options: i) Macroeconomics ii) Credit iii) Large and Mid Cap Equities iv) SME Equities v) Analytics & Trading strategies vi) Commodities, and vii) thers’.
Annex 3: Other Surveys
This Annex describes existing survey studies of the impact of the MiFID II provisions pertaining to investment research. The surveys vary considerably in the nature of the respondents and the types of questions asked but the approaches employed provide useful background to the survey exercise that we have conducted as part of this project.
In ctober 201 , ICMA’s Asset Management and Investors Council (AMIC) conducted a survey of its members firms on the state of implementation of MiFID II in the context of research unbundling. After the new regulations became effective in January 2018, the AMIC conducted another survey in December 2018 including more questions on the progress, changes and issues due to the new rules on research unbundling. Another set of the surveys is the 2019 and 2018 surveys by Peel Hunt and Quoted Companies Alliance (QCA) of a group of investors including the ones that invest in mid and small cap companies on the impact of MiFID II.
Other surveys of the buy-side include the surveys conducted by the CFA Institute (2017 and 2018) and The Investment Association (TIA) in 2017 focussing on research cost, pricing and budgets. Another set of interesting surveys is by the European Association of Independent Research Providers (Euro IRP) where it surveyed its members in 2017 and 2018 on the state and challenges involved in research pricing. Another is the 2017 survey by EY and Exane BNP Paribas where a group of investor relation professionals was surveyed in order to understand the effect of MiFID II on corporates. Table A3.1 summarises the existing surveys.
Table A3.1: Surveys on impact of MiFID II Survey Countries Number Respondent Topics included types ICMA UK (20%), - 62% asset Rules awareness, State
(2017) Germany managers or of compliance, (13%), investment Guidance from Netherlands funds, 31% regulator, Research (13%), Italy private banks, payment method, (10%), 3% pension Changes in research Switzerland funds, 6% spend, Changes in the (10%), other investors number of research France (7%), providers, Research Austria consumption trends, (3%), Expectations on quality Belgium of research, Impact on (3%), fund performance from Cyprus using lesser research (3%), providers, In-house Denmark research, Impact on (3%), non-EU firms. Liechtenstein (3%), Luxembourg (3%), Norway (3%), Sweden (3%), US
(3%)
ICMA UK (39%), 28 93% asset Deciding what is
(2018) Germany managers or research, Guidance (21%), investment from regulator, Written Other funds; and 7% contracts in place with countries in private banks research providers, the EU stopping unsolicited (11%), research, Payment for France research, Preferred (11%), type of research Switzerland consumption, Trends in (7%), the consumption of Netherlands research, Establishing (4%), the value of research, US/Canada Number and quality of (4%), Rest research providers, Inof the world house research, (4%) Availability and breadth of SME research, Investor roadshows, Approach to conflicting rules on non-EU research Peel UK Telephone 92% manage Impact on the market, Hunt interview of equity funds Volume and quality of and QCA 11 fund research on SMEs,
(2018) managers Amount of research by payments, Number of telephone broking houses and and Online broker interactions, survey of Differentiation of 100 UK- independent and nonbased fund independent research, managers. Quality and value of research paid for by companies, Liquidity of UK mid and small-cap stocks, Publishing the research providers. Peel UK 102 fund UK fund Impact on volume of Hunt managers managers and report on small and and QCA and 105 UK quoted mid-caps, Quality of
(2019) issuers small and Mid research, Liquidity of Cap issuers small and mid-cap stocks, Access to research, Research coverage, Corporate access, Status of payment method, Payment budget, Actions taken by companies to increase visibility.
CFA UK (39%), 365 Investment Cost of research, Institute Germany respondents management Impact on research
(2017) (11%), from 330 firm managing sourced from different Switzerland firms pooled funds types of research (9%), and/or providers, Analyst France segregated access, impact on (5%), mandates aggregate costs by Netherlands (70%), firm size, primary (4%), Insurance investment practice, Others in company or Impact on research Europe pension fund payments for firms (39%) (11%), Hedge outside of Europe. fund (7%), Family office (5%), Others (5%), Private equity fund (1%), Endowment (1%) and Sovereign wealth fund (0%) CFA Survey is 496 Buy-side Survey results are Institute distributed respondents (68%), sell-side compared with 2017
(2019) to EU and from 449 (20%) and result in the following Switzerland CFA others aspect: Payment companies. members method, Impact on Responds IRPs, Consumption of from 25 sell-side research, countries Research quality, are Research budget, received. Research coverage, Number of sell-side analysts, Market transparency Euro IRP UK, North 46 Independent Research pricing,
(2017) America, Research paying for credit Continental Providers research, Business Europe models and structures of IRPs, Research payment methods, Distribution platforms, Sell side pricing.
Euro IRP UK, 49 Independent Regulator action on
(2018) Continental research research pricing, Europe, providers Research pricing North trends, Pricing for America, different types of Asia services, Credit research payment methods, buy-side interactions and demands, Provision of trading ideas and recommendations, Impact of MiFID II on new business, renewal rates and vote-based revenues, Impact on IRP business and business structure, Distribution platforms Exane UK (23%), 330 Investor Impact of MiFID II, BNP France European relations Cost of IR activities, Paribas (20%), Investor professional Number of analysts, and EY Germany relations majorly from Quality of research,
(2017) (16%), professional large cap Interaction with Nordics s companies. analysts, Research (9%), distribution and Benelux consumption, (8%), Italy Specialist sales (7%), Spain contents, Clarity and (6%), visibility of market Switzerland expectations, (5%), Corporate access Others (6%) Liquidnet Global - Asset Order flow, State of
(2018) management research unbundling, firms Paying for Research, identifying what is Research, Research payment methods. RBC UK, 380 buy-side Long-only, Payment mechanism, Capital Mainland professionals hedge funds Best execution and Markets Europe, changes to the
(2017) North execution process, America, Changes to number of Global execution and advisory providers, Compliance of current payment methods, Compliance if a global firm, Impact on US funds, Research budget trends, Research pricing menus, Corporate access, Specialised/unique research
TIA Spain, 562 Portfolio Awareness and
(2017) Switzerland respondents Manager, sufficient clarity of the , UK, from over Analyst, new rules on research Germany, 450 Business unbundling and state France, investment Manager, of compliance, Impact Scandinavia firms Other, on research , Italy, Compliance, consumption, Benelux Broker Challenges for Relations compliance, Contact from different types of research providers about pricing, Research payment method, Research budge trend, Number of research providers trend, Impact on US funds.
Annex 4: Survey Questions
Introduction
This Annex lists questions asked in the surveys distributed to buy-side companies, sellside companies, issuers and independent research providers. Terms and definitions described in Annex 7 were presented to participants at the beginning of each survey.
Buy-side survey questions
1. What is the name of your firm?
2. Please provide a contact email address.
3. In which country is your firm domiciled?
4. Please specify the country in which your firm is domiciled.
5. If your firm is domiciled in the EU, is it a subsidiary of a firm domiciled outside the EU?
6. If your firm is domiciled in the EU and is a subsidiary of another firm, what is the domicile of your firm's parent?
7. Please specify the domicile of your firm's parent.
8. If your firm is domiciled outside the EU, does your firm have authorised European subsidiaries providing investment services to clients in the EU?
9. If your firm is domiciled in the EU, does it have one or more authorised subsidiaries outside the EU?
10. If you are not domiciled in EU, do you trade financial products through EU trading venues, or service EU clients directly / indirectly via sub-advisory agreements with EU firms that are subject to MiFID II?
11. What is the size of your firm’s Assets under Management (AUM)?
12. What is the size of the Assets under Management (AUM) of the group of companies to which your firm belongs?
13. In which of the following asset classes do your funds invest?
14. If you invest in SME (Small/Micro/Nano Cap) Equities, do you have specialised funds designated as such for this purpose?
15. If you invest in High-yield bonds, do you have specialised funds designated as such for this purpose?
16. Which of the following best describes your firm?
17. Does your firm have a Research Department?
18. Which areas of research are the most important for your business?
19. By your estimate, how much were your firm's research budgets in 2017, and how did research budgets evolve in 2018 and 2019?
20. How have the MiFID II unbundling rules induced your firm to change its own overall research activity?
21. What is the number of internal researchers within your firm for Large and Mid Cap Equities, SME Equities and Credit?
22. What is the percentage change in the number of internal researchers within your firm since January 2018 for Large and Mid Cap Equities, SME Equities and Credit?
23. Is the change in the number of your firm's internal research analysts since January 2018 above or below trend for Large and Mid Cap Equities, SME Equities and Credit?
24. In your view, has the all-in cost of external research changed since January 2018 in the cases of Large and Mid Cap Equity research, SME Equity research and Credit research?
25. In your view, is comparable research offered by IRPs more or less expensive than that of brokers in the three cases: Large and Mid Cap Equities, SME Equities and Credit research?
26. In your view, is the all-in cost of comparable research from EU brokers more or less than the all-in cost of research from US brokers in the three cases for Large and Mid Cap Equities, SME Equities and Credit?
27. In your view, is Equity research for EU SMEs more or less costly than for US SMEs?
28. Which factors influence the relative cost across the two jurisdictions?
29. In your view, has the administrative burden of obtaining external research changed since January 2018 in the three cases of Large and Mid Cap Equities, SME Equities and Credit?
30. Have MiFID II inducement rules resulted in a change in the execution cost of trading for SME Equities?
31. Have MiFID II inducement rules resulted in a change in execution spreads for Credit securities?
32. How does your firm pay for research currently and how did it pay before MiFID II?
33. Which of the following considerations has influenced your choice post MiFID II?
34. Is the choice between P&L and RPAs likely to affect the total cost to clients (including both direct and indirect charges)?
35. If you have adopted the P&L method, have you adjusted your fees accordingly?
36. If your firm pays for external research via RPA, how is the cost allocated between funds?
37. Has your firm written guidelines for research cost allocation?
38. Have you received sufficient guidance from your national regulators and ESMA on the application of the new rules?
39. Does your firm have written contracts and agreements in place with your research providers?
40. Has your firm taken any steps to stop receiving any unsolicited research?
41. What steps has your firm taken?
42. Has the level of your firm's participation in investor roadshows changed since January 2018?
43. Does your firm find it challenging to distinguish which Corporate Access activities should be paid for and which are Minor Non-Monetary Benefits (MNMB)?
44. Where does your firm apply the MiFID II rules on external research?
45. How many investment research providers do you currently use overall and how many are brokers/independent providers/other entities within your own group?
46. How many investment research providers do you currently use for Large and Mid Cap Equities and how many are brokers/independent providers/other entities within your own group? Same question prior to the introduction of MiFID II in January 2018?
47. How many investment research providers do you currently use for SME Equities (Small/Micro/Nano Caps) and how many are brokers/independent providers/other entities within your own group? Same question prior to the introduction of MiFID II in January 2018?
48. How many investment research providers do you currently use for Credit and how many are brokers/independent providers/other entities within your own group? Same question prior to the introduction of MiFID II in January 2018?
49. Have MiFID II rules led you to change your consumption of research from Online Research Marketplaces (ORMs)?
50. Have MiFID II rules led you to change your consumption of research from Broker Platforms?
51. Of your current research providers, how many are domiciled in the EU?
52. Of the research providers you employed before January 2018, how many were domiciled in the EU?
53. Has MiFID II encouraged the emergence of new research providers for SME Equities (Small/Micro/Nano Cap) research?
54. Which organisations have provided additional research for SME Equities?
55. Has MiFID II encouraged the emergence of new research providers for Credit research?
56. Which organisations have provided additional Credit research?
57. Which methods do you use to assess the value of research and what is their relative importance in your overall assessment?
58. Has the quantity of research that your firm consumes on (i) Large and Mid Cap Equity, (ii) SME Equity and (iii) Credit changed since January 2018?
59. Has the quality of (i) Large and Mid Cap Equity, (ii) SME Equity and (iii) Credit research changed since January 2018?
60. How have the following influences on SME Equity research quality evolved since January 2018?
61. How have the following influences on Credit research quality evolved since January 2018?
62. Overall, would you say that the MiFID II research unbundling rules have changed your access to research on EU SME Equities?
63. If you answered "Rules have increased access" or "Rules have reduced access", did this affect your investments in EU Small and Micro Caps?
64. If you answered "Rules have increased access" or "Rules have reduced access", did this affect the performance of your funds?
65. Overall, would you say that MiFID II research unbundling rules have changed your access to research on EU Credit?
66. If you answered "Rules have increased access" or "Rules have reduced access", did this affect your investments in EU Credit?
67. If you answered "Rules have increased access" or "Rules have reduced access", did this affect the performance of your funds?
Sell-side survey questions
1. What is the name of your firm?
2. Please provide a contact email address.
3. In which country or region is your firm domiciled?
4. Please specify the country in which your firm is domiciled.
5. If, post Brexit, your group plans to provide research on European securities from firms domiciled in multiple countries, where will they be domiciled?
6. If your firm is domiciled in the EU, is it a subsidiary of a firm domiciled outside the EU?
7. If your firm is domiciled in the EU and is a subsidiary of a firm domiciled outside the EU, what is the domicile of your firm's parent?
8. Please specify the domicile of your firm's parent.
9. If your firm is domiciled outside the EU, does your firm have authorised European affiliates providing investment services to clients in the EU?
10. If your firm is domiciled in the EU, does it have one or more authorised subsidiaries outside the EU?
11. Which of the following best describes the group of companies within which your firm is a member?
12. Does your firm have significant equity or bond underwriting or placing activities in the EU?
13. How many employees work in the group of companies within which your firm is a member?
14. Where is the Global Head of Research for your group of companies located?
15. On which areas of research do you focus?
16. How many internal equity research analysts are employed in your organisation
(i) globally, and (ii) in the EU?
17. What was the percentage change in the number of internal equity research analysts in your organisation from 2017 to 2019: (i) Globally? (ii) In the EU?
18. How many internal credit research analysts are employed in your organisation
(i) Globally? (ii) In the EU?
19. What was the percentage change in the number of internal credit research analysts in your organisation from 2017 to 2019 (i) Globally? (ii) In the EU?
20. Please estimate the number of European SME firms (Small/Micro/Nano Caps) covered by your firm's research.
21. Please estimate how the number of European SME firms covered by your firm's research has changed since January 2018?
22. In the EU, since the introduction of MiFID II, how has the cost of producing research evolved in your organization Overall? For Large and Mid Caps? For SMEs? For Credit?
23. Is the quality of your research a selling point for your underwriting/securities issuance activities (if you have them)?
24. Could you provide a "guesstimate" of the allocation of the costs that your firm incurs in producing research (in a broad sense) between: your buy-side customers, your underwriting/securities issuance activities (if any), your internal needs and other?
25. Prior to January 2018, what factors influenced how you granted access to your research to your clients?
26. What factors influence the terms on which you grant access to your research to your clients currently?
27. How has the number of customers accessing your research evolved since January 2018?
28. In your view, for buy-side firms, how has the introduction of MiFID II affected the availability of research on Large and Mid Cap Equities, SME Equities and Credit?
29. In your view, for buy-side firms, which factors have influenced changes in the availability of research for Large and Mid Cap Equities, SME Equities and Credit?
30. Has your firm reduced the extent to which it contributes earnings forecasts to aggregators?
31. In your view, how has MiFID II affected the usefulness of consensus forecasts?
32. Has MiFID II changed the number of Independent Research Providers for Large and Mid Cap Equities, SME Equities and Credit?
33. Has MiFID II changed the amount of sponsored research for Large and Mid Cap Equities, SME Equities and Credit?
34. How do you currently charge for access to research for clients (i) subject to MiFID II rules and (ii) not subject to MiFID II rules?
35. What is the minimum yearly price for accessing your research?
36. What are the total worldwide revenues generated directly by your firm's EU Equity and Credit-related research in 2018?
37. In your view, across the market, do sell-side firms tend to under-price research?
38. If so, do you expect the charges for research across the industry to increase over time?
39. How has the number of buy-side customers for which you deal in SME (Small/Micro/Nano Cap) equities changed since January 2018?
40. In your view, have MiFID II inducement rules affected transactions costs for SME (Small/Micro/Nano Cap) equities (by affecting either commissions or prices)?
41. How has the number of customers for which you deal in Credit securities evolved since January 2018?
42. In your view, have MiFID II inducement rules affected execution spreads for Credit securities?
43. In your view, is SME equity research more expensive in the US or EU?
44. Which factors drive the relative cost of SME equity research in the EU and US?
45. Does your firm organise road shows for corporates?
46. If you answered "yes", does it charge either (i) corporates or (ii) investors for this service?
47. Does your firm organise investor meetings for corporates?
48. If you answered "yes", does it charge either (i) corporates or (ii) investors for this service?
49. Do you perceive that corporates are organising their own investor relations activities more than before January 2018?
50. In your view, has MiFID II affected the amount of sponsored research on for (i) Large and Mid Cap Equity, (ii) SME Equity and (iii) Credit?
51. In your view, have the MiFID II inducement rules reduced the direct access that investors have to information about SME companies (via investor-management contacts, for example)?
52. In your view, have the MiFID II rules on research affected the ability of EU SME firms' to access equity market funding?
53. In your view, have the MiFID II rules on research affected the secondary market liquidity of SME equities in the EU?
54. In your view, have the MiFID II rules on research affected EU firms' access to corporate bond markets?
55. In your view, have the MiFID II rules on research affected the liquidity of EU corporate bonds?
Issuer survey questions
1. What is the name of your firm?
2. Please provide a contact email address.
3. In which country is your firm domiciled?
4. Please state the country in which your firm is domiciled.
5. In which exchange is your company's main listing?
6. Please specify the exchange in which your company is mainly listed.
7. When was your company first listed?
8. What is the market capitalization of your firm?
9. How do you finance your activities?
10. How many times have you issued bonds in the last five years or in 2018?
11. Are you expected to issue bonds in the next two years?
12. What are the main criteria for selecting lead managers for your bond issuances?
13. How many times have you issued equities either (i) in the last 10 years, or (ii) in 2018?
14. Are you expected to issue equities in the next two years?
15. What will be the main criteria for selecting lead managers for your issuances?
16. In your opinion, what was the impact of MiFID II rules on research unbundling on the liquidity of your firm's shares?
17. Overall, would you say that your access to equity or bond financing has changed between 2017 and 2019?
18. What factors have influenced your access to equity or bond financing positively or negatively over this period?
19. What types of financial institutions provide research on your firm?
20. Overall, please estimate how many institutions are likely to provide research on your firm in 2019.
21. Please estimate how many institutions provided research on your firm in 2017.
22. Over the next 3 years, how do you expect the number of institutions providing research on your firm to change?
23. Have you noticed the emergence of new Independent Research Providers (IRPs) covering your firm?
24. Do financial institutions covering your firm report on the number of investors accessing their research on your firm?
25. Between 2017 and 2019, what has happened to the number of investors accessing research on your firm as reported by financial institutions covering your firm?
26. How many analysts have had access to your firm's management in 2018?
27. What criteria were applied in determining which analysts had access to your management?
28. With the introduction of MiFID II, how would you say the number of analysts with access to your management has evolved?
29. Has there been a change in the number of news articles mentioning your company that you believe is attributable to changes in research coverage of your firm?
30. After MiFID II, have you increased the information about your company that is available through your website?
31. If "Yes", what motivated this change?
32. Some observers predicted that company research would become more concentrated with MiFID II and that a few leading analysts would have a larger role shaping the consensus. Would you agree with this statement in relation to your firm?
33. How has the quality of investment research on your firm evolved since the introduction of MiFID II?
34. What do you expect to happen to the quality of investment research related to your firm over the next three years?
35. If new Independent Research Providers (IRPs) covering your firm have emerged, has this affected the quality of this research?
36. Is the quality of investment research on your firm a significant influence on your cost of issuing securities?
37. Since January 2018, has your firm changed the degree to which it sponsors any research on your firm?
38. Do you intend to sponsor more research on your firm in the future?
39. How many staff are employed in your Investor Relations department?
40. Has the size of your Investor Relations department changed between 2017 and 2019?
41. Has the cost of the Investor Relations function changed between 2017 and 2019?
42. How many brokers do you use for corporate access?
43. How has this number evolved between 2017 and 2019?
44. Has MiFID II changed the level of corporate access for your firm?
45. Is MiFID II likely to increase your reliance on roadshows to build your investor base?
46. Has MiFID II affected your use of brokers to organize roadshows on your behalf?
47. Which factors influence how you select brokers to organize roadshows?
48. Since MiFID II, have you been charged by brokers to cover some of the costs of organizing roadshows?
49. Since MiFID II, have you increased your participation in conferences?
50. Has your company increased its direct engagement with investors since MiFID II?
51. Overall, since MiFID II, how do you consider your knowledge of your investor base has changed?
52. In your opinion, for SME (Small/Micro/Nano Cap) issuers in general, how has MiFID II affected coverage and visibility?
53. In your opinion, for SME issuers in general, how has MiFID II impacted the liquidity of their shares?
54. In your opinion, for SME issuers in general, how has MiFID II affected their cost of equity financing?
55. In your opinion, for corporate bond issuer in general, how has MiFID II affected coverage and visibility?
56. In your opinion, for corporate bond issuers in general, how has MiFID II affected the liquidity of their bond issues?
57. In your opinion, for corporate bond issuers in general, how has MiFID II affected the cost of issuing bonds?
IRP survey questions
1. What is the name of your firm?
2. Please provide a contact email address.
3. In which country is your firm domiciled?
4. Please specify the country in which your firm is domiciled.
5. If your firm is domiciled in the EU, is it a subsidiary of a firm domiciled outside the EU?
6. If your firm is domiciled in the EU, does it have one or more authorised subsidiaries outside the EU?
7. How many employees work in your firm?
8. On which areas of research do you focus?
9. How many research analysts are employed in your organisation (i) globally, and
(ii) in the EU?
10. What was the change in the number of research analysts in your organisation from 2017 to 2019 globally and in the EU?
11. Have you observed a "juniorization" or "seniorization" trend within your analyst staff since entry into force of MiFID II?
12. If you have observed a trend within your analyst staff, what is the percentage of senior analysts to total analysts before and after MiFID II?
13. Do you provide (equity- or credit-related) firm level research?
14. How many equity research analysts are employed in your organisation (i) globally, and (ii) in the EU?
15. What was the change in the number of equity research analysts in your organisation from 2017 to 2019 globally and in the EU?
16. How many credit research analysts are employed in your organisation globally and in the EU?
17. What was the change in the number of credit research analysts in your organisation from 2017 to 2019 globally and in the EU?
18. Please estimate the number of European SME firms (Small/Micro/Nano Caps) covered by your firm's research.
19. Please estimate how the number of European SME firms covered by your firm's research has changed since January 2018?
20. Please estimate the number of European Large and Mid Cap firms covered by your firm's research.
21. Please estimate how the number of European Large and Mid Cap firms covered by your firm's research has changed since January 2018?
22. Please estimate the number of European Credit products covered by your firm's research.
23. Please estimate how the number of European Credit products covered by your firm's research has changed since January 2018?
24. Does your firm provide company level sponsored research?
25. If your firm has provided company level sponsored research since 2017, what was the percentage change in turnover related to this activity from 2017 to 2018?
26. How has the number of customers accessing your research evolved since January 2018?
27. Has your firm increased its use of Online Research Marketplaces (ORMs) to disseminate research since January 2018?
28. In your view, how has the introduction of MiFID II affected your production of research?
29. In your view, for buy-side firms, which factors have influenced changes in the availability of research for 1) Large and Mid Cap Equities; 2) SME Equities; and 3) Credit?
30. In your view, how has MiFID II affected the usefulness of consensus forecasts?
31. Has your firm reduced the extent to which it contributes earnings forecasts to aggregators?
32. Has MiFID II changed the number of Independent Research Providers for
33. Has MiFID II changed the amount of sponsored research for 1) Large and Mid Cap Equities; 2) SME Equities; and 3) Credit?
34. Have your clients put more efforts in evaluating the quality of research since January 2018?
35. Have you changed your price to adapt to MiFID II?
36. How do you currently charge for access to research for clients (i) subject to MiFID II rules and (ii) not subject to MiFID II rules?
37. What is the minimum yearly price for accessing your research on credit and equity?
38. What are the total worldwide revenues generated directly by your firm's EU Equity and Credit-related research in 2018? How has your revenue generated through sales of research evolved since January 2018?
39. In your view, across the market, do brokers tend to under-price research?
40. If so, do you expect the charges for research across the industry to increase over time?
Annex 5: Country Fiches
Data Description
This Annex provides country specific market condition indicators as well as report coverage statistics in a longitudinal dimension. It consists of 28 fiches covering all EU countries. Country fiches adopt the uniform presentational structure of three tables and eight figures.
The first table in a fiche calculates coverage indicators for each company size group and year out of I/B/E/S Earning per Share (EPS) forecast data. The second table calculates percentage year-on-year changes of indicators in the first table. Both tables supplement Tables 2.6 and 2.8 in Section 2 by providing indicator values for every EU country. The third table in a fiche shows descriptive statistics of earning per share forecast errors. It extends Table 5.1 in Section 5 by providing statistics for every EU country.
Figure (a) shows outstanding amounts of listed shares and non-government debt securities by domestic issuers, respectively. Data is obtained from ECB Statistical Data Warehouse. Non-government debt securities amount is calculated by taking the difference between total debt securities outstanding and amount outstanding of debt securities issued by general government entities.
Figure (b) shows yearly common equity issuance amount and common equities issued in Initial Public Offering (IPO) activities. Figure (c) displays amount and number of corporate bond issuance in yearly frequency. Data for both figures is also from Bloomberg.
Figures (d), (e), (f), (g) and (h) are based on equity universe obtained from Eikon from Refinitiv search function. Equities are filtered by following conditions:
1. The IPO date of the company is before 1 January 2015.
2. The company’s primary equity is still active on 1 February 201 .
3. The issuing company is registered in EU countries.
We categorize companies by their market capitalization using the definitions below. Maintaining static company groups over time, we base the categorization exercise on companies’ market capitalization at the end of 2018.
1. Nano: market capitalization under 50 million EUR.
2. Micro: market capitalization between 50 million EUR and 200 million EUR.
3. Small: market capitalization between 200 million EUR and 1 billion EUR.
4. Non-SME: market capitalization above 1 billion EUR.
The number of companies satisfying the above conditions are displayed in Figure (f). Figures (d) and (e) are respectively daily transaction volume and bid-ask spread averaged over calendar months. Daily historical data for both figures is obtained from Eikon from Refinitiv. The bid-ask spread is calculated as:
ask−bid Spread = (ask+bid)/2 × 100. (A5.1)
Figures (g) and (h) are average number of forecast reports and number of brokers covering each company over monthly periods. EPS forecast report and broker data are obtained from I/B/E/S. Consistent with all of our statistical studies, we keep our company sample and broker sample fixed throughout the period.
Austria Table A5.1: Coverage Indicators
Nano Micro
2015 2016 2017 2018 2015 2016 2017 2018 Coverage (%) 5.88 5.88 5.88 5.88 23.08 23.08 30.77 23.08 Reports per company 0.24 0.35 0.41 0.94 4.23 5.15 5.38 3.23 Reports per covered company 4.00 6.00 7.00 16.00 18.33 22.33 17.50 14.00 Brokers per company 0.06 0.06 0.06 0.06 0.54 0.69 0.69 0.46 Companies per broker 0.02 0.02 0.02 0.02 0.12 0.15 0.15 0.10
Small Non-SME
2015 2016 2017 2018 2015 2016 2017 2018 Coverage (%) 71.43 71.43 71.43 64.29 88.46 88.46 88.46 88.46 Reports per company 38.93 31.14 31.36 22.50 110.15 100.73 98.46 91.58 Reports per covered company 54.50 43.60 43.90 35.00 124.52 113.87 111.30 103.52 Brokers per company 4.64 3.86 3.79 3.14 10.35 9.85 9.42 8.69 Companies per broker 1.10 0.92 0.90 0.75 4.56 4.34 4.15 3.83
Table A5.2: Changes in Coverage Indicators (Percent) Nano Micro
2016 2017 2018 2016 2017 2018 Coverage 0.00 0.00 0.00 0.00 33.33 -25.00 Reports per company 50.00 16.67 128.57 21.82 4.48 -40.00 Reports per covered company 50.00 16.67 128.57 21.82 -21.64 -20.00 Brokers per company 0.00 0.00 0.00 28.57 0.00 -33.33 Companies per broker 0.00 0.00 0.00 28.57 0.00 -33.33
Small Non-SME
2016 2017 2018 2016 2017 2018 Coverage 0.00 0.00 -10.00 0.00 0.00 0.00 Reports per company -20.00 0.69 -28.25 -8.55 -2.25 -6.99 Reports per covered company -20.00 0.69 -20.27 -8.55 -2.25 -6.99 Brokers per company -16.92 -1.85 -16.98 -4.83 -4.30 -7.76 Companies per broker -16.92 -1.85 -16.98 -4.83 -4.30 -7.76
Table A5.3: Earnings per Share Forecast Error 2015 2016 2017 2018 Number of observations 808 836 766 702 Mean (%) -0.89 -1.08 -0.26 0.05 Standard deviation (%) 4.28 4.07 3.51 3.15 Skewness -0.62 -1.38 1.33 -0.10 Kurtosis 1.66 10.25 8.23 6.65
Figure A5.1: Plots of Austria
Belgium Table A5.4: Coverage Indicators
Nano Micro
2015 2016 2017 2018 2015 2016 2017 2018 Coverage (%) 13.46 15.38 11.54 11.54 53.33 53.33 53.33 53.33 Reports per company 4.77 4.13 3.96 3.04 6.07 6.67 5.60 8.60 Reports per covered company 35.43 26.88 34.33 26.33 11.38 12.50 10.50 16.13 Brokers per company 0.37 0.35 0.29 0.27 0.93 0.80 0.73 1.07 Companies per broker 0.30 0.29 0.24 0.22 0.22 0.19 0.17 0.25
Small Non-SME
2015 2016 2017 2018 2015 2016 2017 2018 Coverage (%) 74.19 77.42 80.65 80.65 86.84 86.84 92.11 92.11 Reports per company 13.71 15.58 12.10 13.16 80.58 78.66 85.92 88.53 Reports per covered company 18.48 20.13 15.00 16.32 92.79 90.58 93.29 96.11 Brokers per company 1.52 1.65 1.58 2.13 7.58 7.47 7.89 8.58 Companies per broker 0.75 0.81 0.78 1.05 4.57 4.51 4.76 5.17
Table A5.5: Changes in Coverage Indicators (Percent) Nano Micro
2016 2017 2018 2016 2017 2018 Coverage 14.29 -25.00 0.00 0.00 0.00 0.00 Reports per company -13.31 -4.19 -23.30 9.89 -16.00 53.57 Reports per covered company -24.14 27.75 -23.30 9.89 -16.00 53.57 Brokers per company -5.26 -16.67 -6.67 -14.29 -8.33 45.45 Companies per broker -5.26 -16.67 -6.67 -14.29 -8.33 45.45
Small Non-SME
2016 2017 2018 2016 2017 2018 Coverage 4.35 4.17 0.00 0.00 6.06 0.00 Reports per company 13.65 -22.36 8.80 -2.38 9.23 3.03 Reports per covered company 8.91 -25.47 8.80 -2.38 2.99 3.03 Brokers per company 8.51 -3.92 34.69 -1.39 5.63 8.67 Companies per broker 8.51 -3.92 34.69 -1.39 5.63 8.67
Table A5.6: Earnings per Share Forecast Error 2015 2016 2017 2018 Number of observations 895 936 983 870 Mean (%) 0.05 0.60 0.63 0.26 Standard deviation (%) 3.47 5.05 3.26 1.84 Skewness 4.38 3.41 2.74 1.61 Kurtosis 38.46 19.76 17.82 12.87
Figure A5.2: Plots of Belgium
Bulgaria Table A5.7: Coverage Indicators
Nano Micro
2015 2016 2017 2018 2015 2016 2017 2018 Coverage (%) 1.58 2.11 1.05 0.53 34.78 26.09 17.39 4.35 Reports per company 0.07 0.07 0.04 0.02 1.39 0.78 0.43 0.09 Reports per covered company 4.67 3.25 3.50 3.00 4.00 3.00 2.50 2.00 Brokers per company 0.02 0.02 0.01 0.01 0.35 0.26 0.17 0.04 Companies per broker 3.00 4.00 2.00 1.00 8.00 6.00 4.00 1.00
Small Non-SME
2015 2016 2017 2018 2015 2016 2017 2018 Coverage (%) 66.67 33.33 0.00 16.67 n.a. n.a. n.a. n.a. Reports per company 3.67 1.33 0.00 0.67 n.a. n.a. n.a. n.a. Reports per covered company 5.50 4.00 n.a. 4.00 n.a. n.a. n.a. n.a. Brokers per company 0.67 0.33 0.00 0.17 n.a. n.a. n.a. n.a. Companies per broker 4.00 2.00 0.00 1.00 0.00 0.00 0.00 0.00
Table A5.8: Changes in Coverage Indicators (Percent) Nano Micro
2016 2017 2018 2016 2017 2018 Coverage 33.33 -50.00 -50.00 -25.00 -33.33 -75.00 Reports per company -7.14 -46.15 -57.14 -43.75 -44.44 -80.00 Reports per covered company -30.36 7.69 -14.29 -25.00 -16.67 -20.00 Brokers per company 33.33 -50.00 -50.00 -25.00 -33.33 -75.00 Companies per broker 33.33 -50.00 -50.00 -25.00 -33.33 -75.00
Small Non-SME
2016 2017 2018 2016 2017 2018 Coverage -50.00 -100.00 n.a. n.a. n.a. n.a. Reports per company -63.64 -100.00 n.a. n.a. n.a. n.a. Reports per covered company -27.27 n.a. n.a. n.a. n.a. n.a. Brokers per company -50.00 -100.00 n.a. n.a. n.a. n.a. Companies per broker -50.00 -100.00 n.a. n.a. n.a. n.a.
Table A5.9: Earnings per Share Forecast Error 2015 2016 2017 2018 Number of observations 14 14 4 2 Mean (%) 3.80 -0.05 0.97 2.41 Standard deviation (%) 8.16 4.21 2.10 n.a. Skewness 1.99 0.43 1.76 n.a. Kurtosis 4.30 1.07 3.07 n.a.
Figure A5.3: Plots of Bulgaria
Croatia Table A5.10: Coverage Indicators
Nano Micro
2015 2016 2017 2018 2015 2016 2017 2018 Coverage (%) 1.27 1.27 1.27 1.27 20.00 20.00 20.00 20.00 Reports per company 0.13 0.29 0.10 0.03 1.90 1.65 1.75 0.75 Reports per covered company 10.00 23.00 8.00 2.00 9.50 8.25 8.75 3.75 Brokers per company 0.04 0.04 0.03 0.01 0.35 0.35 0.30 0.20 Companies per broker 0.50 0.50 0.33 0.17 1.17 1.17 1.00 0.67
Small Non-SME
2015 2016 2017 2018 2015 2016 2017 2018 Coverage (%) 36.36 36.36 36.36 36.36 25.00 25.00 25.00 25.00 Reports per company 5.36 7.82 6.36 4.18 3.00 5.50 3.25 1.50 Reports per covered company 14.75 21.50 17.50 11.50 12.00 22.00 13.00 6.00 Brokers per company 1.18 1.18 1.18 0.82 0.50 0.75 0.75 0.25 Companies per broker 2.17 2.17 2.17 1.50 0.33 0.50 0.50 0.17
Table A5.11: Changes in Coverage Indicators (Percent) Nano Micro
2016 2017 2018 2016 2017 2018 Coverage 0.00 0.00 0.00 0.00 0.00 0.00 Reports per company 130.00 -65.22 -75.00 -13.16 6.06 -57.14 Reports per covered company 130.00 -65.22 -75.00 -13.16 6.06 -57.14 Brokers per company 0.00 -33.33 -50.00 0.00 -14.29 -33.33 Companies per broker 0.00 -33.33 -50.00 0.00 -14.29 -33.33
Small Non-SME
2016 2017 2018 2016 2017 2018 Coverage 0.00 0.00 0.00 0.00 0.00 0.00 Reports per company 45.76 -18.60 -34.29 83.33 -40.91 -53.85 Reports per covered company 45.76 -18.60 -34.29 83.33 -40.91 -53.85 Brokers per company 0.00 0.00 -30.77 50.00 0.00 -66.67 Companies per broker 0.00 0.00 -30.77 50.00 0.00 -66.67
Table A5.12: Earnings per Share Forecast Error 2015 2016 2017 2018 Number of observations 22 39 31 11 Mean (%) -1.23 -1.25 0.59 -0.62 Standard deviation (%) 7.72 2.15 3.92 2.74 Skewness 1.74 -1.02 -3.21 1.51 Kurtosis 6.69 0.98 15.24 3.27
Figure A5.4: Plots of Croatia
Cyprus Table A5.13: Coverage Indicators
Nano Micro
2015 2016 2017 2018 2015 2016 2017 2018 Coverage (%) 6.33 3.80 3.80 2.53 27.27 18.18 18.18 27.27 Reports per company 0.71 0.34 0.22 0.29 16.73 10.91 8.82 10.27 Reports per covered company 11.20 9.00 5.67 11.50 61.33 60.00 48.50 37.67 Brokers per company 0.14 0.05 0.04 0.05 1.27 1.00 1.00 1.18 Companies per broker 0.25 0.09 0.07 0.09 0.32 0.25 0.25 0.30
Small Non-SME
2015 2016 2017 2018 2015 2016 2017 2018 Coverage (%) 70.00 70.00 80.00 80.00 75.00 75.00 75.00 75.00 Reports per company 42.60 41.40 40.60 33.70 72.50 85.25 58.25 51.50 Reports per covered company 60.86 59.14 50.75 42.13 96.67 113.67 77.67 68.67 Brokers per company 4.70 4.80 4.30 4.30 7.00 7.75 6.50 5.50 Companies per broker 1.07 1.09 0.98 0.98 0.64 0.70 0.59 0.50
Table A5.14: Changes in Coverage Indicators (Percent) Nano Micro
2016 2017 2018 2016 2017 2018 Coverage -40.00 0.00 -33.33 -33.33 0.00 50.00 Reports per company -51.79 -37.04 35.29 -34.78 -19.17 16.49 Reports per covered company -19.64 -37.04 102.94 -2.17 -19.17 -22.34 Brokers per company -63.64 -25.00 33.33 -21.43 0.00 18.18 Companies per broker -63.64 -25.00 33.33 -21.43 0.00 18.18
Small Non-SME
2016 2017 2018 2016 2017 2018 Coverage 0.00 14.29 0.00 0.00 0.00 0.00 Reports per company -2.82 -1.93 -17.00 17.59 -31.67 -11.59 Reports per covered company -2.82 -14.19 -17.00 17.59 -31.67 -11.59 Brokers per company 2.13 -10.42 0.00 10.71 -16.13 -15.38 Companies per broker 2.13 -10.42 0.00 10.71 -16.13 -15.38
Table A5.15: Earnings per Share Forecast Error 2015 2016 2017 2018 Number of observations 196 206 157 136 Mean (%) 4.27 -0.55 -1.63 1.75 Standard deviation (%) 7.45 8.88 4.26 5.64 Skewness 1.09 0.17 -0.10 2.02 Kurtosis 1.57 2.16 2.63 4.20
Figure A5.5: Plots of Cyprus
Czech Republic Table A5.16: Coverage Indicators
Nano Micro
2015 2016 2017 2018 2015 2016 2017 2018 Coverage (%) 0.00 0.00 0.00 0.00 0.00 0.00 0.00 0.00 Reports per company 0.00 0.00 0.00 0.00 0.00 0.00 0.00 0.00 Reports per covered company n.a. n.a. n.a. n.a. n.a. n.a. n.a. n.a. Brokers per company 0.00 0.00 0.00 0.00 0.00 0.00 0.00 0.00 Companies per broker 0.00 0.00 0.00 0.00 0.00 0.00 0.00 0.00
Small Non-SME
2015 2016 2017 2018 2015 2016 2017 2018 Coverage (%) 100.00 100.00 100.00 100.00 100.00 100.00 100.00 100.00 Reports per company 9.00 9.00 11.00 3.00 98.25 93.75 82.00 59.25 Reports per covered company 9.00 9.00 11.00 3.00 98.25 93.75 82.00 59.25 Brokers per company 2.00 2.00 2.00 1.00 10.50 10.50 10.25 8.25 Companies per broker 0.09 0.09 0.09 0.04 1.83 1.83 1.78 1.43
Table A5.17: Changes in Coverage Indicators (Percent) Nano Micro
2016 2017 2018 2016 2017 2018 Coverage n.a. n.a. n.a. n.a. n.a. n.a. Reports per company n.a. n.a. n.a. n.a. n.a. n.a. Reports per covered company n.a. n.a. n.a. n.a. n.a. n.a. Brokers per company n.a. n.a. n.a. n.a. n.a. n.a. Companies per broker n.a. n.a. n.a. n.a. n.a. n.a.
Small Non-SME
2016 2017 2018 2016 2017 2018 Coverage 0.00 0.00 0.00 0.00 0.00 0.00 Reports per company 0.00 22.22 -72.73 -4.58 -12.53 -27.74 Reports per covered company 0.00 22.22 -72.73 -4.58 -12.53 -27.74 Brokers per company 0.00 0.00 -50.00 0.00 -2.38 -19.51 Companies per broker 0.00 0.00 -50.00 0.00 -2.38 -19.51
Table A5.18: Earnings per Share Forecast Error 2015 2016 2017 2018 Number of observations 91 93 84 53 Mean (%) -0.43 0.00 -1.20 0.02 Standard deviation (%) 4.12 0.93 0.75 1.02 Skewness -2.69 1.48 -0.22 0.45 Kurtosis 6.60 2.76 0.09 -1.35
Figure A5.6: Plots of Czech Republic
Denmark Table A5.19: Coverage Indicators
Nano Micro
2015 2016 2017 2018 2015 2016 2017 2018 Coverage (%) 7.14 5.36 5.36 3.57 18.52 18.52 14.81 11.11 Reports per company 0.77 0.63 0.38 0.57 2.59 2.22 2.74 2.11 Reports per covered company 10.75 11.67 7.00 16.00 14.00 12.00 18.50 19.00 Brokers per company 0.07 0.05 0.05 0.04 0.22 0.22 0.22 0.19 Companies per broker 0.07 0.05 0.05 0.03 0.10 0.10 0.10 0.09
Small Non-SME
2015 2016 2017 2018 2015 2016 2017 2018 Coverage (%) 50.00 50.00 50.00 50.00 90.63 90.63 90.63 90.63 Reports per company 27.23 25.68 27.50 25.55 156.03 174.28 169.28 176.84 Reports per covered company 54.45 51.36 55.00 51.09 172.17 192.31 186.79 195.14 Brokers per company 1.91 2.00 2.05 2.05 10.25 10.84 10.97 11.41 Companies per broker 0.72 0.76 0.78 0.78 5.66 5.98 6.05 6.29
Table A5.20: Changes in Coverage Indicators (Percent) Nano Micro
2016 2017 2018 2016 2017 2018 Coverage -25.00 0.00 -33.33 0.00 -20.00 -25.00 Reports per company -18.60 -40.00 52.38 -14.29 23.33 -22.97 Reports per covered company 8.53 -40.00 128.57 -14.29 54.17 2.70 Brokers per company -25.00 0.00 -33.33 0.00 0.00 -16.67 Companies per broker -25.00 0.00 -33.33 0.00 0.00 -16.67
Small Non-SME
2016 2017 2018 2016 2017 2018 Coverage 0.00 0.00 0.00 0.00 0.00 0.00 Reports per company -5.68 7.08 -7.11 11.70 -2.87 4.47 Reports per covered company -5.68 7.08 -7.11 11.70 -2.87 4.47 Brokers per company 4.76 2.27 0.00 5.79 1.15 3.99 Companies per broker 4.76 2.27 0.00 5.79 1.15 3.99
Table A5.21: Earnings per Share Forecast Error 2015 2016 2017 2018 Number of observations 1,296 1,491 1,399 1,383 Mean (%) 1.09 0.06 0.42 0.74 Standard deviation (%) 4.27 2.83 2.07 1.66 Skewness 3.00 2.78 2.41 3.07 Kurtosis 11.23 29.34 10.58 15.78
Figure A5.7: Plots of Denmark
Estonia Table A5.22: Coverage Indicators
Nano Micro
2015 2016 2017 2018 2015 2016 2017 2018 Coverage (%) 20.00 20.00 20.00 10.00 66.67 50.00 33.33 50.00 Reports per company 0.60 1.70 1.20 0.70 3.67 6.00 3.67 4.00 Reports per covered company 3.00 8.50 6.00 7.00 5.50 12.00 11.00 8.00 Brokers per company 0.20 0.20 0.20 0.10 0.67 0.50 0.33 0.50 Companies per broker 0.50 0.50 0.50 0.25 1.00 0.75 0.50 0.75
Small Non-SME
2015 2016 2017 2018 2015 2016 2017 2018 Coverage (%) 66.67 66.67 66.67 66.67 100.00 100.00 100.00 100.00 Reports per company 2.00 7.00 7.00 6.33 13.00 18.00 16.00 14.00 Reports per covered company 3.00 10.50 10.50 9.50 13.00 18.00 16.00 14.00 Brokers per company 0.67 0.67 0.67 0.67 2.00 2.00 2.00 3.00 Companies per broker 0.50 0.50 0.50 0.50 0.50 0.50 0.50 0.75
Table A5.23: Changes in Coverage Indicators (Percent) Nano Micro
2016 2017 2018 2016 2017 2018 Coverage 0.00 0.00 -50.00 -25.00 -33.33 50.00 Reports per company 183.33 -29.41 -41.67 63.64 -38.89 9.09 Reports per covered company 183.33 -29.41 16.67 118.18 -8.33 -27.27 Brokers per company 0.00 0.00 -50.00 -25.00 -33.33 50.00 Companies per broker 0.00 0.00 -50.00 -25.00 -33.33 50.00
Small Non-SME
2016 2017 2018 2016 2017 2018 Coverage 0.00 0.00 0.00 0.00 0.00 0.00 Reports per company 250.00 0.00 -9.52 38.46 -11.11 -12.50 Reports per covered company 250.00 0.00 -9.52 38.46 -11.11 -12.50 Brokers per company 0.00 0.00 0.00 0.00 0.00 50.00 Companies per broker 0.00 0.00 0.00 0.00 0.00 50.00
Table A5.24: Earnings per Share Forecast Error 2015 2016 2017 2018 Number of observations 3 23 18 12 Mean (%) -1.85 1.05 1.88 -1.65 Standard deviation (%) n.a. 3.16 4.22 2.04 Skewness n.a. -1.12 0.97 0.30 Kurtosis n.a. 1.64 -0.25 -0.53
Figure A5.8: Plots of Estonia
Finland Table A5.25: Coverage Indicators
Nano Micro
2015 2016 2017 2018 2015 2016 2017 2018 Coverage (%) 31.82 36.36 36.36 38.64 60.71 64.29 60.71 64.29 Reports per company 5.50 6.52 6.77 7.23 17.32 18.29 16.43 13.71 Reports per covered company 17.29 17.94 18.63 18.71 28.53 28.44 27.06 21.33 Brokers per company 0.41 0.48 0.50 0.50 1.18 1.25 1.29 1.04 Companies per broker 0.38 0.45 0.47 0.47 0.70 0.74 0.77 0.62
Small Non-SME
2015 2016 2017 2018 2015 2016 2017 2018 Coverage (%) 89.66 93.10 93.10 93.10 96.55 96.55 96.55 96.55 Reports per company 35.48 35.76 31.72 32.59 149.31 149.41 142.31 136.55 Reports per covered company 39.58 38.41 34.07 35.00 154.64 154.75 147.39 141.43 Brokers per company 2.59 2.55 2.55 2.38 10.90 10.90 10.76 10.34 Companies per broker 1.60 1.57 1.57 1.47 6.72 6.72 6.64 6.38
Table A5.26: Changes in Coverage Indicators (Percent) Nano Micro
2016 2017 2018 2016 2017 2018 Coverage 14.29 0.00 6.25 5.88 -5.56 5.88 Reports per company 18.60 3.83 6.71 5.57 -10.16 -16.52 Reports per covered company 3.77 3.83 0.43 -0.30 -4.87 -21.16 Brokers per company 16.67 4.76 0.00 6.06 2.86 -19.44 Companies per broker 16.67 4.76 0.00 6.06 2.86 -19.44
Small Non-SME
2016 2017 2018 2016 2017 2018 Coverage 3.85 0.00 0.00 0.00 0.00 0.00 Reports per company 0.78 -11.28 2.72 0.07 -4.75 -4.05 Reports per covered company -2.96 -11.28 2.72 0.07 -4.75 -4.05 Brokers per company -1.33 0.00 -6.76 0.00 -1.27 -3.85 Companies per broker -1.33 0.00 -6.76 0.00 -1.27 -3.85
Table A5.27: Earnings per Share Forecast Error 2015 2016 2017 2018 Number of observations 1,413 1,503 1,406 1,293 Mean (%) 0.76 1.23 0.89 1.23 Standard deviation (%) 3.63 5.59 4.04 3.75 Skewness 1.66 1.79 1.10 1.59 Kurtosis 6.77 6.51 5.43 4.26
Figure A5.9: Plots of Finland
France Table A5.28: Coverage Indicators
Nano Micro
2015 2016 2017 2018 2015 2016 2017 2018 Coverage (%) 25.94 26.96 23.55 22.87 49.63 51.11 52.59 53.33 Reports per company 3.17 3.18 3.02 2.84 9.04 9.85 10.60 10.51 Reports per covered company 12.24 11.78 12.83 12.40 18.21 19.28 20.15 19.71 Brokers per company 0.41 0.42 0.37 0.35 0.99 1.01 1.04 1.09 Companies per broker 1.07 1.09 0.97 0.91 1.19 1.22 1.26 1.31
Small Non-SME
2015 2016 2017 2018 2015 2016 2017 2018 Coverage (%) 71.93 73.68 71.93 73.68 91.27 90.48 90.48 91.27 Reports per company 20.99 19.85 23.63 23.40 150.59 163.21 165.29 157.35 Reports per covered company 29.18 26.94 32.85 31.76 164.99 180.39 182.69 172.40 Brokers per company 2.07 2.14 2.26 2.27 12.93 13.27 13.10 13.03 Companies per broker 2.11 2.18 2.30 2.31 14.54 14.93 14.73 14.66
Table A5.29: Changes in Coverage Indicators (Percent) Nano Micro
2016 2017 2018 2016 2017 2018 Coverage 3.95 -12.66 -2.90 2.99 2.90 1.41 Reports per company 0.11 -4.94 -6.10 9.02 7.59 -0.84 Reports per covered company -3.69 8.84 -3.30 5.86 4.56 -2.22 Brokers per company 1.67 -10.66 -6.42 3.01 2.92 4.26 Companies per broker 1.67 -10.66 -6.42 3.01 2.92 4.26
Small Non-SME
2016 2017 2018 2016 2017 2018 Coverage 2.44 -2.38 2.44 -0.87 0.00 0.88 Reports per company -5.43 19.05 -0.97 8.39 1.27 -4.81 Reports per covered company -7.68 21.95 -3.32 9.34 1.27 -5.63 Brokers per company 3.39 5.74 0.39 2.64 -1.32 -0.48 Companies per broker 3.39 5.74 0.39 2.64 -1.32 -0.48
Table A5.30: Earnings per Share Forecast Error 2015 2016 2017 2018 Number of observations 5,703 6,475 6,476 5,565 Mean (%) 0.64 0.37 0.33 0.69 Standard deviation (%) 3.82 4.03 3.10 2.78 Skewness 3.90 3.69 2.68 2.99 Kurtosis 25.71 26.95 18.80 17.29
Figure A5.10: Plots of France
Germany Table A5.31: Coverage Indicators
Nano Micro
2015 2016 2017 2018 2015 2016 2017 2018 Coverage (%) 20.55 17.79 15.64 14.42 52.32 52.32 56.29 55.63 Reports per company 2.65 2.60 2.16 1.94 12.58 11.93 12.04 12.33 Reports per covered company 12.90 14.59 13.80 13.47 24.05 22.81 21.39 22.17 Brokers per company 0.40 0.33 0.28 0.26 1.64 1.58 1.61 1.76 Companies per broker 1.18 0.98 0.82 0.77 2.23 2.15 2.19 2.40
Small Non-SME
2015 2016 2017 2018 2015 2016 2017 2018 Coverage (%) 69.67 67.21 68.85 69.67 89.06 88.28 87.50 86.72 Reports per company 34.56 33.92 33.22 33.80 190.77 198.88 195.87 195.18 Reports per covered company 49.60 50.46 48.25 48.52 214.19 225.28 223.85 225.07 Brokers per company 3.80 3.66 3.66 3.79 16.73 16.99 16.53 16.50 Companies per broker 4.17 4.02 4.02 4.16 19.29 19.59 19.06 19.03
Table A5.32: Changes in Coverage Indicators (Percent) Nano Micro
2016 2017 2018 2016 2017 2018 Coverage -13.43 -12.07 -7.84 0.00 7.59 -1.18 Reports per company -2.08 -16.78 -10.09 -5.16 0.89 2.42 Reports per covered company 13.11 -5.36 -2.43 -5.16 -6.23 3.64 Brokers per company -16.79 -16.51 -6.59 -3.63 1.67 9.47 Companies per broker -16.79 -16.51 -6.59 -3.63 1.67 9.47
Small Non-SME
2016 2017 2018 2016 2017 2018 Coverage -3.53 2.44 1.19 -0.88 -0.88 -0.89 Reports per company -1.85 -2.05 1.75 4.26 -1.52 -0.35 Reports per covered company 1.74 -4.39 0.55 5.18 -0.64 0.55 Brokers per company -3.67 0.00 3.59 1.59 -2.71 -0.19 Companies per broker -3.67 0.00 3.59 1.59 -2.71 -0.19
Table A5.33: Earnings per Share Forecast Error 2015 2016 2017 2018 Number of observations 7,246 7,877 7,722 6,797 Mean (%) 0.71 0.44 0.17 0.85 Standard deviation (%) 4.35 3.89 3.36 2.62 Skewness 2.22 1.35 1.59 2.02 Kurtosis 11.37 18.77 14.17 15.42
Figure A5.11: Plots of Germany
Greece Table A5.34: Coverage Indicators
Nano Micro
2015 2016 2017 2018 2015 2016 2017 2018 Coverage (%) 0.81 0.81 1.61 0.00 17.39 17.39 21.74 17.39 Reports per company 0.17 0.06 0.06 0.00 2.70 1.83 1.17 0.65 Reports per covered company 21.00 8.00 3.50 n.a. 15.50 10.50 5.40 3.75 Brokers per company 0.02 0.02 0.02 0.00 0.30 0.26 0.30 0.17 Companies per broker 0.11 0.07 0.07 0.00 0.26 0.22 0.26 0.15
Small Non-SME
2015 2016 2017 2018 2015 2016 2017 2018 Coverage (%) 50.00 45.83 62.50 58.33 91.67 91.67 91.67 91.67 Reports per company 18.33 16.67 19.04 12.42 75.08 77.67 74.25 56.67 Reports per covered company 36.67 36.36 30.47 21.29 81.91 84.73 81.00 61.82 Brokers per company 2.50 2.17 2.46 1.96 9.42 9.08 8.58 8.17 Companies per broker 2.22 1.93 2.19 1.74 4.19 4.04 3.81 3.63
Table A5.35: Changes in Coverage Indicators (Percent) Nano Micro
2016 2017 2018 2016 2017 2018 Coverage 0.00 100.00 -100.00 0.00 25.00 -20.00 Reports per company -61.90 -12.50 -100.00 -32.26 -35.71 -44.44 Reports per covered company -61.90 -56.25 n.a. -32.26 -48.57 -30.56 Brokers per company -33.33 0.00 -100.00 -14.29 16.67 -42.86 Companies per broker -33.33 0.00 -100.00 -14.29 16.67 -42.86
Small Non-SME
2016 2017 2018 2016 2017 2018 Coverage -8.33 36.36 -6.67 0.00 0.00 0.00 Reports per company -9.09 14.25 -34.79 3.44 -4.40 -23.68 Reports per covered company -0.83 -16.22 -30.13 3.44 -4.40 -23.68 Brokers per company -13.33 13.46 -20.34 -3.54 -5.50 -4.85 Companies per broker -13.33 13.46 -20.34 -3.54 -5.50 -4.85
Table A5.36: Earnings per Share Forecast Error 2015 2016 2017 2018 Number of observations 312 333 332 199 Mean (%) 4.58 0.68 1.62 0.42 Standard deviation (%) 8.93 7.91 6.31 3.73 Skewness 1.28 0.53 0.86 -0.10 Kurtosis 1.16 1.81 2.76 4.56
Figure A5.12: Plots of Greece
Hungary Table A5.37: Coverage Indicators
Nano Micro
2015 2016 2017 2018 2015 2016 2017 2018 Coverage (%) 0.00 0.00 0.00 0.00 0.00 12.50 12.50 12.50 Reports per company 0.00 0.00 0.00 0.00 0.00 0.25 0.63 0.50 Reports per covered company n.a. n.a. n.a. n.a. n.a. 2.00 5.00 4.00 Brokers per company 0.00 0.00 0.00 0.00 0.00 0.13 0.13 0.13 Companies per broker 0.00 0.00 0.00 0.00 0.00 0.04 0.04 0.04
Small Non-SME
2015 2016 2017 2018 2015 2016 2017 2018 Coverage (%) 0.00 0.00 0.00 0.00 100.00 100.00 100.00 100.00 Reports per company 0.00 0.00 0.00 0.00 123.00 124.25 100.75 99.75 Reports per covered company n.a. n.a. n.a. n.a. 123.00 124.25 100.75 99.75 Brokers per company 0.00 0.00 0.00 0.00 12.25 12.50 11.25 8.75 Companies per broker 0.00 0.00 0.00 0.00 1.96 2.00 1.80 1.40
Table A5.38: Changes in Coverage Indicators (Percent) Nano Micro
2016 2017 2018 2016 2017 2018 Coverage n.a. n.a. n.a. n.a. 0.00 0.00 Reports per company n.a. n.a. n.a. n.a. 150.00 -20.00 Reports per covered company n.a. n.a. n.a. n.a. 150.00 -20.00 Brokers per company n.a. n.a. n.a. n.a. 0.00 0.00 Companies per broker n.a. n.a. n.a. n.a. 0.00 0.00
Small Non-SME
2016 2017 2018 2016 2017 2018 Coverage n.a. n.a. n.a. 0.00 0.00 0.00 Reports per company n.a. n.a. n.a. 1.02 -18.91 -0.99 Reports per covered company n.a. n.a. n.a. 1.02 -18.91 -0.99 Brokers per company n.a. n.a. n.a. 2.04 -10.00 -22.22 Companies per broker n.a. n.a. n.a. 2.04 -10.00 -22.22
Table A5.39: Earnings per Share Forecast Error 2015 2016 2017 2018 Number of observations 121 129 108 92 Mean (%) -1.49 -4.07 -2.12 -1.11 Standard deviation (%) 3.20 3.70 2.14 1.89 Skewness 1.08 -1.28 0.24 0.11 Kurtosis 4.91 0.80 -0.57 0.63
Figure A5.13: Plots of Hungary
Ireland Table A5.40: Coverage Indicators
Nano Micro
2015 2016 2017 2018 2015 2016 2017 2018 Coverage (%) 37.50 31.25 31.25 31.25 85.71 85.71 85.71 85.71 Reports per company 8.31 8.19 7.13 5.81 21.57 17.86 11.86 9.29 Reports per covered company 22.17 26.20 22.80 18.60 25.17 20.83 13.83 10.83 Brokers per company 0.94 0.63 0.69 0.63 3.14 2.86 2.29 1.86 Companies per broker 0.12 0.08 0.09 0.08 0.18 0.17 0.13 0.11
Small Non-SME
2015 2016 2017 2018 2015 2016 2017 2018 Coverage (%) 100.00 100.00 92.86 92.86 96.97 100.00 100.00 100.00 Reports per company 60.79 79.00 72.43 61.93 182.42 213.94 214.06 214.91 Reports per covered company 60.79 79.00 78.00 66.69 188.13 213.94 214.06 214.91 Brokers per company 6.29 6.64 6.50 6.21 15.45 16.94 17.00 17.06 Companies per broker 0.73 0.77 0.75 0.72 4.21 4.62 4.64 4.65
Table A5.41: Changes in Coverage Indicators (Percent) Nano Micro
2016 2017 2018 2016 2017 2018 Coverage -16.67 0.00 0.00 0.00 0.00 0.00 Reports per company -1.50 -12.98 -18.42 -17.22 -33.60 -21.69 Reports per covered company 18.20 -12.98 -18.42 -17.22 -33.60 -21.69 Brokers per company -33.33 10.00 -9.09 -9.09 -20.00 -18.75 Companies per broker -33.33 10.00 -9.09 -9.09 -20.00 -18.75
Small Non-SME
2016 2017 2018 2016 2017 2018 Coverage 0.00 -7.14 0.00 3.13 0.00 0.00 Reports per company 29.96 -8.32 -14.50 17.28 0.06 0.40 Reports per covered company 29.96 -1.27 -14.50 13.72 0.06 0.40 Brokers per company 5.68 -2.15 -4.40 9.61 0.36 0.36 Companies per broker 5.68 -2.15 -4.40 9.61 0.36 0.36
Table A5.42: Earnings per Share Forecast Error 2015 2016 2017 2018 Number of observations 1,746 2,025 2,075 2,048 Mean (%) 0.30 0.98 0.12 -0.93 Standard deviation (%) 2.31 3.08 2.63 2.96 Skewness 4.28 1.15 0.09 -2.30 Kurtosis 45.14 5.60 11.80 7.30
Figure A5.14: Plots of Ireland
Italy Table A5.43: Coverage Indicators
Nano Micro
2015 2016 2017 2018 2015 2016 2017 2018 Coverage (%) 13.19 12.09 10.99 10.99 45.33 46.67 42.67 37.33 Reports per company 1.41 1.18 1.11 0.55 6.59 6.63 6.15 4.91 Reports per covered company 10.67 9.73 10.10 5.00 14.53 14.20 14.41 13.14 Brokers per company 0.18 0.18 0.18 0.14 0.88 0.87 0.83 0.71 Companies per broker 0.28 0.28 0.28 0.22 1.14 1.12 1.07 0.91
Small Non-SME
2015 2016 2017 2018 2015 2016 2017 2018 Coverage (%) 62.79 65.12 67.44 69.77 94.03 92.54 92.54 92.54 Reports per company 10.56 10.77 11.58 10.72 109.51 117.21 114.54 114.04 Reports per covered company 16.81 16.54 17.17 15.37 116.46 126.66 123.77 123.24 Brokers per company 1.49 1.44 1.40 1.47 9.93 10.37 10.19 10.01 Companies per broker 1.10 1.07 1.03 1.09 11.47 11.98 11.78 11.57
Table A5.44: Changes in Coverage Indicators (Percent) Nano Micro
2016 2017 2018 2016 2017 2018 Coverage -8.33 -9.09 0.00 2.94 -8.57 -12.50 Reports per company -16.41 -5.61 -50.50 0.61 -7.24 -20.17 Reports per covered company -8.81 3.83 -50.50 -2.27 1.45 -8.77 Brokers per company 0.00 0.00 -18.75 -1.52 -4.62 -14.52 Companies per broker 0.00 0.00 -18.75 -1.52 -4.62 -14.52
Small Non-SME
2016 2017 2018 2016 2017 2018 Coverage 3.70 3.57 3.45 -1.59 0.00 0.00 Reports per company 1.98 7.56 -7.43 7.03 -2.28 -0.43 Reports per covered company -1.66 3.85 -10.52 8.76 -2.28 -0.43 Brokers per company -3.13 -3.23 5.00 4.51 -1.73 -1.76 Companies per broker -3.13 -3.23 5.00 4.51 -1.73 -1.76
Table A5.45: Earnings per Share Forecast Error 2015 2016 2017 2018 Number of observations 1,991 2,060 2,107 1,847 Mean (%) 1.91 1.20 0.30 -0.06 Standard deviation (%) 6.00 5.82 3.09 2.62 Skewness 2.72 3.35 2.74 -1.22 Kurtosis 9.34 16.93 19.37 5.45
Figure A5.15: Plots of Italy
Latvia Table A5.46: Coverage Indicators
Nano Micro
2015 2016 2017 2018 2015 2016 2017 2018 Coverage (%) 0.00 0.00 0.00 0.00 50.00 50.00 25.00 25.00 Reports per company 0.00 0.00 0.00 0.00 1.50 9.00 6.25 4.00 Reports per covered company n.a. n.a. n.a. n.a. 3.00 18.00 25.00 16.00 Brokers per company 0.00 0.00 0.00 0.00 0.50 0.50 0.25 0.25 Companies per broker 0.00 0.00 0.00 0.00 2.00 2.00 1.00 1.00
Small Non-SME
2015 2016 2017 2018 2015 2016 2017 2018 Coverage (%) 0.00 0.00 0.00 0.00 n.a. n.a. n.a. n.a. Reports per company 0.00 0.00 0.00 0.00 n.a. n.a. n.a. n.a. Reports per covered company n.a. n.a. n.a. n.a. n.a. n.a. n.a. n.a. Brokers per company 0.00 0.00 0.00 0.00 n.a. n.a. n.a. n.a. Companies per broker 0.00 0.00 0.00 0.00 0.00 0.00 0.00 0.00
Table A5.47: Changes in Coverage Indicators (Percent) Nano Micro
2016 2017 2018 2016 2017 2018 Coverage n.a. n.a. n.a. 0.00 -50.00 0.00 Reports per company n.a. n.a. n.a. 500.00 -30.56 -36.00 Reports per covered company n.a. n.a. n.a. 500.00 38.89 -36.00 Brokers per company n.a. n.a. n.a. 0.00 -50.00 0.00 Companies per broker n.a. n.a. n.a. 0.00 -50.00 0.00
Small Non-SME
2016 2017 2018 2016 2017 2018 Coverage n.a. n.a. n.a. n.a. n.a. n.a. Reports per company n.a. n.a. n.a. n.a. n.a. n.a. Reports per covered company n.a. n.a. n.a. n.a. n.a. n.a. Brokers per company n.a. n.a. n.a. n.a. n.a. n.a. Companies per broker n.a. n.a. n.a. n.a. n.a. n.a.
Table A5.48: Earnings per Share Forecast Error 2015 2016 2017 2018 Number of observations n.a. 7 5 3 Mean (%) n.a. 2.48 3.40 0.59 Standard deviation (%) n.a. 2.28 1.53 n.a. Skewness n.a. 0.28 1.11 n.a. Kurtosis n.a. -2.54 1.75 n.a.
Figure A5.16: Plots of Latvia
Lithuania Table A5.49: Coverage Indicators
Nano Micro
2015 2016 2017 2018 2015 2016 2017 2018 Coverage (%) 0.00 0.00 0.00 0.00 20.00 20.00 20.00 20.00 Reports per company 0.00 0.00 0.00 0.00 0.50 1.70 1.40 1.60 Reports per covered company n.a. n.a. n.a. n.a. 2.50 8.50 7.00 8.00 Brokers per company 0.00 0.00 0.00 0.00 0.20 0.20 0.20 0.20 Companies per broker 0.00 0.00 0.00 0.00 1.00 1.00 1.00 1.00
Small Non-SME
2015 2016 2017 2018 2015 2016 2017 2018 Coverage (%) 0.00 20.00 20.00 20.00 n.a. n.a. n.a. n.a. Reports per company 0.00 1.00 3.60 3.00 n.a. n.a. n.a. n.a. Reports per covered company n.a. 5.00 18.00 15.00 n.a. n.a. n.a. n.a. Brokers per company 0.00 0.20 0.40 0.40 n.a. n.a. n.a. n.a. Companies per broker 0.00 0.50 1.00 1.00 0.00 0.00 0.00 0.00
Table A5.50: Changes in Coverage Indicators (Percent) Nano Micro
2016 2017 2018 2016 2017 2018 Coverage n.a. n.a. n.a. 0.00 0.00 0.00 Reports per company n.a. n.a. n.a. 240.00 -17.65 14.29 Reports per covered company n.a. n.a. n.a. 240.00 -17.65 14.29 Brokers per company n.a. n.a. n.a. 0.00 0.00 0.00 Companies per broker n.a. n.a. n.a. 0.00 0.00 0.00
Small Non-SME
2016 2017 2018 2016 2017 2018 Coverage n.a. 0.00 0.00 n.a. n.a. n.a. Reports per company n.a. 260.00 -16.67 n.a. n.a. n.a. Reports per covered company n.a. 260.00 -16.67 n.a. n.a. n.a. Brokers per company n.a. 100.00 0.00 n.a. n.a. n.a. Companies per broker n.a. 100.00 0.00 n.a. n.a. n.a.
Table A5.51: Earnings per Share Forecast Error 2015 2016 2017 2018 Number of observations n.a. 7 9 8 Mean (%) n.a. 2.88 -0.79 -3.37 Standard deviation (%) n.a. 3.75 2.12 3.82 Skewness n.a. 1.27 -0.94 0.53 Kurtosis n.a. -0.49 0.68 -1.78
Figure A5.17: Plots of Lithuania
Luxembourg Table A5.52: Coverage Indicators
Nano Micro
2015 2016 2017 2018 2015 2016 2017 2018 Coverage (%) 13.33 13.33 13.33 13.33 37.50 37.50 37.50 37.50 Reports per company 2.53 2.27 2.53 1.00 13.25 9.00 4.63 6.75 Reports per covered company 19.00 17.00 19.00 7.50 35.33 24.00 12.33 18.00 Brokers per company 0.20 0.27 0.20 0.20 1.38 1.13 0.88 1.00 Companies per broker 0.02 0.03 0.02 0.02 0.09 0.07 0.06 0.07
Small Non-SME
2015 2016 2017 2018 2015 2016 2017 2018 Coverage (%) 55.00 55.00 55.00 55.00 70.37 66.67 66.67 66.67 Reports per company 47.70 41.60 34.60 26.75 96.56 102.04 105.00 101.74 Reports per covered company 86.73 75.64 62.91 48.64 137.21 153.06 157.50 152.61 Brokers per company 4.50 4.45 4.15 3.30 8.89 9.04 9.30 8.89 Companies per broker 0.73 0.72 0.67 0.54 1.95 1.98 2.04 1.95
Table A5.53: Changes in Coverage Indicators (Percent) Nano Micro
2016 2017 2018 2016 2017 2018 Coverage 0.00 0.00 0.00 0.00 0.00 0.00 Reports per company -10.53 11.76 -60.53 -32.08 -48.61 45.95 Reports per covered company -10.53 11.76 -60.53 -32.08 -48.61 45.95 Brokers per company 33.33 -25.00 0.00 -18.18 -22.22 14.29 Companies per broker 33.33 -25.00 0.00 -18.18 -22.22 14.29
Small Non-SME
2016 2017 2018 2016 2017 2018 Coverage 0.00 0.00 0.00 -5.26 0.00 0.00 Reports per company -12.79 -16.83 -22.69 5.68 2.90 -3.10 Reports per covered company -12.79 -16.83 -22.69 11.55 2.90 -3.10 Brokers per company -1.11 -6.74 -20.48 1.67 2.87 -4.38 Companies per broker -1.11 -6.74 -20.48 1.67 2.87 -4.38
Table A5.54: Earnings per Share Forecast Error 2015 2016 2017 2018 Number of observations 810 846 877 777 Mean (%) 0.15 -1.73 -0.72 0.35 Standard deviation (%) 4.41 7.59 4.28 4.97 Skewness 0.90 0.03 1.88 1.12 Kurtosis 9.24 4.36 10.17 5.17
Figure A5.18: Plots of Luxembourg
Malta Table A5.55: Coverage Indicators
Nano Micro
2015 2016 2017 2018 2015 2016 2017 2018 Coverage (%) 0.00 0.00 0.00 0.00 0.00 0.00 0.00 0.00 Reports per company 0.00 0.00 0.00 0.00 0.00 0.00 0.00 0.00 Reports per covered company n.a. n.a. n.a. n.a. n.a. n.a. n.a. n.a. Brokers per company 0.00 0.00 0.00 0.00 0.00 0.00 0.00 0.00 Companies per broker 0.00 0.00 0.00 0.00 0.00 0.00 0.00 0.00
Small Non-SME
2015 2016 2017 2018 2015 2016 2017 2018 Coverage (%) 7.69 15.38 15.38 15.38 100.00 100.00 100.00 100.00 Reports per company 1.08 1.62 2.77 5.08 71.00 87.00 66.00 79.00 Reports per covered company 14.00 10.50 18.00 33.00 71.00 87.00 66.00 79.00 Brokers per company 0.08 0.15 0.38 0.38 6.00 5.00 6.00 6.00 Companies per broker 0.09 0.18 0.45 0.45 0.55 0.45 0.55 0.55
Table A5.56: Changes in Coverage Indicators (Percent) Nano Micro
2016 2017 2018 2016 2017 2018 Coverage n.a. n.a. n.a. n.a. n.a. n.a. Reports per company n.a. n.a. n.a. n.a. n.a. n.a. Reports per covered company n.a. n.a. n.a. n.a. n.a. n.a. Brokers per company n.a. n.a. n.a. n.a. n.a. n.a. Companies per broker n.a. n.a. n.a. n.a. n.a. n.a.
Small Non-SME
2016 2017 2018 2016 2017 2018 Coverage 100.00 0.00 0.00 0.00 0.00 0.00 Reports per company 50.00 71.43 83.33 22.54 -24.14 19.70 Reports per covered company -25.00 71.43 83.33 22.54 -24.14 19.70 Brokers per company 100.00 150.00 0.00 -16.67 20.00 0.00 Companies per broker 100.00 150.00 0.00 -16.67 20.00 0.00
Table A5.57: Earnings per Share Forecast Error 2015 2016 2017 2018 Number of observations 19 25 26 38 Mean (%) -0.38 -0.24 -0.91 -0.17 Standard deviation (%) 0.64 1.00 1.04 0.51 Skewness -0.89 1.73 1.03 -0.13 Kurtosis 2.72 2.83 0.36 -0.64
Figure A5.19: Plots of Malta
Netherlands Table A5.58: Coverage Indicators
Nano Micro
2015 2016 2017 2018 2015 2016 2017 2018 Coverage (%) 17.95 15.38 15.38 7.69 65.00 65.00 65.00 65.00 Reports per company 1.15 0.64 1.28 0.23 8.85 8.85 9.05 9.30 Reports per covered company 6.43 4.17 8.33 3.00 13.62 13.62 13.92 14.31 Brokers per company 0.21 0.15 0.15 0.08 1.30 1.30 1.25 1.20 Companies per broker 0.06 0.05 0.05 0.02 0.20 0.20 0.19 0.18
Small Non-SME
2015 2016 2017 2018 2015 2016 2017 2018 Coverage (%) 68.00 68.00 68.00 68.00 90.00 90.00 90.00 90.00 Reports per company 24.68 29.36 28.72 30.40 149.15 166.42 165.20 155.83 Reports per covered company 36.29 43.18 42.24 44.71 165.72 184.91 183.56 173.15 Brokers per company 3.04 3.32 3.16 3.36 13.65 14.47 14.05 13.95 Companies per broker 0.58 0.64 0.61 0.65 6.30 6.68 6.48 6.44
Table A5.59: Changes in Coverage Indicators (Percent) Nano Micro
2016 2017 2018 2016 2017 2018 Coverage -14.29 0.00 -50.00 0.00 0.00 0.00 Reports per company -44.44 100.00 -82.00 0.00 2.26 2.76 Reports per covered company -35.19 100.00 -64.00 0.00 2.26 2.76 Brokers per company -25.00 0.00 -50.00 0.00 -3.85 -4.00 Companies per broker -25.00 0.00 -50.00 0.00 -3.85 -4.00
Small Non-SME
2016 2017 2018 2016 2017 2018 Coverage 0.00 0.00 0.00 0.00 0.00 0.00 Reports per company 18.96 -2.18 5.85 11.58 -0.73 -5.67 Reports per covered company 18.96 -2.18 5.85 11.58 -0.73 -5.67 Brokers per company 9.21 -4.82 6.33 5.98 -2.88 -0.71 Companies per broker 9.21 -4.82 6.33 5.98 -2.88 -0.71
Table A5.60: Earnings per Share Forecast Error 2015 2016 2017 2018 Number of observations 2,503 2,721 2,722 2,477 Mean (%) 0.31 0.21 0.24 0.05 Standard deviation (%) 2.74 2.72 2.89 2.78 Skewness 3.26 1.83 2.90 1.76 Kurtosis 21.69 24.76 19.67 20.75
Figure A5.20: Plots of Netherlands
Poland Table A5.61: Coverage Indicators
Nano Micro
2015 2016 2017 2018 2015 2016 2017 2018 Coverage (%) 5.89 5.89 5.72 5.05 45.90 39.34 45.90 49.18 Reports per company 0.51 0.41 0.45 0.38 6.11 4.13 5.77 4.41 Reports per covered company 8.66 7.03 7.88 7.53 13.32 10.50 12.57 8.97 Brokers per company 0.09 0.08 0.09 0.08 0.84 0.75 0.97 0.87 Companies per broker 1.72 1.53 1.72 1.50 1.59 1.44 1.84 1.66
Small Non-SME
2015 2016 2017 2018 2015 2016 2017 2018 Coverage (%) 68.09 70.21 80.85 80.85 91.67 95.83 95.83 95.83 Reports per company 24.81 22.36 19.70 18.06 113.83 100.83 84.58 76.13 Reports per covered company 36.44 31.85 24.37 22.34 124.18 105.22 88.26 79.43 Brokers per company 3.30 3.19 3.09 2.89 11.46 10.96 9.88 9.04 Companies per broker 4.84 4.69 4.53 4.25 8.59 8.22 7.41 6.78
Table A5.62: Changes in Coverage Indicators (Percent) Nano Micro
2016 2017 2018 2016 2017 2018 Coverage 0.00 -2.86 -11.76 -14.29 16.67 7.14 Reports per company -18.81 8.94 -15.67 -32.44 39.68 -23.58 Reports per covered company -18.81 12.15 -4.43 -21.18 19.73 -28.67 Brokers per company -10.91 12.24 -12.73 -9.80 28.26 -10.17 Companies per broker -10.91 12.24 -12.73 -9.80 28.26 -10.17
Small Non-SME
2016 2017 2018 2016 2017 2018 Coverage 3.13 15.15 0.00 4.55 0.00 0.00 Reports per company -9.86 -11.89 -8.32 -11.42 -16.12 -10.00 Reports per covered company -12.59 -23.49 -8.32 -15.27 -16.12 -10.00 Brokers per company -3.23 -3.33 -6.21 -4.36 -9.89 -8.44 Companies per broker -3.23 -3.33 -6.21 -4.36 -9.89 -8.44
Table A5.63: Earnings per Share Forecast Error 2015 2016 2017 2018 Number of observations 934 923 799 675 Mean (%) 0.96 -0.64 -0.04 1.21 Standard deviation (%) 5.70 4.66 4.26 3.33 Skewness 1.88 2.20 1.53 1.60 Kurtosis 7.60 14.15 10.42 6.50
Figure A5.21: Plots of Poland
Portugal Table A5.64: Coverage Indicators
Nano Micro
2015 2016 2017 2018 2015 2016 2017 2018 Coverage (%) 4.76 4.76 4.76 4.76 33.33 25.00 33.33 33.33 Reports per company 0.29 0.33 0.29 0.19 2.42 1.17 1.67 1.83 Reports per covered company 6.00 7.00 6.00 4.00 7.25 4.67 5.00 5.50 Brokers per company 0.05 0.05 0.05 0.05 0.67 0.25 0.33 0.33 Companies per broker 0.03 0.03 0.03 0.03 0.20 0.08 0.10 0.10
Small Non-SME
2015 2016 2017 2018 2015 2016 2017 2018 Coverage (%) 71.43 71.43 71.43 71.43 100.00 100.00 100.00 100.00 Reports per company 29.43 27.71 27.43 20.71 107.45 119.64 117.73 109.00 Reports per covered company 41.20 38.80 38.40 29.00 107.45 119.64 117.73 109.00 Brokers per company 3.00 3.00 2.86 2.71 10.64 11.09 10.82 11.09 Companies per broker 0.53 0.53 0.50 0.48 2.93 3.05 2.98 3.05
Table A5.65: Changes in Coverage Indicators (Percent) Nano Micro
2016 2017 2018 2016 2017 2018 Coverage 0.00 0.00 0.00 -25.00 33.33 0.00 Reports per company 16.67 -14.29 -33.33 -51.72 42.86 10.00 Reports per covered company 16.67 -14.29 -33.33 -35.63 7.14 10.00 Brokers per company 0.00 0.00 0.00 -62.50 33.33 0.00 Companies per broker 0.00 0.00 0.00 -62.50 33.33 0.00
Small Non-SME
2016 2017 2018 2016 2017 2018 Coverage 0.00 0.00 0.00 0.00 0.00 0.00 Reports per company -5.83 -1.03 -24.48 11.34 -1.60 -7.41 Reports per covered company -5.83 -1.03 -24.48 11.34 -1.60 -7.41 Brokers per company 0.00 -4.76 -5.00 4.27 -2.46 2.52 Companies per broker 0.00 -4.76 -5.00 4.27 -2.46 2.52
Table A5.66: Earnings per Share Forecast Error 2015 2016 2017 2018 Number of observations 325 368 368 266 Mean (%) -0.85 0.33 0.08 0.32 Standard deviation (%) 2.44 4.47 2.25 2.36 Skewness 0.28 2.95 2.52 -0.72 Kurtosis 2.61 19.92 14.04 7.84
Figure A5.22: Plots of Portugal
Romania Table A5.67: Coverage Indicators
Nano Micro
2015 2016 2017 2018 2015 2016 2017 2018 Coverage (%) 0.34 0.34 0.34 0.00 14.29 14.29 7.14 7.14 Reports per company 0.10 0.07 0.04 0.00 1.64 1.79 0.93 0.43 Reports per covered company 28.00 21.00 12.00 n.a. 11.50 12.50 13.00 6.00 Brokers per company 0.01 0.01 0.01 0.00 0.21 0.29 0.14 0.07 Companies per broker 0.27 0.27 0.18 0.00 0.27 0.36 0.18 0.09
Small Non-SME
2015 2016 2017 2018 2015 2016 2017 2018 Coverage (%) 36.36 36.36 36.36 36.36 100.00 100.00 100.00 100.00 Reports per company 10.64 9.45 8.09 2.64 43.40 34.60 31.80 22.40 Reports per covered company 29.25 26.00 22.25 7.25 43.40 34.60 31.80 22.40 Brokers per company 1.27 1.45 1.09 0.64 5.20 4.80 4.40 3.80 Companies per broker 1.27 1.45 1.09 0.64 2.36 2.18 2.00 1.73
Table A5.68: Changes in Coverage Indicators (Percent) Nano Micro
2016 2017 2018 2016 2017 2018 Coverage 0.00 0.00 -100.00 0.00 -50.00 0.00 Reports per company -25.00 -42.86 -100.00 8.70 -48.00 -53.85 Reports per covered company -25.00 -42.86 n.a. 8.70 4.00 -53.85 Brokers per company 0.00 -33.33 -100.00 33.33 -50.00 -50.00 Companies per broker 0.00 -33.33 -100.00 33.33 -50.00 -50.00
Small Non-SME
2016 2017 2018 2016 2017 2018 Coverage 0.00 0.00 0.00 0.00 0.00 0.00 Reports per company -11.11 -14.42 -67.42 -20.28 -8.09 -29.56 Reports per covered company -11.11 -14.42 -67.42 -20.28 -8.09 -29.56 Brokers per company 14.29 -25.00 -41.67 -7.69 -8.33 -13.64 Companies per broker 14.29 -25.00 -41.67 -7.69 -8.33 -13.64
Table A5.69: Earnings per Share Forecast Error 2015 2016 2017 2018 Number of observations 75 79 57 28 Mean (%) 0.63 -0.30 -2.71 -2.39 Standard deviation (%) 3.97 6.56 5.38 3.79 Skewness -0.73 2.44 0.93 0.20 Kurtosis 5.25 10.81 1.78 -1.38
Figure A5.23: Plots of Romania
Slovakia Table A5.70: Coverage Indicators
Nano Micro
2015 2016 2017 2018 2015 2016 2017 2018 Coverage (%) 2.78 2.78 0.00 0.00 0.00 0.00 0.00 0.00 Reports per company 0.08 0.31 0.00 0.00 0.00 0.00 0.00 0.00 Reports per covered company 3.00 11.00 n.a. n.a. n.a. n.a. n.a. n.a. Brokers per company 0.03 0.03 0.00 0.00 0.00 0.00 0.00 0.00 Companies per broker 1.00 1.00 0.00 0.00 0.00 0.00 0.00 0.00
Small Non-SME
2015 2016 2017 2018 2015 2016 2017 2018 Coverage (%) 0.00 0.00 0.00 0.00 0.00 0.00 0.00 0.00 Reports per company 0.00 0.00 0.00 0.00 0.00 0.00 0.00 0.00 Reports per covered company n.a. n.a. n.a. n.a. n.a. n.a. n.a. n.a. Brokers per company 0.00 0.00 0.00 0.00 0.00 0.00 0.00 0.00 Companies per broker 0.00 0.00 0.00 0.00 0.00 0.00 0.00 0.00
Table A5.71: Changes in Coverage Indicators (Percent) Nano Micro
2016 2017 2018 2016 2017 2018 Coverage 0.00 -100.00 n.a. n.a. n.a. n.a. Reports per company 266.67 -100.00 n.a. n.a. n.a. n.a. Reports per covered company 266.67 n.a. n.a. n.a. n.a. n.a. Brokers per company 0.00 -100.00 n.a. n.a. n.a. n.a. Companies per broker 0.00 -100.00 n.a. n.a. n.a. n.a.
Small Non-SME
2016 2017 2018 2016 2017 2018 Coverage n.a. n.a. n.a. n.a. n.a. n.a. Reports per company n.a. n.a. n.a. n.a. n.a. n.a. Reports per covered company n.a. n.a. n.a. n.a. n.a. n.a. Brokers per company n.a. n.a. n.a. n.a. n.a. n.a. Companies per broker n.a. n.a. n.a. n.a. n.a. n.a.
Table A5.72: Earnings per Share Forecast Error 2015 2016 2017 2018 Number of observations 1 n.a. n.a. n.a. Mean (%) 3.33 n.a. n.a. n.a. Standard deviation (%) n.a. n.a. n.a. n.a. Skewness n.a. n.a. n.a. n.a. Kurtosis n.a. n.a. n.a. n.a.
Figure A5.24: Plots of Slovakia
Slovenia Table A5.73: Coverage Indicators
Nano Micro
2015 2016 2017 2018 2015 2016 2017 2018 Coverage (%) 5.26 0.00 5.26 5.26 25.00 25.00 25.00 25.00 Reports per company 0.05 0.00 0.05 0.05 1.00 2.00 2.00 3.25 Reports per covered company 1.00 n.a. 1.00 1.00 4.00 8.00 8.00 13.00 Brokers per company 0.05 0.00 0.05 0.05 0.25 0.25 0.25 0.25 Companies per broker 0.11 0.00 0.11 0.11 0.11 0.11 0.11 0.11
Small Non-SME
2015 2016 2017 2018 2015 2016 2017 2018 Coverage (%) 71.43 71.43 71.43 71.43 100.00 100.00 100.00 100.00 Reports per company 8.00 13.57 12.29 8.14 49.00 71.00 40.00 55.00 Reports per covered company 11.20 19.00 17.20 11.40 49.00 71.00 40.00 55.00 Brokers per company 1.14 1.57 1.86 1.29 8.00 8.00 6.00 6.00 Companies per broker 0.89 1.22 1.44 1.00 0.89 0.89 0.67 0.67
Table A5.74: Changes in Coverage Indicators (Percent) Nano Micro
2016 2017 2018 2016 2017 2018 Coverage -100.00 n.a. 0.00 0.00 0.00 0.00 Reports per company -100.00 n.a. 0.00 100.00 0.00 62.50 Reports per covered company n.a. n.a. 0.00 100.00 0.00 62.50 Brokers per company -100.00 n.a. 0.00 0.00 0.00 0.00 Companies per broker -100.00 n.a. 0.00 0.00 0.00 0.00
Small Non-SME
2016 2017 2018 2016 2017 2018 Coverage 0.00 0.00 0.00 0.00 0.00 0.00 Reports per company 69.64 -9.47 -33.72 44.90 -43.66 37.50 Reports per covered company 69.64 -9.47 -33.72 44.90 -43.66 37.50 Brokers per company 37.50 18.18 -30.77 0.00 -25.00 0.00 Companies per broker 37.50 18.18 -30.77 0.00 -25.00 0.00
Table A5.75: Earnings per Share Forecast Error 2015 2016 2017 2018 Number of observations 28 36 37 29 Mean (%) 0.05 0.23 0.32 -1.40 Standard deviation (%) 1.62 3.01 3.36 1.33 Skewness 0.22 -0.87 -0.76 -0.82 Kurtosis -0.90 0.41 2.96 1.43
Figure A5.25: Plots of Slovenia
Spain Table A5.76: Coverage Indicators
Nano Micro
2015 2016 2017 2018 2015 2016 2017 2018 Coverage (%) 4.05 4.05 4.05 4.05 14.00 14.00 12.00 16.00 Reports per company 0.93 0.85 0.89 0.62 4.64 3.36 2.08 2.18 Reports per covered company 23.00 21.00 22.00 15.33 33.14 24.00 17.33 13.63 Brokers per company 0.12 0.12 0.11 0.08 0.68 0.56 0.38 0.38 Companies per broker 0.12 0.12 0.11 0.08 0.47 0.38 0.26 0.26
Small Non-SME
2015 2016 2017 2018 2015 2016 2017 2018 Coverage (%) 53.85 46.15 42.31 46.15 87.10 88.71 88.71 88.71 Reports per company 40.50 36.96 32.23 34.46 142.50 150.52 143.85 140.16 Reports per covered company 75.21 80.08 76.18 74.67 163.61 169.67 162.16 158.00 Brokers per company 4.38 4.42 4.08 3.92 14.69 15.37 14.81 14.48 Companies per broker 1.56 1.58 1.45 1.40 12.48 13.05 12.58 12.30
Table A5.77: Changes in Coverage Indicators (Percent) Nano Micro
2016 2017 2018 2016 2017 2018 Coverage 0.00 0.00 0.00 0.00 -14.29 33.33 Reports per company -8.70 4.76 -30.30 -27.59 -38.10 4.81 Reports per covered company -8.70 4.76 -30.30 -27.59 -27.78 -21.39 Brokers per company 0.00 -11.11 -25.00 -17.65 -32.14 0.00 Companies per broker 0.00 -11.11 -25.00 -17.65 -32.14 0.00
Small Non-SME
2016 2017 2018 2016 2017 2018 Coverage -14.29 -8.33 9.09 1.85 0.00 0.00 Reports per company -8.74 -12.80 6.92 5.63 -4.43 -2.57 Reports per covered company 6.47 -4.87 -1.99 3.70 -4.43 -2.57 Brokers per company 0.88 -7.83 -3.77 4.61 -3.67 -2.18 Companies per broker 0.88 -7.83 -3.77 4.61 -3.67 -2.18
Table A5.78: Earnings per Share Forecast Error 2015 2016 2017 2018 Number of observations 2,362 2,632 2,532 2,218 Mean (%) 0.86 0.80 0.67 0.65 Standard deviation (%) 3.23 5.31 3.50 2.41 Skewness 1.58 3.79 3.86 3.07 Kurtosis 13.58 21.60 21.64 15.35
Figure A5.26: Plots of Spain
Sweden Table A5.79: Coverage Indicators
Nano Micro
2015 2016 2017 2018 2015 2016 2017 2018 Coverage (%) 11.36 11.04 9.74 11.04 38.89 36.67 38.89 37.78 Reports per company 1.25 1.09 1.01 1.21 5.60 5.66 5.74 7.07 Reports per covered company 11.03 9.91 10.33 10.94 14.40 15.42 14.77 18.71 Brokers per company 0.15 0.12 0.12 0.14 0.53 0.47 0.54 0.58 Companies per broker 0.68 0.58 0.55 0.65 0.73 0.64 0.74 0.79
Small Non-SME
2015 2016 2017 2018 2015 2016 2017 2018 Coverage (%) 58.62 62.07 62.07 68.97 90.00 92.86 92.86 92.86 Reports per company 15.79 17.61 17.47 19.49 135.40 140.69 128.44 116.84 Reports per covered company 26.94 28.37 28.15 28.27 150.44 151.51 138.32 125.83 Brokers per company 1.28 1.30 1.54 1.59 9.54 9.70 9.40 8.37 Companies per broker 1.68 1.71 2.03 2.09 10.12 10.29 9.97 8.88
Table A5.80: Changes in Coverage Indicators (Percent) Nano Micro
2016 2017 2018 2016 2017 2018 Coverage -2.86 -11.76 13.33 -5.71 6.06 -2.86 Reports per company -12.69 -8.01 20.00 0.99 1.57 23.02 Reports per covered company -10.13 4.25 5.88 7.11 -4.23 26.64 Brokers per company -15.56 -5.26 19.44 -12.50 16.67 6.12 Companies per broker -15.56 -5.26 19.44 -12.50 16.67 6.12
Small Non-SME
2016 2017 2018 2016 2017 2018 Coverage 5.88 0.00 11.11 3.17 0.00 0.00 Reports per company 11.50 -0.78 11.58 3.90 -8.70 -9.03 Reports per covered company 5.30 -0.78 0.42 0.71 -8.70 -9.03 Brokers per company 1.80 18.58 2.99 1.65 -3.09 -10.94 Companies per broker 1.80 18.58 2.99 1.65 -3.09 -10.94
Table A5.81: Earnings per Share Forecast Error 2015 2016 2017 2018 Number of observations 2,808 3,045 2,909 2,684 Mean (%) 1.02 0.03 0.31 0.45 Standard deviation (%) 3.60 3.05 3.32 2.76 Skewness 2.91 0.35 3.30 2.72 Kurtosis 16.00 20.18 19.55 17.63
Figure A5.27: Plots of Sweden
United Kingdom Table A5.82: Coverage Indicators
Nano Micro
2015 2016 2017 2018 2015 2016 2017 2018 Coverage (%) 40.25 38.19 37.17 35.52 55.51 56.27 59.70 57.41 Reports per company 3.56 3.56 3.40 3.37 10.11 10.01 11.29 9.70 Reports per covered company 8.86 9.32 9.15 9.50 18.21 17.78 18.91 16.89 Brokers per company 0.68 0.64 0.59 0.57 1.50 1.47 1.55 1.41 Companies per broker 2.08 1.94 1.80 1.74 2.46 2.41 2.54 2.32
Small Non-SME
2015 2016 2017 2018 2015 2016 2017 2018 Coverage (%) 61.97 62.32 62.32 61.27 86.97 86.59 86.59 86.59 Reports per company 30.19 31.63 33.17 33.14 146.11 152.31 149.92 142.07 Reports per covered company 48.71 50.75 53.23 54.10 167.99 175.90 173.13 164.08 Brokers per company 3.44 3.44 3.51 3.58 12.88 12.93 12.61 12.56 Companies per broker 6.11 6.11 6.24 6.36 21.01 21.09 20.56 20.49
Table A5.83: Changes in Coverage Indicators (Percent) Nano Micro
2016 2017 2018 2016 2017 2018 Coverage -5.10 -2.69 -4.42 1.37 6.08 -3.82 Reports per company -0.17 -4.44 -0.79 -0.98 12.80 -14.08 Reports per covered company 5.19 -1.80 3.80 -2.32 6.34 -10.66 Brokers per company -6.91 -7.10 -3.13 -2.03 5.44 -8.85 Companies per broker -6.91 -7.10 -3.13 -2.03 5.44 -8.85
Small Non-SME
2016 2017 2018 2016 2017 2018 Coverage 0.57 0.00 -1.69 -0.44 0.00 0.00 Reports per company 4.78 4.88 -0.08 4.25 -1.57 -5.23 Reports per covered company 4.19 4.88 1.64 4.71 -1.57 -5.23 Brokers per company 0.00 2.04 2.00 0.36 -2.49 -0.36 Companies per broker 0.00 2.04 2.00 0.36 -2.49 -0.36
Table A5.84: Earnings per Share Forecast Error 2015 2016 2017 2018 Number of observations 12,567 13,813 13,958 12,905 Mean (%) -0.10 0.16 0.04 0.14 Standard deviation (%) 1.34 2.30 1.49 1.57 Skewness -1.99 5.88 3.04 6.25 Kurtosis 87.26 78.61 87.98 83.17
Figure A5.28: Plots of United Kingdom
Regional Yearly Coverage Indicators
Table A5.85: Yearly Coverage Indicators for EU Regions and US Nano Micro Small Non-SME 2015 2016 2017 2018 2015 2016 2017 2018 2015 2016 2017 2018 2015 2016 2017 2018 IBES Coverage (percent) EU 14.5 13.9 12.9 12.2 44.6 44.3 45.6 44.7 63.3 63.7 64.5 65.2 89.0 89.0 89.1 89.1 EU excl. UK 10.0 9.7 8.8 8.3 41.1 40.4 41.1 40.7 63.8 64.2 65.4 66.8 89.6 89.8 89.9 89.9 Eastern Europe 3.5 3.5 3.2 2.7 33.1 29.2 28.6 28.6 51.5 51.5 54.5 55.4 84.4 86.7 86.7 86.7 Western Europe 32.1 31.2 29.4 28.0 53.4 54.2 56.8 55.5 66.3 67.1 66.7 66.3 88.1 87.7 88.1 88.3 Southern Europe 5.5 4.8 4.8 4.0 29.5 29.0 27.8 26.7 53.7 52.8 56.9 57.7 91.1 91.1 91.1 91.1 Northern Europe 16.3 15.1 13.6 13.6 45.9 45.6 47.6 47.0 66.5 66.9 67.7 70.4 90.3 90.7 90.3 90.0 United States 6.4 5.6 5.1 5.1 33.2 31.6 33.3 34.6 59.4 60.6 61.0 61.2 93.3 93.1 93.1 93.1 IBES Reports per Company EU 1.6 1.5 1.4 1.3 8.2 8.0 8.2 7.7 26.0 26.3 26.5 25.9 141.8 149.6 146.6 141.2 EU excl. UK 1.3 1.2 1.1 1.0 7.6 7.3 7.2 7.1 24.3 24.2 23.8 22.9 140.4 148.7 145.4 141.0 Eastern Europe 0.3 0.3 0.2 0.2 3.3 2.8 3.1 2.4 14.2 13.7 12.1 10.1 86.8 79.5 66.4 58.9 Western Europe 3.4 3.3 3.2 3.0 9.7 9.8 10.5 9.6 28.6 29.6 30.6 29.8 141.2 150.1 149.9 143.3 Southern Europe 0.7 0.5 0.5 0.3 5.7 4.8 4.0 3.6 21.1 19.9 19.7 17.9 118.6 126.5 121.5 117.8 Northern Europe 2.1 2.1 1.8 1.8 10.0 9.7 9.7 9.9 27.8 28.0 27.3 28.2 166.9 174.6 168.4 165.2 United States 2.3 2.1 1.5 1.5 12.7 11.9 11.0 11.6 34.6 35.6 34.8 35.2 141.8 152.0 153.2 158.1 IBES Reports per Covered Company EU 11.0 11.1 11.1 11.0 18.4 18.0 18.0 17.2 41.0 41.3 41.0 39.7 159.4 168.2 164.6 158.6 EU excl. UK 12.6 12.3 12.6 12.1 18.5 18.1 17.5 17.4 38.0 37.6 36.3 34.3 156.6 165.6 161.8 156.8 Eastern Europe 8.3 7.5 7.5 7.0 9.9 9.5 11.0 8.3 27.6 26.5 22.2 18.3 102.8 91.7 76.6 67.9 Western Europe 10.6 10.7 10.9 10.8 18.1 18.0 18.5 17.4 43.1 44.0 45.8 44.9 160.3 171.1 170.2 162.4 Southern Europe 12.7 11.2 10.4 7.7 19.3 16.5 14.5 13.3 39.3 37.7 34.7 31.0 130.2 138.9 133.4 129.3 Northern Europe 12.8 13.6 13.3 13.6 21.8 21.4 20.3 21.1 41.7 41.8 40.3 40.0 184.7 192.4 186.4 183.6 United States 35.9 37.2 30.1 28.6 38.2 37.7 32.9 33.6 58.2 58.7 57.1 57.6 152.0 163.2 164.6 169.8 IBES Brokers per Company EU 0.2 0.2 0.2 0.2 1.1 1.0 1.0 1.0 2.8 2.8 2.8 2.8 12.4 12.7 12.4 12.2 EU excl. UK 0.2 0.2 0.1 0.1 0.9 0.9 0.9 0.9 2.6 2.5 2.6 2.5 12.3 12.6 12.3 12.1 Eastern Europe 0.1 0.0 0.1 0.0 0.5 0.5 0.5 0.4 2.0 2.0 1.9 1.7 9.0 8.7 7.9 7.0 Western Europe 0.5 0.5 0.5 0.4 1.3 1.3 1.3 1.3 3.1 3.2 3.2 3.2 12.5 12.7 12.5 12.5 Southern Europe 0.1 0.1 0.1 0.1 0.7 0.6 0.6 0.5 2.5 2.4 2.4 2.3 11.7 12.2 11.8 11.6 Northern Europe 0.3 0.2 0.2 0.2 1.1 1.1 1.1 1.2 2.7 2.6 2.7 2.7 13.3 13.6 13.3 13.0 United States 0.2 0.2 0.2 0.1 1.3 1.2 1.2 1.2 3.4 3.4 3.4 3.3 12.6 12.9 13.2 13.1 IBES Companies per Broker EU 0.6 0.5 0.5 0.5 0.8 0.8 0.8 0.8 2.0 2.0 2.0 2.0 9.0 9.2 9.0 8.9 EU excl. UK 0.4 0.3 0.3 0.3 0.6 0.6 0.6 0.6 1.4 1.4 1.4 1.4 7.5 7.7 7.6 7.4 Eastern Europe 0.6 0.5 0.6 0.5 0.7 0.6 0.7 0.6 1.7 1.7 1.6 1.5 3.5 3.4 3.1 2.7 Western Europe 0.6 0.6 0.6 0.5 0.8 0.8 0.8 0.8 2.1 2.1 2.1 2.1 9.3 9.4 9.3 9.3 Southern Europe 0.2 0.1 0.1 0.1 0.5 0.4 0.4 0.4 1.2 1.2 1.2 1.1 7.3 7.6 7.3 7.2 Northern Europe 0.7 0.6 0.5 0.5 1.2 1.1 1.2 1.2 2.5 2.4 2.5 2.5 12.2 12.5 12.2 11.9 United States 5.5 4.6 3.7 3.3 6.5 5.8 5.7 5.7 19.5 19.5 19.2 18.8 96.4 98.7 100.3 99.7 Note: Calculations are based on fixed broker and company samples.
Table A5.86: Year-on-year Changes of Coverage Indicators for EU and US Nano Micro Small Non-SME 2016 2017 2018 2016 2017 2018 2016 2017 2018 2016 2017 2018 IBES Coverage EU -4.2 -6.7 -5.3 -0.8 3.1 -2.0 0.6 1.3 1.1 0.0 0.1 0.0 EU excl. UK -3.5 -9.5 -6.0 -1.8 1.8 -1.2 0.7 1.8 2.2 0.1 0.1 0.0 Eastern Europe 0.0 -6.8 -17.1 -11.8 -2.2 0.0 0.0 5.8 1.8 2.6 0.0 0.0 Western Europe -2.7 -5.9 -4.8 1.6 4.8 -2.3 1.2 -0.6 -0.6 -0.4 0.4 0.2 Southern Europe -13.6 0.0 -15.8 -1.9 -3.9 -4.1 -1.5 7.7 1.4 0.0 0.0 0.0 Northern Europe -7.5 -9.9 0.0 -0.7 4.4 -1.4 0.6 1.1 4.0 0.4 -0.4 -0.4 United States -13.0 -7.7 -1.2 -4.8 5.4 3.9 1.9 0.7 0.3 -0.1 -0.1 0.1 IBES Reports per Company EU -3.6 -6.4 -6.5 -3.0 3.0 -6.1 1.3 0.6 -2.2 5.5 -2.0 -3.6 EU excl. UK -5.3 -7.4 -9.5 -3.8 -1.2 -2.1 -0.4 -1.7 -3.4 5.9 -2.2 -3.1 Eastern Europe -9.3 -6.9 -22.4 -15.1 13.3 -24.6 -3.9 -11.5 -16.3 -8.5 -16.4 -11.3 Western Europe -1.9 -3.9 -6.5 1.0 7.8 -8.4 3.3 3.5 -2.5 6.3 -0.2 -4.4 Southern Europe -24.3 -7.1 -37.6 -16.0 -15.7 -11.6 -5.4 -1.1 -9.2 6.7 -3.9 -3.1 Northern Europe -2.0 -11.4 1.7 -2.6 -0.5 2.4 0.7 -2.4 3.2 4.6 -3.6 -1.9 United States -10.0 -25.4 -6.1 -6.3 -7.9 5.9 2.8 -2.1 1.1 7.2 0.8 3.2 IBES Reports per Covered Company EU 0.6 0.3 -1.2 -2.2 -0.1 -4.1 0.7 -0.7 -3.3 5.5 -2.1 -3.6 EU excl. UK -1.8 2.2 -3.7 -2.1 -3.0 -0.9 -1.1 -3.4 -5.5 5.8 -2.3 -3.1 Eastern Europe -9.3 -0.1 -6.4 -3.8 15.9 -24.6 -3.9 -16.3 -17.8 -10.8 -16.4 -11.3 Western Europe 0.9 2.2 -1.7 -0.6 2.9 -6.3 2.1 4.1 -1.9 6.8 -0.6 -4.6 Southern Europe -12.3 -7.1 -25.9 -14.3 -12.3 -7.8 -3.9 -8.1 -10.5 6.7 -3.9 -3.1 Northern Europe 6.0 -1.7 1.7 -1.8 -4.7 3.9 0.2 -3.5 -0.7 4.2 -3.1 -1.5 United States 3.5 -19.2 -5.0 -1.5 -12.6 1.9 0.9 -2.8 0.8 7.3 0.8 3.2 IBES Brokers per Company EU -8.6 -7.7 -5.7 -3.7 2.3 -3.0 -0.4 0.9 -0.3 2.1 -2.2 -1.4 EU excl. UK -9.7 -8.2 -7.7 -4.6 0.6 0.3 -0.6 0.3 -1.6 2.7 -2.2 -1.8 Eastern Europe -8.8 3.2 -18.8 -7.7 8.3 -14.1 -0.5 -4.1 -11.6 -3.0 -9.2 -11.8 Western Europe -5.6 -8.1 -4.8 -1.3 2.8 -5.0 0.8 1.2 0.8 2.0 -1.6 -0.4 Southern Europe -20.0 -6.3 -20.0 -12.4 -8.8 -9.7 -2.3 -2.3 -4.8 4.1 -3.1 -2.0 Northern Europe -13.6 -11.1 0.0 -3.9 3.7 5.4 -2.0 3.2 2.1 1.9 -2.3 -2.2 United States -15.8 -19.1 -12.5 -10.3 -2.5 1.0 0.0 -1.2 -2.5 2.3 1.7 -0.6 IBES Companies per Broker EU -8.6 -7.7 -5.7 -3.7 2.3 -3.0 -0.4 0.9 -0.3 2.1 -2.2 -1.4 EU excl. UK -9.7 -8.2 -7.7 -4.6 0.6 0.3 -0.6 0.3 -1.6 2.7 -2.2 -1.8 Eastern Europe -8.8 3.2 -18.8 -7.7 8.3 -14.1 -0.5 -4.1 -11.6 -3.0 -9.2 -11.8 Western Europe -5.6 -8.1 -4.8 -1.3 2.8 -5.0 0.8 1.2 0.8 2.0 -1.6 -0.4 Southern Europe -20.0 -6.3 -20.0 -12.4 -8.8 -9.7 -2.3 -2.3 -4.8 4.1 -3.1 -2.0 Northern Europe -13.6 -11.1 0.0 -3.9 3.7 5.4 -2.0 3.2 2.1 1.9 -2.3 -2.2 United States -15.8 -19.1 -12.5 -10.3 -2.5 1.0 0.0 -1.2 -2.5 2.3 1.7 -0.6 Note: All changes are in percentages. Calculations are based on fixed broker and company samples.
Annex 6: Regressions with US Companies
Regressions for number of reports per company Table A6.1: Regression for Number of Reports per Company Nano Micro Small Non-SME Coeff. t-stat. Coeff. t-stat. Coeff. t-stat. Coeff. t-stat. United States 1.62 8.55 ** 10.22 16.37 ** 33.32 25.59 ** 150.11 48.32 ** Time and United States -0.38 -14.42 ** -0.86 -16.01 ** 0.12 0.84 5.69 6.17 ** 2018 and United States 0.30 6.93 ** 1.34 10.55 ** -1.49 -3.53 ** -4.18 -1.98 * Western Europe 3.56 12.77 ** 11.51 19.70 ** 31.84 16.08 ** 148.46 34.92 ** Time and Western Europe -0.10 -5.02 ** 0.43 7.03 ** 0.99 7.86 ** 4.36 5.39 ** 2018 and Western Europe -0.13 -3.05 ** -1.42 -14.56 ** -2.36 -9.02 ** -14.19 -8.60 ** Northern Europe 2.16 9.17 ** 10.99 14.03 ** 29.46 14.84 ** 168.24 23.69 ** Time and Northern Europe -0.13 -7.47 ** -0.15 -2.78 ** -0.23 -1.46 0.97 1.00 2018 and Northern Europe 0.13 2.92 ** 0.17 1.62 0.07 0.19 -7.97 -4.60 ** Southern Europe 0.87 6.65 ** 5.83 7.46 ** 21.48 7.70 ** 122.81 17.07 ** Time and Southern Europe -0.11 -3.64 ** -0.82 -7.20 ** -0.67 -3.11 ** 1.47 1.53 2018 and Southern Europe -0.06 -2.71 ** 0.28 2.68 ** -1.12 -2.34 * -8.31 -5.13 ** Eastern Europe 0.62 9.56 ** 4.51 9.29 ** 14.50 9.01 ** 72.03 10.48 ** Time and Eastern Europe -0.02 -7.44 ** -0.06 -0.67 -1.06 -4.92 ** -10.13 -11.62 ** 2018 and Eastern Europe -0.03 -7.77 ** -0.65 -8.43 ** -1.56 -5.01 ** 0.34 0.27 US and Growth industry 5.16 5.66 ** 19.76 6.87 ** 26.36 6.54 ** 19.21 1.94 EU and Growth industry 1.12 3.23 ** 1.88 1.59 -2.36 -0.80 16.57 1.16 2018 and US Growth industry -0.61 -4.23 ** 1.06 6.41 ** 11.95 32.14 ** 15.27 7.48 ** 2018 and EU Growth industry 0.07 1.45 1.40 12.74 ** 5.43 11.21 ** 19.01 12.83 ** Number of observations 32,952 8,348 8,568 10,352 R-squared 0.013 0.063 0.035 0.016 Adjusted R-squared 0.012 0.061 0.033 0.015 Note: The regressions are estimated using Ordinary Least Squares. Standard errors are robust to time-specific clusters and company-specific clusters. Regressions are conducted on companies in four different size categories, based on their market capitalisation in February
2019. All independent variables except the region dummies are demeaned. T-statistics which indicate 0.05 and 0.01 significance levels are highlighted with * and **.
Table A6.2: 2SLS Regression for Number of Reports per Company Nano Micro Small Non-SME Coeff. t-stat. Coeff. t-stat. Coeff. t-stat. Coeff. t-stat. United States 11.11 4.62 ** 14.12 13.63 ** 34.48 25.54 ** 155.77 49.01 ** Time and United States -2.68 -5.24 ** -1.71 -3.67 ** -1.13 -2.32 * 5.48 8.37 ** 2018 and United States 1.96 2.29 * 2.36 2.87 ** -0.94 -1.15 -6.65 -5.00 ** Western Europe 3.17 8.58 ** 10.92 15.50 ** 31.99 14.46 ** 148.02 31.26 ** Time and Western Europe -0.24 -2.56 * 0.04 0.14 -0.32 -0.59 1.35 1.12 2018 and Western Europe 0.14 0.79 -0.28 -0.48 0.01 0.01 -9.00 -3.89 ** Northern Europe 2.13 7.06 ** 11.95 12.36 ** 29.88 14.03 ** 157.83 20.34 ** Time and Northern Europe -0.29 -2.42 * -0.39 -1.35 0.91 1.11 8.02 4.69 ** 2018 and Northern Europe 0.34 1.60 0.99 1.64 0.06 0.04 -17.95 -5.47 ** Southern Europe 1.45 7.31 ** 5.84 5.70 ** 23.95 7.08 ** 110.74 13.15 ** Time and Southern Europe -0.19 -2.62 ** -1.80 -3.74 ** -1.32 -1.41 9.18 3.58 ** 2018 and Southern Europe 0.13 0.97 1.78 1.74 -2.89 -1.34 -14.37 -3.29 ** Eastern Europe 1.38 9.88 ** 8.00 10.06 ** 25.71 8.90 ** 91.67 11.63 ** Time and Eastern Europe -0.03 -0.89 -0.44 -1.29 -1.85 -2.12 * -4.33 -1.26 2018 and Eastern Europe 0.07 0.99 -0.08 -0.14 0.63 0.31 -0.85 -0.12 US and Growth industry 13.18 3.04 ** 22.73 5.56 ** 15.73 4.15 ** 11.22 1.19 EU and Growth industry 0.66 1.51 -1.17 -0.90 -9.23 -2.73 ** 18.20 1.16 2018 and US Growth industry -0.21 -0.10 0.42 0.14 12.72 4.44 ** 13.85 3.50 ** 2018 and EU Growth industry -0.02 -0.09 1.98 2.25 * 2.64 1.19 17.50 2.93 ** Increased number of shares 2.30 3.98 ** 4.17 5.51 ** 6.48 4.71 ** -23.18 -6.11 ** Volume 1.85 3.19 ** 13.67 6.16 ** 46.47 8.64 ** 94.41 12.87 ** Number of observations 15,108 6,992 8,180 10,212 R-squared 0.085 0.169 0.237 0.123 Adjusted R-squared 0.084 0.167 0.235 0.121 Note: All variables except for region dummy variables are demeaned. Regressions are estimated by Two Stage Least Squares (2SLS) model, in which volume is the endogenous variable and its one-year lagged observation is the instrumental variable. Robust standard errors are estimated, and clustered by equities. T-statistics which indicate 0.05 and 0.01 significance levels are highlighted with * and **.
Regressions for whether a company is covered Table A6.3: Logistic Regression for Whether a Company is Covered Nano Micro Small Non-SME Coeff. t-stat. Coeff. t-stat. Coeff. t-stat. Coeff. t-stat. United States -3.07 -73.58 ** -0.77 -18.02 ** 0.43 11.78 ** 2.60 45.77 ** Time and United States -0.12 -2.66 ** 0.00 0.05 0.03 0.78 -0.01 -0.07 2018 and United States 0.12 0.89 0.09 0.69 -0.04 -0.37 0.01 0.07 Western Europe -0.81 -15.15 ** 0.26 4.22 ** 0.74 11.96 ** 2.01 23.29 ** Time and Western Europe -0.07 -1.28 0.07 1.07 0.00 0.07 0.00 0.00 2018 and Western Europe -0.03 -0.21 -0.13 -0.77 -0.05 -0.31 0.02 0.09 Northern Europe -1.82 -24.00 ** -0.12 -1.52 0.72 8.11 ** 2.23 15.99 ** Time and Northern Europe -0.10 -1.41 0.03 0.42 0.03 0.28 0.00 0.00 2018 and Northern Europe 0.08 0.39 -0.08 -0.34 0.07 0.30 -0.06 -0.17 Southern Europe -2.95 -18.33 ** -0.89 -7.88 ** 0.32 2.64 ** 2.36 12.55 ** Time and Southern Europe -0.08 -0.50 -0.04 -0.36 0.07 0.51 0.00 0.00 2018 and Southern Europe -0.05 -0.10 -0.01 -0.03 0.00 -0.01 0.00 -0.01 Eastern Europe -3.28 -32.23 ** -0.80 -6.75 ** 0.18 1.34 1.71 6.11 ** Time and Eastern Europe -0.04 -0.33 -0.11 -0.87 0.06 0.43 0.08 0.29 2018 and Eastern Europe -0.18 -0.61 0.12 0.38 -0.02 -0.05 -0.11 -0.15 US and Growth industry 1.67 21.71 ** 1.13 10.59 ** 1.23 9.35 ** 0.48 2.34 * EU and Growth industry 0.95 11.37 ** 0.68 6.26 ** 0.97 6.54 ** 0.45 1.88 2018 and US Growth industry 0.01 0.08 -0.03 -0.13 0.14 0.52 0.00 -0.01 2018 and EU Growth industry 0.09 0.53 0.17 0.77 0.32 1.00 0.11 0.23 Number of observations 32,952 8,348 8,568 10,352 Pseudo R-squared 0.143 0.049 0.025 0.013 Note: The Logistic regression is conducted for a binary variable taking value 1 only if a company received forecast coverage within a certain year and value 0 otherwise. Regressions are conducted on companies in four different size categories, based on their market capitalisation in February 2019. Pseudo R-square is estimated based on log likelihood function. All independent variables except the region dummies are demeaned. T-statistics which indicate 0.05 and 0.01 significance levels are highlighted with * and **.
Regressions for number of brokers per company Table A6.4: Regression for Number of Brokers per Company Nano Micro Small Non-SME Coeff. t-stat. Coeff. t-stat. Coeff. t-stat. Coeff. t-stat. United States 0.16 14.54 ** 1.11 18.32 ** 3.28 31.58 ** 12.87 64.09 ** Time and United States -0.04 -20.78 ** -0.08 -9.99 ** -0.02 -2.09 * 0.26 15.69 ** 2018 and United States 0.03 8.26 ** 0.08 5.81 ** -0.15 -5.64 ** -0.53 -8.70 ** Western Europe 0.51 17.22 ** 1.41 20.99 ** 3.31 20.98 ** 12.63 42.66 ** Time and Western Europe -0.04 -15.90 ** 0.01 1.82 0.03 3.29 ** 0.02 0.73 2018 and Western Europe 0.01 2.15 * -0.09 -8.87 ** -0.06 -2.23 * -0.21 -3.12 ** Northern Europe 0.23 9.89 ** 1.19 14.23 ** 2.79 15.04 ** 13.32 26.19 ** Time and Northern Europe -0.03 -12.13 ** 0.00 -0.37 0.02 1.19 -0.03 -0.83 2018 and Northern Europe 0.03 8.12 ** 0.05 3.34 ** -0.02 -0.54 -0.40 -4.43 ** Southern Europe 0.11 6.34 ** 0.72 8.48 ** 2.51 8.59 ** 11.99 20.71 ** Time and Southern Europe -0.01 -5.49 ** -0.07 -8.25 ** -0.06 -2.91 ** 0.05 1.10 2018 and Southern Europe 0.00 0.27 0.02 1.25 -0.07 -1.38 -0.47 -4.66 ** Eastern Europe 0.08 10.71 ** 0.60 9.56 ** 2.02 9.13 ** 8.29 12.22 ** Time and Eastern Europe 0.00 -2.96 ** 0.00 0.00 -0.04 -1.91 -0.52 -8.01 ** 2018 and Eastern Europe -0.01 -5.31 ** -0.07 -7.88 ** -0.23 -6.39 ** -0.54 -5.14 ** US and Growth industry 0.48 7.35 ** 1.42 6.44 ** 1.83 5.91 ** 1.80 2.59 ** EU and Growth industry 0.20 5.42 ** 0.28 2.45 * -0.20 -0.81 -0.04 -0.04 2018 and US Growth industry -0.08 -12.34 ** 0.21 10.95 ** 0.67 24.01 ** 1.45 38.89 ** 2018 and EU Growth industry 0.02 3.24 ** 0.16 14.12 ** 0.50 14.13 ** 0.73 6.45 ** Number of observations 32,952 8,348 8,568 10,352 R-squared 0.034 0.047 0.025 0.010 Adjusted R-squared 0.033 0.045 0.023 0.009 Note: The regressions are estimated using Ordinary Least Squares. Standard errors are robust to time-specific clusters and company-specific clusters. Regressions are conducted on companies in four different size categories, based on their market capitalisation in February
2019. All independent variables except the region dummies are demeaned. T-statistics which indicate 0.05 and 0.01 significance levels are highlighted with * and **.
Table A6.5: 2SLS Regression for Number of Brokers per Company Nano Micro Small Non-SME Coeff. t-stat. Coeff. t-stat. Coeff. t-stat. Coeff. t-stat. United States 1.05 8.39 ** 1.54 16.05 ** 3.40 31.99 ** 13.36 60.12 ** Time and United States -0.24 -5.85 ** -0.17 -4.69 ** -0.14 -3.85 ** 0.25 5.54 ** 2018 and United States 0.15 2.33 * 0.16 2.81 ** -0.10 -1.55 -0.76 -8.68 ** Western Europe 0.47 13.63 ** 1.34 17.48 ** 3.33 19.58 ** 12.60 38.64 ** Time and Western Europe -0.05 -4.50 ** -0.03 -1.13 -0.08 -1.77 -0.21 -2.62 ** 2018 and Western Europe 0.04 1.89 0.02 0.37 0.14 1.56 0.18 1.19 Northern Europe 0.23 7.94 ** 1.29 12.77 ** 2.85 13.98 ** 12.42 21.70 ** Time and Northern Europe -0.05 -4.38 ** -0.03 -0.84 0.11 1.70 0.50 4.34 ** 2018 and Northern Europe 0.05 2.73 ** 0.13 1.99 * -0.01 -0.07 -1.15 -5.15 ** Southern Europe 0.17 7.69 ** 0.72 6.58 ** 2.76 7.88 ** 10.98 16.17 ** Time and Southern Europe -0.02 -2.41 * -0.17 -3.53 ** -0.11 -1.19 0.62 3.30 ** 2018 and Southern Europe 0.02 1.24 0.16 1.54 -0.23 -1.21 -0.94 -2.99 ** Eastern Europe 0.17 12.24 ** 0.95 10.22 ** 3.03 9.51 ** 9.62 12.37 ** Time and Eastern Europe 0.00 -0.49 -0.04 -1.06 -0.11 -1.46 -0.08 -0.30 2018 and Eastern Europe 0.00 0.36 -0.01 -0.19 -0.04 -0.26 -0.64 -1.15 US and Growth industry 1.23 4.33 ** 1.50 4.97 ** 0.83 2.76 ** 1.23 1.70 EU and Growth industry 0.15 3.40 ** -0.02 -0.18 -0.82 -2.90 ** 0.14 0.13 2018 and US Growth industry -0.12 -0.72 0.19 1.02 0.70 3.31 ** 1.38 5.44 ** 2018 and EU Growth industry 0.01 0.20 0.22 2.37 * 0.27 1.47 0.63 1.74 Increased number of shares 0.25 6.88 ** 0.44 5.68 ** 0.70 5.69 ** -2.16 -7.82 ** Volume 0.18 3.54 ** 1.36 6.64 ** 3.95 9.52 ** 7.04 13.77 ** Number of observations 15,108 6,992 8,180 10,212 R-squared 0.166 0.148 0.239 0.121 Adjusted R-squared 0.165 0.145 0.238 0.120 Note: All variables except for region dummy variables are demeaned. Regressions are estimated by Two Stage Least Squares (2SLS) model, in which volume is the endogenous variable and its one-year lagged observation is the instrumental variable. Robust standard errors are estimated, and clustered by equities. T-statistics which indicate 0.05 and 0.01 significance levels are highlighted with * and **.
Regressions for forecast accuracy Table A6.6: Regression for Absolute Forecast Error Nano Micro Small Non-SME Coeff. t-stat. Coeff. t-stat. Coeff. t-stat. Coeff. t-stat. United States 5.75 12.36 ** 3.78 13.47 ** 2.61 9.40 ** 0.99 16.69 ** Time and United States 1.11 3.50 ** 0.25 0.79 -0.04 -0.14 -0.02 -0.36 2018 and United States -1.00 -0.92 0.16 0.25 -0.33 -0.53 0.01 0.08 Western Europe 2.94 5.73 ** 2.22 7.54 ** 1.46 7.05 ** 0.80 9.05 ** Time and Western Europe 0.13 0.64 0.01 0.16 0.08 0.84 -0.07 -1.64 2018 and Western Europe -1.56 -2.64 ** 0.13 0.80 -0.41 -1.57 -0.01 -0.14 Northern Europe 5.54 8.14 ** 3.57 11.41 ** 2.44 16.31 ** 1.54 13.75 ** Time and Northern Europe -0.79 -1.39 -0.57 -4.50 ** -0.52 -3.45 ** -0.06 -1.85 2018 and Northern Europe 3.26 3.37 ** 0.85 3.26 ** 0.45 3.73 ** -0.28 -6.28 ** Southern Europe 12.78 3.06 ** 6.41 8.03 ** 3.19 6.20 ** 1.82 9.07 ** Time and Southern Europe 0.52 0.26 -1.67 -2.57 * -0.55 -2.91 ** -0.23 -1.60 2018 and Southern Europe -7.49 -1.36 0.60 0.65 1.32 3.37 ** -0.24 -0.70 Eastern Europe 4.97 2.95 ** 4.24 8.06 ** 3.05 9.63 ** 2.13 8.65 ** Time and Eastern Europe 1.28 1.73 -0.19 -0.78 -0.36 -1.12 -0.33 -2.85 ** 2018 and Eastern Europe -0.29 -0.12 -1.46 -1.69 0.06 0.14 0.03 0.52 US and Growth industry 0.02 0.04 1.20 2.51 * 0.70 3.03 ** -0.18 -2.54 * EU and Growth industry -0.32 -0.33 -0.15 -0.45 -0.38 -1.28 -0.49 -3.73 ** 2018 and US Growth industry 0.75 1.22 -1.06 -2.80 ** -0.01 -0.06 -0.18 -14.78 ** 2018 and EU Growth industry 0.51 0.69 -0.54 -9.81 ** 0.62 4.10 ** 0.44 7.42 ** Number of observations 10,995 20,798 71,931 409,156 R-squared 0.088 0.066 0.030 0.020 Adjusted R-squared 0.086 0.065 0.030 0.020 Note: The regressions are estimated using Ordinary Least Squares. Standard errors are robust to time-specific clusters and company-specific clusters. Regressions are conducted on companies in four different size categories, based on their market capitalisation in February
2019. All independent variables except the region dummies are demeaned. T-statistics which indicate 0.05 and 0.01 significance levels are highlighted with * and **.
Annex 7: Terms and Definitions
This Annex sets out the terms and definitions used in this report and the survey.
Among broker sell-side institutions, distinctions are made between:
• Global banks or investment banks (we define this based on the EU top ten equity underwriting institutions, namely Goldman Sachs, JP Morgan, Morgan Stanley, Citi, Bank of America Merrill Lynch, Deutsche Bank, UBS, Barclays, Credit Suisse, BNP Paribas)
• Large banks or investment banks (defined as banks with assets greater than EUR 200 billion other than those listed above and investment banks other than those listed above)
• Mid-sized and small banks (defined as banks with assets below EUR 200 billion)
• Global non-bank brokers (or brokers with non-significant banking activities) (defined as a non-bank broker active in multiple countries and with a broad international focus)
• Other brokers
Among Independent Research Providers, (IRPs), distinctions are made between:
• Large Independent Research Providers (IRPs) (30 employees or more)
• Other IRPs (fewer than 30 employees).
Small and Medium Enterprises or SMEs are defined as firms with market capitalisation less than EUR 1bn. In this sense, SMEs are a combination of Small Caps (EUR 200 million to 1 billion), Micro Caps (EUR 50 million to 200 million), and Nano Caps (less than EUR 50 million). Large Cap firms are defined to be those with equity market capitalisation greater than EUR 5 billion. Mid Cap firms are defined to be those with equity market capitalisation between EUR 1 billion to 5 billion
The term "Research" as used in the survey is defined in the broad sense not just "investment research" produced by a "research department". "Research" here also means telephone, email and face-to-face interactions as well as written research.
"Credit research" is defined to include research covering corporate bonds and securitisations but not research related to instruments issued by sovereigns or public sector entities.
GETTING IN TOUCH WITH THE EU In person All over the European Union, there are hundreds of Europe Direct information centres. You can find the address of the centre nearest you at: https://europa.eu/europeanunion/contact/meet-us_en
On the phone or by email Europe Direct is a service that answers your questions about the European Union. You can contact this service:
- by Freephone: 00 800 6 7 8 9 10 11 (certain operators may charge for these calls),
- at the following standard number: +32 2 299 96 96, or
- by email via: https://europa.eu/european-union/contact_en
FINDING INFORMATION ABOUT THE EU Online Information about the European Union in all the official languages of the EU is available on the Europa website at: https://europa.eu/european-union/index_en
EU publications You can download or order free and priced EU publications from: https://publications.europa.eu/en/publications.
Multiple copies of free publications may be obtained by contacting Europe Direct or your local information centre (see https://europa.eu/european-union/contact/meet-us_en ).
EU law and related documents For access to legal information from the EU, including all EU law since 1952 in all the official language versions, go to EUR-Lex at: http://eur-lex.europa.eu
Open data from the EU The EU Open Data Portal (http://data.europa.eu/euodp/en) provides access to datasets from the EU. Data can be downloaded and reused for free, for both commercial and noncommercial purposes.
EV-02-19-027-EN-N
doi:10.2874/986931 ISBN 978-92-79-98887-5
Notes
[1] Research in the sense of Article 13 of Commission Delegated Directive (EU) 2017/593 https://eur-lex.europa.eu/legal-content/EN/TXT/HTML/?uri=CELEX:32017L0593&from=en
[2] The point was made by multiple interview participants including some IRPs that discussed possible tie ups with brokers and buy-side institutions.
[3] Several interview participants made this point including both brokers and asset managers.
[4] The simultaneity of research and trading volumes complicates the statistical analysis in this case. The instrumental variables approach employed in the study aims to identify the impact of a possible ‘2018 shock’ while allowing for the fact that a consequent boost to research may feed back into trading volumes.
[5] See Annex 3.
[7] The Commission has publicly committed to monitoring the effects of MiFID II on research related to listed SME equity securities. Boosting SME equity issuance is a priority under the Capital Markets Union (CMU) project and is consistent with the “SME Listing Package” measures. The Commission is also cognizant of the concerns raised by the CMU Expert Group on European Corporate Bond Markets as evidenced by the Communication on the Call for evidence published
[8] Even the levels of coverage (i.e., the fraction of companies for which at least one earnings forecast report is available in a given year) presented some important and interesting conclusions. The EU average coverage ratio for Small Caps of 65% exceeds the equivalent coverage ratio for United States Small Caps of 61%. Regional discrepancies for Micro and even more for Nano Cap companies are very great. Only 4% of Eastern European Nano Cap companies have earnings forecasts compared to 32% of Western European Nano Caps. Furthermore, Nano Cap Eastern European companies have, on average 0.05 brokers providing earnings estimates compared to 0.5 for Western Europe companies, a multiple of about 10 times.
[9] The coverage ratio is the fraction of companies that, in a specified period, are followed by at least one analyst.
[10] ‘Underground’ in the sense that such research activity is less subject to (a) internal vetting of quality and consistency, and (b) monitoring by compliance. Recipients of the analysis may be unclear whether views expressed are those of the house in question. Such research activity also avoids the transparency implied by strict adherence to MiFID II rules.
[11] Of these, we believe the majority are credit-related.
[12] Note that the regional figures at the foot of Table 2.1 are sums of figures for individual countries for all except the last two columns. In this latter case, the regional entries are country
[13] When we report results on Investor Relations, we will discuss how companies that are able to access foreign equity investment enjoy premium pricing.
[14] Explanations for bias towards home equity investments have been explored by Strong and Xu (2003), Chan, Covrig and Ng (2005), Suh (2005) and Baele, Pungulescu and Ter Horst (2007). Home equity bias in European markets is examined by Foad (2006), Van Lelyveld, Verschoor, and Rubbaniy (2010), Darvas and Schoenmaker (2017), Maier and Scholz (2018) and (2019).
[15] The Herfindahl Index equals the sum of squares of market shares of firms within a market. The value of the index can range from 0 to 1.0 where an index of 0 corresponds to the presence of a large number of very small firms an index of 1 corresponds to a single monopolistic firm.
[16] This asset manager reported purchasing read-only research from 3 foreign brokers to guide their foreign investments (down from 10 research providers prior to MiFID II). They pay for the three providers via P&L as clients would not accept a rise in prices. They view MiFID II as a tax (in money and administrative costs) on their foreign investments.
[17] See Svirydzenka (2016).
[18] To the extent that they see MiFID II as an issue, their concern is that it hampers their ability to diversify internationally by increasing the costs of so doing.
[19] The Bloomberg League Tables lists the underwriters and advisors ranking across a broad array of verified deal types including loans, bonds, equities and mortgage deals based on Bloomberg standards. League Tables were generated in the Bloomberg Terminal by filtering for deal type (equity and bond), issuer domicile and issuer market value. For downloading the characteristics data, the Reuters instrument code (RICs) are of the brokers are collected first and then the characteristics data is downloaded using Eikon from Refinitiv.
[20] A medium-sized European bank that we interviewed described the evolution of credit research in their area. They cover names for secondary market purposes and for new issues. On the relation of primary and secondary markets they said that most issuers are now well-known so they require little support. Hence, primary market research is now a small part of activity. Their main focus is on providing recommendations on relative value for secondary trading. There is still some need to answer investors’ questions in High Yield for a new issuer but this is relatively infrequent. There is also need for research for new types of debt, for example, senior non-
[22] Note that IRPs vary widely in their focus. Many are involved in specialist areas like macroeconomics, commodities and emerging markets research. We expect that those that responded to our survey understood our focus on corporate-related research and, hence, relatively many (compared with IRPs overall) deliver equity-related research. In a fully representative sample, we would expect that smaller fractions of IRPs would be engaged in equity and credit research.
[23] Sponsored research refers to research paid for by the issuer.
[24] Lee (2018a)
[25] Lee (2018b)
[26] http://eastvalueresearch.com/#services
[27] FTSE Global Markets (2017)
[28] Outside these highly developed markets, interview participants did not report that sponsored research played a significant role although there is the counter example of East Value Research.
[29] We consider data from 2015 onwards instead of 2013 as the number of observations is stable only after 2015.
[30] Several brokers we interviewed told us of the choices they faced in working with aggregators of supplying Earnings per Share forecasts in a fully attributable way, anonymously or not at all. It was our impression, in working with the data, that, over time, a greater number of large brokers had adopted the strategy of delivering forecasts anonymously.
[31] The trend declines evident in our results suggest that a dearth of research for smaller firms is a major policy issue internationally. This may reflect the squeeze in broker profitability and market liquidity that has occurred in recent years.
[32] Coverage rates do not approach 100% for Mid and Large Cap companies because earnings forecasts are typically not available for companies that are investment vehicles or property companies and, in some markets, these are a significant minority of companies in general.
[33] These countries are Belgium, France, United Kingdom, Germany, Sweden, Poland and Italy. Comparable results for all EU 28 countries may be found in Annex 5.
[34] See Article 13 of Commission Delegated Directive (EU) 2017/593.
[35] See Article 12(3) of Commission Delegated Directive (EU) 2017/593.
[36] See Article 36(1).
[37] Article 12 (3) of the Delegated Directive “EU/201 /5 ” lists examples of MNMBs. “The following benefits shall qualify as acceptable minor non-monetary benefits only if they are: (a) information or documentation relating to a financial instrument or an investment service, is generic in nature or personalised to reflect the circumstances of an individual client; (b) written material from a third party that is commissioned and paid for by an corporate issuer or potential issuer to promote a new issuance by the company, or where the third party firm is contractually engaged and paid by the issuer to produce such material on an ongoing basis, provided that the relationship is clearly disclosed in the material and that the material is made available at the same time to any investment firms wishing to receive it or to the general public; (c) participation in conferences, seminars and other training events on the benefits and features of a specific financial instrument or an investment service; (d) hospitality of a reasonable de minimis value, such as food and drink during a business meeting or a conference, seminar or other training events mentioned under point (c); and (e) other minor non-monetary benefits which a Member States deems capable of enhancing the quality of service provided to a client and, having regard to the total level of benefits provided by one entity or group of entities, are of a scale and nature that are unlikely to impair compliance with an investment firm's duty to act in the best interest of the client.”
[41] The fact that so many firms clearly use multiple approaches to paying for research may seem surprising. But in practice, a relatively small firm relying mainly on RPAs will typically use P&L to pay for some research related expenses such as data while major firms with global operations typically have a variety of fund management operations. So, while they may predominantly employ P&L, RPAs may be used in some of their activities.
[42] See Article 13 of the Delegated Directive EU 2017/593
[43] RPAs are subject to strict set of rules about research budgets, disclosure and monitoring of the quality of research. The key text from EU/2017/593 (see Articles 13(1)-(2)) is as follows. Firms are allowed to pay for research via “a separate research payment account controlled by the investment firm, provided the following conditions relating to the operation of the account are met: (i) the research payment account is funded by a specific research charge to the client; (ii) as part of establishing a research payment account and agreeing the research charge with their clients, (iii) investment firms set and regularly assess a research budget as an internal administrative measure; (iv) the investment firm is held responsible for the research payment account; (v) the investment firm regularly assesses the quality of the research purchased based on robust quality criteria and its ability to contribute to better investment decisions.”
[44] ESMA Q&As state that “…Before providing an investment service, investment firms intending to use an RPA to pay for investment research should provide clients with two separate pieces of information: (i) the amount that the IF has budgeted for research; and (ii) the estimated amount that can be expected to be paid out of the assets of the individual client. ESMA considers that (i) should reflect the monetary amount of the budget set for a given group of portfolios, strategies or funds that are expected to benefit from such research […], to which their individual research charges will contribute. In relation to (ii)…ESMA considers that the estimated client research charge should be presented as a single estimate figure, and disclosed in both a percentage (or basis points) format and as a cash amount. If a firm wishes to do so in order to provide a degree of certainty to investors, it can present (ii) as a maximum figure where they guarantee to their clients they will not pay more than that predetermined amount. However, figures presented as a range are not acceptable.”
[45] See Article 13(2) of the Commission Delegated Directive EU 2017/593.
[46] See Article 13 (2)-(5) of the Commission Delegated Directive EU 2017/593
[47] On research budgets, the ESMA Q&As say “While a research payment account (RPA) can only be funded by a specific research charge to the client, which must be based on a research budget set by the firm, ESMA considers that a budget can be set for a group of client portfolios or accounts where the firm has established a similar need for third party research in respect of the investment services rendered to its clients…”
[48] On research budgets ESMA Q&As stresses that “the research budget should be an ex-ante estimate of forecast expenditure for research costs that can be charged to portfolios with similar strategies under management. This, in turn, will require that a budget is sufficiently granular to be able to be pre-apportioned by portfolio or client.”
[49] AIMA (2019) discusses the guidelines that an investment manager may consider when paying for external research in the context of the regulatory frameworks in the U.K and U.S. The U.S. regulatory framework starts in the same spirit as MiFID II in that it recognizes the position of trust an investment manager while acting for their clients. However, the investment managers in the U.S. are not required to pay for research separately. In general, there are three ways in which investment managers in the US can pay for research- (i) in a bundled manner with execution fees (ii) using Client Commission Agreement (CCA), which involves the allocation of soft dollars to investment research by investment manages acting on behalf of its client and (iii)directly using its own funds.
[50] This manager’s institutional activities include UCITs and some mandates. So, they decided to pay out of P&L for the mandate business and to keep the UCITS activity as bundled.
[51] The almost universal argument we encountered among large buy-side firms was that competitive pressure precluded the use of RPAs which would entail explicit research charges to investors.
[53] The following is the relevant text from the Delegated Directive: “ . The following benefits shall qualify as acceptable minor non-monetary benefits only if they are: …(b) written material from a third party that is commissioned and paid for by an corporate issuer or potential issuer to promote a new issuance by the company, or where the third party firm is contractually engaged and paid by the issuer to produce such material on an ongoing basis, provided that the relationship is clearly disclosed in the material and that the material is made available at the same time to any investment firms wishing to receive it or to the general public;…”
[54] See ESMA Q&A on MiFID II and MiFIR investor protection and intermediaries topics, Section 7, Question 4.
[55] This is an issue addressed by several EU regulators, for example, see page 63 for FCA PS 17-
[1] , Andrew Bailey’s speech in ctober 201 and ESMA Q&A on interaction with non-EU broker dealers.
[56] See Investment Adviser Act 202(a)
[57] Registration as an investment adviser can also have other consequences for a broker-dealer, including the requirement where trading as principal with an advisory client to disclose its capacity in writing and to receive client consent to the transaction.
[58] See SEC 2017(b).
[59] See SEC 2019.
[60] ESMA’s Q&As state the regulators’ expectations in this regard. n accepting research from non-MiFID II countries, the Q&As explain that: “EU/EEA firms subject to MiFID II inducements rules must comply with these requirements (Article 24, paragraphs (7), (8) and (9), and the relevant level two provisions) irrespective of the status or geographical location of the research provider. Alternatively, they could receive research using the paying arrangements set out in Article 13 of the MiFID II Delegated Directive. Firms should therefore treat research from a third country provider in the same way as any other third-party benefits…” Similarly, on obtaining research from another group entity, the Q&As state: “The MiFID inducements rules apply in the same manner irrespective of the relationship between the provider of fees, commissions or monetary or non-monetary benefits and the firm receiving them, (i.e. irrespective of being part of the same group or not) …” Furthermore, “Where firms do seek to receive third party research from or provide it to other group entities using an RPA model under Article 13 of the MiFID II
[64] Clayton quotes an earlier speech by Dalia Blass SEC Director of the Division of Investment Management (see Blass (2019)) in which she says: “[…] there are indications that market solutions are developing that may make extending the no-action relief unnecessary. For example, I understand that some fund managers are using reconciliation or reimbursement processes to deliver cost transparency while addressing compliance. At the same time, some broker-dealers have explored or taken steps to offer research through a registered advisory business. These are examples of market-based solutions that are developing, and as they emerge, I believe the staff should explore opportunities to provide support while not getting ahead of the market.”
[65] Another large representative European asset manager told us that they do not think it is feasible to not stop people talking or interacting within a large international group. If one of their US operations takes research from a US bank in a bundled form and the writes it up and posts it in a chat room so that it is read by a European asset manager, then do not regard that as being induced. If every article was posted it would be different. But they think regulatory viewpoints on this are not entirely clear.
[68] Figures on the effects on research budgets of MiFID II are provided in Section 4 below. Understanding the net economic impact on asset managers that adopted P&L-based financing is complicated, however. Firms that paid for research from P&L were presumably in a better position to maintain or even increase their management fees since the commission costs faced by investors fell.
[69] For SME equities research, the first and third quartile are 0 EUR and 892,242 EUR respectively. For credit securities, these are 0 EUR and 90,000 EUR respectively. For Large and Mid cap equities, these are 8 EUR and 7,500,000 EUR respectively.
[70] In the graphical representation, the points have been moved horizontally by a small random distance to prevent the overlapping of points with the same value.
[71] The median percentage changes in the total cost of research was about zero from 2017 to
[2018] and then slightly positive from 2018 to 2019.
[72] The median percentage change was substantially negative for Large and Mid Cap equities research (-17%) between 2017 and 2018. This was followed by a decline of 4% from 2018 to 2019. However, the median percentage change for SMEs remained at 0 for both 2017 to 2018 and 2018 to 2019.
[73] They felt that firms that achieved 30% reductions must have been paying much over the odds before MiFID II which they did not think was the case for them.
[74] For credit research, the first and third quartiles are 1,000 EUR and 5,000 EUR respectively. For equity research, first and third quartiles are 5000 EUR and 14,250 EUR respectively.
[75] For comparison, Murphy and Noonan (2018), writing in the Financial Times reported that the six-figure annual charge for written research proposed after MiFID II was first announced, has fallen to between roughly $10,000 and $30,000 after tough negotiations between brokers and asset managers. The article reports that this has come down even further for smaller brokers.
[76] Although this was not a representative experience, one small European asset manager said they took the decision not to negotiate and had found that they received more attention and better service from their research providers than in the past. Asset managers we talked to
[77] This is consistent with other sources. For example, a Financial Times article (see Asgari (2019)) discusses how sponsored research is gathering momentum after the MiFID II reforms.
[78] One interview participant reported that with a EUR 100 million bond issue, there may only one analyst covering the company. Overall, there are 600 companies in the market.
[79] Averaging across the four years for each region, one obtains a bias of 6, 15, 20 and 80 basis points for UK, Western Europe, US and Southern Europe, respectively.
[80] The author finds that local accuracy advantages are strongest for Germany and the Netherlands. Additionally, there is some evidence of local analyst accuracy advantages in France, Italy and Spain. No evidence is apparent in Belgium or Switzerland.
[81] The first and third quartiles for the total number of research providers used overall are at 97 and 20 pre-MiFID II and 13 and 80 post-MiFID II. For the brokers used for overall research, these figures are at 16 and 84 before and 10 and 61 after MiFID II. For IRPs used overall research, these figures are at 2 and 13 before and 2 and 10 after MiFID II.
[82] The first and third quartiles for the total number of providers used for large and Mid Caps are at 10 and 61 before MiFID II and 6 and 43 after MiFID II. For the number of brokers used, these figures are 11 and 60 before MiFID II and 7 and 41 after MiFID II. For the number of IRPs used, these figures are 0 and 10 before MiFID II and 0 and 5 after MiFID II.
[83] The first and the third quartiles for total number of providers used SME equities are at 2 and
[21] before MiFID II and at 14 and 1 after MiFID II. These numbers for just the brokers used are
[10] and 18 before MiFID II and 2 and 13 after MiFID II.
[84] The first and third quartiles for total number of providers used for credit research are at 4 and
[33] pre-MiFID II and at 2 and 26 post-MiFID II. These numbers for just the brokers used for credit research are at 9 and 31 pre-MiFID II and at 6 and 24 post-MiFID II. For the number of IRPs used, these figures are 5 and 0 pre-MiFID II and 5 and 1 after MiFID II.
[85] For SME equities, the first and third quartiles are 2 and 18 before MiFID II and 2 and 18 after MiFID II. For credit, the first and third quartiles are 2 and 19 before MiFID II and 2 and 16 after MiFID II. For large and Mid Caps, they are 5 and 33 before MiFID II and 5 and 27 after MiFID II.
[86] United States over-the-counter equities are dropped from the sample, since their trading volume data is not available before 2018.
[87] Note that the Refinitiv Research Document database does not differentiate between Credit and more general Fixed Income research.
[88] The disadvantages of brokers organising research through teams of sales analysts include: • No accountability: Desk analysts may go on the phone and make a recommendation. To the next client, they may say something different. Ideas may go out to a small universe of clients. For example, they may just target 10 • priority clients. A bulge bracket broker had an issue when cluster meetings were employed to generate trade ideas for group of favoured hedge funds. • There is no internal good sense or compliance review. Much is permitted on the basis that the views are expressed in 1 or 2 lines or half a page on Bloomberg. A global bank faced issues when a credit analyst calculated cash flows and valuation for GM (in context of bond recommendation) which implied a view on the value of the equity. This led to its exclusion from a subsequent IPO since it had given a view on the equity to the street. • It is confusing to clients if there is a mixture of published views and views expressed by desk analysts. Desk analysts may call up an issuer management team and say they are providing coverage. This does not constitute formal coverage but is motivated by the short-term objective of generating trade ideas. Management teams, clients and even internal people may be confused on what is the house view.
[89] Note that this activity is focussed on secondary market interactions. Most primary issuance generates private, over-the-wall conversations. Sector analysts with client contact cannot have private information and then work with traders.
[90] One bank told us that MiFID II did not lead to a big change in client meetings. There has been a shrinking of Fixed Income business in Europe anyway. The bank has a system for recording contacts and calls. Clients rely on the bank for information on the number of contacts. They price in a backward-looking way, quoting based on the number of meetings in the previous year. If the number of meetings goes up suddenly in a quarter then might write to suggest adjustment. So, they try to be ex ante but with flexibility.
[91] In this context, it is interesting to review the ESMA Q&A comments on the treatment of FICC and Macro research. On FICC research, the ESMA comments are as follows: “ESMA clarifies that FICC research are not treated differently from other asset analysis in that it either qualifies as research that is required to be paid for or as MNMB. ESMA has acknowledged the operational limits the firms may face in paying for FICC research separate from execution resulting from the absence of established market practices and mechanisms. ESMA notes that firms can still pay for FICC research out of P&L or using RPA funded by a direct charge to the client. ESMA points to the similarities between certain forms of FICC and macro-economic research and considers that such FICC research could be priced and paid for using a subscription.” n Macro research, the ESMA comments state: “ESMA clarifies that a macro-economic analysis that informs views on any financial instrument, asset or issuer and suggests an investment strategy, whether explicitly or implicitly, is considered as research. ESMA notes that while most of the macro-economic analysis is likely to suggest an investment strategy, some may be ‘sufficiently general’ to be beyond the scope of this definition. However, a macro economic analysis not considered as research does not automatically qualify as MNNB. In particular, if the macro-economic analysis is substantive or involves the allocation of valuable resources, it still needs to be paid for.”
[92] The bag-of-words approach is a Natural Language Processing representation. A given text (in this case the free text response of the buy-side firm regarding its administrative burden attributable to MiFID II) is represented as a multiset of words. The approach ignores the order in which words occur and the grammar but is sensitive to the frequency of occurrence in individual terms.
[93] Also relevant are Chang, D'Anna, Watson and Wee (2008) and Green, Jame, Markov and Subasi (2014). Chang, D'Anna, Watson and Wee (2008) examine the relationship between quality of disclosure and information asymmetry and its impact. The authors find that firms with higher disclosure quality through their investor-relations activities have higher analyst following, more institutional shareholders, more active trading, and are larger in terms of market capitalisation. Green, Jame, Markov and Subasi (2014) investigate whether access to management at broker-hosted investor conferences leads to more informative research by analysts. The authors find analyst recommendation changes have greater immediate price impacts when the analyst’s firm has a conference-hosting relation with the company.
[94] Murphy and Walker (2018), writing in the Financial Times, also report how companies are increasingly arranging calls and meetings with potential investors directly, bypassing brokers.
[95] One particular bulge bracket firm told us that they do not think MiFID II has affected corporate access but that it is not profitable. In some geographies, CA is highly valued and paid for. There needs to be more rationalisation in particular regions. In the long term, asset managers will go direct to firms.
[96] This broker observed that more IR departments are organising their own roadshows. Issuers never paid for corporate contacts. If an asset manager sees value in meeting a company, they will pay. In almost no case that has a client on a target list not been on a research list. Whether the approach is made by them or the issuer, they leave up to compliance and the issuer. The have noticed an increase in the practice of excluding brokers from meetings between asset managers and issuers (which is common in the US and UK). In this case, it may not make sense for analysts to travel with issuer.
[97] A large European asset manager told us that their equities area has the objective of arranging more direct meetings themselves. They are already doing this in the UK and would like to do so more in the rest of Europe. The approach is more established in the UK.
[98] Pursuant to Article 24 (8) of the Directive 2014/65/EU of the European Parliament and of the Council of 15 May 2014 on market in financial instruments.
[99] Act No. 256/2004 Coll., on Capital Market Business.
[100] Pursuant to Article 11 and 12 of Commission Delegated Directive (EU) 2017/593 of 7 April 2016.
[101] By Decree No. 308/2017 Coll., on the More Detailed Regulation of Certain Rules in the Provision of Investment Services. 102Available at:https://www.cnb.cz/export/sites/cnb/cs/legislativa/.galleries/Vestnik- CNB/2014/vestnik_2014_01_20114560.pdf
[103] Pursuant to article L. 533-12-3 of the French code monétaire et financier, ("Financial Code").
[104] Articles 314-18 to 314-20 of the general regulation of the French Autorité des marchés financiers, ("AMF General Regulation")
[105] Please further note that article 24(7) of MiFID II in respect of investment advice on an independent basis has been implemented in article L. 533-12-2 of the Financial Code and article 24(9) of MiFID II in respect of inducements in relation to investment services generally has been implemented in article L. 533-12-4 of the Financial Code.
[106] Article 12 of the Commission Delegated Directive (EU) 2017/593 of 7 April 2016.
[110] Please refer to the AMF Feedback from the public consultation on the new rules for the funding of research by investment firms under MiFID II, 9 February 2017, p. 3.
[111] Please refer to the MifidVision survey, available in French at: http://www.mifidvision.com/lesdocuments.php.
[112] Please note that the English translation is provided for information purposes only.
[113] Please refer to the AMF Guide on new rules for the funding of research within MiFID II, published on 17 January 2018, pp. 9-10 (for further details, please refer to Schedule 1 below).
[114] Please refer to the AMF Guide on new rules for the funding of research within MiFID II, published on 17 January 2018, pp. 18-19 (for further details, please refer to Schedule 1 below).
[115] Please refer to the AMF Guide on new rules for the funding of research within MiFID II, published on 17 January 2018, pp. 20-22 (for further details, please refer to Schedule 1 below).
[116] Such model consisting in the account being funded through ad hoc costs, charged in addition to the management fees, in accordance with the budget determined ex ante together with the client.
[117] Such model consisting in research costs being charged when transactions are executed by the execution intermediary on behalf of the investment firm, in addition to execution fees.
[118] Please refer to the AMF Feedback from the public consultation on the new rules for the funding of research by investment firms under MiFID II, 9 February 2017, p. 15.
[119] Ibid.
[120] Please refer to the MifidVision survey, available in French at: http://www.mifidvision.com/lesdocuments.php.
[121] Please refer to Groupama AM financing policy of external research, 14 march 2018, available in French at: https://www.groupama-am.com/wp-content/uploads/2016/11/Politique-de- Financement-de-la-Recherche-Externe-2018.pdf. Please though note that such policy may be amended at all times.
[122] Through the so-called "Swedish model", i.e. financing of research by the means of a fix charge not related to the volume of transactions.
[123] Please refer to LBPAM Politique relative à la recherche (research financing policy), 1 March 2019, available on LBPAM website at: https://www.labanquepostale-am.fr/. Please though note that such policy may be amended at all times.
[124] https://www.amf- france.org/technique/multimedia?docId=workspace://SpacesStore/fe72932d-b7f2-4652-b166- 1eea67126a70_en_2.1_rendition
[125] See also recital 50 Regulation (EU) 2017/565, which is directly applicable in Germany, states that investment research should be a sub-category of the type of information defined as a recommendation in the MAR.
[126] See also BaFin presentation dated 27 October 2017, which cross referred to the ESMA Q&As, https://www.bafin.de/SharedDocs/Downloads/DE/Veranstaltung/dl_171027_mifid_II_3_zuwend ungen_research.pdf?__blob=publicationFile&v=1
[127] ESMA, Q&As on MiFID II and MiFIR investor protection and intermediaries topics, https://www.esma.europa.eu/sites/default/files/library/esma35-43- 349_mifid_ii_qas_on_investor_protection_topics.pdf
[128] BaFin, https://www.bafin.de/SharedDocs/Downloads/EN/Rundschreiben/dl_wa_uebersetzung_rundschr eiben_052018_macomp_en.pdf?__blob=publicationFile&v=1
[129] Item BT 10.1 MaComp provides as follows: "1. Any and all inducements accepted by investment services enterprises from third parties in relation to the provision of investment services or ancillary investment services in each financial year shall be recorded in an internal list of inducements. As a minimum, the description shall distinguish between monetary inducements from sales commissions, trail commissions, brokerage commissions and other commissions and fees, and non-monetary inducements. 2. The list of inducements shall be updated continuously and finalised once a year for each financial year without undue delay following the end of the financial year. If annual financial statements are required to be prepared, finalisation of the list of inducements within the period specified for preparation of the annual financial statements is considered to be without undue delay. The list of inducements can be maintained in written or electronic form. 3. Monetary inducements received, i.e. accepted and kept, in the previous financial year shall be listed by amount. The amount of non-monetary inducements that are not minor (see section 6 (1) of the WpDVerOV) and were received shall be disclosed. For minor non-monetary inducements, it is enough to describe them generically. 4. Inducements that are forwarded to clients do not have to be included in the list of inducements. In this case, the amount forwarded shall be recorded separately in accordance with section 83 (1) of the WpHG. Alternatively, however, inducements forwarded to clients may be included in the list of inducements and shall then be designated as such."
[130] See legislative reasoning in BT-Drs. 16/4028, p. 67 and BaFin Circular 4/2010 on Minimum requirements for the Compliance Function and Additional Requirements Governing Rules of Conduct, Organisation and Transparency under Sections 31 ff. of the Securities Trading Act (MaComp), p. 19.
[131] The ("FSL") is the law of 5 April 1993 on the financial sector (as amended).
[132] As per Article 1 (3) and (4) of MiFID II.
[133] Delegated Regulation 231/2013 for AIFMs (which rules are similar to those contained in article 26 of MiFID 1).
[134] As referred to in the UCITS Directive and AIFMD in respect of UCITS ManCos/AIFMs providing additional MiFID services.
[135] Cf. also Article 1 of the Grand Ducal Regulation of 30 May 2018 on the protection of financial instruments and funds belonging to clients, product governance obligations and the rules applicable to the provision or reception of fees, commissions or any monetary or non-monetary benefits ("GDR 2018").
[136] Available only in Polish at: https://www.knf.gov.pl/knf/pl/komponenty/img/Stanowisko_UKNF_ws_przyjmowania_i_przekaz ywania_zach%C4%99t_64186.pdf
[137] COBS 18.5A.1R
[138] COBS 18.5.1R
[139] COBS 18.5B.1R
[140] CFA Institute 'MIFID II: One Year On. Assessing the Market for Investment Research'.
[141] FCA 'Andrew Bailey keynote speech on MiFID II at the European Independent Research