

This report examines the efficiency of risk transfers that may be performed by typical Multilateral Development Banks (MDBs). Specifically, we examine how the use of credit insurance or of tranched risk transfer in the form of synthetic securitisation affect a Benefit-to-Cost measure defined as the ratio of percentage economies in required capital divided by the percentage in spread income ceded because of the risk transfer.
Executive Summary
This report examines the efficiency of risk transfers that may be performed by typical Multilateral Development Banks (MDBs). Specifically, we examine how the use of credit insurance or of tranched risk transfer in the form of synthetic securitisation affect a Benefit-to-Cost measure defined as the ratio of percentage economies in required capital divided by the percentage in spread income ceded because of the risk transfer.
Required capital is measured here as the notion of Risk Weighted Assets employed by Standard & Poor’s in the Risk Adjusted Capital (RAC) methodology that it employs to rate MDBs. Risk Weighted Assets multiplied by 23% is the level of capital required in the Standard & Poor’s methodology to achieve the highest level of capital adequacy.
The results of the analysis are shown in Table ES1 for credit insurance and Table ES2 for synthetic securitisation. In these tables, the efficiency ratio appears in the rightmost columns.
Table ES1: Benefit-to-Cost ratios to private insurers risk weights
Type of Exposures Assumed Rating Gross Loan Margin RW before RT RT Counterparty RT Cost RW after RT Benefit to Cost Non-sovereign loans B 3.5% 150% SMI 2.0% 9% 1.65 Non-sovereign loans B 3.5% 150% Private insurers 2.0% 75% 0.88 Sovereign loans B 1.5% 100% SMI 0.9% 9% 1.52 Sovereign loans B 1.5% 100% Private insurers 0.9% 75% 0.42
Table ES1 shows results for risk transfers involving non-sovereign obligor (NSO) and sovereign obligor (SO) portfolios and for transactions in which the counterparty is either a Specialised Multilateral Insurer (SMI) or a commercial insurer.
The risk weights in S&P’s RAC methodology are significantly more favourable to sovereigns and supranationals (including MDBs and SMIs) than to private insurers (which are treated as corporates). The lowest risk weight for a private insurer is 60% if located in a country of the lowest economic risk group of 1. This remains higher than the 57% risk weight for a BBB- sovereign or supranational.
The lower risk weights that Standard & Poor’s requires in the RAC methodology for exposure to SMIs leads to Benefit-to-Cost ratios above 1.5. Portfolio credit insurance obtained from private sector insurers leads to Benefit-to-Cost ratios below 1 for both the NSO and SO portfolios.
Table ES2: Benefit-to-Cost ratios of different synthetic securitisation risk transfers
Type of Exposures Assumed Rating Gross Loan Margin RW before RT RT Counterparty RT Cost RW after RT Benefit to Cost Non-sovereign loans B 3.5% 150% Private Sector 1.55% 62.3% 1.32 Non-sovereign loans B 3.5% 150% Sovereign / SMI 1.30% 29.0% 2.17 Sovereign loans B 1.5% 100% Private Sector 1.01% 42.1% 0.86 Sovereign loans B 1.5% 100% Sovereign / SMI 0.63% 10.4% 2.13
The results for synthetic securitisation risk transfers summarised in Table ES2 show that for both NSO and SO portfolios when counterparties are sovereign/multilateral investors, an MDB can achieve Benefit-to-Cost ratios above 2. For the NSO portfolio, the synthetic securitisation involving private-sector investors achieves a Benefit-to-Cost ratio of approximately 1.3, thanks to the portfolio’s high initial risk weight of 150%. However, for the SO portfolio, the synthetic securitisation involving private-sector investors achieves a Benefit-to-Cost ratio of only 0.86. This is because of the higher proportion of spread given-up compared to a more limited reduction of average risk weights (from 100% to 42%) mostly due to 50% risk weight of the retained Senior tranche (which represents 70% of the transaction).
1. Introduction
This report considers the relative efficiency of different forms of risk transfer available to Multilateral Development Banks (MDBs). The 2015 Toronto meeting of the G20 issued a statement encouraging MDBs to boost their lending capacity by engaging in different types of ‘balance sheet optimisation’ (BSO) (see G20 (2015)). Of the five recommendations, two covered risk transfers in that recommendation 2 advocated exposure exchanges between MDBs to promote diversification and recommendation 4 suggested risk transfer with private sector investors.
On the latter, G20 (2015) states: “MDBs should evaluate a full range of instruments that share risk in their nonsovereign operations with private investors, including syndications, structured finance, mezzanine financing, credit guarantee programs, hedging structures and equity exposure. This can allow the Banks to free up risk capital or crowd in additional resources for global development efforts. Instruments to transfer risk in sovereign operations – such as through guarantees or concessional finance from donors – should also be considered.”
In the years since 2015, G20 reports and statements have reiterated and refined recommendations that MDBs engage in risk transfer. In particular, the recent Italian and Indian Presidencies commissioned reviews of MDB Capital Adequacy Frameworks and more general financing approaches in the form of CAF Panel (2022) and G20 IEG (2023a) and (2023b). These advocate the use of a broader set of risk transfer instruments and approaches, notably suggesting securitisation of Sovereign Obligor (SO) loans, use of shareholder guarantees, and reliance on Specialised Multilateral Insurers (SMIs) such as the World Bank’s Political Risk Insurance provider, the Multilateral Investment Guarantee Agency (MIGA) as a channel for risk transfer.
Since 2015, MDBs have responded with varying degrees of urgency to the G20’s call. The African Development Bank (AfDB) has been especially innovative, launching synthetic securitisation and a credit insurance deal involving Non-Sovereign Obligor (NSO) loans in 2018 and completing a securitisation of a Sovereign Obligor (SO) loan portfolio in 2022. Other MDBs including the Asian Development Bank (ADB), the Inter-American Development Bank (IDB), and IDB Invest have made significant use of guarantees and credit insurance, transacting both with bilateral Development Finance Institutions (DFIs) or with private sector insurers.
One may ask what is the scope for MDBs to generate additional lending capacity using risk transfer as envisaged by the G20? Answering requires understanding (i) what are the constraints that limit expansion in MDB balance sheets and (ii) what are costs of risk transfer compared to the spreads that MDBs earn from lending.
On (i), MDB lending is constrained by internal Capital Adequacy Frameworks that revolve around computations of Economic Capital (EC) and limits and by the ratings they receive from major rating agencies.
• Many MDBs, for example ADB, AfDB and IDB, compute Capital Adequacy Ratios (CARs) equal to their Total Equity resources (paid in equity and accumulated reserves) divided by estimates of their capital needs. The latter denominator in the CAR is computed using canonical capital models such as ratingsbased Credit Portfolio Models (CPMs) for Credit Risk Economic Capital (CREC).
• A key objective for MDBs is to retain their current rating as provided by the three global Credit Rating Agencies (CRAs), Standard & Poor’s, Moody’s and Fitch. Within their methodologies, Standard & Poor’s and Fitch employ ratios of equity resources to Risk Weighted Assets (RWAs). For Standard & Poor’s the ratio, termed the Risk Adjusted Capital (RAC) ratio is a crucial part of the evaluation of bank capital adequacy.
Any possible risk transfer that an MDB may consider will be measured, therefore, against its impact on rating agencies RWAs. Depending on how secure an MDB feels about its ratings, MDB risk transfers may also consider the effect on internally generated constraints including CARs and limits (particularly country limits). Note that, in focussing on a computation of RWAs based on an external RWA methodology, MDBs are comparable to commercial banks for which Basel RWAs dominate evaluations of possible risk transfer deals.
On (ii), again just like commercial banks, MDBs find it easier to implement risk transfers if the spread income generated by lending is more than sufficient to cover the cost of buying credit protection. This may be easier for NSO portfolios for which MDB spreads are closer to commercial market rates although, if investors can be persuaded of the unusually good credit performance of MDB sovereign loans, the pricing of protection may be low enough for MDBs to be able to transfer the risk without recording a loss.
This report is organised as follows. Section 2 provides examples of the use by MDBs of risk transfer approaches including credit insurance, synthetic securitisation and deals involving SMIs. Section 3 discusses criteria for risk transfer including measures that reflect cost and capital economies achieved. Section 4 sets out example calculations of the relative efficiency of credit insurance under different assumptions. Section 5 does the same for synthetic securitisation deals. Section 6 concludes. Appendices provide information on captive insurers, G20 Report Findings on SMI-MDB Interactions, and AfDB reporting on the effect of Room2Run transactions on its lending headroom.
2. Risk Transfer Approaches of MDBs
2.1 Introduction
In this section, we document how MDBs have accomplished risk transfer so far. As mentioned above, some innovative transactions have been completed by the AfDB while other individual MDBs have pioneered the use of guarantees and credit insurance in a variety of ways. The next two subsections discuss deals involving credit insurance and securitisation approaches while a fourth subsection looks at interactions with SMIs. We focus relatively little on Exposure Exchange Agreements (EEAs).[1] While these have provided important boosts to MDB lending capacity, it appears that the scope for further transactions is now limited.
2.2 MDB use of credit insurance
In this subsection, we provide short profiles of use by MDBs of credit insurance.
1. ADB’s 2022 Master Framework Program with 5 Global Insurers
In August 2022, ADB signed a partnership agreement with five global insurers: Tokio Marine Group, AXA XL, Chubb, Liberty Specialty Markets, and Allianz Trade.[2] The Master Framework Program for Financial Institutions was signed for an initial 3-year period and will cover the risk of nonpayment on a portion of ADB’s loans to financial institutions in Asia and the Pacific, thereby transferring credit risk to the insurers and freeing up some of ADB’s capital. The programme streamlines the underwriting and approval process for such risk transfers. ADB expects to mobilise up to USD 1 billion of co-financing, permitting it to increase lending to both commercial banks and non-bank financial institutions.
2. IDB 2023 transaction with international credit insurers
In December 2023, IDB completed a portfolio risk transfer transaction via USD 300 million credit insurance from 14 private insurance companies from the United States, Asia and Europe. This is IDB’s first portfolio risk transfer with the private sector. IDB expects that the capital released by this transaction can be leveraged by three to four times to increase lending to its member countries.
3. IDB Invest
In its 2022 Annual Report and 2022 Information Statement,[3] IDB Invest mentions purchasing credit insurance and developing unfunded risk participations to help manage its credit risk exposures and to participate in mobilising investments from the private sector. At end 2022, IDB Invest reports total mobilisation of USD 3.1 billion, comprising loan participations, co-financing arrangements and unfunded participations. Unfunded participations represented USD 1,262 million of the total mobilisation.
In its latest rating report[4], FitchRatings commented about IDB Invest’s use of credit risk transfer as follows: “Since 2020, IDB Invest has had recourse to unfunded credit protection to mobilise private capital and transfer the credit risk on a portion of the bank’s loan portfolio (19.6% of loans and guarantees were covered as of end-September 2022) to highly rated insurers. Fitch factors the impact of these schemes in its assessment of credit risk, and this has led to an improvement of the weighted average rating of loans and guarantees (WARLG) to ‘BB’ as of end-September 2022, from ‘BB-’ in recent years.”
At end September 2023, IDB Invest was transferring credit risk on 17% of its loan portfolio via unfunded credit protection (UCP), according to Fitch.[5] They mentioned that “when assessing the credit risk of IDB Invest’s operations, Fitch applies a six-notch uplift to the credit quality of the exposures covered by UCP”. The weighted average rating of loans and guarantees (WARLG) was ‘BB’ at end September 2023, unchanged from the previous year.
4. IFC’s Managed Co-Lending Portfolio Program
IFC has traditionally used credit insurance on a project-by-project basis to transfer credit risk to private insurers on an unfunded basis. It has also extended its use to portfolio credit insurance via its Managed Co-Lending Portfolio Program (MCPP) syndication and mobilisation platform.
IFC launched MCPP in 2013 as a syndication platform to mobilise institutional investors to coparticipate in IFC development loans. Since then, MCCP has developed three different types of mobilisation approaches: funded trust loans, funded B-loans and, since 2017, unfunded credit insurance.
Since inception, IFC has created four iterations of its MCPP unfunded credit insurance facilities:
• MCPP URP in 2017, a USD 500 million unfunded risk participation with Swiss Re supporting IFC financing of infrastructure projects in developing countries,
• MCPP FIG I in 2017, for USD 1 billion with two private reinsurers, supporting IFC lending to financial institutions,[6]
• MCPP FIG II in 2020, for USD 2 billion with 6 private insurers and reinsurers, and
• MCPP FIG III in 2023, for USD 3.5 billion with 13 private insurers and reinsurers, and, according to IFC, will “support more than $7 billion of new IFC medium and long-term lending to commercial banks and non-bank financial institutions over the next six years.”[7]
The MCPP approach is that IFC and private insurers pre-agree eligibility criteria and concentration limits when launching the facility, for a set of future IFC loans. Then IFC offers MCPP financing to every eligible project and retains risk in each of those financed. All loans are underwritten by IFC in accordance with its own criteria. The insurers are committed ex-ante to provide credit protection to the eligible loans granted by IFC.
5. TDB’s use of credit insurance and creation of a Captive Insurer
In Appendix 1, we describe the recent creation by the Eastern and Southern African Trade and Development Bank (TDB) of a captive insurer. TDB formally launched its wholly-owned captive insurance company, TDB Captive Insurance (TCI), in 2022. TCI was created in 2021 as a development institution subsidiary of TDB in application of its charter. It was established in Mauritius, a recognised jurisdiction for captive insurance and member country of TDB. TCI is managed by specialist captive insurance managers, Rogers Capital in collaboration with SWAN, located in Mauritius.
We understand TCI’s objectives as being to generate efficiencies in risk management within the TDB Group, to accrue the benefits of placing insurance to the Group, and to optimise sourcing of external insurance and reinsurance. TCI is an innovative approach to insurance/reinsurance sourcing amongst MDBs. At end 2022, TCI was already providing USD 240mn insurance coverage to the TDB Group and bringing a net contribution USD 3.3 million to TDB Group’s profits.
In its annual reports, TDB discloses its use of risk mitigation techniques, including credit insurance, and the related costs. Its utilisation of credit risk mitigation includes risk down-selling, risk participation agreements and credit risk insurance. TDB has also employed credit insurance in an innovative way by insuring 60% of its callable capital since 2016. This has enhanced the recognition of TBD’s callable capital by rating agencies Moody’s and GCR Ratings (a Moody’s affiliate in South Africa).
2.3 MDB use of synthetic securitisation
In this subsection, we provide short profiles of the use of synthetic securitisation by MDBs.
1. AfDB’s 2018 Room to Run Non-Sovereign
The 2018 Room2Run securitisation was the first synthetic securitisation by an MDB. It transferred the mezzanine risk of a portfolio of approximately 50 non-sovereign loans granted by AfDB to varied industry sectors, including financial services, power, transportation and manufacturing. The USD 1 billion risk transfer featured a funded junior mezzanine tranche subscribed by infrastructure investment funds managed by Mariner Investment Group and Africa50, and an unfunded senior mezzanine tranche in the form of a guarantee provided by the European Commission via its European Fund for Sustainable Development (EFSD). AfDB retained a 2% junior tranche and a 72.75% senior tranche (attaching from 27.25%). It was estimated that the transaction created up to USD 650 million headroom for new lending for AfDB.[8]
2. AfDB’s 2022 Room to Run Sovereign
In 2022, AfDB completed a second Room2Run synthetic securitisation, this time referencing a sovereign loan portfolio (Room2Run Sovereign). The USD 2 billion transaction was the first and largest synthetic risk transfer of sovereign exposures by an MBD. The USD 2 billion portfolio comprises 11 member countries from Africa and references exposures selected from AfDB’s loans from its nonconcessional window.
The unfunded risk transfer consisted in purchasing a USD 1.6 billion senior guarantee from the UK’s Foreign and Commonwealth Development Office (FCDO) and a USD 400 first-loss guarantee from three private insurers from the London Lloyd’s market (AXA XL, Axis Specialty London and HDI Global Specialty SE). AfDB reported that Room2Run Sovereign was creating “an estimated additional USD 2 billion in new lending capacity for climate finance.”[9]
2.4 MDB interactions with Specialised Multilateral Insurers
In this subsection, we explain how MDBs have engaged in risk transfers via SMIs.
1. AfDB 2018 USD 500 million credit insurance deal with ATIDI
In 2018, AfDB launched two landmark balance sheet optimisation (BSO) transactions: (i) in September, its first ‘Room2Run’ USD 1 billion synthetic securitisation and (ii) in October, a USD 500 million credit insurance deal with ATIDI covering a portion of AfDB’s portfolio of non-sovereign loans in Africa.
The USD 500 million credit insurance deal with ATIDI covered 22% of AfDB’s USD 2.3 billion outstanding portfolio of loans made to around 30 non-sovereign African financial institutions. The AfDB-ATIDI deal constitutes an example of unfunded risk transfer using portfolio credit insurance. It was expected to free up almost USD 500 million of capacity for new lending. ATIDI is the direct insurer facing AfDB and will share the risk with Lloyd’s syndicates and other reinsurers.
In 2021, at the COP26 conference, AfDB announced its intent to set up Room2Run Sovereign (R2R-S), a new synthetic securitisation transaction, with the UK FCDO and ATIDI, also involving Lloyd’s reinsurers. The USD 2 billion R2R-S synthetic securitisation was launched in October 2022. It transferred the default risk of a portfolio of sovereign loans, for the first 20% to UK-based insurers and the remaining senior 80% to the UK’s FCDO. ATIDI did not participate in the 2022 transaction.
2. ICIEC COVID-19 Guarantee Facility with IsDB
In October 2020, ICIEC and IsDB launched a USD 2 billion COVID-19 Guarantee Facility (CGF) in support of the private sector. The facility was aimed at supporting industries hit by the COVID-19 pandemic in OIC member countries and at attracting cross-border investments. The CGF offered support to member countries by providing insurance to the financiers of critical COVID-related infrastructure projects. The agreement also assigned “clear roles and responsibilities between the institutions based on their specializations, laying the foundation for a new operational model for the systematic partnerships between IsDB and IsDB Group entities.”[10]
In its 2022 annual report,[11] ICIEC stated that: “The CGF was expected to provide de-risking solutions to Member States and to support USD 4.2 billion in business over a period of five years. However, this Initiative did not materialize due to member states finding its conditions to be not favourable, especially the point regarding the repurposing of the Cumulative Undisbursed Commitments (CUCs).”[12]
3. Innovations by MIGA
The CAF Panel (2022) report included a recommendation calling on MIGA and MDBs to “collaborate on transferring portfolio risk from MDB balance sheets through MIGA’s insurance products and reinsurance capability.”[13] It noted that MIGA had a highly efficient capital model supporting gross exposures of USD 23 billion with USD 1.7 billion operating capital, helped by active use of reinsurance (close to 65% of MIGA’s portfolio at end June 2023).[14]
Furthering the CAF Panel report, the Independent Group of Experts (G20 IEG) commissioned by the 2023 Indian G20 Presidency advocated tripling the sustainable lending levels of MDBs by 2030. Among the means to achieve this, it called on MIGA to “play a much larger role for the MDB system by tripling its annual guarantee and distribution activities by 2030.”[15]
In previous years, MIGA entered into different forms of risk-sharing transactions with multilateral institutions. In 2017, as part of the 18th replenishment of IDA (IDA18), the World Bank Group (WBG) created the USD 2.5 billion IDA-IFC-MIGA Private Sector Window (PSW) to support private sector investment in IDA countries. The programme comprises four facilities, including the MIGA Guarantee Facility (MGF), and has been continued under the 19th replenishment of IDA (IDA19).
MIGA can utilise the PSW via the MGF, as a risk mitigation solution for guarantees provided in IDA PSW-eligible countries when MIGA and the market have insufficient capacity to provide the whole guarantees. The MGF has an overall limit of USD 500 million and has provided a risk-sharing mechanism to MIGA within the WBG via capital made available by IDA donors.
Outside the WBG, in 2020 MIGA issued a first EUR 359 million guarantee of a TDB loan from a consortium of commercial lenders. MIGA’s guarantee provided protection to the lenders against the risk of Non-Honouring of Financial Obligations (NHFO) by TBD for up to 10 years. It enhanced the credit risk of TDB for the lenders and gave it access to longer-tenor financing at lower interest rates. At end 2023, MIGA and TDB extended their collaboration with MIGA issuing a second EUR 349 million 7-year guarantee of TDB’s NHFO risk, for an additional loan provided to TDB by a syndicate of commercial lenders.
In February 2023, MIGA concluded its first trade finance guarantee (TFG) in partnership with EBRD, to support trade transactions carried out through state-owned banks in Ukraine and other emerging markets and developing economies (EMDEs). MIGA will issue up to US$200 million of TFGs over a 6-year period against the risk of non-payment by SOBs on guarantees granted by EBRD under its trade facilitation programme.
Very recently, in February 2024, the WBG announced a major overhaul to its guarantee business, following recommendations from its Private Sector Investment Lab (created in 2023) and from the G20 Independent Expert Group reports (see G20 IEG (2023b)). This overhaul will be the first significant change to the WBG’s approach to issuing guarantees in 15 years and aims to regroup and update the 20 guarantee solutions currently offered by the WBG under a single roof to achieve the goal of tripling the WBG’s guarantee issuance to USD 20 billion per year by 2030.
The overhaul is expected to include six concrete aspects: regrouped structure under one roof, simplified and comprehensive offer of guarantees, streamlined guarantee process for clients, greater accessibility via reinforced guarantee teams, increased scale, and development of new innovative guaranteed products to augment private sector mobilisation. It is intended to be completed by July 2024.
2.5 MDB risk transfer impact and cost reporting
This subsection explains how two MDBs report the impacts of risk transfer in their financial statements.
1. AfDB Reports on Risk Transfer
The AfDB has provided valuable information (see Appendix 3) on the impact of several risk transfer transactions on its lending headroom. Following the AfDB’s Room2Run synthetic securitisation of Non-Sovereign Obligor (NSO) loans in 2018, the AfDB included in its annual report and financial statements (see AfDB (2019a) and (2019b)) information about the increased lending headroom created by the transaction (USD 1.16 billion).
Similarly, in 2023, having completed a synthetic securitisation of sovereign loans in 2022, the AfDB provided (see AfDB (2023)) an estimate of how much additional lending capacity had been created (USD 2 billion) and also what the effect of the deal was on the bank’s Risk Capital Utilisation Rate (RCUR) (an improvement of 5.1%) and the effect on its Weighted Average Risk Rating (WARR) (an improvement of 0.2%). It also stated what the effect was on its Standard & Poor’s Risk Adjusted Capital ratio (an increase of 1.5%). (See Appendix 3.)
In its recent financial reports, AfDB has reported the annual cost of its Balance Sheet Optimisation (BSO) transactions. These BSO transactions comprise credit insurance, credit enhancement and synthetic securitisation. The total costs of BSO coverage are reported in Table 2.1 below, for the financial years 2020 to 2022.[16]

2. TDB’s Reports on Risk Mitigation Costs
In Appendix 1, we provide details about TDB’s creation of its captive insurance subsidiary, TCI, in
2022. In its annual reports, TDB discloses its risk mitigation costs including insurance cover costs. It also states that it has insured 60% of its callable capital since end 2016, enhancing the credit and average rating of its key shareholders.
Table 2.2 recapitulates TDB’s disclosure about its risk mitigation costs in its two latest annual reports TDB (2021) and TDB (2022). TDB reports making active use of risk mitigation techniques in the form of:
• risk down selling and risk participation agreements,
• insurance against credit, currency convertibility and externalisation risks, and
16 See AfDB Group’s Financial Reports 2020, 2021 and 2022.
• insuring 60% of its callable capital.
| (USD million) | 2020 | 2021 | 2022 |
|---|---|---|---|
| Risk mitigation costs, | 36.1 | 40.6 | 42.3 |
| of which: | |||
| • Insurance cover costs | 34.5 | 35.2 | 31.1 |
| • Risk down-selling/participation costs | 1.6 | 5.4 | 11.1 |
3. Criteria for Risk Transfer
3.1 General considerations
For institutions facing capital constraints, traditional credit insurance without tranching has the significant advantage that it is simple to analyse and implement and can be easily customised to cover specific individual names. It does not, however, allow for matching the risk appetite of different investors and among private sector counterparties, can only be used with insurers.
Thus, it is an effective and flexible solution for entities that are commencing risk transfer, especially if mitigating single name concentration is a significant motivation for the transaction. But it is likely to be less scalable as an approach. Approaches that involve tranching, either structured insurance or securitisation, permit better matching of risk appetite but only securitisation allows an issuer to tap very deep sources of risk capacity including funds.
For MDBs facing leverage constraints, funded risk transfer transactions are necessary. Such transactions are likely to erode the PCT of the MDB since a funded transaction will involve a change in the lender of record. For NSO portfolios, PCT is a limited consideration. MDB NSO loans are often spared convertibility risk as even if the sovereign is in default to its own private sector lenders and limits access to foreign exchange markets, it may allow the foreign currency servicing debts to MDBs of which it is a Member Country to continue uninterrupted.
3.2 Measuring risk transfer efficiency
Commercial banks engaging in risk transfer typically use a Risk-Adjusted Return on Capital (RAROC) approach to evaluating possible transactions. As we shall see below, this amounts to calculating the net change in spread income and comparing it with the cost of capital gained from the transaction. The cost of capital in turn equals the reduction in capital implied by the deal multiplied by a target cost of equity. The cost of equity used in this context is a key, centrally determined parameter for most commercial banks.
MDBs may use a RAROC type of approach for pricing NSO loans but the cost of equity is frequently unclear. A parameter may be set to adjust NSO loan pricing to an acceptable level, but it certainly does not represent a key strategic variable on which management or Board of Directors has a clear and common understanding. For this reason, MDBs may rely on alternative approaches to evaluating risk transfers. One approach that has been employed by at least one MDB is the ratio of RWAs saved to the percentage of spread income ceded.
Percentage RWAs saved Efficiency Ratio ≡ (3.1) Percentage spread income ceded
In principle, RWAs in this context could be calculated using different approaches. Possibilities include RWAs based on (i) Basel Risk Weights (RWs), (ii) Standard & Poor’s RWs, or (iii) Fitch RWs. Another alternative would be to compute Marginal Value at Risk (MVaRs) using the MDBs own CREC CPM and then to multiply by 1250% to obtain RWAs.[17]
However, most MDBs limited by capital adequacy are likely to be constrained most tightly by their Standard & Poor’s rating since the capital adequacy part of the Moody’s rating assessment is mainly driven by the riskinsensitive leverage ratio and Fitch, while it does place some emphasis on an equity to risk weighted loans ratio, is also less risk sensitive than Standard & Poor’s. Hence, for most purposes, one would expect the Standard & Poor’s RWAs to serve as the most relevant measure in the Efficiency Ratio shown in equation (3.1).
Loan pricing based on the RAROC approach is conventionally defined as requiring that the loan yield exceed a hurdle rate defined as the righthand side of equation (3.2):
Funding cost+ Expected Loss+Overℎeads+Cost of equity ×Capital required Loan yield> (3.2) Notional value
Let
Funding cost S= Spread= Loan yield− (3.3) Notional
Define OHR= Overℎeads/Notional, ELR= Expected Loss/Notional, K= Capital required/Notional and ρ= Cost of equity. Then, equation (3.2) may be rearranged to obtain:
S− ELR−OHR (3.4) > ρ K
Let ∆ denote the change in a variable from before to after a risk transfer transaction. ∆S is the spread conceded to realise the risk transfer. ∆OHR is the direct cost of the deal as a fraction of notional. Then, one may evaluate a risk transfer deal either using:
∆ S− ∆ ELR − ∆ OHR− ρ × ∆K > 0 (3.5)
Equation (3.5) shows the value created by completing the risk transfer measured in monetary terms as a riskadjusted change in the spread on the asset.
Alternatively, one may evaluate the risk transfer deal based on the ratio in equation (3.4):
S− ELR−OHR S− ELR−OHR (3.6) | | K After deal − K Before deal > 0
Equation (3.6) shows the value created by the risk transfer in terms of a return on the required capital, so in a sense, as a contribution to return on equity.
4. Risk Transfer Using Credit Risk Insurance
4.1 Introduction
We analyse the case of an MDB carrying out risk transfer via portfolio credit insurance transactions.
MDBs can take out credit insurance directly from the private sector, from private insurers or reinsurers. They can also purchase credit insurance from specialised multilateral institutions (SMIs), such as MIGA, ATIDI, ICIEC and Dhaman, which themselves tend to reinsure a significant proportion of their exposures with private insurers or reinsurers.
We analyse the impact of portfolio credit insurance in the two approaches, directly with the private sector or via an SMI.
For this analysis, we consider two different underlying portfolios of exposures:
1. a first portfolio of non-sovereign exposures (financial institutions, infrastructure projects and nonfinancial corporates) (the NSO Portfolio), and
2. a second portfolio of sovereign exposures (the SO Portfolio).
4.2 Portfolio characteristics
We present the impact of these two risk-transfer approaches using the S&P rating methodology.
To analyse the impact of risk transfer in the Standard & Poor’s approach, the key parameters of the portfolios are: ● Average credit quality of the portfolio, ● Average margin of the underlying exposures (here assumed to be loans), ● Weighted-average risk-weight and risk-weighted assets.
These characteristics are different for NSO and SO portfolios. Table 4.1 summarises the characteristics chosen for the two example portfolios we analyse here.

Note: (1) The assumed rating is before benefit of PCT. (2) The S&P average risk weights are considered to be after the benefit of PCT. For NSO loans, risk weights do not result from the ratings but from countries economic risk group instead. We neither assume any particular concentrations in both portfolios nor any S&P concentration adjustments.
4.3 Portfolio Credit Insurance via SMI or the Private Sector
MDBs can enter into portfolio credit insurance transactions via SMIs or directly with private-sector insurers or reinsurers.
The Standard & Poor’s RACF methodology[18] treats differently risk transfers completed with a multilateral institution (such as an SMI) or with private-sector insurers in the sense that multilaterals carry sovereign risk weights from the Government Exposures table while commercial insurers are assigned risk weights from the Corporate Sector Exposures table.
Table 4.2 shows the Standard & Poor’s risk weights applied to sovereigns and multilateral institutions by the RACF methodology. If we assume an SMI is rated A by S&P, such as ATIDI, its guarantee will carry a risk weight of 9%.
Table 4.3 displays the risk weights applying to corporates and private insurers or reinsurers, in S&P’s RACF methodology. The Economic Risk Group is that of the country where an insurer or reinsurer is located.
At the end of 2023, for example, the Economic Risk Group of Switzerland is 1. Germany is in Economic Risk Group 2. The US and France are in Economic Risk Group 3 and the UK is in Economic Risk Group 4. This means that, in the RACF methodology, insurers from Switzerland and Germany carry risk weights of 60% and 66% respectively. Insurers from the US and France carry risk weights of 75%, and insurers from the UK carry risk weights of 87%.
Table 4.4 summarises the assumptions retained for the SMI and private insurers with whom the portfolio credit insurance risk transfer transactions could be done. We assume an SMI rated A by Standard & Poor’s (such as ATIDI) which carries a risk weight of 9%. We also assume private insurers (or reinsurers) located in countries such as the UK, Germany, France and the US, with an average economic risk group of 3.
In recent portfolio credit insurance or synthetic transactions by AfDB, the private insurers and reinsurers who participated in the transactions, directly or indirectly, have been mostly located in the UK which has a slightly less favourable economic risk group of 4.
| Long-Term Foreign Currency Sovereign Credit Rating Sovereign | RW | Long-Term Foreign Currency Sovereign Credit Rating | Sovereign |
|---|---|---|---|
| AA- and above | 3% | BB- | 125% |
| A+ | 5% | B+ | 153% |
| A | 9% | B | 185% |
| A- | 15% | B- | 219% |
| BBB+ | 26% | CCC+ | 257% |
| BBB | 40% | CCC | 297% |
| BBB- | 57% | CCC- | 340% |
| BB+ | 76% | CC | 386% |
| BB | 99% | SD/D | 428% |
| Risk Group Corporate | RW Country Economic | Risk Group Corporate | RW |
|---|---|---|---|
| 1 | 60% | 6 | 121% |
| 2 | 66% | 7 | 142% |
| 3 | 75% | 8 | 167% |
| 4 | 87% | 9 | 194% |
| 5 | 102% | 10 | 225% |

4.4 Benefit to cost of portfolio credit insurance risk transfers
The assumptions relating to the portfolios and to the counterparties of the portfolio credit insurance permit to calculate unadjusted risk-weighted assets before and after risk transfer in the S&P rating methodology.
To assess the efficiency of risk transfer transactions, we need to define an efficiency metric. We retained a benefit-to-cost metric defined as the ratio of (a) the risk-weighted asset reduction after risk transfer divided by the portfolio risk-weight assets before and (b) the cost of risk transfer (expressed as a loan margin given up) divided by the average gross loan margin of the portfolio before risk transfer.
( RWA after risk transfer RWA before risk transfer ⁄ ) Benefit to Cost= ( Spread given up in risk transfer Average loan margin before ⁄ )
To calculate the Benefit-to-Cost ratio, we need to make assumptions in relation to the cost of risk transfer. Such costs are mostly linked to the underlying portfolio of the risk transfer transactions. For the NSO portfolio, we assume a 2% spread given up in the portfolio risk transfer transactions. For the SO portfolio, likely to be less risky than the NSO portfolio, we assume a 0.9% spread given up in the transactions.
Table 4.5 recapitulates the four types of risk transfer transactions considered via portfolio credit insurance and sets out the Benefit-to-Cost calculations obtained. For both the NSO and SO portfolios, the advantageous risk weights of SMIs in the RACF methodology permit to achieve Benefit-to-Cost ratios above 1.5. On the other hand, for portfolio credit insurance directly with private sector insurers, the much higher risk weights applying to insurers in the RACF methodology result in Benefit-to-Cost ratios below 1 for both the NSO and SO portfolios.
The risk weights in S&P’s RACF methodology are significantly more favourable to sovereigns and supranationals (including MDBs and SMIs) than to private insurers (treated as corporates). The lowest risk weight for a private insurer is 60% if located in a country of the lowest economic risk group of 1. This remains higher than the 57% risk weight for a BBB- sovereign or supranational.
Table 4.6 displays the sensitivity of the Benefit-to-Cost ratio to the RACF risk weights of private insurers, ceteris paribus, for both the NSO portfolio and the SO portfolio credit insurance transactions.
For the NSO portfolio, the Benefit-to-Cost ratio increases to 1.05 in the best-case risk weight of 60% and drops to 0.74 for insurers in countries in economic risk group 4 (87% risk weight). These efficiency ratios remain much lower than the 1.65 value obtained with SMIs rated at least A (9% risk weight). For the SO portfolio, the Benefit-to-Cost ratios are even lower, between 0.67 in the best-case risk weight of 60% and dropping to 0.22 for insurers in countries in economic risk group 4. This compares very unfavourably with the efficiency ratio above 1.5 obtained with SMIs rated A or higher.
To reduce RWAs in the S&P methodology thanks to portfolio credit insurance, it is essential to benefit from significantly lower risk weights after risk transfer. Credit protection obtained from highly rated SMIs can bring much lower risk weights than sourced from private insurers, even in the case of NSO loans starting at higher risk weights than SO loans. For portfolio risk transfers via credit insurance, S&P’s RACF methodology is considerably more favourable to sourcing protection from multilateral institutions than from private insurers.
However, we have not assumed any excess concentrations in the NSO and SO portfolios which could lead to increased adjusted RWAs before risk transfer. In such a case, taking credit insurance on excess concentrations via single-name or portfolio risk transfer may materially reduce their impact on adjusted RWAs even when sourced from private insurers.
| Type of Exposures Assumed | Rating Gross Loan | Margin RW before | RT | RT Counterparty RT | Cost RW after | RT Benefit to | Cost |
|---|---|---|---|---|---|---|---|
| Non-sovereign loans | B | 3.5% | 150% | SMI | 2.0% | 9% | 1.65 |
| Non-sovereign loans | B | 3.5% | 150% | Private insurers | 2.0% | 75% | 0.88 |
| Sovereign loans | B | 1.5% | 100% | SMI | 0.9% | 9% | 1.52 |
| Sovereign loans | B | 1.5% | 100% | Private insurers | 0.9% | 75% | 0.42 |
| Type of Exposures | Assumed | Rating Gross Loan | Margin RW before | RT | RT | Counterparty RT | Cost RW after | RT Benefit to | Cost |
|---|---|---|---|---|---|---|---|---|---|
| Non-sovereign | loans | B | 3.5% | 150% | Private | insurers | 2.0% | 60% | 1.05 |
| Non-sovereign | loans | B | 3.5% | 150% | Private | insurers | 2.0% | 66% | 0.98 |
| Non-sovereign | loans | B | 3.5% | 150% | Private | insurers | 2.0% | 75% | 0.88 |
| Non-sovereign | loans | B | 3.5% | 150% | Private | insurers | 2.0% | 87% | 0.74 |
| Sovereign loans | B | 1.5% | 100% | Private | insurers | 0.9% | 60% | 0.67 | |
| Sovereign loans | B | 1.5% | 100% | Private | insurers | 0.9% | 66% | 0.57 | |
| Sovereign loans | B | 1.5% | 100% | Private | insurers | 0.9% | 75% | 0.42 | |
| Sovereign loans | B | 1.5% | 100% | Private | insurers | 0.9% | 87% | 0.22 |
5. Risk Transfer Using Synthetic Securitisation
5.1 Introduction
We analyse the case of an MDB carrying out portfolio risk transfer via synthetic securitisation transactions.
There have already been portfolio risk transfers done by MDBs via synthetic securitisation, for both nonsovereign (NSO) loans and sovereign (SO) loans. In particular, AfDB completed an NSO synthetic securitisation in 2018 and an SO synthetic securitisation in 2022.
MDB synthetic securitisation can involve private sector investors and also guarantees from sovereign investors and potentially SMIs as well (such as ATIDI and MIGA) subject to complying with the rating agency criteria for them to recognise credit enhancement obtained from the guarantees.
We analyse the efficiency of synthetic securitisation for both NSO and SO portfolios in two different approaches, a first one mostly with private-sector investors and a second mostly with sovereign/multilateral investors.
5.2 Portfolio characteristics
We consider two different underlying portfolios of exposures, with the same mix as when analysing portfolio credit insurance:
1. A first portfolio of non-sovereign exposures (financial institutions, infrastructure projects and nonfinancial corporates) (the NSO Portfolio).
2. A second portfolio of sovereign exposures (the SO Portfolio).
We assess the efficiency of synthetic securitisations using the S&P rating methodology.
To analyse the impact of risk transfer in the S&P approach, the key parameters of the portfolios are: ● Average credit quality of the portfolio, ● Average margin of the underlying exposures (assumed to be loans here), ● Weighted-average risk-weight and risk-weighted assets.
These characteristics will be different between the NSO Portfolio and the SO Portfolio. Table 5.1 summarises the characteristics chosen for the two portfolios.

Note: (1) The assumed rating is before benefit of PCT. (2) The S&P average risk weights are considered to be after the benefit of PCT. For NSO loans, risk weights do not result from the ratings but from countries economic risk group instead. We neither assume any particular concentrations in both portfolios nor any S&P concentration adjustments.
5.3 S&P framework for MDBs synthetic securitisation
S&P has incorporated its approach to applying risk weights to portfolios benefiting from credit risk transfer in its Multilateral Lending Institutions And Other Supranational Institutions Ratings Methodology.[19]
S&P (2022) includes the criteria to recognise capital relief for an MDB in the cases of synthetic risk transfer and of the MDB benefiting from financial guarantees on all or part of the underlying portfolio. When guarantees are provided, they need to satisfy S&P’s general guarantee criteria to recognise the credit enhancement obtained, typically being timely, irrevocable and unconditional. Then S&P reviews the materiality of risk transferred from a quantitative viewpoint (the “magnitude of risk transfer”) compared with its view of total losses that may stem from the underlying portfolio.
S&P considers two possible approaches to quantify the total portfolio losses. Its main approach is to apply the RACF methodology, factoring in the usual adjustments for stronger or weaker economies, as well as for singlename, sector and geographic concentration or diversification. S&P could also apply its CDO methodology to assess the risk of the underlying portfolio and infer rating estimates for the securitisation tranches. The rating estimates would then be used to determine the tranches’ risk weights using the RACF methodology.
Table 5.2 sets out S&P’s risk weights for securitisation tranches from the RACF methodology[20]. These risk weights would apply to retained securitisation tranches in the context of an MDB synthetic securitisation.
For a retained junior tranche (‘first-loss’ tranche), S&P applies a 1250% risk-weight, equivalent to a 100% deduction from capital as it would be expected to be fully consumed by losses in stressed rating scenarios. For an unrated retained senior tranche, S&P clarifies, in the MDB rating methodology, that it would recognise a maximum rating of A if the portfolio losses are fully covered by more junior securitisation tranches. This means that the minimum risk weight applying to a retained securitisation tranche is 50%.
For credit protection obtained via financial guarantees (complying with the guarantee criteria), S&P would use the risk weights applying to the guarantee counterparty in the RACF methodology unless the tranche is fully funded or collateralised. In such a case, and if the collateral is segregated, the guarantee would benefit from the collateral risk weight in the RACF methodology.
In the following analysis, we assess risk transfer benefits using the RACF approach as it is the most clearly described and appears to be the one favoured by S&P.
| AAA | 20% | BB | 626% |
|---|---|---|---|
| AA | 30% | BB | 1050% |
| A | 50% | CCC-C | 1250% |
| BBB | 100% | Not rated or deducted from capital | 1250% |
5.4 Synthetic securitisation of an NSO loan portfolio
We analyse the synthetic securitisation of an NSO portfolio in two different approaches in terms of investors involved: a first one involving private-sector investors and a second mostly with sovereign/multilateral investors.
5.4.1 NSO synthetic securitisation with private-sector investors
We analyse the example of an NSO synthetic securitisation involving private-sector investors.
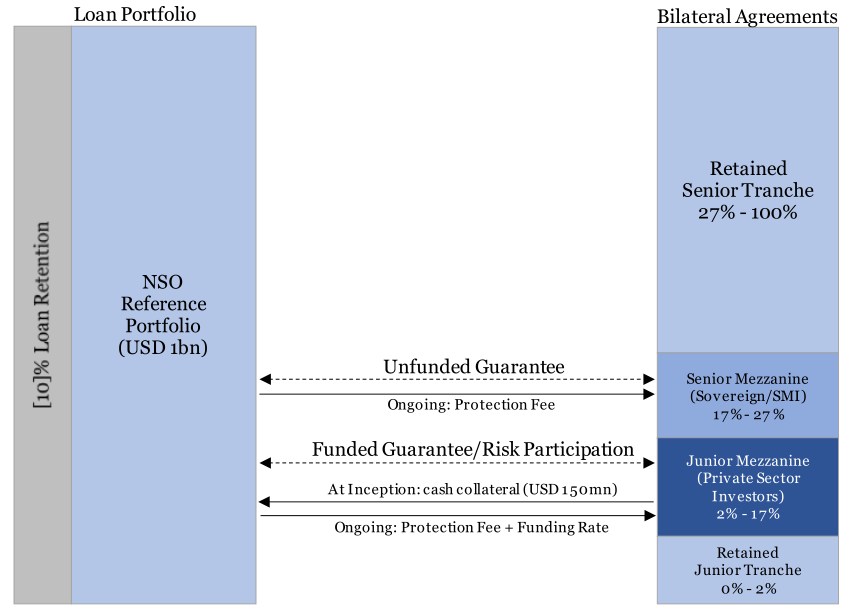
Figure 5.1 describes a USD 1 billion NSO synthetic securitisation involving mostly private-sector investors. A typical structure for such a synthetic securitisation, as illustrated by AfDB’s 2018 transaction, would comprise two tranches retained by the MDB: ● a small Junior tranche (2% of the transaction in our example) absorbing the first losses before privatesector investors, and ● a large Senior tranche (73% of the transaction in our example), benefitting from a subordination level (‘credit enhancement’) larger than the total portfolio losses evaluated by S&P so as to carry the lowest possible risk weight of 50% in S&P’s risk transfer methodology for MDBs.
To optimise the cost-benefits of such a synthetic securitisation, it would also involve two tranches placed to external investors: ● a Junior Mezzanine tranche, just above the first-loss tranche, placed to private sector investors, and ● a Senior Mezzanine tranche, senior to the first-loss and Junior Mezzanine tranches, large enough so that these three tranches would completely cover the total portfolio losses estimated by S&P.
The private-sector investors would typically be insurers, reinsurers or funds which would carry risk weights for corporate sector exposures in the S&P RACF methodology. We saw previously (about risk transfer via credit insurance) that the minimum risk weight for corporate sector exposures is 60%, which would significantly limit the benefit of risk transfer. To reduce the risk weight applying to the Junior Mezzanine, a solution is for it to be funded and cash-collateralised for the MBD’s benefit. The Junior Mezzanine risk weight can then be reduced to as low as 3% if the cash collateral is invested in securities from a sovereign or multilateral institution rated AAor above.[21]
In the transaction, the retained Junior and Senior tranches generate significant risk-weighted assets while the Junior Mezzanine represents a substantial spread cost given its funded nature. The remaining Senior Mezzanine tranche already benefits from a material subordination. It is then worth structuring it as an unfunded guarantee to minimise its cost and, if possible, placing it to low risk-weight counterparties. Sovereigns, supranational and multilateral institutions carry the lowest risk weights in the RACF methodology. Hence, we assume that the Junior Mezzanine guarantee is sourced from a sovereign or SMI, rated AA- or above; it then carries a 3% risk weight.[22]
Table 5.3 summarises the parameters of an NSO synthetic securitisation involving private-sector investors. The transaction characteristics are relatively close to AfDB’s Room2Run synthetic securitisation of 2018, but we assume more ‘rounded’ tranching and pricing parameters for the sake of illustration here.
The ‘RT Cost’ column contains the assumptions of annual margins paid to the tranches placed to mezzanine investors: ● 10% paid to the funded Junior Mezzanine, covering both funding rate and protection fee, ● 0.5% paid to the unfunded Senior Mezzanine, corresponding to a protection fee.
The first-loss Junior tranche is retained, carrying a 1250% risk weight. The retained Senior tranche benefits from 27% subordination which is assumed to cover portfolio losses from the RACF methodology in all likely circumstances. The Senior is therefore considered to benefit from an implied rating of at least A and carries a 50% risk weight. The unfunded Senior Mezzanine guarantee is assumed to be provided by a sovereign, supranational or multilateral institution rated at least AA-, and therefore carries a 3% risk weight in the RACF methodology. The funded Junior Mezzanine is assumed to be collateralised by securities from an MDB rated at least AA-, therefore the tranche benefits from that MDB’s risk weight of 3% as well.
The weighted average cost of risk transfer (excluding set-up and operating costs of the transaction) comes out at 1.55% (44% of the average loan margin) and risk-weighted assets are reduced to 62.3% of the pool size (from 150%).

5.4.2 NSO synthetic securitisation with sovereign/SMI counterparties
We analyse the example of an NSO synthetic securitisation involving mostly sovereign, supranational and multilateral investors.
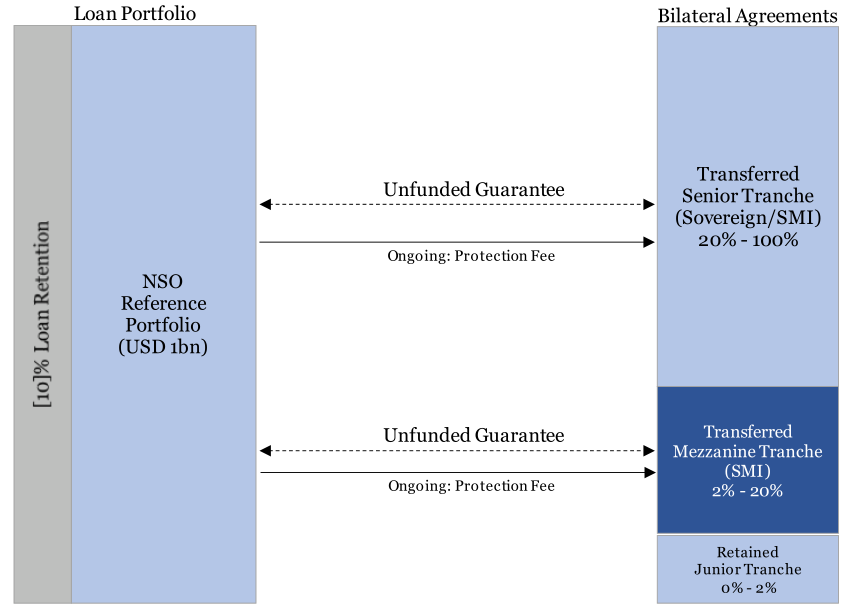
Figure 5.2 illustrates a USD 1 billion NSO synthetic securitisation involving mostly sovereign, supranational or SMI investors. This structure is an adaptation of the previous synthetic securitisation, aiming to minimise the risk and risk-weighted assets retained by the originating MDB via unfunded risk transfer while optimising its cost.
As in the previous structure, the transaction features a small retained Junior tranche (of 2% as well) absorbing the first losses before two tranches sourced from external counterparties. These externally sourced tranches comprise: ● a Mezzanine tranche (18% of the transaction in our example), just above the first-loss tranche, structured as an unfunded guarantee sourced from an SMI, and
● A Senior tranche (80% of the transaction), benefitting from 20% subordination from the Junior and Mezzanine tranche, sourced from a highly rated sovereign, supranational or multilateral institution.
Table 5.4 summarises the parameters of an NSO synthetic securitisation involving mostly sovereign and multilateral investors. The transaction characteristics are inspired by AfDB’s initial approach for its second Room2Run synthetic securitisation in 2022 for the Mezzanine and Senior tranche, adding a retained Junior tranche likely to be necessitated by the NSO portfolio.
The ‘RT Cost’ column contains the assumptions of annual margins paid to the tranches sourced from external counterparties: ● a likely conservative 5% protection fee paid to the unfunded Mezzanine guarantee,[23] ● a relatively prudent 0.5% protection fee paid to the unfunded Senior guarantee.[24]
As previously, the retained Junior tranche carries a 1250% risk weight in the RACF methodology. We assume that the Mezzanine tranche is sourced from a sovereign or multilateral institution rated at least single-A by S&P (and complies with its guarantee criteria). The Mezzanine tranche then benefits from a 9% risk weight in the RACF methodology. We also assume that the Senior tranche is provided by a sovereign or multilateral institution rated at least AA- by S&P (and complies with its guarantee criteria). The Senior tranche then carries a 3% risk weight.
In this structure, the weighted average cost of risk transfer (excluding set-up and operating costs of the transaction) comes out at 1.30% (37% of the loan margin) and risk-weighted assets fall to 29% of the pool size (from 150%).

5.5 Synthetic securitisation of a Sovereign (SO) portfolio
We analyse the synthetic securitisation of an SO portfolio in two different approaches in terms of investors involved: a first one involving private-sector investors and a second mostly with sovereign/multilateral investors.
5.5.1 SO synthetic securitisation with private-sector investors
We analyse the example of an SO synthetic securitisation involving private-sector investors.
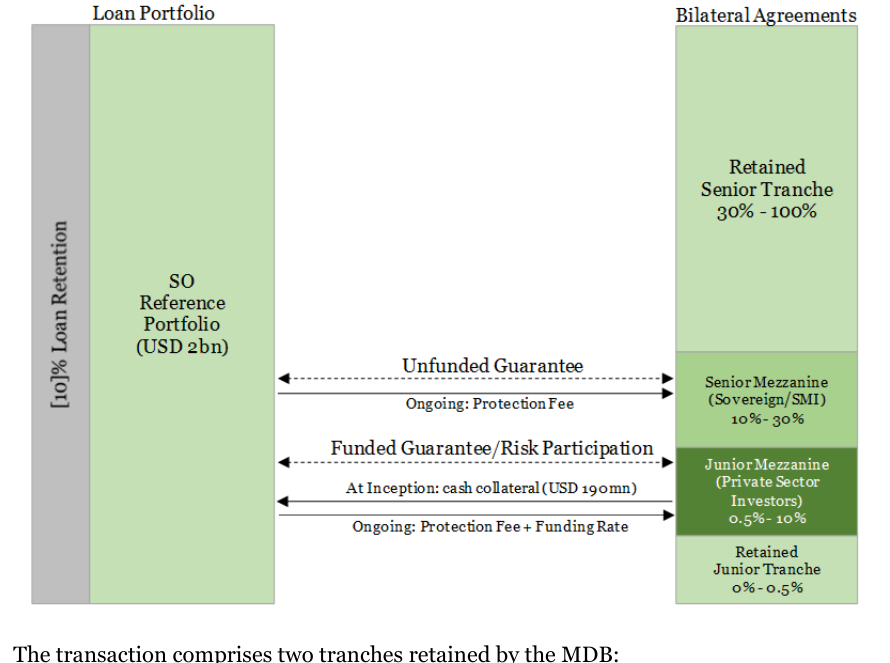
Figure 5.3 describes a USD 2 billion SO synthetic securitisation involving mostly private-sector investors. The transaction structure follows the same principles as the NSO synthetic securitisation with private investors, however the proportions of the different tranches naturally differ as they are adapted to the SO portfolio.
● a large Senior tranche (70% of the transaction in our example), benefitting from a subordination level (i.e. credit enhancement) larger than the total portfolio losses evaluated by S&P so as to carry the lowest possible risk weight of 50% in S&P’s risk transfer methodology for MDBs, and a thin Junior tranche (0.5% of the transaction in our example) absorbing the first losses before private-sector investors.
The structure also comprises two tranches placed to external investors to optimise the cost-benefits of the transaction: ● a Junior Mezzanine tranche, just above the first-loss tranche, placed to private sector investors, and ● a Senior Mezzanine tranche, senior to the first-loss and Junior Mezzanine tranches, large enough so that these three tranches would completely cover the total portfolio losses estimated by S&P.
As in the NSO structure, the private-sector investors would typically be insurers, reinsurers or funds carrying corporate sector risk weights in S&P’s RACF methodology. The Junior Mezzanine is then funded and cashcollateralised for the MDB’s benefit, to lower its risk weight. With cash collateral invested in securities from a sovereign or multilateral institution rated AA- or above, the Junior Mezzanine’s risk weight would be as low as 3%.
Given the Junior Mezzanine’s funded nature, investors will require a remuneration covering both its risk and funding cost, typically in the range of a 10% annual coupon. The Junior tranche size is set so that the Junior Mezzanine’s risk falls in a range matching the investors’ risk appetite and consistent with a 10% annual coupon. As the Junior Mezzanine has a relatively high coupon, it is important to limit its size. For this SO portfolio, the Junior Mezzanine size is limited to 9.5%, creating a 10% aggregate subordination for the Senior Mezzanine.
The Senior Mezzanine tranche is an unfunded guarantee sourced from a highly-rated sovereign or SMI. The SO nature of the portfolio should facilitate sourcing a larger Senior Mezzanine in this structure compared with the NSO synthetic securitisation with private investors. We consider a sizeable 20% Senior Mezzanine, which permits to limit the retained Senior tranche to no more than 70% and a 0.3% annual protection fee.[25][26]
The Senior Mezzanine guarantee is assumed to be sourced from a sovereign or multilateral counterparty rated at least AA- which permits to achieve the lowest 3% risk weight in the RACF methodology. The retained Junior tranche carries a 1250% risk weight and the funded Junior Mezzanine is only 3% risk-weighted (as we explained above).
The 30% subordination of the retained Senior tranche covers portfolio losses from the RACF methodology in all likely circumstances. The Senior tranche then benefits from an implied rating of at least A and carries a 50% risk weight in S&P’s risk transfer methodology for MDBs.
Table 5.5 summarises the parameters of the SO synthetic securitisation involving private-sector investors. The ‘RT Cost’ column contains the assumptions of annual margins paid to the mezzanine tranches sourced from external investors/protection sellers. The ‘RW after RT’ column recapitulates the assumptions of risk weights carried by the tranches after risk transfer.
The weighted average cost of risk transfer (excluding set-up and operating costs of the transaction) comes out at 1.01% (67% of the average loan margin) and risk-weighted assets are reduced to 42% of the pool size (from 100%).

5.5.2 SO synthetic securitisation with sovereign/SMI counterparties
We analyse the example of an SO synthetic securitisation involving mostly sovereign, supranational and multilateral investors.
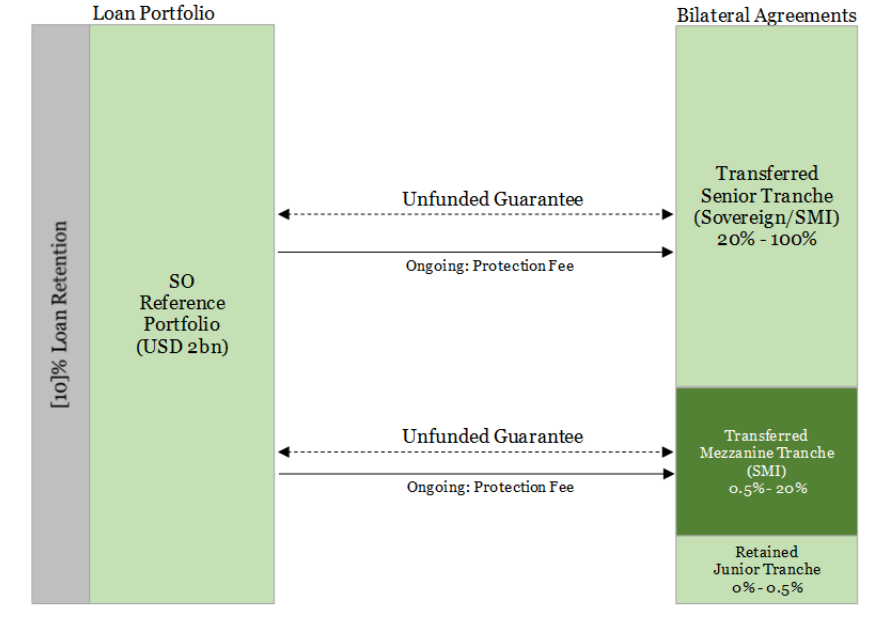
Figure 5.4 illustrates a USD 2 billion SO synthetic securitisation involving mostly sovereign, supranational and SMI investors. The structure is similar to AfDB’s 2022 SO transaction but includes a retained thin Junior tranche in case it is required to protect the Mezzanine from first losses. This structure adapts the previous SO synthetic securitisation with a view to minimising the risk and risk-weighted assets retained by the MDB via unfunded risk transfer while optimising the transaction cost.
We have assumed the following tranching for this SO synthetic securitisation: ● a thin first-loss Junior tranche of 0.5% retained by the MDB, ● a Mezzanine tranche of 19.5% of the transaction, sourced as an unfunded guarantee from an SMI rated a least ‘A’ by S&P, and ● a Senior tranche for the remaining 80% of the portfolio, also in the form of an unfunded guarantee, obtained from a highly rated sovereign, supranational or multilateral institution.
Table 5.6 summarises the parameters of an SO synthetic securitisation involving mostly sovereign and multilateral investors. The ‘RT Cost’ column contains the assumptions of annual fees paid to the Mezzanine and Senior protection providers. The ‘RW after RT’ column recapitulates the assumptions of risk weights carried by the tranches after risk transfer.
Given the SO nature of the portfolio, protection fees are expected to come out cheaper than for the NSO portfolio. The Mezzanine and Senior tranches are assumed to receive annual protection fees of 2% and 0.3% respectively.[27]
The retained first-loss Junior tranche carries a 1250% risk weight. Thanks to the A-rated SMI providing the unfunded guarantee, the Mezzanine tranche benefits from a 9% risk weight in S&P’s RACF methodology. The Senior unfunded guarantee being sourced from a sovereign or supranational rated at least AA-, it generates the lowest risk weight of 3% in the RACF methodology.
In this structure, the weighted average cost of risk transfer (excluding set-up and operating costs of the transaction) comes out at 0.63% (42% of the loan margin) and risk-weighted assets fall to 10.4% of the pool size (from 100%).

5.6 Benefit to cost of synthetic securitisation risk transfers
The assumptions relating to the portfolios and to the counterparties of the synthetic securitisations permit to calculate unadjusted risk-weighted assets before and after risk transfer in the S&P rating methodology.
To assess the efficiency of risk transfer transactions, we need an efficiency metric. We retained a benefit-to-cost metric defined as the ratio of (a) the risk-weighted asset reduction after risk transfer divided by the portfolio risk-weight assets before and (b) the cost of risk transfer (expressed as a loan margin given up) divided by the average gross loan margin of the portfolio before risk transfer.
( RWA after risk transfer RWA before risk transfer ⁄ ) Benefit to Cost= ( Spread given up in risk transfer Average loan margin before ⁄ )
Table 5.7 recapitulates the four types of risk transfer transactions considered via synthetic securitisation, the cost of risk transfer (column ‘RT Cost’) and the weighted average risk weights after risk transfer (column ‘RW after RT’). It also sets out the Benefit-to-Cost calculations obtained.
For both the NSO and SO portfolios, the advantageous risk weights of sovereigns and SMIs in the RACF methodology permit to achieve Benefit-to-Cost ratios above 2, in the case of synthetic securitisations with sovereign/multilateral investors.
For the NSO portfolio, the synthetic securitisation involving private-sector investors achieves a Benefit-to-Cost ratio of approximately 1.3, thanks to the portfolio’s high initial risk weight of 150%. However, for the SO portfolio, the synthetic securitisation involving private-sector investors achieves a Benefit-to-Cost ratio of only 0.86. This is because of the higher proportion of spread given-up compared to a more limited reduction of average risk weights (from 100% to 42%) mostly due to 50% risk weight of the retained Senior tranche (which represents 70% of the transaction).
For MDBs constrained by capital, an important outcome sought from risk transfer transactions is to reduce RWAs materially. In synthetic securitisations, private investors have no particular appetite to provide protection on low-risk low-yielding senior tranches, hence such tranches being often retained by the originator.
In the case of MDBs (which are not regulated), retained senior tranches can generate sizeable RWAs in S&P’s RACF methodology, given the minimum 50% risk weight applicable to them. Retained senior tranches, therefore, significantly limit the RWA savings obtained from such transactions, unless the initial average risk weight of the portfolio is much higher than 50%. Thus, a synthetic securitisation involving private investors (for mezzanine tranches) and a retained senior tranche tends to be less efficient for SO portfolios, with lower risk weights, than for NSO portfolios with higher risk weights.
For both NSO and SO portfolios, a way to reduce the RWA impact of a retained senior tranche is to purchase credit protection on it from low risk-weighted counterparties. In S&P’s RACF methodology, the ideal low riskweighted counterparties are highly rated sovereign or multilateral institutions.[28] The credit protection obtained from such counterparties generally entails lower costs (expressed as a percentage of the tranche size) as the protection can be unfunded. These two factors of higher RWA savings and lower costs explain why the two synthetic securitisations involving only sovereign and multilateral counterparties achieve much higher benefitto-cost ratios (above 2 in Table 5.7).
| Type of Exposures Assumed | Rating Gross Loan | Margin RW before | RT | RT Counterparty RT | Cost RW | after RT Benefit to | Cost |
|---|---|---|---|---|---|---|---|
| Non-sovereign loans | B | 3.5% | 150% | Private Sector | 1.55% | 62.3% | 1.32 |
| Non-sovereign loans | B | 3.5% | 150% | Sovereign / SMI | 1.30% | 29.0% | 2.17 |
| Sovereign loans | B | 1.5% | 100% | Private Sector | 1.01% | 42.1% | 0.86 |
| Sovereign loans | B | 1.5% | 100% | Sovereign / SMI | 0.63% | 10.4% | 2.13 |
6. Conclusion
This report examines the efficiency of risk transfers that may be performed by typical Multilateral Development Banks (MDBs). Specifically, we examine how the use of credit insurance or of tranched risk transfer in the form of synthetic securitisation affect a Benefit-to-Cost measure defined as the ratio of percentage economies in required capital divided by the percentage in spread income ceded because of the risk transfer.
Required capital is measured here as the notion of Risk Weighted Assets employed by Standard & Poor’s in the Risk Adjusted Capital (RAC) methodology that it employs to rate MDBs. Risk Weighted Assets multiplied by 23% is the level of capital required in the Standard & Poor’s methodology to achieve the highest level of capital adequacy.
We examine risk transfers involving NSO and SO portfolios and for transactions in which the counterparty is either a Specialised Multilateral Insurer (SMI) or a commercial insurer. The risk weights in S&P’s RACF methodology are significantly more favourable to sovereigns and supranationals (including MDBs and SMIs) than to private insurers (which are treated as corporates). The lowest risk weight for a private insurer is 60% if located in a country of the lowest economic risk group of 1. This remains higher than the 57% risk weight for a BBB- sovereign or supranational.
The lower risk weights that Standard & Poor’s requires in the RACF methodology for exposure to SMIs leads to Benefit-to-Cost ratios above 1.5. Portfolio credit insurance obtained from private sector insurers leads to Benefit-to-Cost ratios below 1 for both the NSO and SO portfolios.
The results for synthetic securitisation risk transfers show that for both NSO and SO portfolios when counterparties are sovereign/multilateral investors, an MDB can achieve Benefit-to-Cost ratios above 2. For the NSO portfolio, the synthetic securitisation involving private-sector investors achieves a Benefit-to-Cost ratio of approximately 1.3, thanks to the portfolio’s high initial risk weight of 150%. However, for the SO portfolio, the synthetic securitisation involving private-sector investors achieves a Benefit-to-Cost ratio of only 0.86. This is because of the higher proportion of spread given-up compared to a more limited reduction of average risk weights (from 100% to 42%) mostly due to 50% risk weight of the retained Senior tranche (which represents 70% of the transaction).
References
AfDB (2019a) “Annual Report 2018,” June, available at: https://www.afdb.org/en/documents/annual-report- 2018.
AfDB (2019b) “Financial Report 2018,” June, available at: https://www.afdb.org/en/documents/financialreport-2018.
AfDB (2023) “Financial Report 2022,” May, available at: https://www.afdb.org/en/documents/financialreport-2022.
Deloitte (2020) “Captive insurance companies of non-insurance groups - key transfer pricing considerations,” available at: https://www2.deloitte.com/uk/en/pages/tax/articles/captive-insurance-companies-of-noninsurance-groups.html.
FitchRatings (2023) “Inter-American Investment Corporation (IDB Invest) Rating Report,” August, available at: https://idbinvest.org/en/investors.
FitchRatings (2024) “Fitch Affirms IDB Invest at ‘AAA; Outlook Stable – Rating Action Commentary,” January, available at: https://idbinvest.org/en/investors.
G20 (2015) “Multilateral Development Banks Action Plan to Optimize Balance Sheets,” available at: http://www.g20.utoronto.ca/2015/Multilateral-Development-Banks-Action-Plan-to-Optimize- BalanceSheets.pdf
G20 Independent Expert Group (“G20 IEG”) (2023a) “Strengthening Multilateral Development Banks – The Triple Agenda (Volume 1),” ICRIER, June, available at: https://icrier.org/publications/the-triple-agenda/.
G20 Independent Expert Group (“G20 IEG”) (2023b) “Strengthening Multilateral Development Banks – The Triple Agenda: A Roadmap for Better, Bolder and Bigger MDBs (Volume 2),” ICRIER, September, available at: https://icrier.org/publications/the-triple-agenda-a-roadmap-for-better-bolder-and-bigger-mdbs/.
G20 Independent Expert Panel (“CAF Panel”) (2022) “Boosting MDBs’ investing capacity – An Independent Review of Multilateral Development Banks’ Capital Adequacy Frameworks,” October, available at: https://www.gihub.org/resources/publications/boosting-mdbs-investing-capacity-an-independent-review-ofmultilateral-development-banks-capital-adequacy-frameworks/.
Galizia, Federico, William Perraudin, Andrew Powell and Timothy Turner (2021) “Risk Transfer for Multilateral Development Banks: Obstacles and Potential,” IDB Working Paper Series 1292, November, available at: https://publications.iadb.org/en/risk-transfer-multilateral-development-banks-obstacles-and-potential.
Gregory, Neil (2023) “Taking Stock of MDB and DFI Innovations for Mobilizing Private Capital for Development,” Center for Global Development (CGD) Policy Paper 290, April, available at: https://www.cgdev.org/publication/taking-stock-mdb-and-dfi-innovations-mobilizing-private-capitaldevelopment.
Humphrey, Chris (2022) “AfDB’s new Room2Run highlights opportunities and questions about MDB risk transfer,” ODI Policy Insight, December, available at: https://odi.org/en/insights/afdbs-new-room2runhighlights-opportunities-and-questions-about-mdb-risk-transfer/.
ICIEC (2023) “Growth and Regeneration in the New Paradigm – 2022 Annual Report Volume-I,” April, available at: https://iciec.isdb.org/annual-report-single-2022/.
IDB Invest (2023) “2022 Information Statement,” February, available at: https://idbinvest.org/en/how-wework/institutional-information/idb-invest-financial-information.
IFC (2023) “IFC Mobilizes $3.5 Billion from Leading Global Insurers to Expand Development Finance,” September, available at: https://pressroom.ifc.org/all/pages/PressDetail.aspx?ID=27768.
Jones, David (2000) “Emerging problems with the Basel Capital Accord: Regulatory capital arbitrage and related issues,” Journal of Banking & Finance, 2000, vol. 24, issue 1-2, 35-58, available at: https://www.sciencedirect.com/science/article/abs/pii/S0378426699000527.
Mathiasen, Karen and Rakan Aboneaaj (2023) “MIGA: The Little Engine That Should,” Center for Global Development (CGD) Policy Paper 309, October, available at: https://www.cgdev.org/publication/miga-littleengine-should.
MIGA (2023) “Management’s Discussion & Analysis and Financial Statements, June 30, 2023,” available at: https://www.miga.org/access-information.
OECD (2020) “Transfer Pricing Guidance on Financial Transactions, Inclusive Framework on BEPS: Actions 4, 8-10,” February, available at: https://www.oecd.org/tax/transfer-pricing/transfer-pricing-guidance-onfinancial-transactions-inclusive-framework-on-beps-actions-4-8-10.htm.
Perraudin, William, Andrew Powell and Peng Yang (2016) “Multilateral Development Bank Ratings and Preferred Creditor Status,” IDB Working Paper Series 697, July, available at: https://www.riskcontrollimited.com/insights/multilateral-development-bank-ratings-and-preferred-creditorstatus/.
Risk Control (2019) “Room2Run: the AfDB’s Approach to Sharing Risk with the Private Sector,” available at: https://www.newmarketcapital.com/wp-content/uploads/2021/11/Room-to-Run_Risk-Control.pdf.
Risk Control (2022) “MDB Sovereign Loan Credit Performance and PCT: Public Data Analysis,” December, available at: https://www.riskcontrollimited.com/wp-content/uploads/2023/05/MDB-Loan-Credit- Performance-and-PCTPublic-Data-Analysis-22-133a-12-12-22-v18.pdf.
Risk Control (2023) “Ratings and Capital Constraints on IBRD and IDA,” September, available at: https://www.riskcontrollimited.com/wp-content/uploads/2023/10/Ratings-and-Capital-Constraints-on- IBRD-and-IDA-23-57a-1-9-23-v70.pdf
S&P Global Ratings (2017) “Criteria | Financial Institutions | General: Risk-Adjusted Capital Framework Methodology,” July, available at: https://disclosure.spglobal.com/ratings/en/regulatory/article/- /view/sourceId/10170016.
S&P Global Ratings (2022) “Criteria | Governments | General: Multilateral Lending Institutions And Other Supranational Institutions Ratings Methodology,” January, available at: https://disclosure.spglobal.com/ratings/en/regulatory/article/-/view/sourceId/12245744.
TDB Group (2022) “Annual Report & Financial Statements 2021,” available at: https://www.tdbgroup.org/annual-reports/#2021.
TDB Group (2023a) “Annual Report & Financial Statements 2022,” available at: https://www.tdbgroup.org/annual-reports/.
TDB Group (2023b) “TDB Group launches TDB Captive Insurance Company (TCI) in Mauritius,” October, available at: https://www.tdbgroup.org/tdb-group-launches-tdb-captive-insurance-company-tci-in-mauritius/.
Appendix 1: Captive Insurers
A1.1 TDB’s creation of a captive insurer The Eastern and Southern African Trade and Development Bank (TDB) created TDB Captive Insurance in 2021 which started operating at the end of that year. TCI is a wholly owned subsidiary of TDB created as a development institution in application of TDB’s charter. It was capitalised for USD 30 million in 2022 and consolidated in the TDB financial statements that year.
In its 2021 annual report, TDB states that TCI was set up to “allow the Bank to realise efficiencies in risk management and accrue the benefits of placing insurance to the Group.”[29]
TDB Group formally launched TCI at its 38th Annual General Meeting in August 2022 in Mauritius. In its 2022 annual report, TDB explains that “the objectives of the launch were to: i. Introduce the new subsidiary of TDB Group to key stakeholders, ii. Explain the concept of Pure Captive business and iii. The rationale for establishing a captive.”[30]
TCI was incorporated in Mauritius, a member of TDB. In a news release on 13 October 2022, TDB states that “Mauritius is a modern captive jurisdiction with sophisticated legal framework through the Captive Insurance Act 2015 and has more than 30 years of experience in captive insurance sector.” The day-to-day management of TCI is entrusted to a Captive Manager, as is often the case for a conventional captive. TDB names the Captive Manager as “Rogers Capital in collaboration with SWAN.”[31]
The TDB (2023b) news release summarises that “TCI provides risk insurance and reinsurance cover exclusively for TDB and TDB Group subsidiaries.” It further specifies that TCI “provides credit and political risk insurance and reinsurance cover for TDB Group subsidiaries, thereby creating greater efficiencies in the Group’s risk management.”
TDB Group’s 2022 annual report (TDB Group (2023a)) provides additional financial information about TCI performance and the Group’s risk mitigation costs (comprising risk down-selling and insurance costs).
About TCI: ● 2022 was the first full year of operation for TCI. ● TCI provided USD 240 million in insurance coverage to the Bank “through 8 transactions, with 75% of insurance coverage provided for Sovereign counterparties, and 25% to Sub-Sovereign and Non- Sovereign counterparties.” ● The insurance portfolio has a “good geographical spread, covering Ethiopia, Kenya, Malawi, Rwanda, South Sudan, Tanzania, Zambia, and Zimbabwe” (8 countries). ● 2022 Statement of Profit and Loss (and other comprehensive expenditure): ○ Income: USD 3.6 million, ○ Expenditure: USD 326k, ○ Net income: USD 3.3 million (all of which is attributable to TDB owners).
For the same year 2022, TDB reports increased risk mitigation costs of USD 42.3 million (4% above USD 40.6 million in 2021). They are broken down as follows: ● 74% Insurance Cover Costs: USD 31.1 million in 2022 (-12% vs USD 35.2 million in 2021), ● 26% Risk-participation Costs: USD 11.1 million in 2022 (+107% vs USD 5.4 million in 2021). The rise was due to “increased use of Master Risk Participation Agreements (MRPA) to manage the Bank’s concentration risk following the growth in Trade Finance volumes.”
The 2022 annual report further details that insurance cover costs are “premiums on insurance cover taken on loans made to various borrowers. As at 31 December 2022, the insurance cover was USD 1.73 billion (December 2021: USD 1.54 billion). The cover was taken with African Trade Insurance Agency Limited, Islamic Corporation for the Insurance of Investments and Export Credit (ICIEC), Mar Risk Services Limited and Lloyds of London.”
A1.2 Why commercial banks create captive insurers In a 2020 report on transfer pricing guidance on financial transactions, the OECD defined captive insurance as “an insurance undertaking or entity substantially all of whose insurance business is to provide insurance policies for risks of entities of the MNE (multinational enterprise) group to which it belongs.”[32]
The OECD (2020) report also states that: ● “There are multiple reasons for an MNE group to use a captive insurance such as: to stabilise premiums paid by entities within the MNE group; to benefit from tax and regulatory arbitrage; gaining access to reinsurance markets; mitigating the volatility of market capacity; or because the MNE group considers that retaining the risk within the group is more cost effective,” and ● “Another possible reason for the use of a captive insurance by an MNE group in addition to those listed is the difficulty or impossibility of getting insurance coverage for certain risks. Where such risks are insured by a captive insurance this may raise questions as to whether an arm’s length price can be determined and the commercial rationality of such an arrangement.”
Captive insurers are considered part of the alternative risk transfer (ART) market. The ART market is a portion of the insurance market which allows companies to purchase coverage and transfer risk without having to use traditional commercial insurance. The ART market also includes specialised insurance products such as insurance-linked securities (e.g. cat bonds).
Captive insurers are often set up by multinational non-financial groups which are not subject to banking capital constraints. They can also be set up by commercial banks with the same objectives of optimisation of intragroup insurance risk management and insurance costs.
Commercial banks also create conventional (‘non-captive’) commercial insurance subsidiaries to sell more traditional insurance products to the banks’ clients (e.g. credit protection, life insurance and insurance savings products). Commercial banks can also set up specialised insurance or reinsurance subsidiaries, for example with a view to providing specialised insurance or re-insurance products to the bank’s clients, for example in the ART market.
In a note following up on the OECD report, Deloitte sets out one type of structure that can be used by captive insurers when they face local regulatory constraints in the jurisdictions where they are meant to operate: the fronting structure.[33]
Figure A1.1: Captive insurer using fronting companies
Figure A1.1 shows different companies (OpCos) within the MNE group operating in varied jurisdictions. They contract insurance with a fronting company which is an insurer able to operate in the relevant jurisdictions. The fronting company fully reinsures the insurance contract with the captive insurer. The captive insurer can decide to reinsure certain risks with third-party reinsurers (outside the MNE group) in the reinsurance markets.
In Deloitte (2020), the key commercial benefits captives can provide to MNE Groups are set out as follows: ● “They can provide coverage for risks that may be difficult or impossible to obtain in the open market due to, for example, the “low frequency” and “high severity” nature of the risk (e.g. oil spills, contingency business interruption, product liability risk, etc.). ● They can reduce volatility in the profits at the OpCo level by ring-fencing assets to pay claims rather than the OpCo bearing the full economic effect of covered losses. ● They can stabilise premiums paid by group members within the multinational group, and ● They can help the group obtain lower premiums in third-party insurance/reinsurance markets as a result of (i) pooling of risks in the captive and (ii) ‘bulk discounts’.”
The 4th bullet point touches upon the advantage of pooling insurance risks within the captive insurer which can benefit from a diversification effect whether it retains the risk or seeks to reinsure certain risks.
Appendix 2: G20 Report Findings on SMI-MDB Interactions
Multilateral Investment Guarantee Agency (MIGA), part of the World Bank Group, has the mandate to promote foreign direct investment (FDI) to developing countries by providing non-commercial guarantees. MIGA has traditionally provided political risk insurance guarantees and credit enhancement to private sector investors and lenders and, since 2023, has started to offer trade finance guarantees.
MIGA’s political risk insurance (PRI) guarantees typically cover the risk of breach of contract by a government, currency inconvertibility and transfer restrictions, expropriation arising from government actions, war and civil disturbance, and capital optimisation for global retail banks with significant exposures to central banks in emerging markets (via mandatory reserves relating to local subsidiaries).
MIGA’s credit enhancement product covers the risk of non-honouring of financial obligations (NHFO) arising from a sovereign, sub-sovereign, or state-owned enterprise failing to make a payment when due.
MIGA has also recently developed trade finance guarantees (TFG) as it observed that the COVID-19 pandemic created new pressure on state-owned banks (SOBs) to support trade finance, an essential tool to facilitate global trade, in particular in developing countries and in Africa.[34]
In December 2022, MIGA’s Board of Directors approved the issuance of trade finance guarantees to help crossborder trade that slowed during the COVID-19 pandemic.[35] MIGA’s TFG covers the risk resulting from the failure of a state-owned bank or public authority to pay an unconditional financial obligation related to a trade finance transaction (e.g. short-term trade loans and standby letters of credit).
In February 2023, MIGA concluded its first trade finance guarantee by signing a partnership agreement with EBRD to support trade transactions conducted through state-owned banks in Ukraine and other emerging markets and developing economies (EMDEs). MIGA will issue up to US$200 million of TFGs over a period of up to 6 years, against the risk of non-payment by SOBs on guarantees granted by EBRD under its trade facilitation programme. In August 2023, MIGA signed a second TFG for EUR 95 million with FirstRand Bank of South Africa, covering the risk of non-payment by the Côte d'Ivoire government of short-term trade payments to suppliers.
The CAF Panel (2022) report included a recommendation calling on MIGA and MDBs to “collaborate on transferring portfolio risk from MDB balance sheets through MIGA’s insurance products and reinsurance capability.”[36] It noted that MIGA had a highly efficient capital model supporting gross exposures of USD 23 billion with USD 1.7 billion operating capital, helped by active use of reinsurance (close to 65% of MIGA’s portfolio at end June 2023).[37]
Furthering the CAF Panel report, the Independent Group of Experts (G20 IEG) commissioned by the 2023 Indian G20 Presidency called for a tripling of sustainable lending levels of MDBs by 2030. Among the means to achieve this, it also called on MIGA to “play a much larger role for the MDB system by tripling its annual guarantee and distribution activities by 2030.”[38]
In its Triple Agenda (Volume 2) report, the G20 IEG recommended among others that MIGA: ● develops collaboration and partnerships with MDBs, including for portfolio risk transfers, ● adjusts its risk tolerance using reinsurance for less risky guarantees (to free up its own capital), keeping on its balance sheet riskier guarantees with high development and climate impact, and partnering with other World Bank Group (WBG) entities and other MDBs to help free up their capital, ● establish a liquidity facility to enhance the benefit of PRI coverage for private investors (permitting to maintain payments during an ongoing arbitration), in particular for private banks subject to the Basel III framework, ● expand eligibility of its NHFO guarantees to countries and firms rated below BB-, in collaboration with the WBG and other MDBs (to benefit from their support in the relevant countries to reduce NHFO risks),
● start discussions with IBRD on an originate-to-distribute loan pricing model, and help harmonise guarantees from IBRD/IDA and MIGA and bring them under single management.
At end June 2023, MIGA had USD 27.9 billion in gross guarantee exposures and had reinsured USD 18.4 billion, resulting in a 64.6% reinsurance rate. It issued USD 6.4 billion in new guarantees during its FY23 financial year, spanning over 29 countries and five regions of the world (mostly Sub-Saharan Africa, Europe and Central Asia, and Latin America and the Caribbean). New guarantees issuance in FY23 represented a significant increase over the previous FY22 (USD 4.9 billion) and previous years.[39]
MIGA is not rated. For reserving, risk management and capital management, it uses its own internal models, in particular its own economic capital (EC)[40] and risk capital (RC)[41] models. MIGA considers its RC to be a comprehensive capital adequacy metric which is relevant to compare to its available actual capital, and relevant to set up capital adequacy target levels.
In its Management’s Discussion & Analysis and Financial Statements for FY23, MIGA discloses what it considers to be its current headroom to take on more guarantee exposure, given the current authorisations from its Board of Directors in relation to maximum amount of liability and use of reinsurance. MIGA’s maximum amount of contingent liability is currently limited to “500% of the sum of its unimpaired subscribed capital and reserves plus by 100% of the exposure ceded to reinsurers.”[42]
Given its current rules, MIGA’s gross guarantee exposure could increase up to USD 57.9 billion (from USD 27.9 billion end June 2023), assuming 70% reinsurance. Therefore net guarantee exposure could increase to USD 17.4 billion (from USD 9.5 billion end June 2023).
This maximum gross exposure amount would represent approximately 2.1 times the gross guarantee exposures at end June 2023. These are the exposure amounts which can be compared to MIGA’s yearly issuance of gross guarantees of USD 6.4 billion in FY23. Multiplying this amount by 2.1, the current maximum amount of new guarantees issued could by MIGA could increase to USD 13.4 billion per year. This would represent a very substantial increase in new guarantees issued, but additional capital capacity would be required to reach the WBG’s objective of tripling the amount of new guarantees issued (to USD 20 billion per year) by 2030.
Appendix 3: AfDB’s Reporting on the Room2Run transactions
The CAF Panel report enjoins MDBs to make greater use of risk transfer and, also, advocates greater transparency by MDBs to permit shareholders to exercise their governance role more effectively. The AfDB has been unusually transparent in the effects of its risk transfer activities on its risk levels and scope to lend. This appendix presents information issued by the AfDB pertaining to the impact of its risk transfers.
From AfDB (2019a) - page 42: “In 2018, the Bank completed two new commercial credit risk transfer mechanisms as part of its “Room to Run” balance sheet optimization in line with G20 calls to multilateral development banks to optimize their balance sheets while mobilizing additional financial resources. The transactions involved synthetic securitization and credit insurance on its non-sovereign portfolio in Africa aimed at reducing concentration risk and creating additional lending headroom. The two transactions with a total notional value of USD 1.5 billion freed up more than USD 1 billion in headroom. Like the EEAs, these transactions are accounted for as financial guarantees.”
From AfDB (2019b) - page 7: “Through the Room-to-Run initiative and in response to G20 calls to MDBs to optimize their balance sheets while mobilizing additional financial resources, the Bank approved, in 2018, two landmark transactions. A “first-of-its-kind” USD 1 billion synthetic securitization of a Multilateral Development Bank (MDB) nonsovereign loan portfolio consisting of project finance and loans to financial institutions was executed with a group of investors composed of Mariner, Africa 50 and the European Commission. Mariner and Africa 50 are providing credit risk protection to cover losses between 2% to 17.25%, while the European Commission (EC) is providing a third loss tranche from 17.25% to 27.25%. The Bank retains the first loss tranche of up to 2% and the residual risk above 27.25%. The Bank is discussing with the European Commission to redeploy the equivalent amount of the headroom released in renewable energy projects targeting investment in Africa. Additionally, the Bank also closed a USD 500 million credit insurance transaction structured to cover a portion of its portfolio of non-sovereign operations. The African Trade Insurance Agency (ATI) will be the direct insurer facing the Bank though the transaction involves a number of Lloyd’s and Company private reinsurers who will share the risk on African financial institutions. These transactions will release some risk capital and are expected to create around USD 1.16 billion in additional lending headroom.”
From AfDB (2023) – pages 10-11 “The Room 2 Run Sovereign (R2RS) BSO transaction was executed in October 2022 with the UK’s Foreign Commonwealth and Development Office (FCDO) and three private insurers from the Lloyd’s market. It is a purely synthetic transaction meaning that the Bank remains the lender of record of the covered loans and guarantees in the reference portfolio. Specifically, R2RS is structured as a credit protection of up to USD 2 billion on a notional reference portfolio exposure to eleven (11) regional member countries selected from the Bank’s portfolio of sovereign assets eligible to borrow from its non-concessional window. It has provided the Bank with an estimated additional USD 2 billion in new lending capacity for climate finance. This is in line with the BSO’s primary objective of increasing the efficient use of the Bank’s risk capital by hedging its portfolio credit risk and thereby creating additional headroom for the Bank’s operations. In addition to this primary objective, R2RS achieves a secondary finance mobilization goal of creating new pathways that enable Africa’s development projects to benefit from new sources of private capital.”
– pages 46 “Room 2 Run Sovereign transaction which at inception improved the Bank’s Risk Capital Utilization Rate (RCUR) by 5.1 percent and the Weighted Average Risk Rating (WARR) by 0.2 percent also strengthens S&P’s main capital adequacy metric, the Risk Adjusted Capital ratio by 1.5 percent, which represents an important buffer to further strengthen the Bank’s risk bearing capacity.”
The weighted average risk rating relates to the weighted average rating for all loans and guarantees within the sovereign portfolio. It measures the Sovereign portfolio's overall risk profile and credit quality.” “Risk Capital Utilization Ratio (RCUR): This metric tests the Bank's capital adequacy and risk-bearing capacity. A strong capital position over time assures the Bank's ability to lend even during crises and withstand adverse non-accrual shocks.”
Risk Control 8 Golden Square London W1F 9HY +44(0)20 3307 0730 www.riskcontrollimited.com
Notes
[1] The first of these was implemented in 2015 and involved IDB, AfDB and IBRD. In 2020 and 2022, IDB engaged in additional EEAs with ADB.
[2] Source: ADB’s 2022 Annual Report and ADB’s news release of 18 August 2022 (https://www.adb.org/news/adb-partners- global-insurers-mobilize-1-billion-lending-capacity-financial-institutions).
[3] See IDB Invest (2023).
[4] See FitchRatings (2023).
[5] See FitchRatings (2024).
[6] In MCPP FIG, FIG means financial institutions group and the three MCPP FIG facilities support additional IFC lending to financial institutions in emerging economies.
[7] See IFC (2023).
[8] See G20 IEG (2023a), “The Triple Agenda (Volume 1)” report.
[9] See AfDB’s Financial Report 2022, AfDB (2023).
[10] See https://iciec.isdb.org/news-and-events/iciec-and-isdb-launch-innovative-us2-billion-covid-19-guarantee-facility-in- support-of-private-sector/.
[11] See ICIEC (2023).
[12] In the IsDB Group, cumulative undisbursed commitments (CUCs) are defined as the undisbursed amounts of all the active projects that are effective, and either disbursing or not disbursing.
[13] See CAF Panel (2022), Recommendation 3E, pages 38-39.
[14] See MIGA (2023).
[15] See G20 IEG (2023b), the “Triple Agenda (Volume 2)” report.
[17] In Basel and in the rating agency treatments, the RW for any given asset is conventionally derived as the ratio between the capital necessary to maintain a confidence level of 99.9% when a specialist portfolio is held versus the capital necessary for an asset which achieves the same confidence level when the capital to par value equals 8%.
[18] RACF refers to the Risk-Adjusted Capital Framework Methodology in S&P Global Ratings (2017).
[19] See S&P (2022).
[20] See S&P (2017), Table 8.
[21] This was the case in AfDB’s 2018 Room2Run NSO synthetic securitisation (see Risk Control (2019)).
[22] The same approach was adopted by AfDB in its 2018 Room2Run transaction synthetic securitisation.
[23] A 5% annual protection fee is likely conservative for the Mezzanine tranche, given its 2% subordination, compared with a typical 10% pricing range for funded Mezzanine tranches.
[24] A 0.5% annual protection fee appears relatively prudent for the Senior tranche given its 20% subordination, compared with the 0.15% pricing of the European Commission senior mezzanine tranche and in AfDB’s 2018 Room2Run and the total cost information (below 0.25%) AfDB’s 2022 Room2Run.
[25] We would expect the SO-backed Senior Mezzanine tranche to be priced cheaper than the 0.5% in the NSO-backed transaction, given the better credit risk profile of the SO portfolio and the larger tranche size (generating higher annual revenue for the protection seller).
[26] The 0.3% annual protection fee remains prudent compared (a) with 0.15% paid to the EC’s EFSD in Room2Run 2018 (see Risk Control (2019)) and (b) with the UK FCDO protection fee in Room2Run 2022 which had a total transaction cost not exceeding 0.25% (see Humphrey (2022)).
[27] The Senior 0.3% annual protection fee remains prudent compared with the UK FCDO protection fee in Room2Run 2022 for which the total transaction cost did not exceed 0.25% (see Humphrey (2022)).
[28] For example, rated A or above by S&P and, therefore, carrying a risk weight of 9% or less.
[29] See TDB Group (2022).
[30] See TDB Group (2023a).
[31] See TDB Group (2023b).
[32] See OECD (2020).
[33] See Deloitte (2020).
[34] Source: MIGA’s Annual Report 2021.
[35] See MIGA (2023).
[36] See CAF Panel (2022), Recommendation 3E, pages 38-39.
[37] See MIGA (2023).
[38] See G20 IEG (2023b), the “Triple Agenda (Volume 2)” report.
[39] MIGA’s 2022-23 financial year (FY23) ran from 1st July 2022 to 30 June 2023.
[40] MIGA’s Economic Capital (EC) comprises capital consumed by the guarantee portfolio plus capital to be held against operational risk and the loss risk in the investment portfolio.
[41] MIGA’s Risk Capital (RC) is defined as its total EC plus buffer capital calculated with a stress testing tool using stress scenarios at project level and country level, as well as systemic macroeconomic and systemic event-driven scenarios.
[42] See MIGA (2023), section 7. Capital Management.