

This note presents comparisons of risk weights calculated using three approaches proposed in the recent Basel consultative paper on securitisation capital, BCBS 269.[1] These approaches are the Internal Ratings Based Approach (IRBA), the External Ratings Based Approach (ERBA) and the Standardised Approach (SA). The data we employ is supplied by a group of eight GFMA member banks and comprises capital estimates and other data fields for 4,614 individual securitisation tranches. We compare the capital implied by the different approaches, focussing on two dimensions of consistency: (i) comparisons of average risk weight levels for particular asset classes and (ii) correlations of individual tranche risk weights implied by the approaches. We find that the average levels of capital for asset classes are quite different when one compares IRBA, ERBA and SA risk weights for particular asset classes. Some discrepancies in average capital levels are partly reduced when one limits attention to tranches issued since 2010. We show that the different approaches, and in particular the IRBA and ERBA, yield quite different rank orderings and hence low rank order correlations for regulatory capital. This suggests that the proposed approaches do not satisfy the principle of “Comparability” advocated by BCBS (2013a), a recent Basel paper on desirable characteristics of capital regulations. It should be emphasised that the analysis reported here sheds light on the consistency of the three BCBS 269 approaches to capital calculation but, since we do not here employ a formal risk model as a reference point, does not reveal whether the absolute levels of capital implied by the Basel proposals are appropriate. Joint Trade Associations (2014) and Duponcheele et al (2014a) and (2014b) provide analysis of what absolute levels of capital are justified for different asset classes based on analysis using formal risk models.
Quantitative Impacts of BCBS 269 Securitisation Capital Approaches
Date: 12-08-2014 Number: 14-73a
1. Introduction
This note examines the consistency of the different approaches to calculating capital proposed by the Basel Committee in its recent consultative paper BCBS (2013b). That document (also known as BCBS 269) sets out a hierarchy of approaches that banks would employ in calculating regulatory capital for their banking book securitisation exposures.
At the top of the BCBS (2013b) hierarchy is the Internal Ratings Based Approach (IRBA). This approach is based on a simple, ad hoc formula already employed in US bank trading book capital calculations, known as the Simplified Supervisory Formula Approach (SSFA). The SSFA allocates capital to securitisation tranches depending on their attachment and detachment points, a measure of pool regulatory capital, and a parameter, p, which determines the ratio between the pool of exposures’ pre-securitisation capital requirement and the post-securitisation capital requirement for the securitisation tranches taken together. Under the IRBA, the p parameter is permitted to depend linearly on a set of deal characteristics.
The second approach in the hierarchy is the External Ratings Based Approach (ERBA). Under the ERBA, tranche capital depends on a rating provided by an agency. Using the rating, the contractual tranche maturity and a flag for most senior tranche, one may infer risk weights from a look up table.[2]
The third approach in the hierarchy is the Standardised Approach (SA). The SA, like the IRBA, employs the SSFA capital formula. But under the SA, the parameter p is a constant, set equal to 1.5 for re-securitisation tranches and to 1.0 for all other securitisation tranches.
In this note, to investigate the consistency of the BCBS (2013b) approaches, we employ securitisation capital data provided by Global Financial Markets Association (GFMA) member banks. This data contains capital estimates for these banks’ securitisation positions based on the different BCBS
(2013b) approaches and other information including tranche attachment and detachment points, pool delinquency estimates and IRBA and SA measures of pool capital.
We examine two “dimensions” of consistency, comparisons of level (either averages or fractions of tranches that have higher capital under one approach than another) and measures of correlation (including rank order and linear correlations).
Our main finding is the inconsistency of risk weights implied by the three approaches and most notably those obtained using the IRBA and ERBA. Inconsistencies are evident both in the average risk weights by asset class and the rank ordering of capital for individual tranches. (Note that these are different aspects of inconsistency and that risk weights might be the similar or not in either dimension while differing substantially in the other.)
Inconsistency matters because Dodd-Frank rules preclude use of the ERBA by US banks while in most non-US jurisdictions, banks are not permitted to use proxy data in calculating KIRB inputs to the IRBA. Hence, under the current BCBS hierarchy of approaches, investor banks in non-US jurisdictions will overwhelmingly employ the ERBA while US investor banks will use the IRBA. Unless there is a radical relaxation of rules on employing proxy information in calculations of KIRB for working out regulatory capital for securitisations, our findings on inconsistency suggest that the BCBS 269 proposals will yield a bi-polar and quite disjointed securitisation capital regime.
The note is organised as follows. Section 2 describes the data employed and shows the distribution of the tranche observations employed by asset and seniority sub-classes. Section 3 (i) presents average risk weights for securitisation tranches under the SA, IRBA and ERBA, and (ii) examines the rank order correlations between the individual-tranche levels of capital implied by these approaches. To shed light on calibration, Section 4 calculates the average SSFA p parameter value that yields the same IRBA and SA risk weights as those implied by the ERBA. Section 5 presents results including estimates of ERBA risk weights based on bank internal ratings and IRBA risk weights based on proxy KIRB estimates. Section 6 presents results for securitisations issued in 2010 or later and Section 7 concludes. Finally, the Appendix provides some additional correlation measures and information on the samples employed in Sections 5 and 6.
2. Data
The securitisation tranche data provided by the GFMA member banks is as follows:
• ISIN/CUSIP
• Internal Ratings Based Approach (IRBA) RWA (%)
• Did you use a validated model (internal or external) to calculate KIRB for IRBA calculation?
• IRBA p-value
• Attachment Point (A)
• Detachment Point (D)
• KIRB
• External Ratings Based Approach (ERBA) RWA (%)
• Standardised Approach RWA (%)
• KSA
• Delinquent Assets (W)
• Notional Size of Position ($USD)
• Asset Class (Industry Defined)
• Seniority of Position
• Did Purchasing Bank Originate Assets?
We are particularly interested in comparisons of IRBA and ERBA capital. For many of the observations in the data, IRBA capital estimates were not available. Hence, we generally performed calculations with a large sample in cases when IRBA information was not required and a smaller sample when IRBA data was needed.
Of the eight banks that participated, two provided large amounts of data. One provided a more moderate volume of data but of a high quality in that almost all fields were present. Other banks supplied smaller volumes of data either because their books were smaller or because they were only able to provide data for particular asset classes or sub-samples. Most of the findings of this note are driven by the data from the three banks that supplied either large volumes of data or a moderate dataset with all fields available. Although banks from several continents contributed data, a large majority of tranche observations come from US-domiciled banks.
The total number of observations represented in the dataset was 6,935. Removing observations with large numbers of missing fields or for which ratings based capital estimates were unavailable, we obtained 4,844. Further removing duplicates, where more than one bank provided data for a given ISIN, reduced the number of observations to 4,614.
Figure 1 shows the breakdown by asset class. The dataset employed in preparing the figure consists of the one with 4,844 observations described above. There is relatively strong representation of Residential Mortgage Backed Securities (RMBS), with most observations being for non-recourse mortgage pools, Collateralised Loan Backed Obligations (CLOs) and Commercial Mortgage Backed Securities (CMBS). There is some coverage of Retail Auto Finance, Student Loan and Credit Card deals.
Figure 2 shows the breakdown by seniority. The capital approaches depend on whether a given tranche is the most senior in the structure. So in the figure, we show the fraction of observations for which the tranche is “Most Senior”. This amounts to 61%. Again, the dataset here being considered is the one with 4,844 observations.
In determining whether the tranche is “Most Senior” within its structure, we do not rely on the seniority flag provided by the participating banks. When we compared the values taken by this flag with data from Bloomberg, we found many discrepancies. We therefore used instead as indicator of “Most Senior” whether the detachment point of the tranche was unity. This also showed some discrepancies from data we obtained from Bloomberg (see Table 1) but many fewer.
For some asset classes shown in Figure 1, the number of observations was quite small and the quantity of observations for which data was available for capital under the three approaches was negligible. We, therefore, delete these asset classes, specifically “SME Finance”, “CMBS Single Borrower/Single Credit” and “Other Retail Assets”, from our sample. This leads us to drop a mere three observations.
We also deleted from the sample observations which had both attachments of zero and detachments of unity. From talking to the contributing banks, we understood that these observations corresponded to distressed deals in which all but the most senior tranche had been wiped out by pool defaults. While some banks still counted these as securitisations, we do not feel it appropriate to retain them in the sample as they are no longer strictly speaking tranched positions and the regulatory capital they would attract under BCBS 269 would be much higher than that implied by an on-balance-sheet treatment.
A summary of the numbers of observations for which we had capital estimates under the different capital approaches, and that we employ in the exercises reported below, is provided in Table 2. Note that even where significant data is available, because individual contributing banks tended to supply data concentrated in particular asset classes, in some cases, the data may come from very few banks.
The right hand columns in Table 2 show the numbers of observations for which capital estimates are available based on all three approaches. These observations are far fewer than the observations for which we have one or other of the capital estimates. The scarce variable in most cases is IRBA capital so the numbers for which we have all three capital estimates is close to the number for which we have IRBA capital.
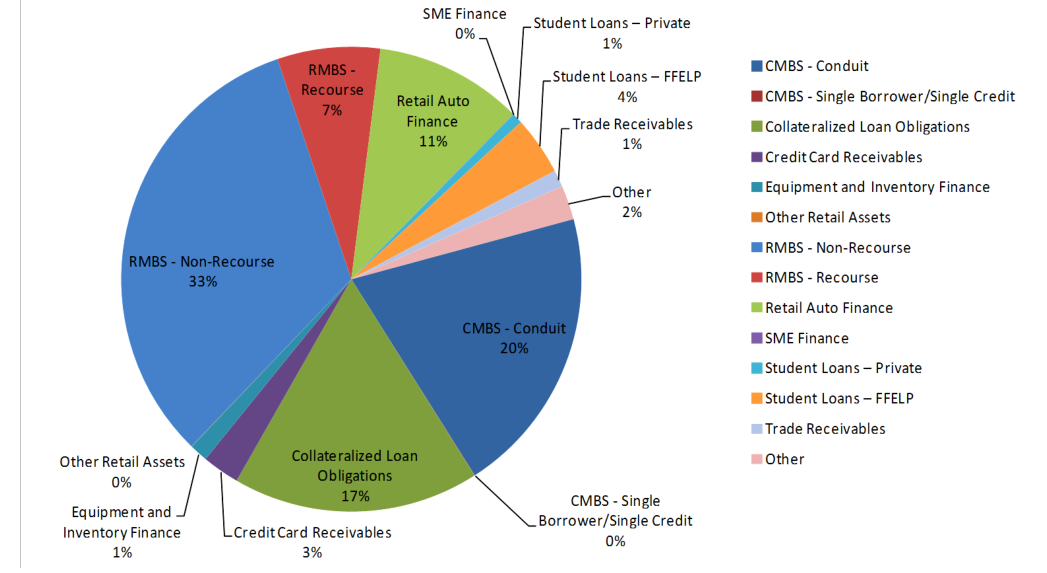
Notes: this figure shows the distribution of the dataset by asset class. The asset class definitions were determined by the participating banks.
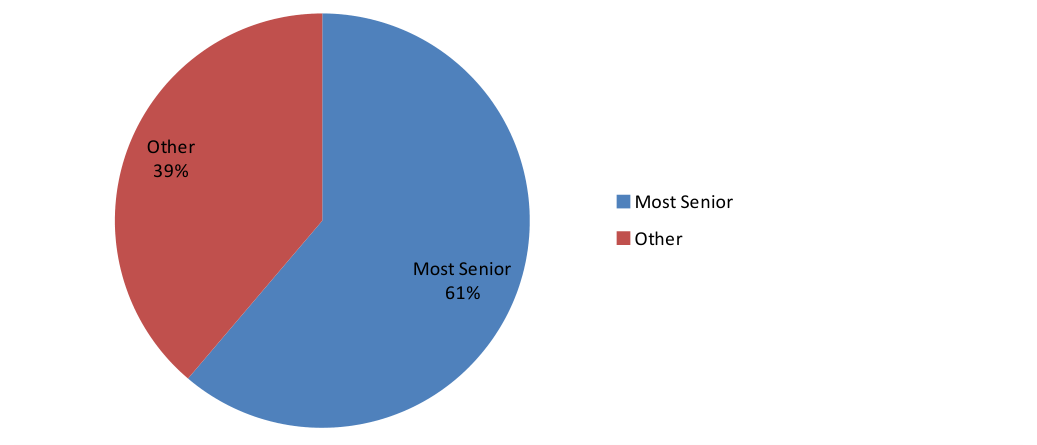
Notes: the above figure shows the distribution of the dataset grouped according to Seniority, i.e., whether tranches are classified as “Most Senior” or “Other”.
| Most | Other | Null |
|---|---|---|
| Senior | ||
| 877 | 29 | 2059 |
| 86 | 603 | 1190 |
Notes: this table displays the number of observations which were assigned to be “Most Senior” by both Bloomberg and by the participating banks. Note that, for instance, 86 tranches were described as “Most Senior” Bloomberg but were considered “Other” by the banks.
| Most | Most | Most | Most | ||||||
|---|---|---|---|---|---|---|---|---|---|
| Senior | Other | Senior | Other | Senior | Other | Senior | Other | ||
| CMBS - Conduit | 2 | 14 | 551 | 311 | 551 | 311 | 2 | 14 | |
| Collateralised | Loan Obligations | 95 | 31 | 341 | 485 | 342 | 487 | 95 | 31 |
| Credit Card | Receivables | 11 | 0 | 109 | 9 | 109 | 9 | 11 | 0 |
| Equipment and | Inventory Finance | 0 | 0 | 48 | 13 | 48 | 13 | 0 | 0 |
| RMBS - | Non-Recourse | 116 | 112 | 660 | 618 | 657 | 616 | 116 | 112 |
| RMBS - Recourse | 125 | 79 | 229 | 113 | 231 | 114 | 124 | 78 | |
| Retail Auto | Finance | 28 | 28 | 211 | 244 | 211 | 244 | 28 | 28 |
| Student Loans | – FFELP | 82 | 0 | 169 | 4 | 169 | 4 | 82 | 0 |
| Student Loans | – Private | 0 | 0 | 25 | 0 | 25 | 0 | 0 | 0 |
| Trade Receivables | 0 | 0 | 56 | 1 | 56 | 1 | 0 | 0 | |
| Other | 4 | 2 | 86 | 21 | 86 | 21 | 4 | 2 | |
| Total | 463 | 266 | 2485 | 1819 | 2485 | 1820 | 462 | 265 |
Notes: this table displays the number of observations of tranches for which risk weights were available for each of the three approaches as well as for all the approaches, grouped by asset sub-class, and by seniority. Here and in all following tables, “Equipment and Inventory Finance” includes auto fleet and dealer finance.
3. Base Case Risk Weight Results
In this section, we examine average risk weights for each of the asset classes using the three different capital approaches. The averages we report are simple, arithmetic averages over the individual securitisation tranches in an asset-class category. Table 3 shows the results for the set of tranches for which all three capital approaches are available. Table 4 shows results for all the tranches in our larger dataset which, after dropping some asset classes, amounts to 4,841 observations.
The two tables show expected patterns in that risk weights for “Most Senior” tranches are almost never more than those for “Other” tranches for the same asset class. Also, risk weights for nonrecourse mortgages (mostly corresponding to US mortgages) are higher than for recourse mortgages.
But, there is significant variation across the three capital approaches. Overall, averaging over the asset class risk weights for which we have observations, we find that the ratios of average IRBA and SA asset-class-average risk weights to the corresponding ERBA asset-class-average risk weights are 59% and 91%, respectively. So the ERBA is the most conservative on average and the IRBA is least conservative.
Differentiating between “Most Senior” and “Other” tranche categories, one finds that for the “Most Senior”, IRBA and SA are 30% and 63% of ERBA, while for “Other”, IRBA and SA are 75% and 107% of ERBA. So the greater degree of conservatism is driven mainly by “Most Senior” tranches.
To examine how the approaches treat seniority, we calculate the ratio of the weighted average of “Most Senior” Table 3 risk weights to the corresponding weighted average of “Other” risk weights. (Here, the weights are based on the numbers of observations lying behind the averages.) We find these ratios to be: 0.13, 0.32, 0.19, respectively, for the IRBA, ERBA and SA, showing that the IRBA favours senior tranches to subordinated ones much more than does the ERBA, while the SA approach is in the middle.
For individual asset classes, the results in the tables show substantial discrepancies across capital approaches. To highlight a few cases: Senior tranches of CMBS conduits are on average 5 times higher under the ERBA than they are under the SA and IRBA approaches. For retail auto finance, SA risk weights are four times higher than the ERBA and IRBA risk weights, the latter being almost equal. The ERBA risk weights for Most Senior RMBS non-recourse mortgages are twice as high as the SA risk weights and six times higher than the IRBA weights.
Some discrepancies while high are attributable to sparse and unrepresentative data and should therefore be interpreted with care. For example, the average IRBA risk weight for “Most Senior” credit card receivables is based on just 11 observations and examination of the data suggests the observations available are unrepresentative of the asset class generally.
To compare the consistency of the risk weights estimated in Table 4 (which employ a large dataset) with those in Table 3 (based on a more consistent and much smaller dataset), one may calculate the rank order statistic for the (non-null) entries in the two tables. The rank order correlation is 82%.[3] This reasonably high value is reassuring in that it suggests the estimates in Table 3, based on fewer data, are broadly consistent with those obtained using a larger dataset less subject to sampling error.
The results in Tables 3 and 4 permit one to evaluate the consistency or otherwise of average risk weights by asset class. As mentioned in the introduction, one may analyse the consistency of capital calculation approaches using a variety of measures. In broad terms, one may distinguish between comparisons of levels and measures of correlation. In each of these two categories, several possible measures may be employed.
Table 5 shows, for “Most Senior” tranches and “Other” tranches, the fractions of observations which have higher risk weights according to one approach (that indicated by the labels on the left) than are implied by another approach (that indicated by the labels along the top of the table). To take an example, for 83.4% of “Most Senior” tranches, ERBA risk weights are higher than IRBA risk weights.
The results in Table 5 suggest that the ERBA is particularly conservative for “Most Senior” tranches but remains somewhat conservative for “Other” tranches. Overall, the SA is more conservative than the IRBA and less conservative than the ERBA. Note that this way of comparing levels is insensitive to the size of the difference in magnitude.
Note that if two capital approaches yield the same average risk weights or are balanced in the sense that an equal number of tranches are higher by one approach compared to the other, this does not at all mean that they are consistent. Average levels might be equal but the two approaches might generate high capital for completely different set of tranches. In this sense, the “risk sensitivity” they imply will be completely inconsistent. For this reason, it is important also to examine measures of the correlation between the risk weights for individual tranches implied by pairs of approaches.
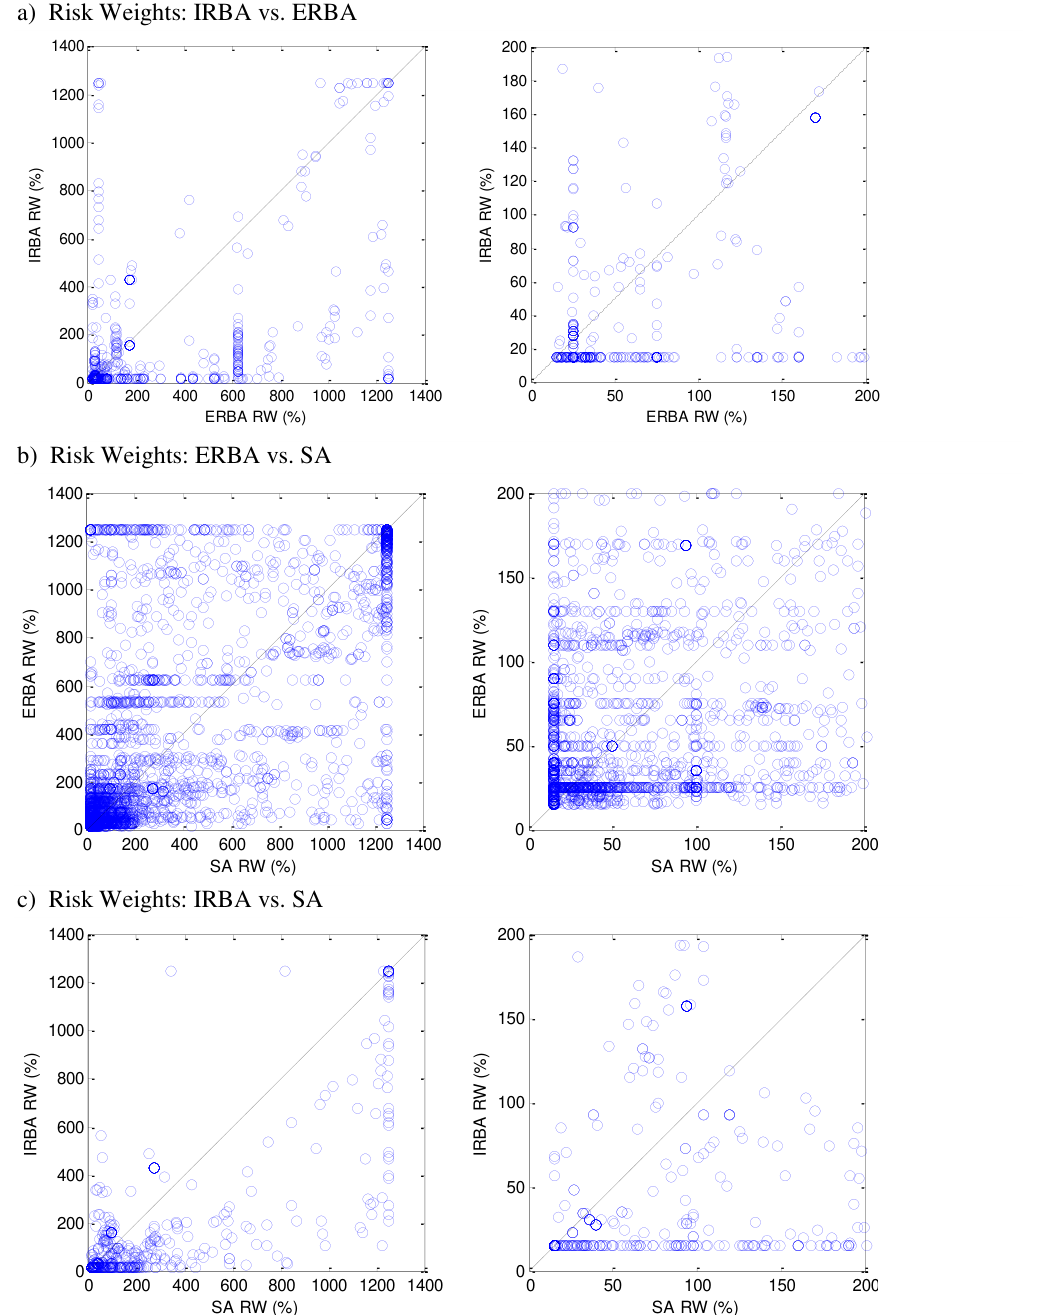
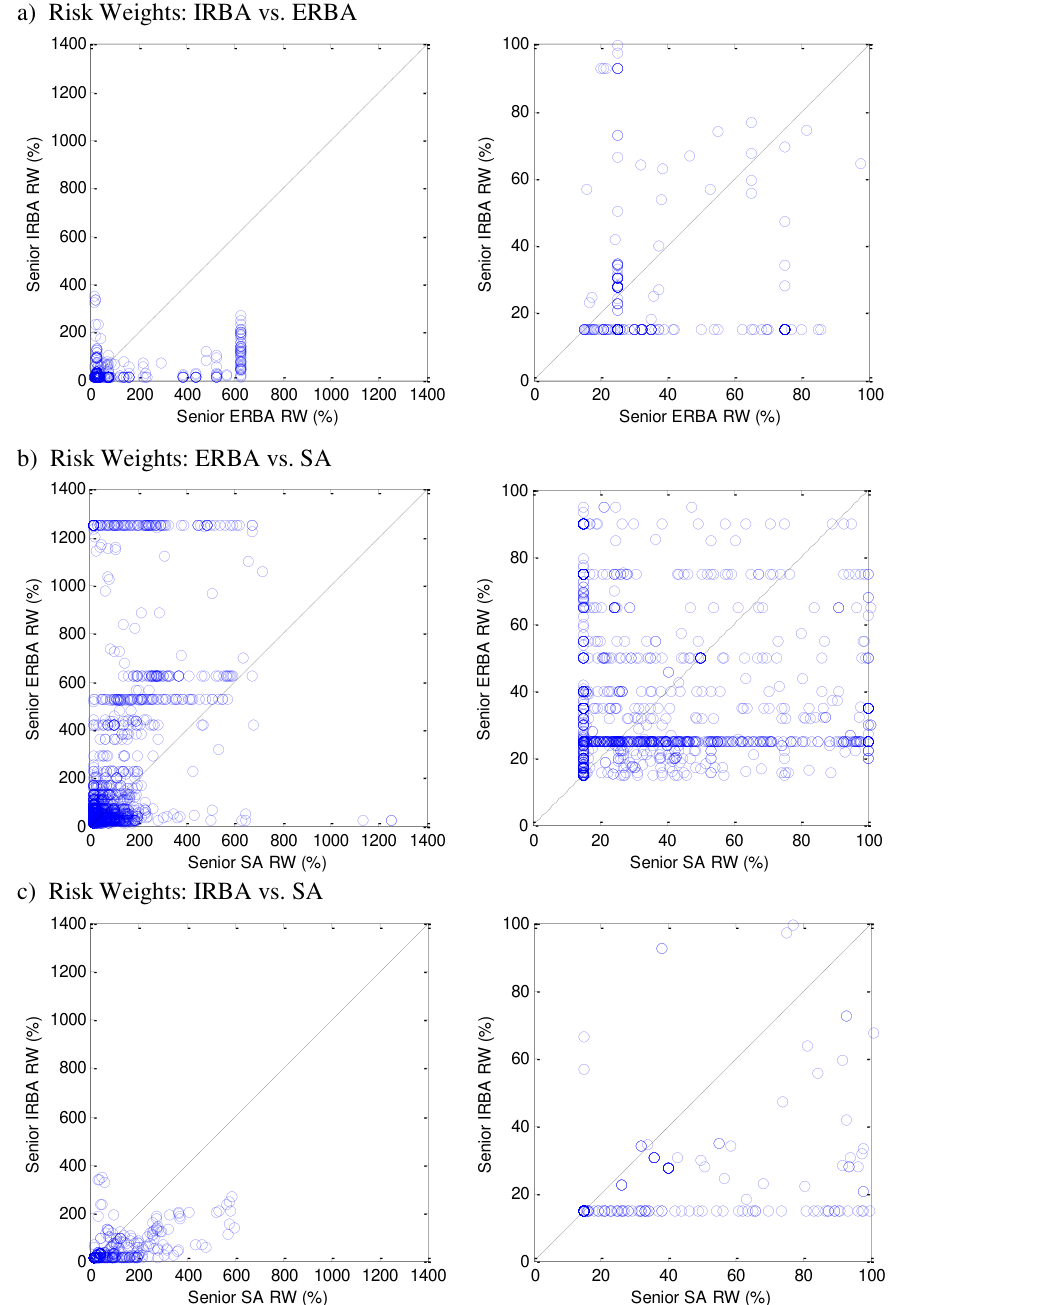
To study the relationship between the IRBA, ERBA and SA capital estimates for individual exposures, we present scatter plots in Figures 3 for all tranches and in Figure 4 for “Most Senior” tranches alone. The scatter plots that appear in each panel in the figures consists of a comparison of risk weights calculated using one approach on the vertical axis with that implied by another approach on the horizontal axis. If two capital approaches were perfectly consistent, all the points would lie on the 45%-line starting at the origin.
Note that each row of the figures consists of two scatter plots. The left hand scatter plots shows risk weights ranging from zero to 1,250%, the maximum possible value. The right hand scatter plot in each row is a “zoomed view” of the data in the bottom left corner of the left hand scatter plot. This presentation permits one to see more detail in the large number of observations close to the origin. These observations correspond to the higher quality (low capital) observations. The axes on the right hand scatter plots show data for which risk weights under the two approaches being compared are less than 200% for Figure 3 and 100% for Figure 4.
The figures show the relatively weak association between risk weights calculated using the different capital approaches. This is particularly striking for the Most Senior tranches. Clumping of points in the lower left hand corner of the plots (evident especially in some of the Figure 3 plots) is indicative of some positive dependence in the corresponding pairs of capital approaches.
Table 6 shows more formal statistical measures of dependence, namely rank order correlations between the risk weights implied by the different approaches. Recall that rank order correlations are obtained by giving each observation for a given capital measure an integer ranking and then calculating the usual linear correlation coefficient (covariance divided by the product of standard deviations) for the two rankings.
The upper blocks that appear in the table (panels a) and b)) exhibit results for “Most Senior” tranches and for “Other” tranches, respectively. If two capital approaches were perfectly consistent in the rankings they imply for tranches, the off-diagonal entries corresponding to those two approaches in the block of numbers appearing in the panel would equal 1.
The rank order correlations between IRBA and ERBA risk weights is 31.0% for “Most Senior” tranches and 39.7% for “Other” tranches. The lower blocks of the table (labelled c), d) and e)) show that the correlations diminish as risk weights decrease. The correlation between the capital calculations corresponding to different approaches, for example, drop to 2.5% between ERBA and SA and 3.3% between ERBA and IRBA when one focusses on risk weights between 15% and 100%, i.e., the high quality end of the market.
When we looked in more detail at what drives the correlation results, we find that they are quite sensitive to the inclusion of certain asset classes. If one excludes RMBS non-recourse mortgages from the sample, the rank order correlations between ERBA and IRBA and ERBA and SA for “Most Senior” tranches drop from 31.0% and 50.0% as shown in Table 6, panel a), to -11.0% and -8.1% as shown in panel a) of Table 7.
In the above tables we have focussed on rank order correlations. Another possible measure of dependence between the risk weights for individual tranches one might use is linear correlations, i.e., simply covariance divided by the product of standard deviations. In examining the dependence of risk weights, an issue is the fact that while most tranches have small risk weights, a few high risk tranches have very large weights.
There is potential for the latter, effectively resembling outliers, to swamp the results. Employing rank order correlations as a measure of dependence reduces this effect. Nevertheless, because they may be seen as more transparent by some readers, we provide linear correlations estimates for the sample in Tables A1 and A2 in the appendix.
To summarise our results for the base case risk weights, the three different capital approaches proposed by BCBS 269 imply very different risk weights for individual asset classes. The differences are most pronounced for senior and high credit quality exposures and for asset classes other than the RMBS with non-recourse mortgages.
| Most | Most | Most | ||||
|---|---|---|---|---|---|---|
| Senior | Other | Senior | Other | Senior | Other | |
| CMBS - Conduit | 0.15 | 4.46 | 0.75 | 6.76 | 0.15 | 4.09 |
| Collateralized Loan Obligations | 0.16 | 1.91 | 0.27 | 1.22 | 0.17 | 0.89 |
| Credit Card Receivables | 2.05 | 0.19 | 0.35 | |||
| Equipment and Inventory Finance | ||||||
| RMBS - Non-Recourse | 0.69 | 4.74 | 4.27 | 6.02 | 2.16 | 7.79 |
| RMBS - Recourse | 0.35 | 1.90 | 0.45 | 3.51 | 0.43 | 1.97 |
| Retail Auto Finance | 0.25 | 0.40 | 0.25 | 0.36 | 0.98 | 1.78 |
| Student Loans – FFELP | 0.15 | 0.26 | 0.37 | |||
| Student Loans – Private | ||||||
| Trade Receivables | ||||||
| Other | 0.15 | 3.45 | 0.25 | 2.28 | 0.16 | 5.66 |
Notes: this table displays average risk weights for exposures for which risk weights were available for all three approaches: SA, IRBA and ERBA. Risk weights are shown for a variety of asset sub-classes and for both senior tranches and other tranches.
| Most | Most | Most | ||||
|---|---|---|---|---|---|---|
| Senior | Other | Senior | Other | Senior | Other | |
| CMBS - Conduit | 0.15 | 4.46 | 0.35 | 1.78 | 0.30 | 2.11 |
| Collateralized Loan Obligations | 0.16 | 1.91 | 1.40 | 6.11 | 0.73 | 5.91 |
| Credit Card Receivables | 2.05 | 0.25 | 1.49 | 0.35 | 4.89 | |
| Equipment and Inventory Finance | 0.29 | 0.28 | 0.53 | 0.86 | ||
| RMBS - Non-Recourse | 0.69 | 4.74 | 3.88 | 7.35 | 1.46 | 8.13 |
| RMBS - Recourse | 0.36 | 2.01 | 0.53 | 3.92 | 0.45 | 2.61 |
| Retail Auto Finance | 0.25 | 0.40 | 0.36 | 0.66 | 0.41 | 2.13 |
| Student Loans – FFELP | 0.15 | 0.31 | 6.80 | 0.30 | 8.35 | |
| Student Loans – Private | 0.46 | 1.00 | ||||
| Trade Receivables | 0.41 | 0.86 | 0.36 | 11.47 | ||
| Other | 0.15 | 3.45 | 2.90 | 4.76 | 0.51 | 4.97 |
Notes: this table displays results for average risk weights for all tranches, regardless of whether risk weights are available for all three approaches. The averages for each approach are reported for asset sub-class, and for seniority.
| IRBA | ERBA | SA | |
|---|---|---|---|
| IRBA | - | 0.166 | 0.269 |
| ERBA | 0.834 | - | 0.694 |
| SA | 0.731 | 0.306 | - |
| b) Other Tranches | |||
| IRBA | ERBA | SA | |
| IRBA | - | 0.332 | 0.298 |
| ERBA | 0.668 | - | 0.555 |
| SA | 0.702 | 0.445 | - |
Notes: each entry shows the proportion of observations for which risk weights calculated using the approach given by the label for that entry’s row are greater than risk weights calculated using the approach for that column. The data employed consists of observations for which all three risk weights are available. Observations for which risk weights by two approaches exactly match are treated as though half have higher risk weights under one approach and half have higher weights by the other approach.
| IRBA | ERBA | SA | |
|---|---|---|---|
| IRBA | 1.000 | 0.310 | 0.709 |
| ERBA | 0.310 | 1.000 | 0.500 |
| SA | 0.709 | 0.500 | 1.000 |
| b) Other Tranches | |||
| IRBA | ERBA | SA | |
| IRBA | 1.000 | 0.397 | 0.794 |
| ERBA | 0.397 | 1.000 | 0.538 |
| SA | 0.794 | 0.538 | 1.000 |
| c) All Tranches, | ERBA | RW 15% to | 100% |
| IRBA | ERBA | SA | |
| IRBA | 1.000 | 0.033 | 0.701 |
| ERBA | 0.033 | 1.000 | 0.025 |
| SA | 0.701 | 0.025 | 1.000 |
| d) All Tranches, | ERBA | RW 100% to | 200% |
| IRBA | ERBA | SA | |
| IRBA | 1.000 | 0.293 | 0.596 |
| ERBA | 0.293 | 1.000 | 0.428 |
| SA | 0.596 | 0.428 | 1.000 |
| e) All Tranches, | ERBA | RW > 200% | |
| IRBA | ERBA | SA | |
| IRBA | 1.000 | 0.588 | 0.847 |
| ERBA | 0.588 | 1.000 | 0.690 |
| SA | 0.847 | 0.690 | 1.000 |
Notes: this table shows the Risk Weight rank order correlations for the three approaches. The results displayed in this table are for Most Senior and All tranches (in panels a) and b) respectively) and for tranches ERBA Risk Weights in different ranges in panels c), d) and e), respectively. The ERBA Risk Weights ranges are 15%-100%, 100%-200% and greater than 200%. For these ranges, we have 434, 101 and 190 observations, respectively.
| IRBA | ERBA | SA | |
|---|---|---|---|
| IRBA | 1.000 | -0.110 | 0.658 |
| ERBA | -0.110 | 1.000 | -0.081 |
| SA | 0.658 | -0.081 | 1.000 |
| b) Other Tranches | – | excluding RMBS | |
| IRBA | ERBA | SA | |
| IRBA | 1.000 | 0.415 | 0.635 |
| ERBA | 0.415 | 1.000 | 0.391 |
| SA | 0.635 | 0.391 | 1.000 |
Notes: the table shows the Risk Weight rank order correlations for the three approaches. The results displayed in this table are for Most Senior and Other tranches (in panels a and b) respectively) excluding RMBS with non-recourse mortgages.
4. Base Case SSFA -values
Recall that the Simplified Supervisory Formula Approach (SSFA) employed in both the SA and IRBA is based on a simple exponential smoothing function with a parameter, p. In the SA, this parameter is constant and set equal to 1.5 for re-securitisation tranches and to 1.0 for all other securitisation tranches.
As well as this parameter, the SA formula depends on Standardised Approach pool capital, KSA and pool delinquencies, denoted W. In the IRBA, the formula depends on IRBA pool capital, KIRB (inclusive of expected losses), and the p-parameter is itself a linear combination of several pool characteristics.
To shed light on the consistency of the three BCBS 269 risk weight calculation approaches, we examine, in this section, the value of the p-parameter for which ERBA capital equals the capital implied by the SA and IRBA. To achieve this, for each individual tranche we find the -values that (given , and ) solve the following equation:
( ) (1)
We then average the -values across asset class and seniority categories (“Most Senior” and “Other”). Figure 5 illustrates for a single tranche how we perform this calibration by extracting a parameter value that finds the zero of equation (1). The red line represents the constant level of ERBA capital, while the blue line shows the IRBA capital as a function of the p-parameter.
Figure 5: Calibrating p from
Following this approach, we obtain the asset-class and seniority-class specific average p-parameter values shown in the first six columns of Table 8. Note that in extracting and averaging p-parameter values for individual tranches, we exclude tranches with IRBA risk weights equal to the 15% floor value.
Our reason for doing this is that the ERBA effectively includes floor levels. If one attempts to extract a p-parameter value for such a tranche without imposing a floor, one obtains exceptionally large outlier values of the parameter which then dominate the averages. To make a fair comparison of the two approaches, it is appropriate, therefore, to drop these observations.
To illustrate what such observations consist of, consider an example that occurs in the dataset for which KIRB was approximately 10% while the attachment point of the tranche was 85%. This tranche is effectively risk free according to the IRBA formula without a floor whereas the ERBA implies a significant capital level.
The calibration results shown in the first four columns of Table 8 suggest reasonable p-parameter values in the range 7% to 94% for all except the RMBS non-recourse on which we shall comment more below.
The base case results shown in the left hand two columns of Table 8 are those extracted from tranches using the IRBA formula, while the fifth and sixth columns show averages of the corresponding pparameters that banks estimate (as linear functions of pool characteristics) as part of their calculation of IRBA risk weights.
The “Most Senior” tranche average p-parameters (column 1) are sometimes lower and sometimes higher than the average values reported by banks for these same tranches (column 5). For “Other” tranches, the extracted ERBA values are mostly lower than the bank estimates with two exceptions, CMBS conduits and RMBS non-recourse.
The “Adjusted” results reported in the table show average p-parameter values based on ERBA risk weights less 20% (with the resulting ERBA weights being floored at 15%). The idea is to look at the p-parameter values that would be implied by the ERBA if a moderate advantage were given for use of the IRBA. (Regulators regularly suggest that use of the more complex approach should be rewarded by slightly preferential risk weights.) The adjusted results are generally lower than the base case. One might wonder why in a few cases the order is reversed. This is to do with the dropping of some observations for which the IRBA risk weights hit a floor of 15%.
Note that the differences between the ERBA-implied p-estimates and the bank supplied p-parameters appear less than those between the ERBA and IRBA risk weights. This reflects the fact that much of the inconsistency in the risk weights occurs for high credit quality tranches that hit the floor in the IRBA calculations and hence are dropped from our calculations of the p-parameters.
The final two columns of Table 8 show the SA equivalents to the results in the first six columns that use the IRBA formula. In this case, we extract p-parameter values for individual tranches and then average them for asset and seniority classes using the following equation:
( ) (2)
The average extracted p-parameter values may be compared with the value of unity assumed in the SA for tranches other than re-securitisation tranches. For “Most Senior” tranches, the implied pparameter averages are mostly lower than unity although there are exceptions, most notably RMBS.
In general, one would expect that the SA p-values in Table 8 would tend to be high when ERBA risk weights in the corresponding earlier table (Table 3) are higher than the SA risk weights. There are some indications of this pattern but what obscures the relationship is that in some cases there are relatively few observations and that the relationship between p-values and risk weights is quite nonlinear, so a few observations which contribute only moderately to average risk weights generate high p-values, boosting the average p-values disproportionately. Also, the risk weights include observations in which the floor is hit in the SA p-parameter calculations and hence do not contribute to the Table 8 results.
As mentioned above, the asset class for which extracted p-values are markedly large is non-recourse RMBS (which are mostly US non-agency RMBS tranches). The high p-values for this category reflect the continued low ratings that agencies assign to US RMBS downgraded in the crisis. In regulatory capital calibration exercises such as that performed for the original Basel II securitisation framework (see Peretyatkin and Perraudin (2002)) and the analysis behind the ERBA capital charges in BCBS 269, it is assumed that securitisation ratings are straightforward, statistical measures of credit risk, updated as new information accumulates via the ratings agency surveillance activities.
The reality is more complex than this. Agency ratings are determined through administrative practices that introduce lags in the response to new information. Ratings agencies may also be concerned about their reputations and hence reluctant to upgrade securities after they have been downgraded. This latter “ratings momentum” effect is the subject of academic studies of corporate ratings.
Lastly and quite crucially, since the crisis, the ratings agencies have introduced new criteria and methodologies that preclude or at least severely limit the scope for upgrades in legacy transaction tranches (dating from before the crisis) even if pool performance improves. See Fitch Ratings (2012), Moody’s (2011) and Standard & Poor’s (2009).
Thus, following a major financial crisis involving the US housing market, one may expect to observe very slow and limited recovery of ratings for mortgage related securitisations. Securitisation capital frameworks that rely on ratings, such as the ERBA, are likely to become more disconnected to formulae based capital models like the IRBA and SA which are updated based on KIRB and pool default data (W) than they would otherwise be.
Figure 6 documents the partial recovery in US house prices since the crisis by showing the S&P-Case Shiller US housing index since 2004. Table 9 shows the lack of a recovery in US mortgage-related securitisation ratings by displaying upgrades and downgrades for US prime and sub-prime ratings since 2013. While DBRS ratings and Fitch ratings of sub-prime RMBS show more upgrades than downgrades, overall the number of downgrades continues to exceed upgrades to a substantial degree.
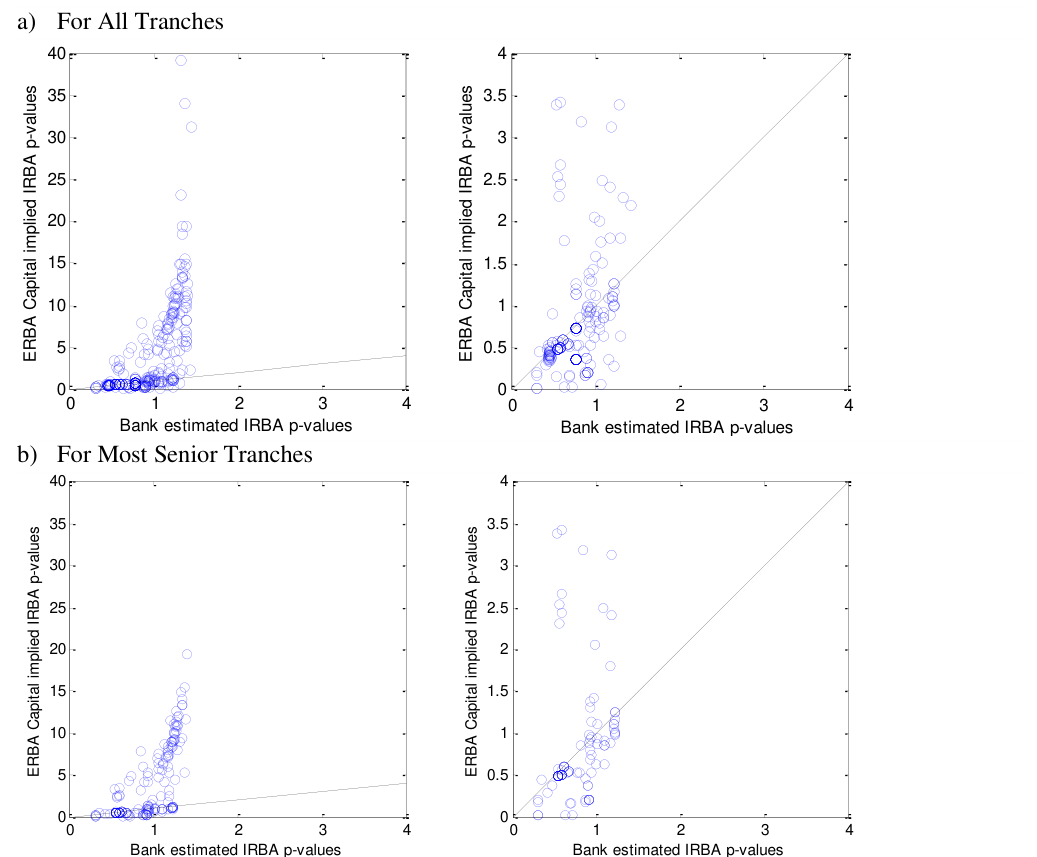
It is interesting also to examine the p-parameter results graphically. Figure 7 shows the p-parameters extracted from the ERBA capital using the IRBA formula plotted against the p-parameters supplied by the banks calculated as part of their IRBA capital calculations. The right hand plots zoom in on the lower left hand corner of the plots on the left, permitting one to see more detail in the area of the left hand plots for which there are most observations.
What is striking about the plots is the fact that while the average p-parameters reported by the banks (and shown in columns 5 and 6 of Table 8) are not very far below the average p-parameters extracted from the ERBA risk weights (shown in columns 1 and 2 of Table 8), the scatter plots suggest the bank estimates are substantially lower. This reflects the fact that the ERBA implied p-parameters are extremely variable, with some very large values that dominate the impression conveyed by the plots.
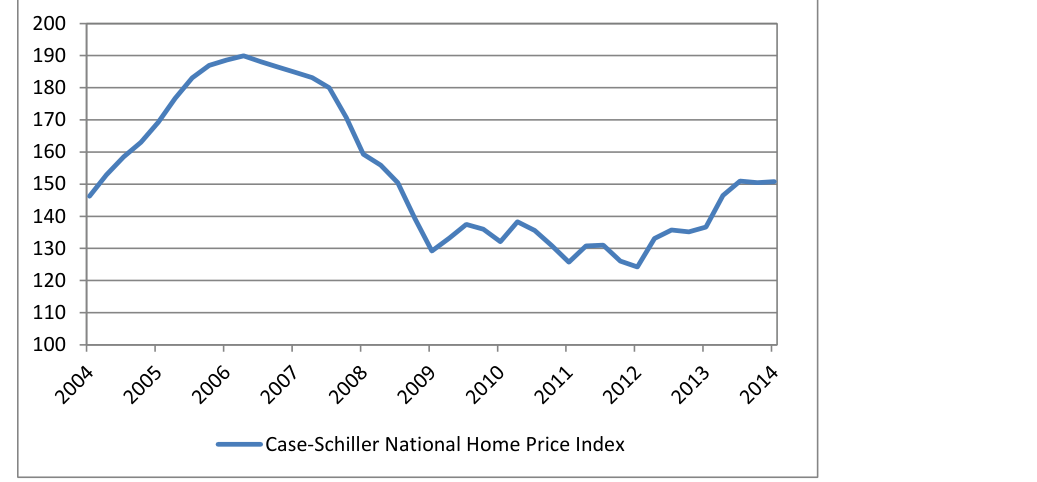
Note: the figure displays the Case-Schiller National Home Price Index. All values are indexed at their 2000 levels and are not seasonally adjusted. Source S&P.
| IRBA: | IRBA: | IRBA: | SA: | |||||
|---|---|---|---|---|---|---|---|---|
| Base | Case | Adjusted | Bank | Base | Case | |||
| Base | Case | Estimates | ||||||
| Most | Most | Most | Most | |||||
| Senior | Other | Senior | Other | Senior | Other | Senior | Other | |
| CMBS - Conduit | 0.73 | 0.70 | 0.48 | 0.96 | 1.33 | |||
| Collateralized Loan Obligations | 0.33 | 0.42 | 0.39 | 0.32 | 0.46 | 1.91 | 3.50 | |
| Credit Card Receivables | 0.07 | 0.30 | 0.84 | 0.85 | ||||
| Equipment and Inventory Finance | 0.71 | 0.54 | ||||||
| RMBS - Non-Recourse | 7.48 | 14.48 | 4.71 | 9.92 | 1.11 | 1.24 | 10.79 | 3.59 |
| RMBS - Recourse | 0.64 | 0.61 | 0.73 | 0.74 | 0.81 | 0.77 | 0.78 | 5.18 |
| Retail Auto Finance | 0.64 | 0.87 | 0.50 | 0.94 | 0.82 | 1.12 | 0.82 | 0.83 |
| Student Loans – FFELP | 1.18 | 9.48 | ||||||
| Student Loans – Private | 0.66 | |||||||
| Trade Receivables | 0.70 | |||||||
| Other | 0.34 | 0.31 | 0.54 | 4.68 | 2.18 |
Notes: the table displays average -values for a series of asset class and seniority categories. The first three pairs of columns display results for IRBA p-values. In the “IRBA: Base Case” columns, the results are calculated for all the tranches in a given category. The “IRBA: Bank Estimates” Columns display p-values estimated by participating banks. In the columns headed “IRBA: Adjusted Base Case” 20% is deducted from the ERBA risk weights before the equations are solved for the p parameter. The final pair of columns displays results for SA p-values. The p-values of deals which hit the 15% IRB Risk Weight floor are removed from the dataset used to calculate this table.
| RMBS | Upgrades | Downgrades | |
|---|---|---|---|
| DBRS | Total | 448 | 88 |
| Prime | 216 | 2,807 | |
| Fitch | Sub-Prime | 724 | 706 |
| Other | 678 | 1,678 | |
| Moody's | Total | 2,456 | 3,378 |
| Prime | 107 | 3,050 | |
| Standard & Poor's | |||
| Sub-Prime | 133 | 1,953 | |
| Total | 4,762 | 13,660 |
Source: AFME (2014).
| Most | Most | Most | ||||
|---|---|---|---|---|---|---|
| Senior | Other | Senior | Other | Senior | Other | |
| CMBS - Conduit | 0.15 | 4.46 | 3.43 | 6.76 | 0.15 | 4.09 |
| Collateralized Loan Obligations | 0.16 | 2.99 | 0.27 | 2.42 | 0.19 | 2.21 |
| Credit Card Receivables | 1.65 | 6.47 | 0.21 | 1.75 | 0.32 | 4.50 |
| Equipment and Inventory Finance | 0.27 | 1.39 | 0.39 | 2.39 | 0.52 | 6.95 |
| RMBS - Non-Recourse | 0.68 | 4.74 | 4.24 | 6.02 | 2.14 | 7.79 |
| RMBS - Recourse | 0.35 | 1.90 | 0.45 | 3.51 | 0.43 | 1.97 |
| Retail Auto Finance | 0.40 | 0.49 | 0.35 | 0.38 | 0.69 | 1.70 |
| Student Loans – FFELP | 0.17 | 0.26 | 0.35 | |||
| Student Loans – Private | ||||||
| Trade Receivables | 0.30 | 0.39 | 0.29 | |||
| Other | 0.21 | 7.88 | 0.29 | 6.18 | 0.38 | 9.08 |
Notes: this table displays average risk weights for exposures for which risk weights were available for all three approaches: SA, IRBA and ERBA. Risk weights are shown for a variety of asset sub-classes and for both senior tranches and other tranches.
5. Sensitivity Analysis I: Results with Proxy Data
To expand the coverage of the results, we repeated the calculations described above but augmenting the data with some observations based on proxy information. To be specific, two banks supplied us with observations for which ERBA capital estimates were based on internal (rather than agency) ratings and IRBA calculations were performed using models for which regulatory approval had not yet been obtained. Table A3 in the appendix provides information on the numbers of exposures that resulted.
The addition of proxy data changes some of the results (see Tables 10 and 11), for example, making the risk weights for all three approaches on average remarkably similar for CLOs. The additional data also permits us to obtain results for some important asset classes such as SME loans and trade receivables. But they do not substantially change the picture provided by the data analysed in the last section.
| IRBA: | IRBA: | IRBA: | SA: | |||||
|---|---|---|---|---|---|---|---|---|
| Base | Case | Adjusted | Bank | Base | Case | |||
| Base | Case | Estimates | ||||||
| Most | Most | Most | Most | |||||
| Senior | Other | Senior | Other | Senior | Other | Senior | Other | |
| CMBS - Conduit | 0.73 | 0.70 | 0.48 | 0.96 | 1.33 | |||
| Collateralized Loan Obligations | 0.79 | 0.44 | 0.68 | 0.41 | 0.53 | 0.46 | 1.88 | 3.50 |
| Credit Card Receivables | 0.47 | 0.59 | 0.86 | 0.78 | ||||
| Equipment and Inventory Finance | 0.56 | 0.81 | 0.47 | 0.77 | 0.54 | 0.60 | 0.74 | 0.52 |
| RMBS - Non-Recourse | 7.47 | 14.48 | 4.71 | 9.92 | 1.10 | 1.24 | 11.08 | 59.49 |
| RMBS - Recourse | 0.64 | 0.61 | 0.73 | 0.74 | 0.81 | 0.77 | 0.78 | 5.17 |
| Retail Auto Finance | 0.73 | 0.82 | 0.55 | 0.83 | 0.76 | 1.07 | 0.85 | 0.84 |
| Student Loans – FFELP | 0.77 | 0.97 | 1.18 | 0.68 | ||||
| Student Loans – Private | 0.66 | |||||||
| Trade Receivables | 0.32 | 0.25 | 0.36 | 0.73 | ||||
| Other | 0.59 | 0.34 | 0.31 | 0.58 | 0.54 | 3.87 | 3.42 |
Notes: the table displays average -values for a series of asset class and seniority categories. The first three pairs of columns display results for IRBA p-values. In the “IRBA: Base Case” columns, the results are calculated for all the tranches in a given category. The “IRBA: Bank Estimates” Columns display p-values estimated by participating banks. In the columns headed “IRBA: Adjusted Base Case” 20% is deducted from the ERBA risk weights before the equations are solved for the p parameter. The final pair of columns displays results for SA p-values. The p-values of deals which hit the 15% IRB Risk Weight floor are removed from the dataset used to calculate this table.
6. Sensitivity Analysis II: Results for Post 2010 Data
In this section, we report a version of our results focussing solely on securitisation tranches issued in 2010 or later. (Information on the sub-sample employed is provided in Table A4 in the appendix.) It is interesting to look at such results because one might expect that capital calculations (i) based on ratings agency judgments (the ERBA) and (ii) derived from formulae (IRBA and SA) may be more dislocated when the tranches in question include securities downgraded during the crisis.
This analysis is motivated by the remarks in Section 4 about the additional dislocation one might expect between an agency-ratings-based capital approach like the ERBA and formulae-based approaches like the IRBA and SA following a crisis, given (i) possible ratings agency reluctance to reverse a decline in ratings as a recovery takes place and (ii) ratings methodology changes that introduce requirements which legacy deals may not meet.
Table 12 shows average risk weights by asset and seniority class for tranches issued post-2010. The Table 12 results are based on data tranches for which data for all three capital calculations, IRBA, ERBA and SA, are available. Table 13 shows risk weight averages using the much large number of observations for which we have one or more of the three sets of capital calculations.
Comparing the results in Table 12 with those of Table 3, many numbers are similar. But some anomalies are removed. For example, the average IRBA risk weights for senior credit card receivables tranches were 205% in Table 3, much higher than the corresponding 35% and 19% risk weights for SA and ERBA. In Table 12, the IRBA risk weights are much lower at 57% with the SA and ERBA averages being 15% and 16%, respectively.
Unfortunately, we do not have IRBA estimates for tranches issued post-2010 for RMBS non-recourse, the most likely category to show a difference for observations where SA and ERBA estimates are also available. Hence, there is a blank row in Table 12 for RMBS non-recourse. However, if we consider averages across the larger dataset without requiring that the three capital estimates are available for each observation, we do find average RMBS non-recourse estimates. These are shown in Table 13.
The Table 13 results are striking in that the RMBS non-recourse SA and ERBA risk weights are much lower than in Table 4. In Table 4, the “Most Senior” and “Other” categories, the RMBS non-recourse risk weights were 146% and 813% for SA and 388% and 735% for ERBA, respectively. The equivalent numbers in the post-2010 data (shown in Table 13) are 88% and 265% for SA and 193% and 192% for ERBA.
While some of the more striking discrepancies and dislocations between capital approaches appear to have been removed by focussing on post 2010 data, the correlations between individual tranche capital under the approaches, remains low as shown by Table 14. The “Most Senior” tranches, the rank order correlation between IRBA and ERBA risk weights is 3%. It is distinctly higher at 46% for “Other” tranches. For the 100-200% ERBA risk weight tranches, the correlation is actually substantially negative at -19%.
The ERBA-implied p-values shown in Table 15 are mostly lower than those in earlier tables. Note in particular that the RMBS non-recourse SA p-values are 0.90 and 0.97 (for “Most Senior” and “Other” categories, respectively) compared to 10.79 and 3.59 in Table 8. This suggests that the very severe post-crisis dislocation between ratings-based and formula-based capital frameworks is mitigated in new deals.
Unfortunately, we do not have IRBA estimates for non-recourse RMBS asset class issued post-2010 in our primary dataset. Some banks supplied us with a handful of estimates using their IRBA methodology on proxy data. The average risk weights under IRBA, ERBA and SA were 15%, 30% and 19% for “Most Senior” tranches and 58%, 154% and 20% for “Other” tranches. All “Most Senior” tranches were at the IRBA floor of 15% and hence could not be used in the p-parameter calibration. Using “Other” tranches (which were extremely few in number), we obtained ERBAimplied IRBA p-parameter, bank supplied IRBA p-parameter and ERBA-implied SA p-parameters of 1.29, 0.88 and 1.35. While we have too little data here to be confident in reaching conclusions, these figures are consistent with the notion that the very severe dislocation of IRBA and ERBA for nonrecourse mortgages deals is somewhat mitigated for post-2010 issues although the approaches are still far from aligned.
| Most | Most | Most | ||||
|---|---|---|---|---|---|---|
| Senior | Other | Senior | Other | Senior | Other | |
| CMBS - Conduit | ||||||
| Collateralized Loan Obligations | 0.16 | 1.91 | 0.25 | 1.22 | 0.16 | 0.89 |
| Credit Card Receivables | 0.57 | 0.16 | 0.15 | |||
| Equipment and Inventory Finance | ||||||
| RMBS - Non-Recourse | ||||||
| RMBS - Recourse | 0.40 | 0.17 | 0.25 | 4.16 | 0.50 | 1.40 |
| Retail Auto Finance | 0.25 | 0.40 | 0.25 | 0.36 | 0.98 | 1.78 |
| Student Loans – FFELP | 0.15 | 0.27 | 0.50 | |||
| Student Loans – Private | ||||||
| Trade Receivables | ||||||
| Other |
Notes: the table displays average risk weights for exposures for which risk weights were available for all three approaches: SA, IRBA and ERBA. Risk weights are shown for a variety of asset sub-classes and for both senior tranches and other tranches.
| Most | Most | Most | ||||
|---|---|---|---|---|---|---|
| Senior | Other | Senior | Other | Senior | Other | |
| CMBS - Conduit | 0.26 | 0.79 | 0.17 | 1.19 | ||
| Collateralized Loan Obligations | 0.16 | 1.91 | 0.72 | 2.18 | 0.25 | 1.98 |
| Credit Card Receivables | 0.57 | 0.28 | 1.46 | 0.40 | 5.86 | |
| Equipment and Inventory Finance | 0.22 | 0.23 | 0.57 | 0.91 | ||
| RMBS - Non-Recourse | 1.93 | 1.92 | 0.88 | 2.65 | ||
| RMBS - Recourse | 0.40 | 0.17 | 0.26 | 3.37 | 0.46 | 1.56 |
| Retail Auto Finance | 0.25 | 0.40 | 0.36 | 0.66 | 0.44 | 2.13 |
| Student Loans – FFELP | 0.15 | 0.30 | 0.40 | |||
| Student Loans – Private | 0.40 | 1.13 | ||||
| Trade Receivables | 0.40 | 0.18 | ||||
| Other | 3.75 | 0.71 |
Notes: the table displays results for average risk weights for all tranches, regardless of whether risk weights are available for all three approaches. The averages for each approach are reported for asset sub-class, and for seniority.
| IRBA | ERBA | SA | |
|---|---|---|---|
| IRBA | 1.000 | 0.031 | 0.618 |
| ERBA | 0.031 | 1.000 | 0.247 |
| SA | 0.618 | 0.247 | 1.000 |
| b) Other Tranches | |||
| IRBA | ERBA | SA | |
| IRBA | 1.000 | 0.455 | 0.422 |
| ERBA | 0.455 | 1.000 | 0.404 |
| SA | 0.422 | 0.404 | 1.000 |
| c) All Tranches, | ERBA | RW 15% to | 100% |
| IRBA | ERBA | SA | |
| IRBA | 1.000 | 0.103 | 0.600 |
| ERBA | 0.103 | 1.000 | 0.311 |
| SA | 0.600 | 0.311 | 1.000 |
| d) All Tranches, | ERBA | RW 100% to | 200% |
| IRBA | ERBA | SA | |
| IRBA | 1.000 | -0.191 | 0.607 |
| ERBA | -0.191 | 1.000 | -0.060 |
| SA | 0.607 | -0.060 | 1.000 |
| e) All Tranches, | ERBA | RW > 200% | |
| IRBA | ERBA | SA | |
| IRBA | 1.000 | 0.450 | 0.710 |
| ERBA | 0.450 | 1.000 | 0.568 |
| SA | 0.710 | 0.568 | 1.000 |
Notes: the table shows the Risk Weight rank order correlations for the three approaches. The results displayed in this table are for Most Senior and Other tranches (in panels a) and b) respectively) and for tranches ERBA Risk Weights in different ranges in panels c), d) and e), respectively. The ERBA Risk Weights ranges are 15%-100%, 100%-200% and greater than 200%. For these ranges, we have 233, 33 and 9 observations, respectively.
| IRBA: | IRBA: | IRBA: | SA: | |||||
|---|---|---|---|---|---|---|---|---|
| Base | Case | Adjusted | Bank | Base | Case | |||
| Base | Case | Estimates | ||||||
| Most | Most | Most | Most | |||||
| Senior | Other | Senior | Other | Senior | Other | Senior | Other | |
| CMBS - Conduit | 1.01 | 1.45 | ||||||
| Collateralized Loan Obligations | 0.20 | 0.42 | 0.39 | 0.30 | 0.46 | 1.44 | 1.43 | |
| Credit Card Receivables | 0.18 | 0.30 | 0.87 | 0.59 | ||||
| Equipment and Inventory Finance | 0.64 | 0.54 | ||||||
| RMBS - Non-Recourse | 0.90 | 0.97 | ||||||
| RMBS - Recourse | 0.61 | 0.49 | 0.45 | 0.80 | 0.68 | 1.53 | ||
| Retail Auto Finance | 0.64 | 0.87 | 0.50 | 0.94 | 0.82 | 1.12 | 0.79 | 0.83 |
| Student Loans – FFELP | 0.82 | |||||||
| Student Loans – Private | 0.78 | |||||||
| Trade Receivables | 1.27 | |||||||
| Other | 1.27 |
Notes: the table displays average -values for a series of asset class and seniority categories. In the “Base Case” columns, the results are calculated for all the tranches in a given category. The “Bank Estimates” Columns display p-values estimated by participating banks. In the columns headed “Adjusted Base Case” 20% is deducted from the ERBA risk weights before the equations are solved for the p parameter. In the columns that include RW ≤ 2 in the header, the average p-parameters are calculated only for observations for which the risk weights are less than 200%. Additionally, the p-values of deals which hit the 15% IRB Risk Weight floor are removed from the dataset used to calculate this table.
7. Conclusion
This study analyses data from eight GFMA banks on capital calculations for securitisation tranches using the three approaches, the IRBA, SA and ERBA, proposed in the recent Basel consultative paper, BCBS 269. The data amounts to 4,611 useable observations of capital calculations, covering major asset class sectors of the securitisation market. While we do not have country-of-issuance data for the securities we study, we believe from the domiciles of the banks that contribute most data that the study is most informative about the US securitisation market although data from other regions is included.
Our main finding is that the capital approaches proposed by BCBS exhibit substantial inconsistencies. Average risk weights for different asset classes implied by the different approaches exhibit no consistent pattern except that, overall, ERBA risk weights appear relatively conservative. Even when average risk weights look comparable across the three approaches, the rank order correlation of individual-tranche risk weights are often low. This is especially the case for “Most Senior” tranches (i.e., tranches at the top of their structure’s cash flow waterfall). Dropping data on RMBS nonrecourse mortgages, the correlations are strikingly low.
To compare the risk weights implied by the three approaches, we extract the Simplified Supervisory Formula Approach (SSFA) p-parameter that within either the IRBA or the SA yields the same risk weight as the ERBA. The average asset-class and seniority-class p-parameters vary considerably across different approaches and are sometimes higher and sometimes lower than the values employed by the banks in the IRBA. The discrepancies are less obvious than with risk weights because in calculating ERBA-implied p-parameters we drop observations for which the IRBA and SA floors bind. These observations, typically senior tranches, are the largest source of risk weight inconsistency.
In comparing the capital implied by the three approaches, it is important to distinguish between (i) deals issued before or during the crisis period and (ii) more recent deals (for example from 2010 onwards). For RMBS non-recourse in particular (but more generally for some other asset classes), ratings agency evaluations appear very conservative for tranches issued before the crisis. This results in severe dislocation between ERBA capital on the one hand and IRBA and SA capital on the other. In our results, this is reflected in very high ERBA-implied p-parameters for RMBS non-recourse. When we focus on observations issued after 2010, these effects disappear.
To conclude, we find that the BCBS 269 approaches yield very different risk weights. This matters particularly because, unless there are radical changes in regulatory practices regarding use of proxy data in KIRB calculations, Dodd-Frank and the BCBS 269 hierarchy will oblige investor banks in different jurisdictions to employ systematically different approaches. The principle of comparability identified in BCBS (2013a) as a characteristic of well-formulated capital regulation is, in this respect, not satisfied by the current Basel proposals.
References
Association for Financial Markets in Europe (2014) “Securitisation Data Report Q1:2014,” AFME Report, June, http://www.afme.eu/WorkArea/DownloadAsset.aspx?id=10815.
Basel Committee on Bank Supervision (2012) “Revisions to the Basel Securitisation Framework,” Consultative Document, Bank for International Settlements, December (BCBS 236).
Basel Committee on Bank Supervision (2013a) “The regulatory framework: balancing risk sensitivity, simplicity and comparability,” Discussion Paper, July.
Basel Committee on Bank Supervision (2013b) “Revisions to the securitisation framework,” Consultative Document, Bank for International Settlements, December, (BCBS 269).
Duponcheele, Georges, William Perraudin and Daniel Totouom-Tangho (2014a) “Calibration of the Simplified Supervisory Formula Approach,” BNP-Paribas mimeo, March. http://www.riskcontrollimited.com/public/Calibration_of_SSFA.pdf.
Duponcheele, Georges, William Perraudin, Alexandre Linden and Daniel Totouom-Tangho (2014b) “Calibration of the CMA and Regulatory Capital for Securitisations,” BNP-Paribas mimeo, April. http://www.riskcontrollimited.com/public/Calibration_of_CMA.pdf.
Fitch Ratings (2012) U.S. RMBS Rating Criteria, July.
Joint Trade Associations (GFMA, CREFC, CREFC Europe, IIF, ISDA, IACPM, SFJ, SFIG) (2014) "Joint Associations' response to the second Consultative Document on Revisions to the Basel securitisation framework," Joint Trade Associations mimeo, March, http://www.bis.org/publ/bcbs269/jtagcceiiisas.pdf.
Moody’s (2011) 2005 – 2008 US RMBS Surveillance Methodology, July.
Peretyatkin, Vladislav and William Perraudin (2004) “Capital for Structured Products,” Risk Control Limited.
Standard & Poor’s (2009) Methodology and Assumptions for Rating U.S. RMBS Prime, Alternative-A, and Subprime Loans, September.
Appendix
Table A1: Linear Correlation
a) Most Senior Tranches IRBA ERBA SA IRBA 1.000 0.446 0.584 ERBA 0.446 1.000 0.783 SA 0.584 0.783 1.000
b) Other Tranches IRBA ERBA SA IRBA 1.000 0.447 0.775 ERBA 0.447 1.000 0.673 SA 0.775 0.673 1.000
c) All Tranches, ERBA RW 15% to 100% IRBA ERBA SA IRBA 1.000 0.049 0.910 ERBA 0.049 1.000 0.111 SA 0.910 0.111 1.000
d) All Tranches, ERBA RW 100% to 200% IRBA ERBA SA IRBA 1.000 0.278 0.765 ERBA 0.278 1.000 0.313 SA 0.765 0.313 1.000
e) All Tranches, ERBA RW > 200% IRBA ERBA SA IRBA 1.000 0.598 0.770 ERBA 0.598 1.000 0.720 SA 0.770 0.720 1.000
Table A2: Linear Correlations – excluding RMBS Non-Recourse
c) Most Senior Tranches – excluding RMBS Non-Recourse IRBA ERBA SA IRBA 1.000 -0.106 0.225 ERBA -0.106 1.000 -0.001 SA 0.225 -0.001 1.000
d) Other Tranches – excluding RMBS Non-Recourse IRBA ERBA SA IRBA 1.000 0.380 0.637 ERBA 0.380 1.000 0.620 SA 0.637 0.620 1.000
Notes: the table shows the linear correlations for the three approaches. The results displayed in this table are for Most Senior and Other tranches (in panels a and b) respectively) excluding RMBS with nonrecourse mortgages.
Table A3: Tranches with Data for SA, IRBA, ERBA, and All Approaches Including Proxy Data IRBA ERBA SA All Most Most Most Most Senior Other Senior Other Senior Other Senior Other CMBS - Conduit 5 14 555 314 555 314 5 14 Collateralised Loan Obligations 98 35 346 489 347 491 98 35 Credit Card Receivables 15 1 113 10 113 10 15 1 Equipment and Inventory Finance 7 4 57 17 57 17 7 4 RMBS - Non-Recourse 118 112 663 618 660 616 118 112 RMBS - Recourse 124 79 228 113 230 114 123 78 Retail Auto Finance 57 30 249 246 249 246 57 30 Student Loans – FFELP 90 0 177 3 177 3 90 0 Student Loans – Private 0 0 25 0 25 0 0 0 Trade Receivables 36 0 68 1 68 1 36 0 Other 12 5 94 24 97 25 9 4 Total 562 280 2575 1835 2578 1837 558 278
Notes: the table displays the number of observations of tranches for which risk weights were available for each of the three approaches as well as for all the approaches, grouped by asset sub-class, and by seniority.
Table A4: Tranches with Data for SA, IRBA, ERBA, and All Approaches – Post 2010 Data IRBA ERBA SA All Most Most Most Most Senior Other Senior Other Senior Other Senior Other CMBS - Conduit 0 0 174 180 174 180 0 0 Collateralised Loan Obligations 59 31 117 74 117 74 59 31 Credit Card Receivables 1 0 59 3 59 3 1 0 Equipment and Inventory Finance 0 0 31 12 31 12 0 0 RMBS - Non-Recourse 0 0 120 138 119 138 0 0 RMBS - Recourse 65 22 97 32 97 32 65 22 Retail Auto Finance 28 28 170 244 170 244 28 28 Student Loans – FFELP 43 0 72 0 72 0 43 0 Student Loans – Private 0 0 12 0 12 0 0 0 Trade Receivables 0 0 2 0 2 0 0 0 Other 0 0 23 0 23 0 0 0 Total 196 81 877 683 876 683 196 81
Notes: the table displays the number of observations of tranches for which risk weights were available for each of the three approaches as well as for all the approaches, grouped by asset sub-class, and by seniority.
Notes
[1] The author of this study, William Perraudin, is Director of RCL and Adjunct Professor of Imperial College, London. RCL was commissioned by the Global Financial Markets Association (GFMA) to undertake the analysis set out in this paper. We thank for their comments and suggestions Alexander Batchvarov, Trent Brimhall, Beth Cleland, Iuliana Dincov, Georges Duponcheele, Kevin Hawken, Richard Hopkin, Chris Killian, Roger Pellegrini, and Debbie Toennies. Any errors remain our responsibility. The views expressed in this paper are ours and not necessarily those of GFMA, the individuals thanked above, or their institutions.
[2] For securitisation liquidity facilities, banks may employ an internal process (commonly mimicking the methodology of a rating agency) to infer a rating and then use this within the ERBA. This internal ratings approach is called the Internal Assessment Approach (IAA).
[3] To calculate the rank ordering between two variables, one assigns an integer score to each observation based on its magnitude and then calculates the linear correlation between these integer “ordering variables”. By “linear correlation”, we mean the ratio of the covariance of the two variables to the product of their standard deviations. In this case, the linear correlation coefficient is 75%. Notes: this table shows linear correlations for the three approaches. The results displayed in this table are for Most Senior and All tranches (in panels a) and b) respectively) and for tranches ERBA Risk Weights in different ranges in panels c), d) and e), respectively. The ERBA Risk Weights ranges are 15%-100%, 100%-200% and greater than 200%. For these ranges, we have 434, 101 and 190 observations, respectively.