

This research paper[1] examines the impact on the European securitisation market of the introduction by regulators of the Standardised Approach (SA) Output Floor. This rule change forms one of the final elements of Basel III. It requires that advanced banks, those which calculate regulatory capital based on the Internal Ratings Based Approach (IRBA), hold the greater of (i) IRBA capital and (ii) a percentage of the capital one obtains when the alternative SA is employed. Our findings are as follows: 1. For the regulatory wholesale asset class: i. Corporate securitisations, both for large corporates and SME portfolios, will be largely eliminated by the introduction of the Basel SA Output Floor as currently envisaged. This could contribute to a significant reduction in the availability of bank funding to European firms. ii. Existing transactions done for risk management purpose, especially corporate ones, are likely to fail the EU Significant Risk Transfer (SRT) test applied by supervisors and, hence, will have to be terminated. Some of the negative effects of the SA Output Floors on existing transactions would be substantially mitigated if IRBA banks were required to evaluate EU SRT tests only under IRBA, at transaction level, even if the aggregate SA Output Floor is binding. iii. The impact of Basel and EU rule changes will be felt at a time when securitisation as a capital management tool would likely otherwise be more widely used owing to the rise in capital for corporate lending implied by the SA Output Floor. 2. For the regulatory retail asset class: the SA Output Floors regime will encourage greater securitisation activity in residential mortgage and other retail loan portfolios because the increase in capital for loans held on balance sheet will exceed, sometimes disproportionately, that of securitised assets. These findings suggest that implementation of the SA Output Floors will disfavour one asset class substantially while benefiting another asset class with no clear rationale based on policy priorities or risk sensitivity. This is a consequence of adopting regulatory rules that are not soundly rooted in an understanding of the relative riskiness of different asset classes. While provisional adjustments can moderate some foreseeable effects on securitisation transactions, a more profound reform of the regulatory treatment of securitisation is needed for this financial technique to contribute to the development of the European economy.
Key findings
- First component: a discount to the formula should be applied when KIRB or KA is used as an input to the formula. This is significant for the wholesale framework in IRB and for both wholesale and retail frameworks in SA. Further details are provided in Risk Control research note published in July 2020.
- Second component: annoying, but not a major issue (note importance for credit cards - which we did not study in this paper).
- Third component: the ‘p’ factor should be recalibrated. This is especially key for the retail framework in IRB and for both wholesale and retail frameworks in SA.
- Fourth component: the fixed senior tranche risk weight floor should be recalibrated so that it becomes an additional risk weight layer, as a proportion of the underlying pool risk weight (e.g., 10% of KIRB or KA) to the added to the formula KSSFA. This would replace the requirement for a senior tranche floor and would remove the need for p senior vs. non-senior as well as stopping regulatory optimisation when determining the senior attachment point.
Executive Summary
This study[2] examines the impact on the European securitisation market of the introduction by regulators of the Standardised Approach (SA) Output Floor. This rule change forms one of the final elements of Basel III. It requires that advanced banks, those which calculate regulatory capital based on the Internal Ratings Based Approach (IRBA), hold the greater of (i) IRBA capital and (ii) a percentage of the capital one obtains when the alternative SA is employed. The percentage will progressively rise over a six-year transition period to its final level of 72.5%.
Under the IRBA and the SA, banks calculate capital for a given loan by multiplying the Exposure at Default (EAD) by a Risk Weight (RW) to obtain Risk Weighted Assets (RWAs). Required capital itself is then the sum of all RWAs multiplied by a Minimum Capital Ratio (MCR), 8% for SA banks and higher for IRBA institutions.[3] IRBA RWs are computed using formulae that take as inputs the bank’s own estimates of loan Probabilities of Default (PDs) and mean Loss Given Default (LGD) rates. SA RWs may be obtained from simple look-up tables provided by regulators.
Securitisation RWs under Basel III can be calculated using three different approaches: the Securitisation-IRBA (SEC-IRBA), SEC-SA and SEC-External Ratings Based Approach (SEC-ERBA)[4], the last of these being applicable in jurisdictions that permit the use of agency ratings in this context. The formulae for SEC-IRBA and SEC-SA take as inputs the level of capital that a bank would have to hold if it retained its loans on a balance sheet.
Deducing the impact of the SA Output Floor on the securitisation market in Europe is complex. The floor will affect both the capital (under IRBA and SA rules) that the bank must hold if it retains the risks on the loans, as well as the required capital (again under IRBA and SA securitisation rules) for retained tranches of securitisations. Furthermore, the tranching structure that a bank may choose to hold will itself change as the rules are altered.
In effect, the impact on securitisations is a ‘horse race’ between the increase in capital for on-balance-sheet loans and the capital increase for retained securitisation positions. How this ‘horse race’ turns out for a particular sub-category of loans depends crucially on the risk parameters of the loans involved, namely the PDs and LGDs. These risk parameters are specific to asset classes and countries because the loan markets in given countries have generic characteristics (high or low PDs or high or low LGDs). They are also bank specific as each IRB bank has its own IRB models.
To investigate the effects of SA Output Floors, we examine data on European markets in order to understand what the most important asset classes are in the context of securitisation. We argue that the most important asset classes are:
1. Corporate exposures (Europe-wide)
2. SME exposures (Italy, Belgium, Spain)
3. Residential mortgage exposures (UK, Netherlands, Spain, France)
4. Automobile exposures (Germany, UK, Italy)
5. Consumer exposures (Italy, France).
For each of these five asset classes, we work out representative PDs and LGDs by examining data from the Pillar 3 disclosures of major IRB banks in Europe. We then analyse RWs using IRBA and SA techniques for onbalance-sheet loans and for securitisations under SEC-IRBA and SEC-SA rules. We also consider the implications of Significant Risk Transfer (SRT) rules applied by European regulators which only permit the use of the SEC-IRBA to calculate securitisation capital when certain tests are satisfied.
Our analysis revolves around the Capital Multiplier (CM), which we define as the ratio of (i) the total capital implied by the securitisation rules for all the tranches to (ii) the capital required if the bank holds the risk on the underlying pool loans. We also consider elements of this ratio by splitting the numerator (i) into four components and considering their ratio to the denominator (ii). The four components are based on four conceptual tranches:
(i) a capital component, corresponding to a tranche attaching at 0% and with a thickness K, where K is the overall pool capital as defined when assets are on the balance-sheet,
(ii) an income component, corresponding to a tranche attaching at K and with a thickness corresponding to the Future Margin Income (FMI) of pool assets, capped at 1-year Expected Loss (EL) on the pool assets when assets are on the balance-sheet,
(iii) a medium seniority component, corresponding to the capital required for a tranche that attaches at K+FMI, which we will call K+EL due to the 1-year cap,[5] and detaches at the attachment point of the senior tranche and,
(iv) senior component, corresponding to the capital required for the senior tranche. In line with widespread industry practice, the senior tranche is structured so that its risk weight equals the risk weight floor implied by the SEC-IRBA or SEC-SA approaches.
This decomposition of the total CM is appropriate and revealing because of the typical procedure among originating banks for retaining (iv) while disposing of the majority of (i)[6] and components (ii) and (iii). The decomposition reveals the incentives that banks face when deciding whether or not to securitise. Further note that a key SRT test that a bank must satisfy in performing securitisations is that it disposes of no less than 50% of pool RWAs. The CM decomposition we employ also sheds light on whether it is likely that this SRT test will be satisfied.
Our findings are as follows:
1. For the regulatory wholesale asset class: i. Corporate securitisations, both for large corporates and SME portfolios, will be largely eliminated by the introduction of the Basel SA Output Floor as currently envisaged. This could contribute to a significant reduction in the availability of bank funding to European firms. ii. Existing transactions done for risk management purpose, especially corporate ones, are likely to fail the EU Significant Risk Transfer (SRT) test applied by supervisors and, hence, will have to be terminated. Some of the negative effects of the SA Output Floors on existing transactions would be substantially mitigated if IRBA banks were required to evaluate EU SRT tests only under IRBA, at transaction level, even if the aggregate SA Output Floor is binding.[7] iii. The impact of Basel and EU rule changes will be felt at a time when securitisation as a capital management tool would likely otherwise be more widely used owing to the rise in capital for corporate lending implied by the SA Output Floor.
2. For the regulatory retail asset class: the SA Output Floors regime will encourage greater securitisation activity in residential mortgage and other retail loan portfolios because the increase in capital for loans held on balance sheet will exceed, sometimes disproportionately, that of securitised assets.
These findings suggest that implementation of the SA Output Floors will disfavour one asset class substantially while benefiting another asset class with no clear rationale based on policy priorities or risk sensitivity. This is a consequence of adopting regulatory rules that are not soundly rooted in an understanding of the relative riskiness of different asset classes.
While provisional adjustments can moderate some foreseeable effects on securitisation transactions, a more profound reform of the regulatory treatment of securitisation is needed for this financial technique to contribute to the development of the European economy. Examples of provisional adjustments are provided in the November 2022 Joint Letter from nine organisations[8] addressed to European policymakers.
Our analysis evidences significant mis-calibration of the SEC-IRBA and SEC-SA for mezzanine tranches and a misalignment of senior tranche risk weights in comparison to pool risk weights, therefore recommend recalibration of capital charges across the spectrum of risk within a securitisation capital structure.[9]
1 Introduction
Neither the BCBS nor the European regulators have published analysis of the impact of the SA Output Floor for the securitisation market. The only impact analysis of which we are aware, consists of individual examples of stylised or actual securitisations, or of entire balance sheets. Although such examples may help to alert policy makers to particular problems, they do not reveal how the new rules will affect the market as a whole.
This paper aims to clarify what the new rules will imply for the European securitisation market. Though securitisation is fundamental to the success of the Capital Markets Union (CMU), a prime objective of European regulators, few participants in the public debate on CMU appear to understand the likely consequences of SA Output Floors on the (mainly public) market for traditional securitisations[10] or on the important and growing (mainly private) market in Significant Risk Transfer (SRT) trades[11] (also referred to as on-balance sheet securitisations[12]).
The SA Output Floor regime, as set out by Basel Committee on Banking Supervision (BCBS (2017)), requires banks using Internal Ratings-Based Approaches (IRBA) to impose a floor on their calculations of Risk Weighted Assets (RWAs). This should equal a percentage of RWAs as calculated under Standardised Approaches (SA). Over time, the percentage will increase from an initial 50% to a level of 72.5%. Since bank equity analysts typically front-load their assessments, and because securitisation transaction are generally 5 years in maturity, in the short run, banks will face pressure to adjust their capital to be consistent with this ultimate percentage.
This study analyses the effect of the SA Output Floor regime on the European securitisation market. We examine the incentives that banks face to securitise loan portfolios, with and without the SA Output Floor, by calculating capital requirements for representative loan pools both when they are held on balance sheet and when they act as collateral to securitised exposures.
The results depend crucially on the risk characteristics of the loan exposures in question. We calibrate Probabilities of Default (PDs) and Loss Given Default (LGD) rates for representative loan pools using Pillar 3 information for a large group of major European banks. We focus on five key European asset classes: in the wholesale framework: (i) corporate loans (excluding SME loans), (ii) SME corporate loans (excluding retail loans), and in the retail framework: (iii) residential mortgages, (iv) auto loans and (v) other retail loans. For each of the five classes of loan, we use the banks’ PDs and LGDs for particular countries for which securitisation of that asset class is an important issue.
Our main results are as follows. When SA Output Floors are introduced at both pool and securitisation capital levels, the incentive to securitise may either increase or decrease for particular loan types. The reason is that binding, pool-level capital floors may boost the capital cost of loans held on-balance sheet more or less than that of retained tranches following securitisation.
The ‘horse-race’ between the impact of binding output floors at pool and securitisation level means that for some asset classes securitisation volumes may shrink substantially because of the introduction of output floors, whereas, for some other asset types, securitisation volumes could increase. The determining factor for a given asset class is the nature of the risk characteristics (PDs and LGDs) of the loan type in question.
Following this logic and implementing detailed capital calculations, we show that corporate securitisation (both for large corporate and SME loans) is likely to be largely eliminated by the imposition of SA Output Floors. This could contribute to a significant reduction in the availability of bank funding to European firms. On the other hand, it could also lead to a significant increase in incentives to securitise residential mortgage and consumer loan pools.
This finding suggests that the implementation of the SA Output Floors will disfavour one asset class substantially while benefiting another asset class with no clear rationale policy priorities. This is a consequence of adopting regulatory rules that are not soundly rooted in an understanding of the relatively riskiness of different asset classes.
This document is organised as follows. Section 2 describes the methodology and the data collection process. Section 3 sets out the impact of the SA Output Floor on Capital Multipliers. Section 4 explains the consequences for existing SRT transactions. Section 5 presents results. Section 6 concludes and suggests some policy interventions which could mitigate some of the distortions created by the planned rule changes.
2 Methodology
2.1 The SA Output Floor
Under Basel I rules, introduced in 1988 by the Basel Committee on Banking Supervision (BCBS), banks were required to compute Risk Weighted Assets (RWAs) equal to the product of exposure amounts and Risk Weights (RWs) taking values 0%, 10%, 20%, 50% and 100% depending on the nature of the exposure.[13] A bank’s Minimum Capital Requirement (MCR) was then its volume of RWAs multiplied by 8% (the ‘Cooke ratio’).[14]
The Basel II framework introduced in 2006 increased risk sensitivity in RW calculations and authorised two approaches for banks of different levels of sophistication, (i) the Internal Ratings-Based (IRB) approach and (ii) the Standardised Approach (SA). Aimed at more sophisticated banks, the Advanced IRB (A-IRB) based RWs on formulae with PD and LGD inputs provided by the banks themselves. The SA resembled the Basel I approach in that RWs were provided in lookup tables. Both approaches generated RWAs which were then multiplied by 8% (the ‘McDonough’ ratio) to obtain the MCR. For banks using the IRB approach, the MCR ratio has increased over the years as various capital ‘buffers’ have been introduced.
When the Basel II framework was introduced, a transitional capital floor equal to a percentage (initially 90%, then 80%) of the Basel I capital requirement was introduced. In this, regulators intended to avoid a sudden drop in bank MCRs (see BCBS (2006), paragraphs 45-47)). This “Basel I Output Floor” was implemented inconsistently by different countries, reflecting different interpretations of the requirement and the fact that the computation of Basel I capital was not continued in many jurisdictions.
For securitisation exposures Basel II introduced a set of dedicated rules. More specifically, the Supervisory Formula Approach (SFA) using IRB inputs and two external ratings-based approaches with lookup tables, one for IRB banks and one for SA banks. The capital deduction was complemented with an alternative RW of 1,250%.
After the Global Financial Crisis (GFC), the BCBS reformed important aspects of the Basel II IRB framework and, in December 2017, BCBS issued finalised standards for what is referred to as Basel III. Important changes were also introduced to SA RWs with the stated goal of increasing their risk sensitivity.[15]
The Basel III securitisation framework was substantially altered by the introduction of more unified SEC-IRBA and SEC-SA approaches. A SEC-External Ratings Based Approach (SEC-ERBA) was devised for jurisdictions (such as the European Union and UK) that permit the use of agency ratings in regulatory capital computations.
A key aspect of the finalised 2017 standards as far as the current study is concerned is the introduction of an output floor for banks implementing IRB approach. The new floor approach, termed ‘SA Output Floor’, is no longer based on Basel I capital computation but instead on the SA within the new Basel III framework.[16]
Regulators have justified the use of an output floor as a way to limit the regulatory capital benefits that a bank using IRB models can obtain relative to banks that employ RWs from SA lookup tables. Since regulators have tend to incentivise banks to use the more technically developed IRB approach, the floor for IRB bank capital was set at 72.5% of the SA RWAs (rather than say 100%), with lower percentages being applied during a 6-year implementation phase. It was initially planned that the implementation phase would end in 2028 but delays, including the Covid-19 pandemic, persuaded EU regulators to push back the deadline to 2030.
Table 2.1 shows the percentage floors (ranging up to 72.5%) to be applied during the implementation period.
Thus, in the sixth year of the transition period, IRB bank RWAs equal the higher of:
(i) Total RWAs calculated using the approaches that the bank has supervisory approval to use in accordance with the Basel III capital framework (including both the SA and IRB approaches)
(ii) 72.5% of the RWAs calculated using the SA only.
The SA Output Floor is calculated at a consolidated level across all of a given bank’s asset-class-specific portfolios. Banks for which a high proportion of their RWAs are generated using IRB models and for which these RWs are low, are likely to be affected earlier during the implementation phase.[17] If floors bind, banks may have an incentive to abandon IRB approaches altogether.
To assess the impact of the SA Output Floor on the securitisation market, one must understand, first, what are typical asset-class-level IRB and SA RWs for IRB banks when loans are retained on balance sheet, and, second, what the RWs are if the same loans are securitised and some tranches retained. We frame our analysis in terms of ‘Capital Multipliers’ (CMs), i.e., the ratio of capital post-securitisation to capital pre-securitisation. Due to the way that the securitisation capital rules have been designed and applied in Europe, the Capital Multiplier impacts senior tranches and non-senior tranches differently.
Originating banks are only permitted to apply securitisation capital approaches on retained tranches (rather than treating the pools as if they were retained on balance sheet) if the transactions pass a battery of tests which are linked to the notion of Significant Risk Transfer (SRT).
To gain further insight, we therefore calculate the amount of capital that is consumed, post-securitisation, by four different ranges of the seniority structure of a securitisation. The seniority ranges that we consider are (a) the first loss tranche detaching at a point equal to pool capital, (b) a ‘second loss’ tranche detaching at pool capital plus 1-year Expected Loss[18], (c) a medium seniority range detaching at the senior tranche attachment and (d) a senior tranche (optimised in a way to be explained below).
By decomposing the Capital Multiplier into 4 components, one can assess whether the issuer will be permitted to use the securitisation approaches or whether they will have to substitute the RWAs of securitisation tranches for the (generally) more costly pool RWAs. Note that this issue is relevant for originating banks not for bank investors when determining the SA Output Floor contribution of securitisation instruments. This issue will be analysed in Section 4.
| Year 1 | Year 2 | Year 3 | Year 4 | Year 5 | |||||
|---|---|---|---|---|---|---|---|---|---|
| 50% | 55% | 60% | 65% | 70% |
2.2 Data collection
In order to assess the impact of SA Output Floor on the European securitisation market one must begin by determining the pre-securitisation RWAs for IRB banks at the underlying asset class level. Asset-class-specific analysis is relevant because securitisations do not normally mix different asset classes due to them being highly specialised instruments secured against a single asset class.
Appendix 7 provides a review of the evolution of the European securitisation market. The review suggests that the five key asset classes for this market are:
1. Corporate exposures (Europe-wide)
2. SME exposures (Italy, Belgium, Spain)
3. Residential mortgage exposures (UK, Netherlands, Spain, France)
4. Automobile exposures (Germany, UK, Italy)
5. Consumer exposures (Italy, France)
In what follows we shall concentrate on these five asset classes.
To calibrate risk parameters (PDs and LGDs) appropriate for the five asset classes (as well as for the jurisdictions identified), in each case we choose a set of representative IRB banks from these countries that generate the majority of relevant lending. In the paragraphs below, we summarise the method for data collection, using only public information. Further detail is provided in the data annexes identified below.[19]
• Corporate exposures (excluding SMEs) The regulatory classification for the corporate (excluding corporate SMEs) asset class (often referred to as ‘Large Corporate’) is one that is the most international in its decomposition. We examine data for the largest 15 European corporate lenders that are using Advanced IRB models. These IRB institutions are: HSBC (UK), ING (NL), BNP Paribas (FR), Deutsche Bank (DE), Unicredit (IT), Santander (ES), Intesa Sanpaolo (IT), Société Générale (FR), Natwest (UK), Crédit Agricole (FR), UBS (CH), Barclays (UK), Crédit Suisse (CH), Groupe BPCE (FR) and Lloyds (UK). Pillar 3 public disclosures for these banks for the corporate (excluding SMEs) asset class are provided in Data Annex 5 and detailed results for this analysis are in Data Annex 6.
• Corporate SMEs (excluding Retail SMEs) At year end 2021, Italian, Belgian and Spanish SME ABS represented €70 bn or 74% of the European Total SME ABS Principal Outstanding. The top 4 SME lenders in Italy, Belgium and Spain are: o Italy: Intesa Sanpaolo, Unicredit, Banco BPM and MPS Belgium: BNP Paribas Fortis, KBC, Belfius and ING Belgium[20] o Spain: Santander, CaixaBank, BBVA and Sabadell o Pillar 3 public disclosures for the corporate SME (excluding Retail SMEs) asset class are provided in Data Annex 2 and detailed results for this analysis are in Data Annex 7.
• Residential Mortgages At the end of 2021, UK, Dutch, Spanish and French RMBS represented €467 bn or 79% of the European Total RMBS Principal Outstanding. o UK: according to UK Finance, a trade association for the UK banking and financial services sector, the UK includes the largest mortgage lenders and representing almost 2/3 of the market share[21] are Lloyds Banking Group, Nationwide, Santander UK, NatWest and Barclays. Netherlands: bank origination is mainly derived from the three lenders ING, Rabobank o and ABN Amro. Spain: according to the European Mortgage Federation, mortgage lending in Spain is o always provided by financial institutions. Banks and former saving banks supply the major part of the market, providing 91% of total outstanding mortgage lending. The remaining 9% is supplied by credit cooperatives (8%) and financial credit establishments (1%). Spanish bank origination is mainly generated by the following four lenders Santander, CaixaBank, BBVA and Sabadell. France: according to the European Mortgage Federation, the three main categories of o credit institutions involved in property lending are: private banks with a market of 34.2%, mutual and cooperative banks with a market share of 65.3% and specialised institutions that contribute the remainder. French bank origination is mainly derived from the four lenders: Groupe BPCE, BNP Paribas, Crédit Agricole and Société Générale. Pillar 3 public disclosures for the residential mortgage asset class are provided in Data Annex 1 and detailed results for this analysis are in Data Annex 8.
• Auto loans/leases (part of ‘Other – Retail’) At year end 2021, German and Italian Auto ABS represented €67 bn or 73% of the European Total Auto ABS Principal Outstanding. Although Auto ABS are also originated by banks in Europe, auto financing is increasingly being generated by ‘Captives’, which refers to banks belonging to automotive groups.
The captives have the feature that the auto risk in the EU CR6 templates is ‘isolated’ from that of other assets. Germany: auto captives use the SA instead of the IRB method and will not be impacted o directly by the SA Output Floor at the underlying level. Italy: same as Germany. o o France: two captives RCI Bank and PSA Banque use Advanced IRB models, and we employ their data to assess the impact of the SA Output Floor on this sector. UK: no major ‘captives’. UK Auto ABS is mainly derived from commercial banks. o Pillar 3 public disclosures for the ‘Auto’ asset class are provided in Data Annex 3 but, as they belong to the Basel regulatory asset class ‘Retail – Other’, the results are encompassed in Data Annex 9.
• Consumer loans (part of ‘Other – Retail’) At year end 2021, Italian and French Consumer ABS represented €60 bn or 72% of the European Total Consumer ABS Principal Outstanding. Italy: the two largest IRB consumer lenders are Unicredit and Intesa Sanpaolo and the o others are far behind size-wise. France: the top 4 IRB consumer lenders are Groupe BPCE, Crédit Agricole, BNP Paribas o and Société Générale. Pillar 3 public disclosures for the ‘Consumer’ asset class are provided in Data Annex 4, but, as they belong to the Basel regulatory asset class ‘Retail – Other’, they are encompassed in the latter’s heading for the results, provided in Data Annex 9.
2.3 Data formatting and use
To collect data on the risk characteristics of the lenders’ assets, we use their Pillar 3 reports and, when available, the EU CR6 template or its UK equivalent. An example of such a template is provided in Table 2.2. For each regulatory asset class, the template gives average values of risk parameters (including on and off-balance sheet EAD, ‘EAD post CRM and post CCF’[22], PD, LGD, RW) in predefined PD Scale buckets.
From such data, one may infer the quality of the portfolio of corporate assets.
• “All”: In Table 2.2, by taking all the assets (i.e., 100% of the EAD), this would give an EAD-weighted average PD of 5.43%, LGD of 32.57% and RW of 39.10%.
• “All, excluding Defaults”: In Table 2.2, by taking 96% of the cumulated EAD, this would give an average PD of 1.16%, LGD of 32.95% and a slightly higher RW of 39.64%. This view is more relevant than “All” as a new securitisation issuance would not include defaults (unless it is a specialised NPL securitisation). There is no accounting interference with provisions and low risk weight (27.28%) on defaulted assets, nor any interference as to the policy of slow or fast removal of defaulted assets from the balance sheet (increasing or lowering artificially the EAD at PD of 100%).
• “Top Part (PD<2.5%)”: In Table 2.2, by taking 85% of the EAD, this would give an average PD of 0.37%, LGD of 33.43% and RW of 30.75%.
While Simple, Transparent and Comparable (STC) securitisations[23] do not impose requirements on the PD of assets, they tend to use higher quality pools than Non-STC. Therefore, we will use the risk characteristics of “All, excl. Defaults” to calculate the capital requirements of Non-STC securitisations and of “Top Part (PD<2.5%)” for STC securitisations.
While this approach provides a good proxy of the risk characteristics for a particular combination of asset class and country, one must not forget that Pillar 3 EU CR6 templates are prepared on a consolidated basis and may include data from several jurisdictions and assets that would be out of scope for securitisations. Nevertheless, the use of these templates provides the best publicly available proxy information for this study.
While proxy information enables us to scan the whole potential for SRT transactions, we are fully conscious that banks will be subject to various requirements when executing real-life trades, and that this will skew the underlying pool RWs of SRT transactions towards levels that are higher than the average reported in the ‘Top Part (PD<2.5%)’ of their Pillar 3 disclosures. This skew can arise from regulatory constraints (such as homogeneity requirements), or from policy constraints (such as choosing assets not benefiting from supporting factors) or from risk management constraints (such as not securitising assets already benefiting from some form of credit protection not recognised in full in regulation) or from investor constraints (such as being high yielding). On the other side, real-life SRT transactions of low granularity motivated by the risk management of concentration limits will tend to have a pool RW lower that the average reported in the ‘Top Part (PD<2.5%)’ of their Pillar 3 disclosures.
Another limitation in this study is linked to the changing IRB RW over time for an identical asset of the same quality due shifting regulatory practices and gold-plating, such as the introduction of Input Floors on LGD, or the abandonment altogether of Advanced IRB towards the less risk sensitive Foundation IRB (fixed LGD and maturity) for large corporates.
| Cumulated % EAD | Average PD | Average LGD Average RW | ||||
|---|---|---|---|---|---|---|
| 50% | 0.08% | 35.12% | 18.76% | |||
| 59% | 0.24% | 34.19% | 34.15% | |||
| 67% | 0.41% | 30.55% | 41.54% | |||
| 73% | 0.67% | 28.20% | 47.40% | |||
| 85% | 1.50% | 30.22% | 63.06% | |||
| Top 85% | 0.37% | 33.43% | 30.75% | |||
| 94% | 5.22% | 30.26% | 112.30% | |||
| 96% | 24.39% | 21.15% | 97.35% | |||
| 100% | 98.09% | 24.34% | 27.28% | |||
| Bottom 15% | 33.98% | 27.77% | 86.19% | |||
| All | 5.43% | 32.57% | 39.10% | |||
| All (exc. Default) | 1.16% | 32.95% | 39.64% |
Note: The EAD used is the ‘EAD post CRM and post CCF’. Total: €216 billion. The on-balance sheet exposure is €164 billion.
3 Impact of the SA Output Floor on the Capital Multiplier
3.1 Pre-securitisation RWAs
Applying the method summarised in the last section (and described at much greater detail in the appendices), we infer representative PDs and LGDs for the regulatory asset classes: Corporate, SMEs, Residential Mortgage and ‘Retail – Other’ (which encompasses Automobile loans and Consumer loans). Table 3.1 presents the average results across the selected lenders for “All”, “All, excluding Defaults”, and “Top Part (PD<2.5%)”.
Our next task is to estimate the SA RWs for these regulatory asset classes. The process is described in Appendix 8.2.1 and the average results are presented in Table 3.2. The table also contains estimates of the implied SA Output Floor RW for each year of the implementation phase.
From the results in Table 3.2, one may deduce the year in which the SA Output Floor starts to bind for each of the asset classes in question. For example, on average, in Year 4, the SA Output Floor RW (50.9%) will be greater than the IRB RW (47.6%) for the Corporate asset class, for “All, excl. Defaults”. For this asset class, Year 4 may be said to be the “Year of the switch”.
Note that the IRB residential mortgage risk weights are very low in comparison to the Year 1 SA Output Floor risk weights. To avoid a ‘shock’ in capital requirements, regulators have given themselves three ‘financial stability tools’:
(a) They can cap the annual change in RWAs to a maximum of 25%.
(b) They can review the IRB models by requiring an ‘Input Floor’ to the IRB formula, inducing an early convergence of capital to the desired SA Output Floor.
They can advance the process of convergence by implementing a minimum value for an IRB risk weight that is closer to the Year 1 SA Output Floor. For example, the Dutch authorities (see DNB (2020)[24]) have done this at the asset level while the UK has followed this approach at the pool level (see Bank of England (2020))[25].
| Table 3.1: Top IRB | Lenders | Pillar 3 – | Average | asset risk | characteristics | (PD, LGD, | RW) | ||
|---|---|---|---|---|---|---|---|---|---|
| Lenders’ average | “All” | “All, | excl. Defaults” | “Top Part | (PD<2.5%)” | ||||
| PD | LGD | RW | PD | LGD | RW | PD | LGD | RW | |
| Corporate | 3.05% | 35.6% | 48% | 1.02% | 35.5% | 48% | 0.39% | 35.9% | 40% |
| SME | 11.91% | 35.2% | 52% | 2.80% | 34.2% | 54% | 0.80% | 34.8% | 42% |
| Residential Mortgage | 2.41% | 13.3% | 12% | 0.96% | 13.1% | 11% | 0.47% | 13.1% | 9% |
| Retail – Other | 5.33% | 36.1% | 37% | 1.98% | 35.0% | 39% | 0.68% | 33.7% | 31% |
| Pre-securitisation RWs IRB Lenders Average | SA Output Floor SA | ||||||||||||||
|---|---|---|---|---|---|---|---|---|---|---|---|---|---|---|---|
| Year 1 | Year 2 | Year 3 | Year 4 | Year 5 | Year 6 | ||||||||||
| SA Output Floor Percentage | 50% | 55% | 60% | 65% | 70% | 72.5% | |||||||||
| Corp: All, excl. Defaults26 | 47.6% | 39.1% | 43.1% | 47.0% | 50.9% | 54.8% | 56.8% | 78.3% | |||||||
| Corp: Top Part (PD<2.5%) | 39.5% | 35.0% | 38.5% | 42.0% | 45.5% | 49.1% | 50.8% | 70.1% | |||||||
| SME: All, excl. Defaults27 | 53.8% | 42.5% | 46.8% | 51.0% | 55.3% | 59.5% | 61.6% | 85.0% | |||||||
| SME: Top Part (PD<2.5%) | 42.3% | 42.5% | 46.8% | 51.0% | 55.3% | 59.5% | 61.6% | 85.0% | |||||||
| Residential: All, excl. Defaults | 11.2% | 17.5% | 19.3% | 21.0% | 22.8% | 24.5% | 25.4% | 35.0% | |||||||
| Residential: Top Part (PD<2.5%) | 8.9% | 17.5% | 19.3% | 21.0% | 22.8% | 24.5% | 25.4% | 35.0% | |||||||
| Retail-Oth.: All, excl. Defaults | 39.0% | 37.5% | 41.3% | 45.0% | 48.8% | 52.5% | 54.4% | 75.0% | |||||||
| Retail-Oth.: Top Part (PD<2.5%) | 31.4% | 37.5% | 41.3% | 45.0% | 48.8% | 52.5% | 54.4% | 75.0% |
3.2 Post-securitisation RWAs
We now turn to the calculation of post-securitisation required capital. The detailed capital rules for tranche capital requirements (including mathematical formulae) are presented in Appendix 8.1.2 for the IRB calculation (SEC-IRBA) and in Appendix 8.2.2 for the SA calculation (SEC-SA).
The SEC-IRBA inputs involve the non-recognition of Future Margin Income (FMI) up to the one-year expected loss in that the ‘capital’ input to the formula is pool RWA plus 1-year EL. We estimate this latter amount using PD and LGD statistics from the EU CR6 template. One must also make assumptions with regard to the typical inputs required in the p"#$% parameter of SEC-IRBA. We adopt the following assumptions:
a) Granularity of 75 for Corporate (excluding SMEs) pools and 150 for SME corporate pools, and
b) Tranche maturity for new issuances of 5 years.
Estimating total RWAs generated by the SEC-IRBA and SEC-SA entails assumptions about the attachment point of the senior tranche (i.e., the tranche with a detachment point that is equal to 100%). Reflecting industry practice, we fix the senior tranche attachment point so that the senior tranche RW equals the senior tranche RW floor of 15% for Non-STC securitisations and 10% for STC securitisations (see Figure 3.1 for a graphical explanation).[28]
Results averaged across banks for SEC-IRBA and SEC-SA are provided in Table 3.3.
Table 3.3 reveals that the “Year of the switch,” (i.e., the first year that the SA Output Floor binds) for the SEC- IRBA differs from that for the underlying pool assets (as reflected in the results in Table 3.2). For example, in Table 3.2, the Corporate “All, excl. Defaults” pool switches in Year 4, but, for a Non-STC securitisation backed by that pool, the “Year of the switch” is in Year 2 (as the SA Output Floor RW with SEC-SA is 86.1%) whereas the SEC-IRBA RW value is 79.4%.
Tables 3.4 (with results for Wholesale) and 3.5 (with results for Retail) present ratios of the SA Output Floor RW to the IRB RW, both for the underlying pool and for the securitisation. When a ratio is below 1.00, the IRB method will prevail and, when above 1.00, the SA Output Floor will prevail. The tables display a green tick when IRB prevails and a red cross when the SA Output Floor will prevail. The year when a green tick changes to a red cross coincides with the year in which the SA Output Floor starts to bind.
At an aggregated level (i.e. non-bank specific), from Year 4, the Wholesale assets and their securitisations will be constrained by the SA Output Floor. In both cases, the securitisation RWAs will increase faster than the underlying RWAs, making securitisation less attractive in relative terms.
For Retail assets, the constraint of SA Output Floor will bind in Year 1 for residential mortgages and Year 2 for ‘Other’ (auto, consumer) assets. In this case, the asset RWAs increase faster than the securitisation RWAs, making securitisation relatively more attractive. The above analysis compares total capital from the pre- and post-securitisation point of view. While this gives a first indication of incentives to securitise, the picture is more complex because a bank securitising a portfolio of loans will only retain a portion of the tranches. Hence, to understand incentives, one must examine the capital changes implied by SA Output Floors for different ranges of the seniority structure and, in particular, for tranche ranges that the bank is likely to retain while having a realistic chance of placing other tranches with non-bank investors.
| Post-securitisation RWs SEC-IRB Lenders Average | SA Output Floor based on SEC-SA SEC-SA | ||||||||||||||
|---|---|---|---|---|---|---|---|---|---|---|---|---|---|---|---|
| Year 1 | Year 2 | Year 3 | Year 4 | Year 5 | Year 6 | ||||||||||
| SA Output Floor Percentage | 50% | 55% | 60% | 65% | 70% | 72.5% | |||||||||
| Corporate: Non-STC | 79.4% | 78.3% | 86.1% | 94.0% | 101.8% | 109.6% | 113.5% | 156.6% | |||||||
| Corporate: STC | 53.6% | 52.6% | 57.8% | 63.1% | 68.3% | 73.6% | 76.2% | 105.1% | |||||||
| SME: Non-STC | 97.7% | 85.0% | 93.5% | 102.0% | 110.5% | 119.0% | 123.3% | 170.0% | |||||||
| SME: STC | 59.5% | 63.8% | 70.1% | 76.5% | 82.9% | 89.3% | 92.5% | 127.5% | |||||||
| Residential: Non-STC | 28.3% | 35.0% | 38.5% | 42.0% | 45.5% | 49.0% | 50.8% | 70.0% | |||||||
| Residential: STC | 15.6% | 26.3% | 28.9% | 31.5% | 34.1% | 36.8% | 38.1% | 52.5% | |||||||
| Retail-Other: Non-STC | 106.3% | 75.0% | 82.5% | 90.0% | 97.5% | 105.0% | 108.7% | 150.0% | |||||||
| Retail-Other: STC | 56.1% | 56.2% | 61.9% | 67.5% | 73.1% | 78.7% | 81.6% | 112.5% |
| Wholesale | Year | 1 Year | 2 Year | 3 Year | 4 Year | 5 Year | 6 | |
|---|---|---|---|---|---|---|---|---|
| Corporate | All (Excl. | Defaults) | 0.82x | 0.91x | 0.99x | 1.07x | 1.15x | 1.19x |
| Non-STC | Securitisation | 0.99x | 1.08x | 1.18x | 1.28x | 1.38x | 1.43x | |
| Top Part | (PD<2.5%) | 0.89x | 0.98x | 1.07x | 1.15x | 1.24x | 1.29x | |
| STC | Securitisation | 0.98x | 1.08x | 1.18x | 1.28x | 1.37x | 1.42x | |
| SME | All (Excl. | Defaults) | 0.79x | 0.87x | 0.95x | 1.03x | 1.11x | 1.14x |
| Non-STC | Securitisation | 0.87x | 0.96x | 1.04x | 1.13x | 1.22x | 1.26x | |
| Top Part | (PD<2.5%) | 1.00x | 1.11x | 1.21x | 1.31x | 1.41x | 1.46x | |
| STC | Securitisation | 1.07x | 1.18x | 1.29x | 1.39x | 1.50x | 1.55x |
| Retail | Year | 1 Year | 2 Year | 3 Year | 4 Year | 5 Year | 6 | |
|---|---|---|---|---|---|---|---|---|
| Residential | All (Excl. | Defaults) | 1.56x | 1.72x | 1.87x | 2.03x | 2.19x | 2.27x |
| Mortgage | Non-STC | Securitisation | 1.24x | 1.36x | 1.49x | 1.61x | 1.73x | 1.80x |
| Top Part | (PD<2.5%) | 1.97x | 2.17x | 2.37x | 2.57x | 2.76x | 2.86x | |
| STC | Securitisation | 1.68x | 1.85x | 2.01x | 2.18x | 2.35x | 2.43x | |
| Other | All (Excl. | Defaults) | 0.96x | 1.06x | 1.15x | 1.25x | 1.35x | 1.39x |
| Non-STC | Securitisation | 0.71x | 0.78x | 0.85x | 0.92x | 0.99x | 1.02x | |
| Top Part | (PD<2.5%) | 1.19x | 1.31x | 1.43x | 1.55x | 1.67x | 1.73x | |
| STC | Securitisation | 1.00x | 1.10x | 1.20x | 1.30x | 1.40x | 1.45x |
3.3 Capital Multiplier and its Components
In this subsection, we break the Capital Multiplier (i.e., the ratio of capital post-securitisation to capital presecuritisation) down into different components which correspond to different ranges of the seniority structure of the relevant securitisations.
As previously noted, it is important to consider such components for the following reasons:
a) Banks securitising typically dispose of some portions of the risk (by retaining tranches) and so, the most relevant issue for them is the capital treatment of retained tranches, and
b) Regulatory rules within Europe require that securitisations pass Significant Risk Transfer (SRT) tests.
The numerator of the Capital Multiplier is the area under the regulatory risk weight curve under the SEC-IRB rules. This is depicted graphically in Figure 3.1. In Figure 3.1., the x-axis corresponds to attachment points of notional thin tranches or tranchelettes. When these are very thin, the attachment and detachment points are equal. The y-axis in the figure represents the risk weights of individual tranchelettes. One may split up the numerator of the Capital Multiplier by dividing the area under the SEC-IRB curve into four components.
1) The first component is the RWAs of the pool itself and is represented by the area in the orange rectangle (0%-6% attachment point in the figure). 2) The second component corresponds to 1-year ELs, reflecting the non-recognition of FMI for securitisations.[29] In the figure this is denoted by the area of the red rectangle (shown in the figure as the tranche corresponding to the 6%-7% range). 3) The third component is the RWA for a notional ‘medium seniority’ tranche that attaches at pool RWA plus 1-year EL and detaches at the attachment point of the senior tranche. This component is shown by the area below the blue curve[30]. It starts where the RW curve drops from a 1,250% level and finishes at the attachment point of an ‘optimised’ senior tranche which is 12.84% in Figure 3.1. 4) The fourth component is linked to the RWAs of the senior tranche. It is common industry practice to minimise the RWAs of the retained part of the securitisation by choosing a structure in which the senior tranche attaches at the point at which the tranche RW equals the senior tranche risk weight floor set in the rules, 15% for Non-STC securitisations and 10% for STC securitisations. In Figure 3.1, this results in a ‘senior optimised tranche attaching at 12.84% and detaching at 100%. This appears as the large green rectangle in the figure.[31]
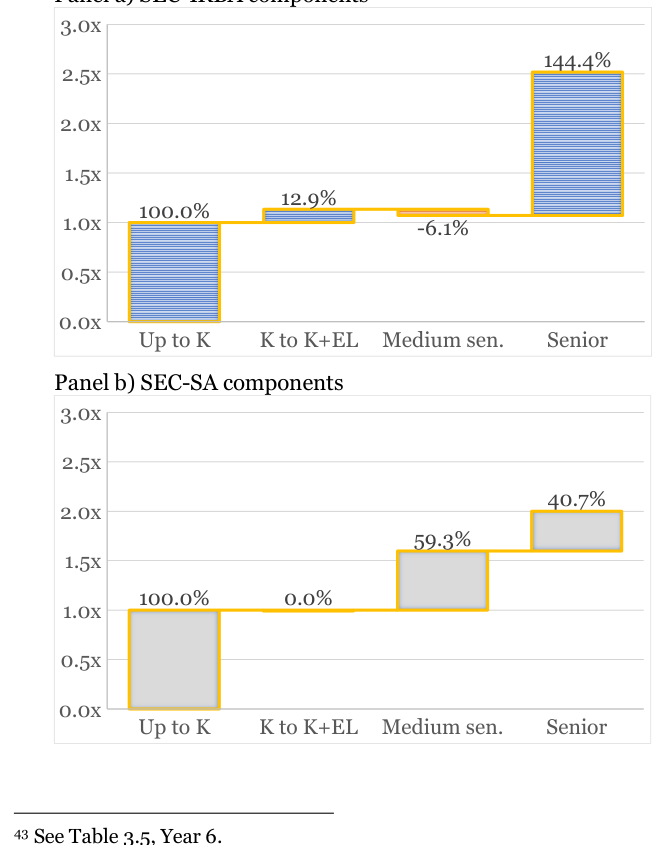
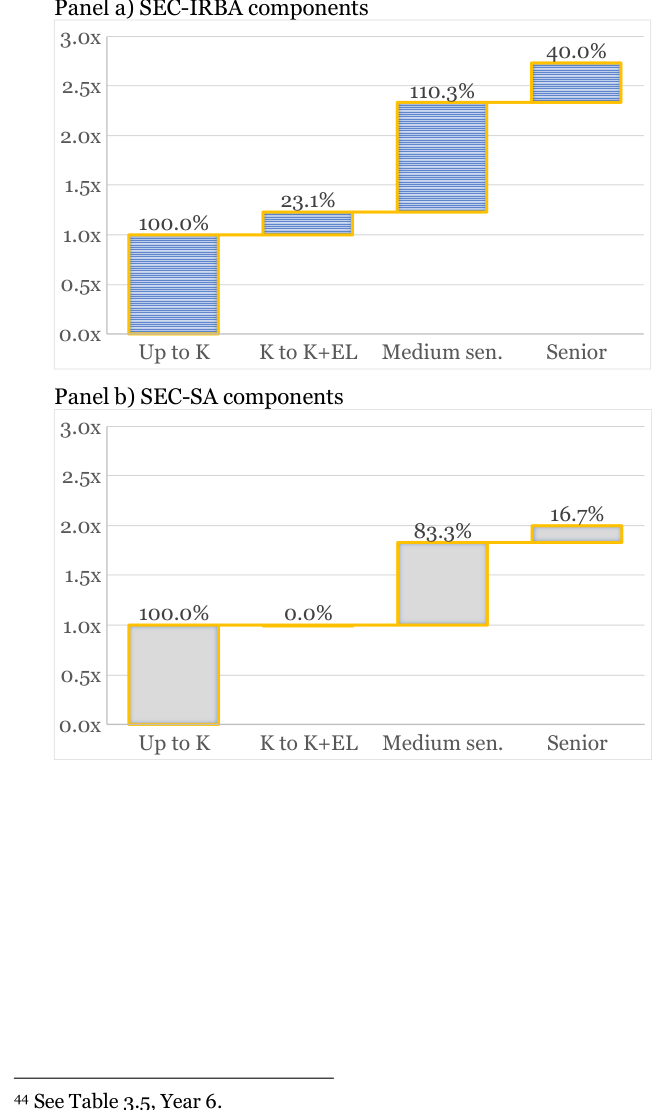
The four components shown in Figure 3.1, expressed as percentages of pool RWAs, are plotted in Figure 3.2.
Table 3.6 shows the relative importance of the components of the Post-Securitisation RWAs.
In estimating the total amount of RWAs generated by the two approaches, SEC-IRBA and SEC-SA, one must assume values for the attachment point of the senior tranche. Here, we assume that the senior tranche attachment point is chosen so that RWs equal the senior floor.[32] The attachment point will be different if an IRBA or SA approach is used.
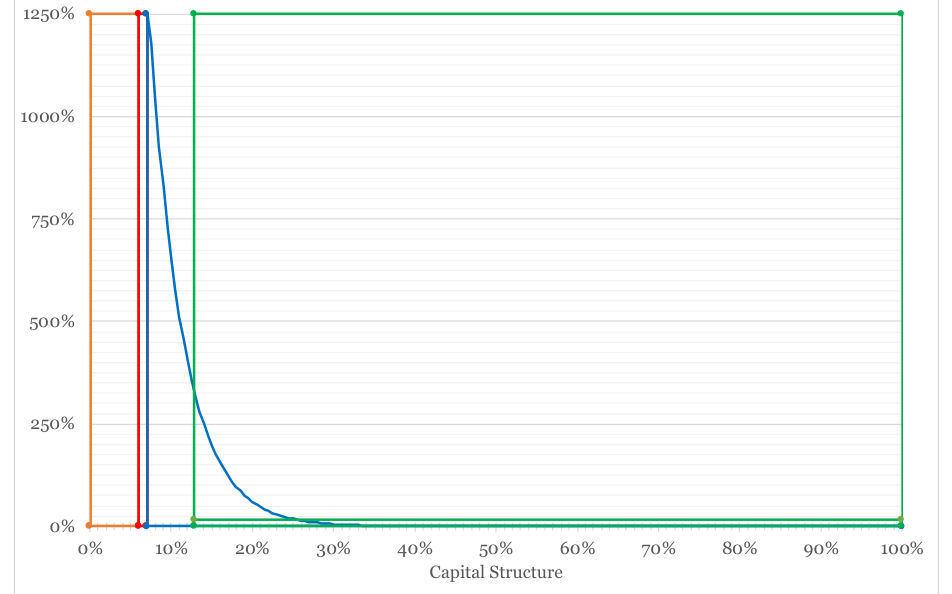
Note: The figure shows the decomposition of SEC-IRBA RWAs for a corporate Non-STC securitisation in Year 1 of the transition period. The orange rectangle corresponds to pool RWAs. The red rectangle corresponds to 1-year pool ELs. The area under the blue curve to the left of the attachment point of the senior tranche corresponds to the medium seniority tranche RWAs. The area under the blue curve (and green horizontal line) to the right of the senior tranche attachment point corresponds to senior tranche RWAs.
| Components of | SEC-IRBA | Components | of SEC-SA | ||||||
|---|---|---|---|---|---|---|---|---|---|
| Lenders | Average | ||||||||
| K to | Medium | K to | Medium | ||||||
| Up to K | Senior | Up to K | Senior | ||||||
| K+EL | sen. | K+EL | sen. | ||||||
| Corporate: | Non-STC | 100% | 9.3% | 25.8% 31.4% | 100% | 0% | 84.2% | 15.8% | |
| Corporate: STC | 100% | 4.4% | 5.5% 25.8% | 100% | 0% | 37.0% | 13.0% | ||
| SME: Non-STC | 100% | 22.4% | 29.7% 28.6% | 100% | 0% | 85.9% | 14.1% | ||
| SME: STC | 100% | 8.3% | 7.5% 25.0% | 100% | 0% | 39.7% | 10.3% | ||
| Residential: | Non-STC | 100% | 12.9% | -6.1% 144.4% | 100% | 0% | 59.3% | 40.7% | |
| Residential: | STC | 100% | 7.5% | -54.6% 124.4% | 100% | 0% | 22.5% | 27.5% | |
| Retail-Other: | Non-STC | 100% | 23.1% | 110.3% 40.0% | 100% | 0% | 83.3% | 16.7% | |
| Retail-Other: | STC | 100% | 9.5% | 32.3% 36.6% | 100% | 0% | 38.0% | 12.0% | |
| 29 | The term | ‘Expected Loss’ in the formula | is a | misnomer: in | Basel 2 and Basel 3, | the 1-year | EL is a cap | to the | recognition |
| existing Future | Margin Income (FMI) | on assets. | This FMI is | in reality greater than | the | 1-year EL. We’ll | keep the | term ‘EL’ | |
| describe this | portion, not forgetting that | this is | in fact income. | ||||||
| 30 | The figure is | using a p value of 60%. | |||||||
| 31 | In effect, the | optimisation has matched | the | RWAs contained | in the area under | the blue | curve, inside | the green | senior |
| tranche, with | the thin green rectangular | area | that has a risk | weight of 15% from the | attachment point of | 12.84% to | the | ||
| detachment point | of 100% of the senior | tranche. |
4 Overview of SA Output Floor on SRT
4.1 Conditions for SRT
In this subsection, we focus on the conditions that originating banks must satisfy in order to be allowed to calculate capital for retained tranches using securitisation approaches.
For such banks, the use of the securitisation framework to calculate the risk weight of tranches is subject to operational requirements for the recognition of risk transference. Failure to satisfy such requirements means that an originating bank must employ the RWAs of the entire asset pool in its regulatory capital calculations rather than using RWAs computed for the retained tranches. Indeed, BCBS CRE 40.24 stipulates that “an originating bank may exclude underlying exposures from the calculation of risk-weighted assets only if all of the following conditions have been met. […] (1) Significant credit risk associated with the underlying exposures has been transferred to third parties. […]”.
Since Basel was not very prescriptive as to the means for demonstrating that the significant credit risk transfer had been achieved, the result was practices that varied widely across Europe. For example, under Basel II, the French competent authority required that retained tranches generate no more than 90% of pool RWAs. While, on the other hand, the German competent authority required that no more than 50% of the RWAs of mezzanine rated tranches be retained. Structures tailored to satisfy French rules would not necessarily pass the German rules, and vice-versa.
The European Banking Authority, therefore, started a consultation process that led to the issuance of a document entitled “Guidelines on Significant Credit Risk Transfer” (see EBA (2014)). The document provides guidelines for both originator institutions and competent authorities and was designed with the objective of harmonising treatment across EU Member States.
In 2020, the EBA produced a “Report on Significant Risk Transfer” in which it proposed a series of additional conditions. While those conditions are not officially part of the legislative framework, the European authorities have a reputation for not systematically granting grandfathering rights on past transactions created before a law comes into force. This means that originating banks tend to adapt their transactions to ensure compliance with rules even if the latter remain at a consultation stage. With this in mind, we assume here that the EBA 2020 conditions will be part of the future European legislative framework (while recognising that some elements of the EBA 2020 report will likely need to be modified by the European Parliament during the drafting of the legislation so that banks can keep risk manage their balance sheet via the securitisation technique).
The EBA 2020 report contains conditions for significance, commensurateness and effectiveness of risk transfer. To assess commensurateness, Recommendation 12 of the report indicates that the Principle Based Approach (PBA) test must be applied. This states that a minimum of 50% of the “Regulatory UL” of the underlying portfolio should be transferred to third parties. The regulatory Unexpected Loss (UL) normally refers to the pre-securitisation pool RWAs multiplied by 8%. But, in the case of the PBA test, the UL in Europe is proposed to be gold-plated by adding the Long-Term Expected Loss (LTEL), a notion that does not exist in the Basel securitisation framework.[33] LTEL is added both in the numerator (RWAs of transferred tranches) and in the denominator (RWAs of the pool).
In the absence of data on the LTEL, one can consider a ratio in which the numerator is the RWA of the retained tranches, rather than the transferred tranches as in the PBA test, and the LTEL is omitted from the numerator and denominator. Mathematically, a failure in this simplified ratio (if the value is greater than 50%) implies a failure in the EBA PBA test. Such a failure leads to a failure of the SRT conditions and, hence, implies that a bank may not employ the securitisation framework but, instead, must employ the underlying pool RWAs in its regulatory capital calculations.[34]
Box 1: PBA test
Recommendation 12 of 2020 EBA Report Regulatory UL on transferred positions 0.5 ≤ Regulatory UL of tℎe underlying portfolio
• Numerator: the regulatory UL on the transferred positions should take into account the allocation of LTEL and regulatory UL to the tranches […]
• Denominator: the regulatory UL of the underlying portfolio calculated in accordance with point (c) of Recommendation 9 [below], minus the part of NRPPD that absorbs UL, minus the part of EEVES that absorbs UL in traditional securitisations if the market test is met.
Recommendation 9: “a) For the purpose of calculating LTEL, the EBA recommends adopting a model approach, whereby originators would determine the LTEL as the sum of the EL throughout the life of the transaction […]; b) […]; c) In relation to the calculation of UL, the regulatory UL should be calculated by reference to the originator’s CRR total capital ratio of 8% without taking into consideration the Capital Requirements Directive (CRD) capital buffers. Therefore, the UL of the portfolio would be the result of multiplying the RWEAs of the underlying portfolio by the total capital ratio of 8%, as set out in Article 92 of the CRR.”
Indeed, the PBA test in Box 1 can be simplified with transferred positions:
if =Trancℎe Capital+ Trancℎe LTEL on transferred positions ≤0.5Dtℎen PBA test fails Pool Capital+ Pool LTEL
Or with retained positions: if =Trancℎe Capital+ Trancℎe LTEL on retained positions ≥0.5Dtℎen PBA test fails Pool Capital+ Pool LTEL
To assess the impact of the SA Output Floor on the SRT conditions, we assume that banks only retain the senior tranche with optimised attachment points so that the IRB tranche risk weight floor applies. We further assume that the portion of the transaction below 1.00x K"#$ is placed with investors and where all the mezzanine portion impacted by the medium seniority parameter is also placed. As an example, for Corporate, one may observe from Table 3.5 that, on average, 31.4% of the pre-securitisation capital requirement remains with the originating bank. This value can only be used, however, if the SRT conditions are met.
For such a senior tranche, the Tranche LTEL is always significantly smaller than Pool LTEL, thus, we have: Trancℎe Capital ≥ Trancℎe Capital+ Trancℎe LTEL on retained positions Pool Capital Pool Capital+ Pool LTEL
Therefore, without LTEL, we have for the senior retained positions:
if =Trancℎe Capital ≥0.5D tℎen PBA test fails Pool Capital
4.2 SRT results on existing transactions
The average wholesale SRT results are displayed in Table 4.1 and the retail SRT results in Table 4.2.
The first row of Table 4.1 is for corporate assets, using the ‘All, excl. Default’ risk characteristics, with an average IRB risk weight for the pool of 47.6%. Using SEC-IRBA for Non-STC securitisations, the optimised senior attachment point is, on average, 1.44 times the IRB pool capital, or an average of 5.6% of the capital structures.[35] The resulting senior tranche, would have a risk weight of 15%, which would represent 31.4% of pool RWAs.[36]
To apply the SA, one may take the attachment points to be optimised under IRB (i.e. taking an average value of 5.6% of the capital structures) and apply the SEC-SA. Under SA, the pools have an average risk weight of 78.3% and SEC-SA applied to the senior tranches results in an average risk weight of 91.7% (more than the average pool risk weights, even though the tranches are senior[37]). This means that the senior tranches have a RWA component that is 110.8% of the SA pool RWA, a value that is clearly above the 50% threshold for the PBA test. While a first glance assessment might lead one to compare an average SA Output Floor risk weight of 66.5% with the IRB risk weight of 15%, due to the failure of the SRT test, the real risk weight would be 72.5% of the SA pool risk weight. Individual banks’ results are in Data Annex A6.5 and further discussion is provided in Appendix 11.1.4.
The second row of Table 4.1 shows that for higher quality pools (i.e., “Top Part (PD<2.5%)” with an average risk weight of 39.5% and associated STC securitisations (for which the senior tranche risk weight is 10% and an average of 25.8% of pool RWAs), the failure of the SRT test[38] in the SA means one would need to use an average final RWA of 50.8% (=72.5% times SA average pool risk weights of 70.1%) for senior tranches instead.
The third and fourth rows of Table 4.1 show the results for the SME asset class. On average, the SRT conditions are not met, both for Non-STC and for STC securitisations. For the SME asset class, individual banks’ results are in Data Annex A7.5, and further discussion is provided in Appendix 11.2.4.
Average results for residential mortgages are provided in the first two rows of Table 4.2, and individual banks’ results are in Data Annex A8.5 and further discussion is provided in Appendix 11.3.4. The underlying pool IRB risk weights are on average 11.2%, lower than the senior tranche risk weight floor for Non-STC transactions of 15% and almost equal to the 10% for STC securitisations. Therefore, SRT with ‘optimised’ tranches does not work under current conditions. And indeed, under IRB, there are almost no SRT securitisations of residential mortgage pools that are using high quality assets.
In the case of the ‘Other – Retail’ asset class, the SRT test under SA would fail on average (although some individual banks would have pools that would pass the SRT test under SA, as shown in Data Annex A9.5). More discussion is provided in Appendix 11.4.4.
Should the legislative process results in implementing the EBA 2020 report without first making an assessment of the economic impact on existing transactions, it is likely that banks will exercise ‘regulatory calls’, a legal clause that entitles them to cancel a trade when new regulation affects materially an existing SRT transaction. This will create a wave of additional capital requirement for banks that are risk-managing their balance sheet.
| SRT Considerations | for | Securitisation | Attachment Point | (A) | IRB Senior | tranche | RW | % of Pool | RWA | |
|---|---|---|---|---|---|---|---|---|---|---|
| IRB Senior | tranches | |||||||||
| Pool | RW | expressed as: | (Pass | ≤50%, | ||||||
| Fail>50%) | ||||||||||
| Mult. | Mult. | Final | ||||||||
| % of | ||||||||||
| Wholesale | IRB | SA | SEC- | SEC- | SA | Retain. | Retain. | |||
| IRB | SA Cap. | |||||||||
| Lenders | Average | Pool | Pool | IRBA | SA | Output | IRB | SA | ||
| Struc. | ||||||||||
| Cap. | Cap. | Floor | ||||||||
| Corporate: All, | excl. | |||||||||
| 47.6% | 78.3% 5.6% | 1.44x | 0.89x | 15.0% | 91.7% | 66.5% | 31.4% | 110.8% | ||
| Defaults; Non-STC | ||||||||||
| Corporate: Top | Part | |||||||||
| 39.5% | 70.1% 3.6% | 1.11x | 0.64x | 10.0% | 62.8% | 45.5% | 25.8% | 86.4% | ||
| (PD<2.5%), STC | ||||||||||
| SME: All, excl. | Defaults; | |||||||||
| 53.8% | 85.0% 7.4% | 1.65x | 1.09x | 15.0% | 89.0% | 64.5% | 28.6% | 98.2% | ||
| Non-STC | ||||||||||
| SME: Top Part | (PD<2.5%); | |||||||||
| 42.3% | 85.0% 4.1% | 1.18x | 0.60x | 10.0% | 79.1% | 57.3% | 25.0% | 89.6% | ||
| STC |
| SRT | Considerations for | Securitisation | Attachment Point | (A) | IRB Senior | tranche | RW | % of Pool | RWA | |
|---|---|---|---|---|---|---|---|---|---|---|
| IRB Senior | tranches | |||||||||
| Pool | RW | expressed as: | (Pass | ≤50%, | ||||||
| Fail>50%) | ||||||||||
| Mult. | Mult. | Final | ||||||||
| % of | ||||||||||
| Retail | IRB | SA | SEC- | SEC- | SA | Retain. | Retain. | |||
| IRB | SA Cap. | |||||||||
| Lenders | Average | Pool | Pool | IRBA | SA | Output | IRB | SA | ||
| Struc. | ||||||||||
| Cap. | Cap. | Floor | ||||||||
| Residential: | All, excl. | |||||||||
| 11.2% | 35.0% 1.1% | 1.10x | 0.40x | 15.0% | 56.7% | 41.1% | 144.4% | 160.4% | ||
| Defaults; | Non-STC | |||||||||
| Residential: | Top Part | |||||||||
| 8.9% | 35.0% 0.5% | 0.53x | 0.16x | 10.0% | 47.0% | 34.1% | 124.4% | 133.7% | ||
| (PD<2.5%), | STC | |||||||||
| Other: All, | excl. Defaults; | |||||||||
| 39.0% | 75.0% 10.3% | 3.17x | 1.72x | 15.0% | 48.2% | 34.9% | 40.0% | 59.2% | ||
| Non-STC | ||||||||||
| Other: Top | Part | |||||||||
| 31.4% | 75.0% 4.2% | 1.58x | 0.70x | 10.0% | 62.2% | 45.1% | 36.6% | 80.0% | ||
| (PD<2.5%); | STC |
4.3 SRT on future transactions
The current rule applies a risk weight floor to senior tranches that is a fixed value (15% and 10% for Non-STC and for STC securitisations, respectively) with no relationship to the risk weight of the pool. This provides banks with strong incentives to adopt senior tranche attachment points that equate RWs to the floor level.[39]
Depending on whether the SA Output Floor binds, an IRB bank will derive this ‘optimised’ tranching from the SEC-IRBA or SEC-SA RW formula. Table 4.3 provides the average attachment points expressed as pool capital multipliers under the two formulae, but as the pool capital is different in IRB and SA, to enable a direct comparison, we express those values as a percentage of the capital structure.
For example, for Non-STC corporate securitisation, the average senior tranche attachment point will move from an average 1.44 times IRB pool capital to 2.85 times SA pool capital, or from 5.6% of the capital structure to 17.9% of the capital structure. If the non-senior part is placed with investors, the SRT investor market for this asset class would need to increase in volume by 220% (=17.9%/5.6% - 1) in the space of 6 years. It would also be necessary to find new types of investors to absorb these volumes since the yield required on the 5.6%-17.9% part of the capital structure would not be the same as the yield currently paid on the 0%-5.6% part of capital structure.
We view a tripling of the market as unlikely. It is more likely that the SRT market will shrink tremendously due to a reduce amount of SRT issuances, unless the regulatory bottlenecks are addressed (see our conclusions).
| Table 4.3 – | Optimised Senior | Tranche | Attachment | Point | (AP) | ||||
|---|---|---|---|---|---|---|---|---|---|
| IRB Optimised | SA | Optimised | |||||||
| Lenders | Senior Tranche | AP | Senior | Tranche AP | |||||
| Risk | characteristics | Increase | |||||||
| Average | As % capital | As | multiplier | As | % capital As | multiplier | |||
| structure | of | Pool K | structure of | Pool K | |||||
| Corporate | Pools: All, excl. | Defaults | |||||||
| 5.6% | 1.44x | 17.9% | 2.85x | 220% | |||||
| Securitisations: | Non-STC | ||||||||
| Pools: Top Part | (PD<2.5%) | ||||||||
| 3.6% | 1.11x | 9.4% | 1.68x | 161% | |||||
| Securitisations: | STC | ||||||||
| SME | Pools: All, excl. | Defaults | |||||||
| 7.4% | 1.65x | 20.1% | 2.96x | 172% | |||||
| Securitisations: | Non-STC | ||||||||
| Pools: Top Part | (PD<2.5%) | ||||||||
| 4.1% | 1.18x | 12.2% | 1.79x | 198% | |||||
| Securitisations: | STC | ||||||||
| Residential | Pools: All, excl. | Defaults | |||||||
| 1.1% | 1.10x | 5.3% | 1.90x | N/A | |||||
| Mortgage | Securitisations: | Non-STC | |||||||
| Pools: Top Part | (PD<2.5%) | ||||||||
| 0.5% | 0.53x | 3.6% | 1.30x | N/A | |||||
| Securitisations: | STC | ||||||||
| ‘Retail – | Pools: All, excl. | Defaults | |||||||
| 10.3% | 3.17x | 16.8% | 2.79x | 63% | |||||
| Other’ | Securitisations: | Non-STC | |||||||
| Pools: Top Part | (PD<2.5%) | ||||||||
| 4.2% | 1.58x | 10.3% | 1.71x | 145% | |||||
| Securitisations: | STC | ||||||||
| Note: We only | provide increases | where there is a | current SRT | market. | We do not | provide | the increase | for residential |
Note: We only provide increases where there is a current SRT market. We do not provide the increase for residential mortgage, as the current optimisation process in IRB is failing SRT test, and the increase calculated would be financially meaningless.
5 Results
Below are our conclusions for the main asset classes which are relevant for the European securitisation market.
1. Corporate exposures (excluding SMEs)
and this asset class is mainly represented in the securitisation market by SRT transactions.
For this large corporate class, pool RWAs will only increase by about 19%, whereas the securitisation RWAs will increase by about 43% once the SA Output Floor is fully implemented.[40] There is currently little traditional corporate securitisation activity which involves on-balance-sheet corporate loans[41] and the faster increase in securitisation RWA compared to pool RWA will not improve the situation.
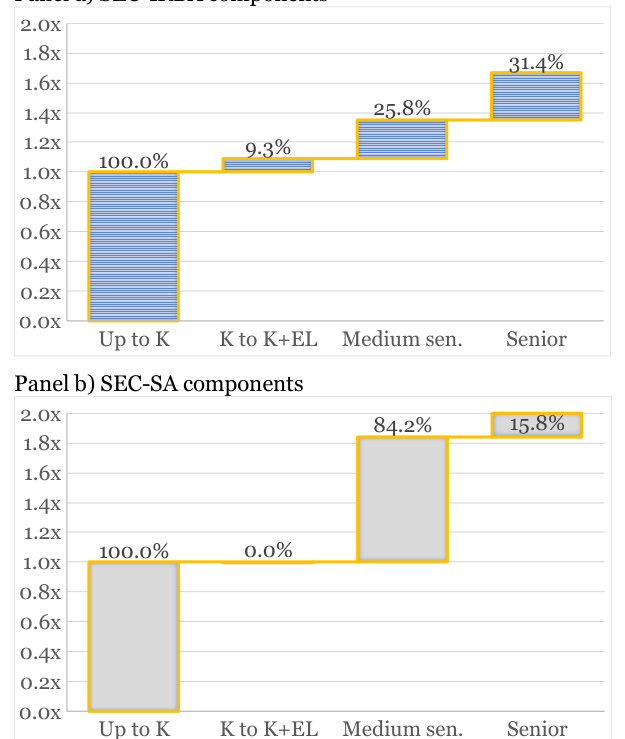
There is an active market in SRT trades with large corporate portfolio as the optimised attachment point for the senior tranche is 1.44 times pool capital in IRB. For Non-STC securitisations the capital multiplier is 1.66x with SEC-IRBA and 2.0x with SEC-SA (1.36x and 1.50x respectively for STC). The main source of the increase in RWAs will be due to the medium seniority component, which would change from 25.8% to 84.2% of pre-securitisation pool RWAs (see Figure 5.1). As a result, almost all SRT transactions (both Non- STC and STC), currently approved by regulators for SEC-IRBA, will fail risk transfer criteria.
2. Corporate SME exposures
Once the SA Output Floor is fully implemented, the underlying RWAs for corporate SMEs will increase by about 14%, whereas the Non-STC securitisation RWAs will increase by about 26%.[42] The percentage difference is small.
We do not expect the SA Output Floor to change the volumes of traditional SME securitisations, but there will be repercussions for the synthetic market, at least for those transactions that do not benefit from special multilateral or state-like guarantees.
40 See Table 3.4, Year 6. 41 The large European market for CLOs of Leveraged Loans is not considered as a balance sheet activity. 42 See Table 3.4, Year 6.
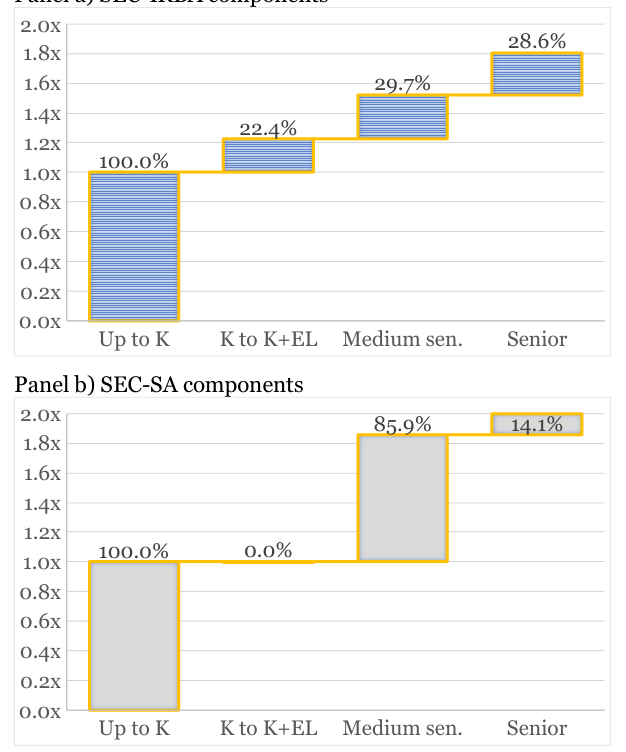
Indeed, most of the existing SRT transactions will fail regulatory tests, despite the fact that, as shown in Figure 5.2, the overall impact is neutral. For Non-STC securitisations, the capital multiplier of 1.81x in SEC- IRBA may be compared to a figure of 2.00x for SEC-SA (1.41x and 1.50x respectively for STC). It is a similar level, but Figure 5.2 shows that the relative importance of the components will change, with the medium seniority component being particularly problematic, but with an increase that is offset by the savings made on the second component.
3. Residential mortgage exposures
Once the SA Output Floor is fully implemented, the underlying RWAs for residential mortgages will increase substantially by about 127%, whereas the Non-STC securitisations will by a lesser percentage of 80%.[43] The difference is material, and should lead to an increase in securitisations.
For Non-STC securitisations, the capital multiplier of 2.51x in SEC-IRBA may be compared to a figure of 2.00x for SEC-SA (1.77x and 1.50x respectively for STC). Residential mortgage securitisations will benefit from the reduced importance of the senior floor component (see Figure 5.3). The senior risk weight floor of 15% for Non-STC securitisations and 10% for STC securitisations is too high relative to the low IRB risk weights (average 11%) of high-quality mortgages found on the balance sheet of European banks.
We expect to see more placed STC securitisations with risk transfer for non-senior and retained seniors, as the senior risk weight will be noticeably below the pool risk weight. Assuming that asset managers build their expertise so they are able to analyse credit risk from non-senior tranches, it is likely that in 2025 (the first year of implementation), securitisation activity for this asset class should be relatively strong.
4. ‘Retail – Other’ exposures
Once the SA Output Floor is fully implemented, the underlying RWAs for assets in the ‘Retail – Other’ regulatory category will increase by about 39%, whereas the Non-STC securitisations will stay almost unchanged with an increase of 2%.[44] We expect to see more traditional securitisations and even more SRT transactions with this asset class.
Auto and Consumer securitisations will benefit because the current penalties linked to the non-recognition of FMI (the second component) and the employment of tranche maturity instead of pool maturity will be removed under SEC-SA.
For Non-STC securitisations, the capital multiplier of 2.73x in SEC-IRBA may be compared to a figure of 2.00x for SEC-SA (1.78x and 1.50x respectively for STC).
6 Conclusion
The effect of the introduction of the SA Output floor on the securitisation market will vary considerably across regulatory asset classes. Wholesale loan securitisations (i.e., securitisations of large corporate or SME loans) will be scarcely feasible under the rules as currently proposed. On the other hand, securitisations of consumer loan including residential mortgages, auto loans and other consumer loans, may be boosted.
What are the policy implications of this analysis?
First, the calibration of the four components should be reviewed in relation to pool capital pre-securitisation. This particularly impacts the first, third and fourth components:
• First component: a discount to the formula should be applied when KIRB or KA is used as an input to the formula. This is significant for the wholesale framework in IRB and for both wholesale and retail frameworks in SA. Further details are provided in Risk Control research note published in July 2020.
• Second component: annoying, but not a major issue (note importance for credit cards - which we did not study in this paper).
• Third component: the ‘p’ factor should be recalibrated. This is especially key for the retail framework in IRB and for both wholesale and retail frameworks in SA.
• Fourth component: the fixed senior tranche risk weight floor should be recalibrated so that it becomes an additional risk weight layer, as a proportion of the underlying pool risk weight (e.g., 10% of KIRB or KA) to the added to the formula KSSFA. This would replace the requirement for a senior tranche floor and would remove the need for p senior vs. non-senior as well as stopping regulatory optimisation when determining the senior attachment point.
Such a recalibration would make the decision of whether to securitise or not less about the regulatory treatment (IRB vs. SA Output Floor) and more about risk management and funding.
Second, for an originating bank which has passed the SRT test under IRB, (i.e., passed the operational requirements for the recognition of risk transference as in BIS CRE40.24 and is able to calculate SEC-IRBA on the retained position) then, for the purpose of calculating the risk weights, it should not be required to redetermine the operational requirements for the recognition of risk transference under the SA. Simply, SEC- SA would be substituted for SEC-IRBA.[45]
References
AFME, DSA, EBF, Eurofinas/LeaseEurope, IACPM, Paris Europlace, PCS, TSI (2022) “Securitisation can provide significant support to Europe’s economy in the testing times ahead – targeted measures are needed to unlock its potential,” Joint Letter, November
Bank of England (2020) “Internal Ratings Based UK mortgage risk weights: Managing deficiencies in model risk capture”, Consultative Paper CP14/20, September
Basel Committee on Bank Supervision (2001) “Working Paper on the Treatment of Asset Securitisation,” Bank for International Settlements, October, also known as BCBS WP10
Basel Committee on Bank Supervision (2006) “International Convergence of Capital Measurement and Capital Standards: A Revised Framework, Comprehensive Version,” Bank for International Settlements, June, also known as BCBS 128
Basel Committee on Bank Supervision (2012) “Revisions to the Basel Securitisation Framework,” Consultative Document, Bank for International Settlements, December, also known as BCBS 236
Basel Committee on Bank Supervision (2013) “Revisions to the securitisation framework,” Consultative Document, Bank for International Settlements, December, also known as BCBS 269
Basel Committee on Bank Supervision (2014a) “Capital floors: the design of a framework based on standardised approaches”, Standards, Consultative Document, December, also known as BCBS d351
Basel Committee on Bank Supervision (2014b) “Revisions to the securitisation framework,” Basel III Document, Bank for International Settlements, December, also known as BCBS d374
Basel Committee on Bank Supervision (2016) “Revisions to the securitisation framework - Amended to include the alternative capital treatment for “simple, transparent and comparable” securitisations,” Basel III Document, Bank for International Settlements, July, also known as BCBS Revised d374
Basel Committee for Banking Supervision (2017a) “Basel III: Finalising post-crisis reform,” December, also known as BCBS d424. For a high level summary, refer to BCBS d424_hlsummary
Batchvarov, A. (2022) “Weak EU securitisation will slow down the greening of the EU economy,” Securitisation relaunching in the EU, CMU Implementation, Eurofi Conference, Paris, February
De Nederlandsche Bank (2020), “DNB intends to impose a minimum average risk weight for the calculation of regulatory capital requirements applicable to exposures to natural persons secured by mortgages on residential property located in the Netherlands, based on art 458(2)(d)(vi) of the CRR,” Template for notifying intended measures to be taken under Article 458 of the Capital Requirements Regulation (CRR), EBA, January
De Nederlandsches Bank (2021) “New mortgage loans mainly provided by institutional investors,” November
Duponcheele, Georges, William Perraudin and Daniel Totouom-Tangho (2013a) “A Principles-Based Approach to Regulatory Capital for Securitisations,” BNP Paribas mimeo, April
Duponcheele, Georges, William Perraudin and Daniel Totouom-Tangho (2013b) “The Simplified Arbitrage-Free Approach: Calculating Securitisation Capital based on Risk Weights Alone,” BNP Paribas mimeo, July
Duponcheele, Georges, William Perraudin and Daniel Totouom-Tangho (2013c) “Maturity Effects in Securitisation Capital: Total Capital Levels and Dispersion Across Tranches,” BNP Paribas mimeo, September
Duponcheele, Georges, William Perraudin, Alastair Pickett and Daniel Totouom-Tangho (2013d) “Granularity, Heterogeneity and Securitisation Capital,” BNP Paribas mimeo, September
Duponcheele, Georges, William Perraudin and Daniel Totouom-Tangho (2014a) “Reducing the Reliance of Securitisation Capital on Agency Ratings,” BNP Paribas mimeo, February
Duponcheele, Georges, William Perraudin and Daniel Totouom-Tangho (2014b) “Calibration of the Simplified Supervisory Formula Approach,” BNP Paribas mimeo, March
Duponcheele, Georges, William Perraudin, Alexandre Linden and Daniel Totouom-Tangho (2014c) “Calibration of the CMA and Regulatory Capital for Securitisations,” BNP Paribas mimeo, April
Duponcheele, Georges, William Perraudin and Alexandre Linden (2014d) “How to Revive the European Securitisation Market: a Proposal for a European SSFA,” BNP Paribas mimeo, April
Duponcheele, Georges and William Perraudin (2020) “Reviving Securitisation in Europe by Scaling Inputs to Capital Formulae”, Risk Control, Research note 22-113a, July
European Banking Authority (2014), Guidelines on Significant Credit Risk Transfer relating to Articles 243 and Article 244 of Regulation 575/2013, July
European Banking Authority (2020), “EBA report on Significant Risk Transfer in Securitisation under Articles 244(6) and 245(6) of the Capital Requirements Regulation”, November
Organisation of Economic Cooperation and Development (2022) “Financing SMEs and Entrepreneurs 2022: An OECD Scoreboard,” March
Standard and Poor’s (2022) “European RMBS Outlook 2022, Performance And Issuance At A Crossroads,” January
Data sources for IRB Pillar 3 Disclosure Reports Used in this Report
Banks based in Belgium
• Belfius, Quantitative disclosure as appendix to risk report 2021 (31 December 2021)
• KBC Group, 2021 Risk Report (31 December 2021)
Banks based in France
• BNP Paribas, Universal Registration Document and Annual Financial Report 2021 (31 December 2021)
• Crédit Agricole S.A., 2021 Annual Financial Report, Universal Registration Document (31 December 2021)
• Groupe BPCE, Risk Report 2021 – Pillar III (31 December 2021)
• PSA Banque France, 2020 Annual Report as at 31 December 2020
• RCI Bank and Services, 2021 Annual Report as at 31 December 2021
• Société Générale, Risk Report 2022, Pillar 3 2021 (31 December 2021)
Banks based in Germany
• Deutsche Bank, Pillar 3 Report 2021 (31 December 2021)
Banks based in Italy
• Gruppo Banco BPM, Disclosure to the Public by Entities Pillar 3, Data as at 31 December 2021
• Intesa Sanpaolo, Basel 3 Pillar 3, Disclosure as at 31 December 2021
• Monte dei Pashi di Sienna, Informativa al Pubblico, Aggiornamento al 31 Dicembre 2021
• Unicredit Group Disclosure (Pillar 3) as at 31 December 2021
Banks based in the Netherlands
• ABN AMRO Bank N.V., Pillar 3 Report 2021 (31 December 2021)
• ING Group, Additional Pillar III Report 2021 (31 December 2021)
• Rabobank, Pillar 3 Year Report 2021 (31 December 2021)
Banks based in Switzerland
• Credit Suisse Group AG, Pillar 3 and regulatory disclosures 4Q21 (31 December 2021)
• UBS, 31 December 2021 Pillar 3 Report
Banks based in Spain
• Banco Sabadell Group, Pilar III Disclosures 2021 (31 December 2021)
• BBVA, Prudential Relevance Report, Pillar 3, 2021 (31 December 2021)
• CaixaBank, Pillar 3 Disclosures (31 December 2021)
• Santander, Pillar 3 - Disclosure Report, 2021 (31 December 2021)
Banks based in the UK
• Barclays PLC, Pillar 3 Report 2021 (31 December 2021)
• HSBC Holdings plc, Pillar 3 Disclosures (31 December 2021)
• Lloyds Bank Plc, 2021 Year-End Pillar 3 Disclosures (31 December 2021)
• Nationwide Building Society, Pillar 3 Disclosure 2021 (4 Avril 2021)
• Natwest Group Plc, Pillar 3 Report 2021 (31 December 2021)
• Santander UK Group Holdings plc and Santander UK plc, December 2021 Additional Capital and Risk Management Disclosures (31 December 2021)
7 Appendix on Evolution of the European Securitisation Market
7.1 Economic Importance of the European Securitisation Market
This subsection describes the current European securitisation market as far as public issuance is concerned[46]and how it has evolved over time. Subsequent subsections will explain the parallel evolution of alternative financing sources including non-bank financing and covered bonds (CBs).
Table 7.1 shows the breakdown of Principal Outstanding (PO) of the European securitisation market by Country of Collateral.[47] In 2021, the European Total PO was €972.4 billion and the EU27 Total was €748.7 billion. The main European markets are, by decreasing PO values: (1st) UK (€240 bn), (2nd) Italy (€148 bn), (3rd) Spain (€147 bn), (4th) Netherlands (€144 bn), (5th) France (€121 bn), (6th) Germany (€65 bn), (7th) Belgium (€49 bn),
(8th) Ireland (€38 bn), (9th) Portugal (€18 bn), (10th) Greece (€10 bn) and (11th) Switzerland (€4 bn). The remaining European countries collectively contributed less than €7 bn PO. A very small PO is Pan Europe (€6 bn) in that it cannot be allocated to a specific country.
In 2021, the European Total PO (including the UK) equals just 63.6% of its 2012 level. For the EU27, the percentage is just 70.7% of the 2012 level. In 2021, all the main countries, bar one, exhibit lower volumes compared to 2012 levels: Belgium (55%), Germany (76%), Greece (30%), Ireland (60%), Italy (70%), Portugal (41%), Spain (71%) and the UK (48%).[48] The one exception is France for which very strong growth is apparent, the 2021 level being 274% of the 2012 level. Note here that France started with a very low base equal to less than half that of Belgium in 2012 and that French banks were not concerned by funding diversification until they experienced the funding crisis of 2012.[49]
Figure 7.1 reveals that since 2012 PO has decreased each year. New European issuances have been insufficient to compensate for the amortisation of outstanding issues. The data suggests that the European market is in progressive decline. Faced with this fact, buy-side institutions (banks, insurance companies, pension funds, asset managers) are unlikely to allocate new personnel resources or capital to this financial instrument without fundamental changes in the market or regulatory environments.
Table 7.2 presents securitisation PO per country of collateral as a percentage of GDP. This way of viewing the data reveals the economic significance of the asset class for each country. In this case, the country ranking changes materially. In 2021, the ranking is as follow: (1st) the Netherlands (16.8%), (2nd) Spain (12.2%), (3rd) Belgium (9.7%), (4th) UK (8.9%), (5th) Portugal (8.3%), (6th) Italy (8.3%), (7th) Ireland (7.8%), (8th) Greece (5.6%), (9th) France (4.9%), (10th) Germany (1.8%), (11th) Switzerland (0.6%), (12th) Other Europe (0.2%). For the European Union, the EU27 securitisation market represent 6.1% of GDP, and for the Europe region, the European securitisation represents 5.6% of GDP.
Table 7.2 employs colour highlighting in order to provide a heatmap. This reveals several interesting points. First, the variation across countries is considerable and may be unexpected for the non-specialist.
1. The German securitisation market is small compared to that country’s economy, whereas the market in the Netherlands is economically very significant.
2. While Southern European countries (Portugal, Spain, Italy, Greece[50]) relied heavily on securitisation in 2012 to fund their economies, they do so far less today.
3. Overall, heatmap of GDP-scaled PO suggests that economic importance is reducing more quickly than the PO data might indicate. The 2021 European Total PO is 63.6% of its 2012 level whereas the GDPscaled PO in 2021 is less than half, at 48.2%, of its 2012 level. In 2021, the EU 27 Total PO is 70.7% of its 2012 level but the GDP-scaled equivalent is only 56.4% of the 2012 level.
4. The biggest decline is evident for the Netherlands. While securitised collateral in the Netherlands was 44.4% of GDP in 2012, in 2021 it represents only 16.8% of GDP. In the space of 9 years, the equivalent of 27.6% of Netherlands GDP had to find alternative financing.
The above data reveals a general contraction in the market. If we restrict attention to the transactions that are truly subject to capital regulation, i.e., those that are distributed to investors rather than being retained to provide collateral to facilitate access to central banks funding[51], the picture is even bleaker. Table 7.3 and Figure 7.2 show securitisation transactions placed in the market and those retained on the balance sheet.[52]
Prior to 2007, the European securitisation market was functioning on a private basis only, i.e., securitisations that were created were placed with investors. The practise of retaining securitisations on bank balance sheets was developed suddenly in 2007 following the onset of the financial crisis.[53] In 2008 and 2009, the large majority of transactions were retained due to market conditions. Thereafter, especially after 2012, most retained transactions were preserved by design to provide collateral against cheap funding from the Bank of England and the European Central Bank. The capital regulation of the securitisation framework does not apply to those transactions. It applies only to those transactions that are deconsolidated, i.e., issued and placed. This represents less than half of all issuances of the last decade.
To summarise, the true European securitisation market (i.e., the one that is placed with private investors and transacted between private counterparties) that is directly influenced by the capital rules (banks or insurances) that apply to securitisation, has, in the space of less than 10 years, lost three quarters of its economic importance.
One may ask whether this dramatic decline is of economic significance for Europe and who are the losers and beneficiaries? To answer the question, one must examine the asset classes that are securitised and the breakdown by country.
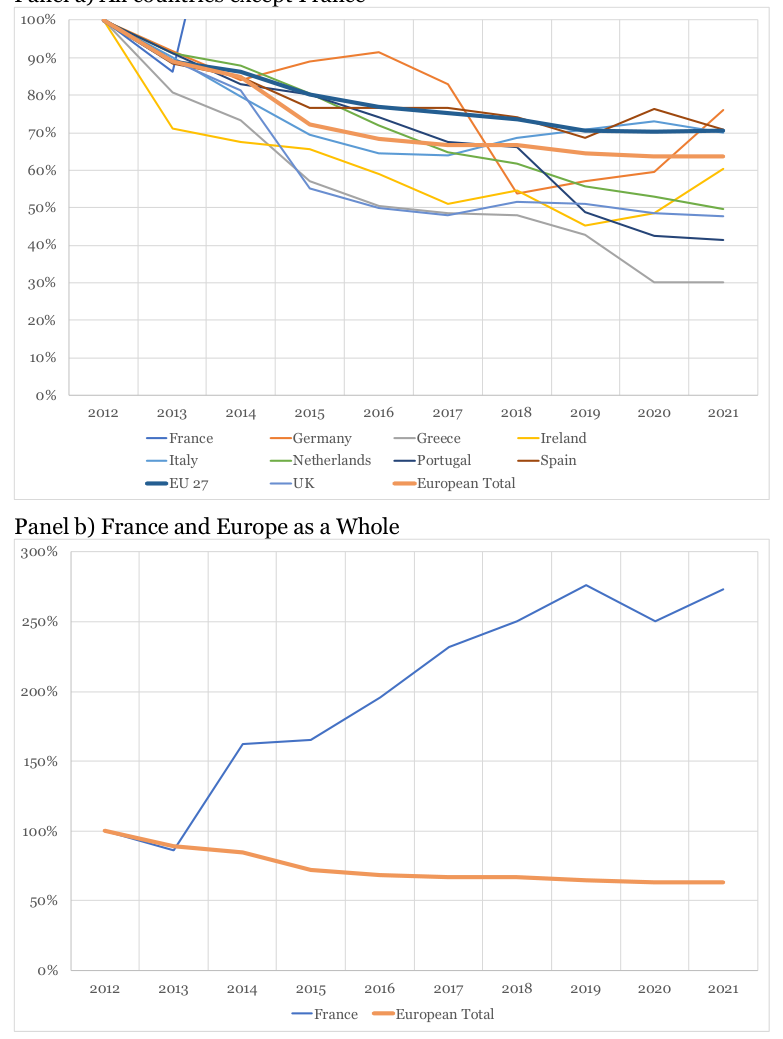
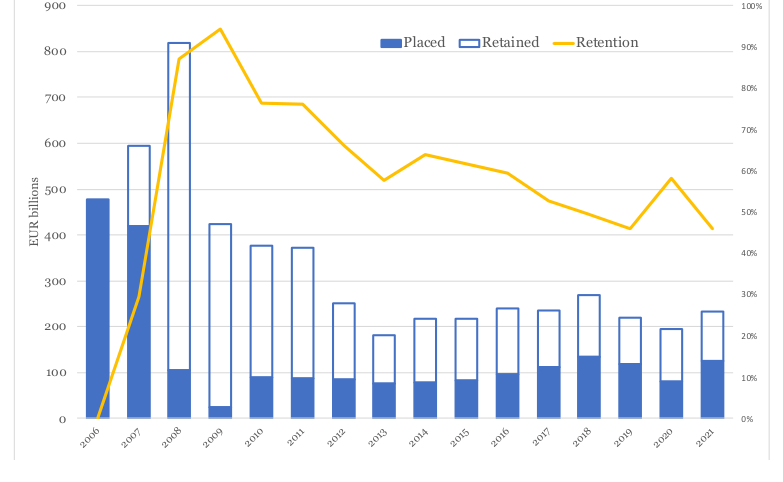
| € Billions | 2012 | 2013 | 2014 | 2015 | 2016 | 2017 | 2018 | 2019 | 2020 | 2021 |
|---|---|---|---|---|---|---|---|---|---|---|
| Belgium | 90.1 | 81.4 | 74.5 | 54.9 | 53.1 | 55.0 | 56.8 | 52.5 | 51.3 | 49.3 |
| France | 44.3 | 38.2 | 72.0 | 73.1 | 86.6 | 102.6 | 111.0 | 122.3 | 111.1 | 121.2 |
| Germany | 85.9 | 78.9 | 72.1 | 76.5 | 78.5 | 71.1 | 46.1 | 49.1 | 51.1 | 65.3 |
| Greece | 34.2 | 27.6 | 25.1 | 19.5 | 17.3 | 16.6 | 16.4 | 14.6 | 10.3 | 10.3 |
| Ireland | 54.2 | 38.5 | 36.6 | 35.6 | 32.0 | 27.6 | 29.6 | 24.6 | 26.3 | 32.7 |
| Italy | 211.4 | 190.6 | 168.5 | 146.6 | 136.4 | 135.4 | 144.9 | 149.9 | 154.3 | 147.8 |
| Netherlands | 289.7 | 264.0 | 254.8 | 233.1 | 208.3 | 187.5 | 179.0 | 161.0 | 153.6 | 144.2 |
| Portugal | 42.5 | 38.7 | 35.2 | 34.1 | 31.5 | 28.7 | 28.1 | 20.8 | 18.1 | 17.6 |
| Spain | 207.5 | 183.7 | 176.3 | 159.2 | 159.2 | 159.1 | 154.0 | 142.3 | 158.4 | 147.1 |
| Other Europe | n.a. | n.a. | n.a. | 7.2 | 6.1 | 6.3 | 7.2 | 6.8 | 5.8 | 6.9 |
| Pan Europe | n.a. | n.a. | n.a. | 8.6 | 7.3 | 6.1 | 5.3 | 4.8 | 4.9 | 6.3 |
| EU 27 Total | 1,059.8 | 941.6 | 915.1 | 848.4 | 816.2 | 796.1 | 778.4 | 748.8 | 745.1 | 748.7 |
| Switzerland | n.a. | n.a. | n.a. | 1.4 | 1.8 | 2.6 | 3.6 | 3.8 | 4.7 | 4.3 |
| UK | 501.5 | 447.3 | 408.3 | 276.8 | 250.5 | 241.0 | 258.4 | 256.0 | 243.0 | 239.8 |
| European Total | 1,561.3 | 1,388.9 | 1,323.4 | 1,126.6 | 1,068.5 | 1,039.7 | 1,040.3 | 1,008.6 | 992.8 | 992.9 |
Source: AFME Securitisation Data Reports from 2009 to 2021
| % of GDP | 2012 | 2013 | 2014 | 2015 | 2016 | 2017 | 2018 | 2019 | 2020 | 2021 |
|---|---|---|---|---|---|---|---|---|---|---|
| Belgium | 23.3% | 20.7% | 18.5% | 13.2% | 12.3% | 12.4% | 12.3% | 11.0% | 11.2% | 9.7% |
| France | 2.1% | 1.8% | 3.3% | 3.3% | 3.9% | 4.5% | 4.7% | 5.0% | 4.8% | 4.9% |
| Germany | 3.1% | 2.8% | 2.5% | 2.5% | 2.5% | 2.2% | 1.4% | 1.4% | 1.5% | 1.8% |
| Greece | 18.2% | 15.3% | 14.2% | 11.1% | 9.9% | 9.4% | 9.1% | 8.0% | 6.2% | 5.6% |
| Ireland | 30.9% | 21.5% | 18.8% | 13.5% | 11.8% | 9.3% | 9.1% | 6.9% | 7.1% | 7.8% |
| Italy | 13.0% | 11.8% | 10.4% | 8.9% | 8.0% | 7.8% | 8.2% | 8.3% | 9.3% | 8.3% |
| Netherlands | 44.4% | 40.0% | 37.9% | 33.8% | 29.4% | 25.4% | 23.1% | 19.8% | 19.2% | 16.8% |
| Portugal | 25.3% | 22.7% | 20.3% | 19.0% | 16.9% | 14.7% | 13.7% | 9.7% | 9.0% | 8.3% |
| Spain | 20.1% | 18.0% | 17.1% | 14.8% | 14.3% | 13.7% | 12.8% | 11.4% | 14.1% | 12.2% |
| Other Europe | 0.0% | 0.0% | 0.0% | 0.3% | 0.2% | 0.2% | 0.3% | 0.2% | 0.2% | 0.2% |
| Pan Europe (*) | 0.0% | 0.0% | 0.0% | 0.1% | 0.0% | 0.0% | 0.0% | 0.0% | 0.0% | 0.0% |
| EU 27 Total | 10.8% | 9.5% | 9.0% | 8.1% | 7.5% | 7.1% | 6.7% | 6.2% | 6.5% | 6.1% |
| Switzerland | 0.0% | 0.0% | 0.0% | 0.2% | 0.3% | 0.4% | 0.6% | 0.6% | 0.7% | 0.6% |
| UK | 23.8% | 21.3% | 17.7% | 10.5% | 10.3% | 10.2% | 10.7% | 10.1% | 10.1% | 8.9% |
| European Total | 11.6% | 10.2% | 9.4% | 7.6% | 7.1% | 6.7% | 6.5% | 6.1% | 6.0% | 5.6% |
Source: AFME, Eurostat, Risk Control (*) Use of EU28 GDP for the Pan Europe ratio)
| Placed Billions | Retained | Retention Total | ||
|---|---|---|---|---|
| 2006 | 478 | 0 | 0% | 478 |
| 2007 | 419 | 175 | 29% | 594 |
| 2008 | 105 | 713 | 87% | 819 |
| 2009 | 24 | 399 | 94% | 424 |
| 2010 | 89 | 288 | 76% | 377 |
| 2011 | 88 | 284 | 76% | 372 |
| 2012 | 85 | 166 | 66% | 251 |
| 2013 | 76 | 105 | 58% | 181 |
| 2014 | 78 | 139 | 64% | 217 |
| 2015 | 83 | 134 | 62% | 217 |
| 2016 | 97 | 142 | 59% | 240 |
| 2017 | 112 | 124 | 53% | 236 |
| 2018 | 136 | 133 | 50% | 269 |
| 2019 | 119 | 102 | 46% | 221 |
| 2020 | 81 | 113 | 58% | 195 |
| 2021 | 126 | 107 | 46% | 233 |
Source: AFME
7.2 Asset Class Relevance for the European Securitisation Market
The data presented in the last section showed that the economic importance of securitisation varies considerably across European countries. This heterogeneity is even greater when the figures are broken down by collateral type. Retail asset classes that are securitised include residential mortgages, loans to Small and
Medium Enterprises (SME), consumer loans, auto loans and leases, and credit card borrowings. Non-retail asset classes include leases (usually for equipment) and commercial mortgages.
Table 7.4 shows the 2021 PO in EUR billions from Table 7.1 broken down by collateral type and country. Table 7.5 shows the same data as a percentage of the total.
As already noted, the long-term trend has been that of a contraction of the European Securitisation Market. The PO at the end of 2021 equals close to EUR 1 trillion. It would be even higher if European corporate CLOs were included. The large majority (59.3%) of the securitisations outstanding in Europe are backed by residential mortgages (€589 bn). This is followed by the three categories SME ABS (€94 bn, 9.5%), Auto ABS (€92 bn, 9.2%), and Consumer ABS (€83 bn, 8.4%). Smaller collateral types include CMBS (€35 bn, 3.5%), Credit card ABS (€25 bn, 2.5%), and Leases ABS (€17 bn, 1.7%). Data for all the other collateral types are grouped under the category ‘Other’ ABS (€53 bn, 5.4%).
1. RMBS represents the large majority of securitisation activity for the UK (€140 bn, 58%), the Netherlands (€132 bn, 92%), Spain (€109 bn, 74%), France (€86 bn, 71%), Ireland (€29 bn, 88%), and Portugal (€11 bn, 65%).
2. Auto ABS plays a similar leading role in German securitisations (€38 bn, 59%) and for the small markets of Other Europe (€5 bn, 70%), and Switzerland (€3 bn, 74%).
3. Italy is the only country in Europe with a well-diversified securitisation market diversified across collateral type with RMBS (€43 bn, 29%), Consumer ABS (€39 bn, 26%), SME ABS (€30 bn, 20%), with sizeable leadership in Leases ABS (€12 bn, 8%) and Auto ABS (€11 bn, 8%).
4. In Belgium, SME ABS is key (€25 bn, 51%) and almost as important as RMBS (€23 bn, 47%).
5. The UK is the second most diversified country after Italy. For the UK, after the RMBS sector (€140 bn, 58%), the most active asset classes are the three categories CMBS (€27 bn, 11%), Credit card ABS (€21 bn, 9%), and Auto ABS (€17 bn, 7%).
6. Greece, a country which has seen its Securitisation market largely deteriorate since the Euro crisis, still has an active collateral type: SME ABS (€4 bn, 39%). The ‘Other ABS’ is mainly driven in this case by Non-Performing Loans (NPLs) (€4 bn, 40%). The collateral-type breakdown within countries suggests that, within Europe, Italy and the UK are the two countries that would benefit the most, across various economic sectors, from a well-designed securitisation framework.
Other countries that have greater concentration in particular asset classes could devise support for those sectors to offset distortions introduced by securitisation capital regulation. The preferential treatment of Covered Bonds (a financial instrument that competes with securitisation in collateral usage) favours ‘Other Europe’ (in particular Nordic countries) where the RMBS market is almost absent. This occurs to the detriment of Southern European countries such as Spain, Portugal, Italy.
Another way to assess which countries are most affected by a decline in securitisation is displayed in Table 7.6. For the main asset classes, the countries would be: for RMBS, the UK, the Netherlands, Spain and France; for SME ABSs, Italy, Belgium and Spain; for Auto ABS, Germany, the UK and Italy; for Consumer ABS, Italy and France. Those key countries represent for the RMBS (€467 bn or 79% of the European Total RMBS), SME ABS (€70 bn, 74% of the asset class), Auto ABS (€67 bn, 73% of the asset class), Consumer ABS (€60 bn, 72% of the asset class). For secondary asset classes, the countries are almost idiosyncratic: for CMBS, the UK; for Credit cards: the UK; for Leases ABS: Italy; for NPLs: Greece.
These represent together 2/3 of the European Securitisation Market (€663 bn, 66.8% of the European Total PO) and 3.7% of European GDP.
At a narrower EU 27 Level (i.e., without the UK),
• the Dutch, Spanish and French RMBS,
• the Italian, Belgian and Spanish SME ABS,
• the German and Italian Auto ABS, and
• the Italian and French Consumer ABS.
These together represent €506 bn which is 67.6% of the EU 27 Total PO and 3.5% of GDP.
By focusing on those key combinations of asset classes and countries, one can assess the impact on the economy of future securitisation regulation, in particular the impact of the Basel SA Output Floor.
| € Billions | RMBS | SME | Auto | Consumer CMBS | Cards | Leases | Other | Total | |
|---|---|---|---|---|---|---|---|---|---|
| Belgium | 23.2 | 25.1 | 0.7 | 0.3 | 0.0 | 0.0 | 0.0 | 0.0 | 49.3 |
| France | 86.2 | 6.0 | 5.8 | 21.0 | 0.4 | 1.4 | 0.5 | 0.0 | 121.2 |
| Germany | 11.8 | 3.4 | 38.2 | 6.0 | 2.1 | 0.0 | 2.3 | 1.6 | 65.3 |
| Greece | 0.3 | 4.0 | 0.3 | 0.5 | 0.0 | 0.6 | 0.5 | 4.2 | 10.3 |
| Ireland | 28.8 | 0.0 | 0.2 | 0.0 | 0.1 | 0.0 | 0.0 | 3.5 | 32.7 |
| Italy | 42.9 | 30.0 | 11.4 | 38.8 | 1.2 | 0.0 | 11.5 | 12.1 | 147.8 |
| Netherlands | 132.2 | 8.7 | 1.6 | 0.7 | 1.0 | 0.0 | 0.0 | 0.0 | 144.2 |
| Portugal | 11.5 | 2.0 | 2.8 | 0.3 | 0.0 | 0.5 | 0.0 | 0.5 | 17.6 |
| Spain | 108.9 | 14.5 | 8.7 | 10.5 | 0.1 | 1.2 | 2.0 | 1.2 | 147.1 |
| Other Europe | 0.3 | 0.0 | 4.8 | 0.1 | 0.7 | 0.0 | 0.0 | 1.0 | 6.9 |
| Pan Europe | 3.2 | 0.1 | 0.0 | 0.0 | 3.0 | 0.0 | 0.0 | 0.0 | 6.3 |
| EU 27 Total | 449.1 | 93.8 | 74.5 | 78.1 | 8.7 | 3.7 | 16.7 | 24.1 | 748.7 |
| Switzerland | 0.0 | 0.0 | 3.2 | 0.0 | 0.0 | 1.1 | 0.0 | 0.0 | 4.3 |
| UK | 139.8 | 0.4 | 17.0 | 5.1 | 26.5 | 21.4 | 0.3 | 29.3 | 239.8 |
| European Total | 588.9 | 94.2 | 91.5 | 83.2 | 35.2 | 25.1 | 17.0 | 53.4 | 992.9 |
Source: AFME, JP Morgan
| Table 7.5: Collateral | Type as | within a | Country | ||||||
|---|---|---|---|---|---|---|---|---|---|
| € Billions | RMBS | SME | Auto | Consumer | CMBS | Cards Leases | Other | Total | |
| Belgium | 47.1% | 50.9% | 1.4% | 0.6% | 0.1% | 0.0% | 0.0% | 0.0% | 100.0% |
| France | 71.1% | 5.0% | 4.8% | 17.3% | 0.3% | 1.1% | 0.4% | 0.0% | 100.0% |
| Germany | 18.0% | 5.2% | 58.5% | 9.1% | 3.2% | 0.0% | 3.5% | 2.5% | 100.0% |
| Greece | 2.8% | 38.6% | 2.8% | 5.0% | 0.0% | 5.9% | 4.6% | 40.4% | 100.0% |
| Ireland | 88.1% | 0.0% | 0.7% | 0.0% | 0.4% | 0.0% | 0.0% | 10.8% | 100.0% |
| Italy | 29.0% | 20.3% | 7.7% | 26.2% | 0.8% | 0.0% | 7.8% | 8.2% | 100.0% |
| Netherlands | 91.7% | 6.0% | 1.1% | 0.5% | 0.7% | 0.0% | 0.0% | 0.0% | 100.0% |
| Portugal | 65.2% | 11.6% | 15.7% | 1.5% | 0.0% | 3.0% | 0.0% | 3.1% | 100.0% |
| Spain | 74.0% | 9.9% | 5.9% | 7.2% | 0.1% | 0.8% | 1.3% | 0.8% | 100.0% |
| Other Europe | 4.5% | 0.0% | 70.0% | 0.9% | 9.8% | 0.0% | 0.5% | 14.2% | 100.0% |
| Pan Europe | 51.2% | 1.2% | 0.0% | 0.0% | 47.6% | 0.0% | 0.0% | 0.0% | 100.0% |
| EU 27 Total | 60.0% | 12.5% | 9.9% | 10.4% | 1.2% | 0.5% | 2.2% | 3.2% | 100.0% |
| Switzerland | 0.0% | 0.0% | 74.1% | 0.0% | 0.0% | 25.9% | 0.0% | 0.0% | 100.0% |
| UK | 58.3% | 0.2% | 7.1% | 2.1% | 11.1% | 8.9% | 0.1% | 12.2% | 100.0% |
| European Total | 59.3% | 9.5% | 9.2% | 8.4% | 3.5% | 2.5% | 1.7% | 5.4% | 100.0% |
| Lessons one may draw | from Table | 7.5 include | the | following: | |||||
| 1. RMBS represents | the large | majority | of | securitisation | activity for the | UK (€140 | bn, 58%), | the |
| Table | 7.6: | Principal | Outstanding | by | Country | and Type of | Collateral | ||||
|---|---|---|---|---|---|---|---|---|---|---|---|
| € Billions | RMBS | SME | Auto | Consumer | CMBS | Cards | Leases | Other | Total | ||
| Belgium | 3.9% | 26.7% | 0.7% | 0.4% | 0.1% | 0.0% | 0.0% | 0.0% | 5.0% | ||
| France | 14.6% | 6.4% | 6.3% | 25.2% | 1.0% | 5.5% | 2.9% | 0.0% | 12.2% | ||
| Germany | 2.0% | 3.6% | 41.8% | 7.2% | 6.0% | 0.0% | 13.2% | 3.0% | 6.6% | ||
| Greece | 0.0% | 4.2% | 0.3% | 0.6% | 0.0% | 2.4% | 2.8% | 7.8% | 1.0% | ||
| Ireland | 4.9% | 0.0% | 0.3% | 0.0% | 0.4% | 0.0% | 0.0% | 6.6% | 3.3% | ||
| Italy | 7.3% | 31.9% | 12.4% | 46.6% | 3.5% | 0.0% | 67.4% | 22.6% | 14.9% | ||
| Netherlands | 22.4% | 9.2% | 1.8% | 0.9% | 2.8% | 0.0% | 0.0% | 0.0% | 14.5% | ||
| Portugal | 1.9% | 2.2% | 3.0% | 0.3% | 0.0% | 2.1% | 0.0% | 1.0% | 1.8% | ||
| Spain | 18.5% | 15.4% | 9.5% | 12.7% | 0.4% | 4.8% | 11.6% | 2.3% | 14.8% | ||
| Other | Europe | 0.1% | 0.0% | 5.3% | 0.1% | 1.9% | 0.0% | 0.2% | 1.8% | 0.7% | |
| Pan Europe | 0.5% | 0.1% | 0.0% | 0.0% | 8.5% | 0.0% | 0.0% | 0.0% | 0.6% | ||
| EU 27 | Total | 76.3% | 99.5% | 81.4% | 93.8% | 24.7% | 14.8% | 98.2% | 45.2% | 75.4% | |
| Switzerland | 0.0% | 0.0% | 3.5% | 0.0% | 0.0% | 4.4% | 0.0% | 0.0% | 0.4% | ||
| UK | 23.7% | 0.5% | 18.6% | 6.2% | 75.3% | 85.2% | 1.8% | 54.8% | 24.2% | ||
| European | Total | 100.0% | 100.0% | 100.0% | 100.0% | 100.0% | 100.0% | 100.0% | 100.0% | 100.0% | |
| At a | European | Level, | the main | asset | classes/countries | combinations | are: | ||||
| • | the | British, | Dutch, Spanish | and | French | RMBS, | |||||
| • | the | Italian, | Belgian and | Spanish SME | ABS, | ||||||
| • | the | German, | British and | Italian Auto | ABS, | and | |||||
| • | the | Italian | and French | Consumer | ABS. |
7.3 Rise of the Non-Banks
The European RMBS landscape has changed fundamentally in the last decade. At the beginning of 2012, almost all European RMBS securitisation was secured against prime residential mortgages originated by regulated banks. Since 2016, Non-Prime RMBS originated by non-banks have started to dominate the market (see Figure 7.3). The main reason is that prime residential mortgage assets have been used by banks as collateral for covered bonds which receive better capital and liquidity treatments than securitisations.[54]
Duponcheele et al. (2014d) explains that the risk weights of securitisation tranches, in particular for the most senior tranche was misaligned with the underlying risk weights and that this misalignment has been an obstacle to the revival of securitisation in Europe. For a prime portfolio of mortgages, the RW can be as low as 5%-15%. This is equal (and sometimes lower) than the RW of the most senior securitisation tranche backed by the same pool (typically 15% in SEC-IRBA and 10% when there is an STC label). This incentivises banks to limit securitisation to riskier mortgage portfolios.
Non-banks, the very large majority of which specialise in non-prime portfolios, are unable to issues Covered Bonds or to access direct funding from central banks. They, therefore, continue to access the capital markets through securitisations. The extra yield generated by non-prime collateral compared to prime collateral[55] can be used to distribute higher spreads on non-prime RMBS senior tranches and compensates for the increase in capital costs by investors subject to capital regulation.
The disconnect in regulatory treatment between securitisation exposures and underlying assets means that banks are generally retreating from the market. Consequently, their space is increasingly occupied by nonbanks. It is obvious from Figure 7.3 that Basel regulation, with its strong bias against securitisation, has removed from the placed investor-based market less risky bank assets. The market has become primarily a nonbank market with 80% of new European RMBS issuances emanating from non-banks.
At the forefront of this development has been the UK. The UK residential market now contributes the lion’s share of new European RMBS issuances. According to S&P (2022), this amounted to about €23 billion or 60% of all European RMBS issuances in recent data.
The Netherlands market has recently evolved. While the PO of Dutch RMBS has dropped since 2012, the volume of residential mortgage loans has grown substantially to €775 billion according to the European Mortgage Federation. As shown by Figure 7.4 Panel a), there was a lull in Dutch outstanding mortgage loans in 2013 and in their growth every year thereafter. At that time the banks’ share was 90.8%, the insurers’ share was 7.4% and the pension funds’ was 2%. By mid-2021, the banks’ share dropped to 79.4%, while the insurers’ share increased to 10.1% and the pension funds to 6.6%, to which one can add investment funds at 4%.
The rise of the insurers’ share is unsurprising as recent European regulation has produced the absurd situation in which, for insurers, holding mortgage loans directly demands less regulatory capital than holding a senior position in the same securitised pool of mortgages, position which is far less risky and more liquid that the mortgage loans themselves. The rise of pension funds and investment funds is driven by yield considerations as Dutch mortgage loans are not directly purchased by the European Central Bank and the underlying assets have not been the subject of the same spread compression as corporate bonds. Nevertheless, since 2016 the growth in the mortgage market in the Netherlands has been almost exclusively due to non-banks. This is apparent from Figure 7.4 Panel b). This non-bank growth will tend to displace banks from the securitisation market.
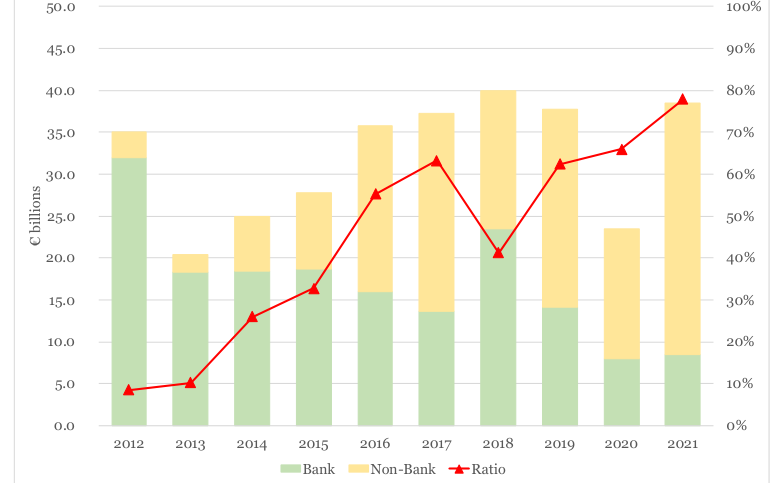
Note: The source is Standard & Poor’s (2022).
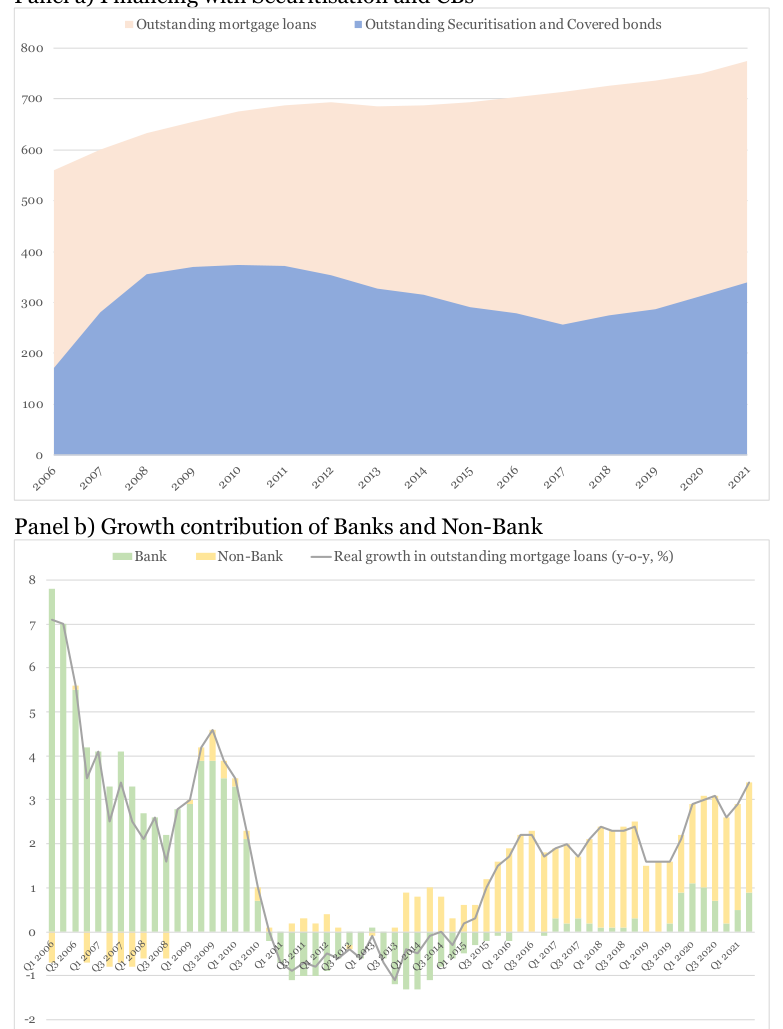
Note: The source is DNB (2021).
7.4 Growth in Covered Bonds
Table 7.1 shows that the securitisation PO has contracted in the Netherlands[56]. Table 7.5 shows that more than 90% of the current Netherlands PO is backed by residential mortgages. According to De Nederlandsche Bank, at 31st December 2021, the volume of Dutch securitisations outstanding was €168 billion, which, for the first time (as shown in Figure 7.5), was lower than the value of covered bonds issued by banks (€172 billion).[57]
Since 2017, growth in the mortgage loans outstanding (see Figure 7.4 Panel a)) has been heavily linked to growth in covered bonds, a securitisation PO has been slightly declining. Almost all the growth since 2016 has come from non-banks. It appears that RMBS securitisations issued by regulated banks in the Netherlands is declining in favour of covered bond issuance.[58]
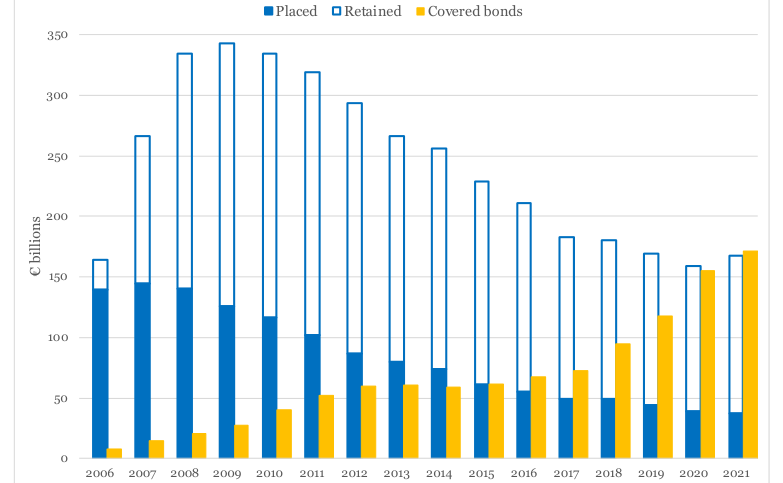
Source: DNB (March 2022)
7.5 Asset growth and Securitisation growth are delinked
Figure 7.6 shows that outstanding mortgage loans in Europe have steadily increased. Examining individual countries, one may note that France has experienced strong growth, the Netherlands moderate growth and Spain has experienced a contraction. At the end of 2020, according to the European Mortgage Federation, the EU 27 average growth since 2009 is 32%. One may compare this percentage increase to the following countryspecific growth rates:
• France: increased from €731 bn to €1,137 bn, an increase of 56%.
• Netherlands: increased €648 bn to €775 billion, an increase of 15%.
• Spain: decreased from €612 bn to €482 bn, i.e., a decrease of 21%.
Figure 7.1 shows that the securitisation market in France (which was almost inexistent in 2009) has increased strongly. The market in the Netherlands has strongly decreased, as has the market in Spain. These changes in outstanding mortgage loans illustrate the fact that asset growth and securitisation growth are now delinked.
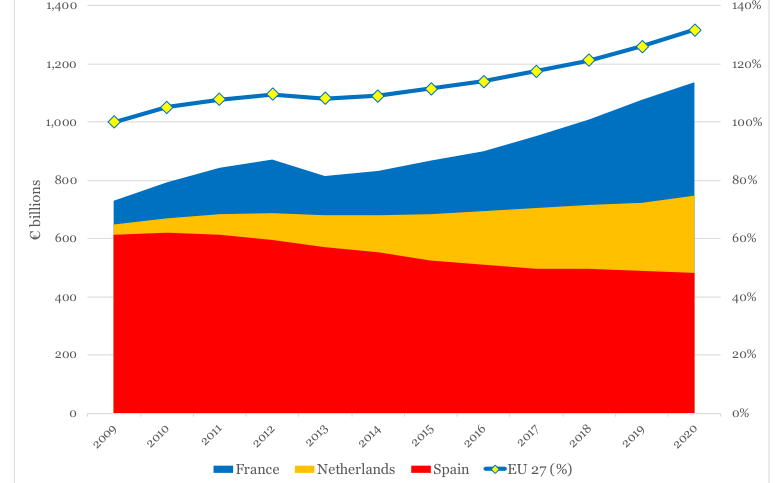
Source: European Mortgage Federation (2021)
8 Appendix on Regulatory Capital Formulae
8.1 IRB Approach
8.1.1 Advanced-IRB Approach for the underlying loans
The idea in IRB is to determine the marginal value at risk (MVaR) of an asset when a bank is under systemic stress. We can thus decompose the regulatory formula into its basic concepts for a credit asset on a bank’s balance sheet: Stressed Loss= Stressed Probability of Default× Stressed Loss Given Default
The Loss Given Default (LGD) in the formula is not the Point-In-Time LGD (LGDQ"R), familiar to investors, but a Through-The-Cycle LGD (LGDRRS) that is calculated with LGD models, and subject to regulatory reviews.
Stressed Loss Given Default= LGDRRS = LGD
For those IRB institutions that do not have an approved LGD model for this asset, the regulation stipulates predetermined regulatory LGD values. This is the Foundation IRB approach, a status that was envisaged to be temporary as a transitory stage between the Standardised approach and a full Advanced IRB approach (the latter using LGD models).
The Stressed PD formula is derived from the use of the 2002 Asymptotic Single Risk Factor (ASRF) credit model. NVW(PD) −[ρ× NVW(0.1%) Stressed Probability of Default= NU _ [1 −ρ
The variable PD is the one-year default probability of the underlying asset. The function N(x) denotes the cumulative distribution function for a standard normal random variable (i.e., the probability that a normal random variable with mean zero and variance of one is less than or equal to x). The function NVW(z) denotes the inverse cumulative distribution function for a standard normal random variable (i.e., the value of x such that N(x) = z). The parameter ρ is the asset correlation (not to be confused with default correlation), as calibrated in the early 2000s by the Basel Committee on Banking Supervision (BCBS), and presented in Table 8.1. This calibration has not been revisited and is still the one that applies under the Basel III finalised standards. Explicit in this formula of the stressed probability of default is the systemic shock on a one-year horizon with a probability of 0.1%.[59]
The basic stressed loss formula has been the subject of several adjustments from when it was first calibrated in 2002:
• First Adjustment for the asset correlation: The SME adjustment to the wholesale asset correlation is known in the industry as the ‘German compromise’ This is because it was a late modification which was added to balance the strong objections of the then German government against a framework seen as not considering the nature of the assets being financed by German banks, i.e., SMEs and Middlestand. It reduces the capital requirement for those assets by assuming a stronger decorrelation in a systemic shock.
• Second Adjustment for the recognition of Future Margin Income, up to the one-year Expected Loss: The reason that this recognition was granted was that regulators made the sound assumption that banks would earn future margin income (FMI) to offset the one-year expected loss. The underlying assumption is that banks are ‘rational’ when deciding on the spread/margin on the loan and would always ensure that this margin is above the expected loss. This is a very conservative assumption, as the spread on an asset covers, in addition to the long-term expected loss, the bank’s operating costs, liquidity and funding costs and return on capital.
Basic Capital Formula= Stressed PD× LGDRRS −OneYear Future Margin Icome capped at OneYear EL
NVW(PD) −[ρ× NVW(0.1%) Basic Capital Formula= NU _ × LGD−PD× LGD [1 −ρ
• Third Adjustment for the maturity for the wholesale framework: For the wholesale framework, the basic capital formula is adjusted for maturity.
Wℎolesale Capital Formula K= Basic Capital Formula × Full Maturity Adjustment
Given the effective maturity of the asset M (expressed in years), the full maturity adjustment is given by:
(1 + (M−2.5) × b) Full Maturity Adjustment= (1 −1.5 × b) b= …0.11852 −0.05478 × ln (PD)Š‹
It is interesting to note that the central point of this calibration is when the effective maturity M is equal to 2.5 years. The Pillar 3 disclosures on the top 15 corporate lenders in Europe shows that this central point is about right.[61]
There is no maturity adjustment for the Retail Capital Formula, which is equal to the Basic Capital Formula.[62]
Retail Capital Formula K= Basic Capital Formula
Finally, in order to calculate the risk weight of the asset, one multiplies the capital formula K by 12.5. This value W is derived historically from the Basel I Cooke ratio (and Basel II McDonough ratio) of 8%, as 12.5 = Œ%. This means that risk weights vary from 0% to 1250%.
The Risk Weighted Amounts (RWAs) were calculated, with the Exposure-at-Default (EAD):[63]
RWA= RW× EAD
The Pillar 3 disclosure reports from various banks enables one to understand the risk characteristics of the underlying assets: EAD, PD, LGD, (M for corporates), and the resulting RW, based on the EU CR6 Templates that breaks down the portfolio per PD scale.
| Basel II | asset correlation | parameter, | ρ | Applies | to: | |||
|---|---|---|---|---|---|---|---|---|
| framework | ||||||||
| Sovereign, | Institutions, | Corporates (excl. | ||||||
| = | (1 12% | −eVjk×Ql) + 24% | eVjk×Ql | SMEs). It | converges to | 24% | for best credit | |
| ρbcdefghef | ||||||||
| Wholesale | quality and | 12% for worst | credit quality. | |||||
| −S−5 | SMEs60. An | annual | turnover | adjustment | ||||
| ρbcdefghef | = ρbcdefghef nop | =1 −4% × | D | reduce the | correlation | by up | to 4%. | |
| 45 | ||||||||
| = 15% | Residential | Mortgages | (RM) | |||||
| ρ#frhse #o | ||||||||
| ρ#frhse | = 4% | Revolving | Qualifying | Retail | (RQR), i.e., | |||
| #t# | cards | |||||||
| Retail | ||||||||
| Retail Other, | i.e., Consumer | loans, Auto | ||||||
| = 3% (1 | −eVxj×Ql) + 16% | eVxj×Ql | It converges | to 16% for | best | credit quality | ||
| ρ#frhse urcfv | ||||||||
| 3% for worst | credit | quality. | ||||||
| 59 The 0.1% systemic | shock | probability is also | expressed as a | “confidence level | of 99.9%”, | in which | case the | formula is |
| adjusted with the | opposite sign, | −NVW(0.1%) as | = +NVW(99.9%), | the latter | being used in | the text of | the | regulation. |
| 60 | ||||||||
| For SMEs, the | linear size | adjustment to the | pure asset | correlation ρbcdefghef, | shown in | the above | formula | as |
| nVj | ||||||||
| 4% × z1 − | | affects borrowers | with annual | sales between | €5 mn and €50 | mn. For | borrowers with | €50 | mn annual |
| {j | ||||||||
| and above, the size | adjustment | becomes zero, | and the pure | asset correlation | applies. For | borrowers | with | €5 mn or less |
| annual sales, the | size adjustment | takes the value | of 0.04, thus | lowering the | asset correlation | from | 24% to | 20% (best |
| quality) and from | 12% to 8% | (worst credit | quality). (Source: | BCBS (July 2005) | An | Explanatory Note | on | the Basel II |
| Risk Weight | Functions.) |
8.1.2 IRB Approach for the securitisation tranches: SEC-IRBA
To calculate capital requirements for a tranche (securitisation exposure) to an IRB pool, a bank must use the “securitisation internal ratings-based approach” (SEC-IRBA) as well as an exponential-based mathematical smoothing function (the SSFA or Simplified Supervisory Formula Approach[64]) which uses as inputs:
1. the tranche attachment point A,
2. the tranche detachment point D,
3. the underlying pool capital requirement adjusted upwards by ignoring the FMI recognition given to the underlying assets, i.e., by adding the one-year expected loss, together called K"#$, and
4. an exponential smoothing parameter p.
Knn•%(A, D, K"#$, p) = eh• −ehe a(u−l)
a= − p× K"#$
where the upper point u= D−K"#$ and the lower point l= A−K"#$ (floored at zero) and e(•) being the exponential function.
Then a priority rule applies to determine the tranche risk weight RWR: i. when D is less or equal to K"#$, then the tranche risk weight RWR = 12.5 × (100%) = 1250%. ii. when A is greater of equal to K"#$, then the tranche risk weight RWR = 12.5 × Knn•%(A, D, K"#$, p). iii. when a tranche attaches below and detaches above K"#$, then a linear interpolation is calculated: RWR = 12.5 × U(100%) × =K"#$ −A D−A D + …Knn•%(A, D, K"#$, p)Š × =D−KD−A"#$D_ iv. a risk weight floor applies: Final RWR = max(Trancℎe Risk Weigℎt Floor, RWR)
The tranche risk weight floor is 15% for securitisations with the exception of 10% for senior tranches only of simple, transparent and comparable (STC) securitisations only.
The simplistic rule (i) derives from national emergency rules devised in the late 1990s to stop certain types of Basel I capital arbitrage done by some banks at a time when the Basel I framework was not risk sensitive. It has been kept under Basel II and Basel III, despite the fact that Basel I arbitrage deals are no longer possible under a risk sensitive framework. This results in a capital requirement around the attachment / detachment point of K"#$ way in excess of the capital requirement needed to cover the systemic risk content around this point. This regulatory legacy rule, poorly understood by the regulatory community and by the industry itself, is the foundation stone of the excess of capital surcharges in the current securitisation framework.[65]
The rule (iv) has been both badly drafted and badly calibrated. This is because structurers will use efficiently a design flaw of the SSFA Basel formula, where the floor is a maximum of a) a calculated value and 2) an exponential component that converges to zero. There is thus an ‘optimised’ attachment point for the senior tranche that will equalise exactly the risk weight floor and the exponential component. It is an example where the spirit of the legal wording and the mathematical formula conflict. It would be better to remove this design flaw by having a layer of additional risk weight rather than using a formula based on the word ‘floor’.[66]
The exponential formula Knn•% is not a risk model and needs to be calibrated. The calibration done by the Basel Committee on Banking Supervision in 2014 is not publicly available and has not been peer-reviewed. Nonetheless, it resulted in an exponential p-smoothing parameter that is dependent on four risk factors (framework (correlation effect), granularity of the securitised pool N for wholesale, FMI-adjusted pool capital K"#$, average loss given default of the securitised pool LGD) and one non-risk parameter (tranche maturity MR, capped at 5 years – indeed the risk parameter that is the average effective pool maturity M has been ignored)[67]. The formula of p is given by:
• For Non-STC securitisations: p= max(p•eddv, p"#$%)
• For STC securitisations, p"#$% is reduced by half: p= max(p•eddv, 0.5 × p"#$%)[68]
The value p•eddv is currently set at 30% for both Non-STC and STC securitisations.
The supervisory parameters, A, B, C, D and E of p"#$% are determined according to the regulatory asset class as in Table 8.2. The Stressed PD formula is derived from the use of the 2002 Asymptotic Single Risk Factor (ASRF) credit model., and p"#$% is calculated as follow:
p"#$% = A + B N + C × K"#$ + D × LGD+ E × MR Framework Seniority Granularity A B C D E Wholesale Senior Granular 0 3.56 -1.85 0.55 0.07 Non-granular 0.11 2.61 -2.91 0.68 0.07 Non-senior Granular 0.16 2.87 -1.03 0.21 0.07 Non-granular 0.22 2.35 -2.46 0.48 0.07 Retail Senior 0 0 -7.48 0.71 0.24 Non-senior 0 0 -5.78 0.55 0.24 The granular/non-granular boundary for Table 8.2 is set at N= 25, granular above this threshold, non-granular below. The senior tranche is the one whose detachment point D is set at 100%, any other tranche is non-senior.
8.2 SA Approach
Under the Standardised Approach (SA), asset risk weights are determined by a few risk characteristics and little judgement. There is no formula that is dependent on classic risk characteristics such as PD and LGD and other elements.
8.2.1 SA Approach for the underlying loans
• Corporate Exposures In Europe, where the use of external ratings is prescribed, depending on the external rating of the exposure, we use Table 8.3, a lookup table (Method 1):[69] External rating of AAA to A+ to BBB+ to BB+ to B+ and Unrated exposure AA- A- BBB- BB- below (excluding SMEs) “Base” RW 20% 50% 75% 100% 150% 100%
In order to estimate the SA RWs of a bank’s portfolio, we use the mapping in Table 8.4.[70] This mapping is a simplification of reality. However, it has a conservative bias for the lowest default probabilities mapped at 50% (ignoring the possibilities of the lower 20% for AAA to AA- rated corporates). It also has a non-conservative bias, as a high proportion of corporates in the bottom part of the template, with a PD above 2.5%, and mapped to B+ and below, do not have an external rating and would normally be risk weighted at 100% instead of 150%.
We will thus compare two sets of pools, one made from portfolio with all non-defaulted assets (“All, excl. Defaults”), and one with the top part of the PD scale (“Top Part (PD<2.5%)”). Since we have the EU CR6 Pillar 3 disclosures, we can make an estimate about future SA risk weights for determining the impact of the SA Output Floor.
In practice though, simply mapping the PD and rating leads to underestimation of the RW in SA for Corporate, as few European corporates, that banks would assess as investment grade quality are actually rated. This is particularly pronounced as an issue for the German Mittelstand sector. The 70.1% RW estimated in Table 4.1 is likely to be higher.[71]
Unrated SME Corporate exposures have their SA risk weight set at 85%.[72] Rated ones will follow the rules for large corporates but such ratings are rare in Europe.
• Residential Mortgage Exposures The risk weight for residential mortgages was 50% under Basel I, then 35% under Basel II but there was little risk sensitivity. In the Basel III Finalised Standards, the risk weight for residential mortgage has been substantially changed. It has been made risk sensitive to the LTV, as well as to whether the exposures are materially dependent or on the property’s cashflows. Those base risk weights are given in Table 8.5.
Owner occupier would be classified by the first row (i.e., the exposures are not materially dependent on cashflows generated by the property, unlike buy-to-let schemes).
• ‘Retail – Other’ Exposures Excluding mortgages, the retail exposure takes the form of any of the following: revolving credits and lines of credit (including credit cards, charge cards and overdrafts)[73], personal term loans and leases (e.g. instalment loans, auto loans and leases, student and educational loans, personal finance) and small business facilities and commitments.
As this study focuses only on auto-loans and consumer loans among the retail assets, the IRB “Retail – Other” would be classified as SA “Non-revolving” (and not SA “Retail – Other”). In which case their SA risk weight would be 75%.
| PD scale (EU CR6) Mapping | Method 1 Estimated Average RW (with external ratings method) | |||
|---|---|---|---|---|
| [0% - 0.15%[ AAA to A- | 50% | |||
| [0.15% - 0.25%[ BBB+ | 75% | |||
| [0.25% - 0.50%[ BBB and BBB- | 75% | |||
| [0.50% - 0.75%[ BB+ | 100% | |||
| [0.75% - 2.50%[ BB and BB- | 100% | |||
| [0%-2.50%[ | Top Part | Top Part | ||
| [2.50% - 10.0%[ B+ to B- | 150% | |||
| [10.0% - 99.9%] Below CCC+ | 150% | |||
| 100.00% Default | N/A | |||
| [2.50%-100%] | Bottom Part | Bottom Part |
| ≤50% | ]50 −60%] | ]60 −80%] | ]80 −90%] | ]90 −100%] |
|---|---|---|---|---|
| 20% | 25% | 30% | 40% | 50% |
| 30% | 35% | 45% | 60% | 75% |
8.2.2 Standardised Approach for the securitisation tranches: SEC-SA
To calculate capital requirements for a tranche (securitisation exposure) to a standardised approach (SA) pool using the “securitisation standardised approach” (SEC-SA), a bank would use the SSFA function. This uses the following inputs:
1. the tranche attachment point A;
2. the tranche detachment point D;
3. the underlying pool capital requirement K% as described below; and
4. an exponential smoothing parameter p. The value K% is calculated using the risk weight RWn% if the performing underlying exposures have not been securitised and the non-performing (delinquent) assets are assigned an implicit risk weight of 625%. For this, w, the ratio of delinquent underlying exposures to total underlying exposures in the securitisation pool is used.
K% = (1 −w) × (8% × RWn%) + (w) × (8% × 625%)
which gives the regulatory formula: K% = (1 −w) × (Kn%) + (w) × (0.5)
The SSFA function is: Knn•%(A, D, K%, p) = eh• −ehe a(u−l)
a= − p× K%
Here the upper point u= D−K% and the lower point l= A−K% (floored at zero).
Under the standardised approach, the exponential smoothing parameter p is fixed and set at a very high level of 100% for Non-STC securitisations[74], and 50% for STC securitisations.
Then a priority rule applies: i. when D is less or equal to K%, then the tranche risk weight RWR = 12.5 × (100%) = 1250%. ii. when A is greater of equal to K%, then the tranche risk weight RWR = 12.5 × Knn•%(A, D, K%, p). iii. when a tranche attaches below and detaches above K%, then a linear interpolation is calculated: RWR = 12.5 × U(100%) × =K% −A D−A D + …Knn•%(A, D, K%, p)Š × =D−KD−A%D_ iv. a risk weight floor applies: Final RWR = min(Trancℎe RW Floor, RWR)
The tranche risk weight floor is 15% for securitisations with the exception of 10%, for senior tranches only, of STC securitisations only.
9 Appendix on Components of the capital increase
Let us assume that pool EAD-weighted risk weight is 75% (i.e., a minimum capital requirement of 6% using the McDonough ratio of 8%), the EAD-weighted PD is 2.00% and the EAD-weighted LGD is 50% (i.e. the one-year expected loss which is offset by FMI is 100 bps). The p-factor is assumed to be 60% for all tranches.
Step 1: Pre-securitisation pool capital Step 2: Add Non-recognition of FMI up to 1-year EL
1250% 1250%
1000% 1000%
750% 750%
500% 500%
250% 250%
0% 0% 0% 10% 20% 30% 40% 50% 60% 70% 80% 90% 100% 0% 10% 20% 30% 40% 50% 60% 70% 80% 90% 100% Capital Structure Capital Structure
A=0%, D=6%, A=6%, D=7%, Average risk weight 1250% Average risk weight 1250% RWA Component = (6-0) * 1250% * 8% = €6 RWA Component = (7-6) * 1250% * 8% = €1 RWA = area in orange rectangle RWA = area in red rectangle
Step 3: Add smoothing Step 4: Optimise Senior Tranche Attachment Point
1250% 1250%
1000% 1000%
750% 750%
500% 500%
250% 250%
0% 0% 0% 10% 20% 30% 40% 50% 60% 70% 80% 90% 100% 0% 10% 20% 30% 40% 50% 60% 70% 80% 90% 100% Capital Structure Capital Structure
A=7%, D=100%, A=12.84%, D=100%, Average 15% RWA = 60% * (€6 + €1) = €4.2 RWA Component = (100-12.84) * 15% * 8% = €1.046 RWA = area below the blue curve RWA = area in green thin rectangle below 15% equal to area below blue line in green thick rectangle.
Step 5: Effective medium seniority component following the optimisation of the senior tranche optimisation: RWA Component = €4.2 - €1.046 = €3.154 (area below the blue line between A=7% and D=12.84%)
Decomposition of the capital increase: 2.0x 17.4%
• 1st component: pre-securitisation = 100% of pool 1.8x 52.6% RWA (€6) 1.6x
1.4x
• 2nd component: non-recognition of FMI = 16.7% of 16.7% pool RWA (€1) 1.2x 100.0%
• 3rd component: medium seniority = 52.6% of RWA 1.0x 0.8x (€3.154) 0.6x
• 4th component: senior tranche risk weight floor at 15% = 17.4% of RWA (€1.046) 0.4x 0.2x
0.0x Up to K K to K+EL Medium sen. Senior
10 Appendix on Risk Characteristics of Key Asset Classes
10.1 Corporate risk characteristics
The regulatory classification for the corporate (excluding corporate SMEs) asset class (commonly referred to as ‘Large Corporate’) is the asset class with most international distribution. We examined 15 European corporate lenders that employ the Advanced IRB approach. Table 10.1 shows data for these banks.
| Table 10.1: Top | IRB | Corporate | Lenders | Pillar | 3 – | Asset risk | characteristics | |||||
|---|---|---|---|---|---|---|---|---|---|---|---|---|
| Corporate | “All” | “All, | excl. Defaults” | “Top | Part | (PD<2.5%)” | ||||||
| Lender | EAD | PD | LGD | RW | PD | LGD | RW | Size | PD | LGD | RW | |
| HSBC (UK) | 382.4 | 2.27% | 39.4% | 49% | 1.07% | 39.3% | 49% | 92% | 0.46% | 39.7% | 44% | |
| ING (NL) | 268.0 | 1.79% | 17.6% | 25% | 0.70% | 17.4% | 24% | 94% | 0.33% | 17.1% | 20% | |
| BNP Paribas (FR) | 224.4 | 2.83% | 33.3% | 51% | 1.04% | 33.9% | 51% | 86% | 0.33% | 34.3% | 43% | |
| Deutsche Bank | (DE) | 164.5 | 5.43% | 32.6% | 39% | 1.16% | 33.0% | 40% | 85% | 0.37% | 33.4% | 31% |
| Unicredit (IT) | 134.2 | 3.11% | 37.2% | 47% | 0.87% | 36.6% | 47% | 91% | 0.38% | 36.6% | 40% | |
| Santander (ES) | 125.5 | 3.15% | 43.1% | 49% | 0.60% | 43.0% | 50% | 93% | 0.37% | 43.1% | 46% | |
| Intesa Sanpaolo | (IT) | 111.0 | 4.80% | 32.4% | 48% | 1.30% | 32.0% | 49% | 88% | 0.54% | 32.3% | 43% |
| Société Générale | (FR) | 99.4 | 2.77% | 31.7% | 43% | 1.33% | 31.4% | 42% | 83% | 0.42% | 31.6% | 31% |
| Natwest (UK) | 74.4 | 1.18% | 38.2% | 41% | 0.70% | 38.2% | 41% | 92% | 0.34% | 38.9% | 37% | |
| Crédit Agricole | (FR) | 72.1 | 1.99% | 44.6% | 56% | 0.65% | 44.6% | 54% | 94% | 0.33% | 44.6% | 48% |
| UBS (CH) | 55.2 | 2.43% | 32.6% | 63% | 1.26% | 32.6% | 63% | 82% | 0.55% | 32.9% | 46% | |
| Barclays (UK) | 53.1 | 4.64% | 35.2% | 55% | 1.60% | 35.6% | 53% | 81% | 0.34% | 36.6% | 39% | |
| Crédit Suisse | (CH) | 48.0 | 3.51% | 39.7% | 61% | 1.55% | 39.3% | 60% | 80% | 0.43% | 40.6% | 45% |
| Groupe BPCE | (FR) | 45.4 | 4.16% | 33.7% | 41% | 0.79% | 33.5% | 39% | 86% | 0.38% | 33.9% | 33% |
| Lloyds (UK) | 40.5 | 1.73% | 42.1% | 52% | 0.65% | 42.1% | 53% | 92% | 0.31% | 42.0% | 46% | |
| Average | 3.05% | 35.6% | 48% | 1.02% | 35.5% | 48% | 88% | 0.39% | 35.9% | 40% |
10.2 SME risk characteristics
SME is the asset class with the most quantitative issues, some of which will be highlighted here:
a) Among financial products, in addition to standard on-balance-sheet loans, banks offer SMEs offbalance sheet products (e.g., overdraft lines, undrawn revolvers) in sizable amounts. These are multiplied by Credit Conversion Factors (CCFs) to obtain the overall gross EAD. This increases total EAD significantly. On the other hand, banks employ Credit Risk Mitigation (CRM) techniques that permit netting exposure against collateral received from the SMEs, including the SMEs’ own bank deposits. The Total EAD post-CCF and post-CRM, on which risk weighted assets (RWA) are calculated, can, thus, be significantly lower than the on-balance sheet level. Supporting factors in the legislation can further reduce capital requirements. In the example of Intesa Sanpaolo, starting with: €61bn of SME on-balance sheet loans, one can o add €29bn pre-CCF of SME off-balance sheet products, and after applying CRM techniques, end up with only €47bn total EAD post-CCF and post-CRM. The average risk weight of 57% on €47bn regulatory EAD is in reality an equivalent 44% RW on €61bn on-balance sheet EAD. In other words, the ‘real RW’ of lending to SMEs is lower than the RW that would be applied if one were to transfer the on-balance sheet loans (without CRM) to a securitisation vehicle.
b) SEC-ERBA is still used for SME securitisations for non-originator bank investors.
c) Some countries allow SME loans to be used as collateral for covered bonds (e.g., Germany).
d) As shown in Table 3.3.1, the lending standards and the riskiness of the SME loan pools vary considerably between banks between countries[75] (e.g., Italy vs. Belgium) and within a country (e.g., BBVA “Top Part (PD<2.5%)” size is a low 50%).
Italian, Belgian and Spanish SME ABS represent €70 bn or 74% of the European Total SME ABS Principal Outstanding. The top 4 SME lenders in Italy, Belgium and Spain are:
• Italy: Intesa Sanpaolo, Unicredit, Banco BPM and MPS.
• Belgium: BNP Paribas Fortis, KBC, Belfius and ING Belgium. Although BNP Paribas Fortis is the largest bank in Belgium by Total Asset, it does not disclose EU CR6 data on its assets in its Pillar 3 disclosures; EU CR6 asset riskiness is consolidated in the BNP Paribas Group Pillar 3 disclosures, but it is not possible to isolate in the latter the part relevant to Belgium. ING Belgium is the fourth largest bank, and does not disclose detailed CR6 data on Belgium, as its data is consolidated at ING Group level in the Netherlands.
• Spain: Santander, CaixaBank, BBVA and Sabadell.
The IRB characteristics for the Top SME lenders relevant to the SME securitisation market are in Table 10.2.
| Lender | EAD | PD | LGD | RW | PD | LGD | RW | Size | PD | LGD | RW |
|---|---|---|---|---|---|---|---|---|---|---|---|
| Intesa Sanpaolo (IT) | 70.0 | 17.66% | 42.1% | 57% | 3.10% | 39.8% | 63% | 60% | 0.90% | 40.5% | 49% |
| Unicredit (IT) | 47.7 | 9.52% | 26.0% | 37% | 2.68% | 24.0% | 37% | 70% | 0.82% | 22.7% | 27% |
| Banco BPM (IT) | 17.0 | 15.18% | 30.5% | 34% | 2.94% | 28.02% | 36% | 65% | 0.59% | 29.1% | 26% |
| MPS (IT) | 9.6 | 17.33% | 34.5% | 52% | 3.86% | 30.6% | 51% | 59% | 1.02% | 32.1% | 40% |
| KBC (BE) | 23.7 | 5.55% | 23.7% | 34% | 1.64% | 23.3% | 34% | 82% | 0.70% | 23.3% | 29% |
| Belfius (BE) | 12.4 | 9.44% | 40.4% | 67% | 2.46% | 41.1% | 70% | 62% | 0.95% | 40.9% | 58% |
| Santander (ES) | 36.4 | 13.94% | 42.7% | 62% | 2.46% | 42.8% | 67% | 63% | 1.02% | 43.5% | 57% |
| CaixaBank (ES) | 22.1 | 9.56% | 30.7% | 48% | 2.19% | 30.1% | 50% | 79% | 0.75% | 30.2% | 44% |
| BBVA (ES) | 16.0 | 12.84% | 42.3% | 82% | 4.71% | 42.3% | 87% | 50% | 0.72% | 44.4% | 59% |
| Sabadell (ES) | 12.4 | 8.07% | 39.0% | 43% | 1.99% | 39.9% | 44% | 78% | 0.52% | 41.1% | 35% |
| Average | 11.91% | 35.2% | 52% | 2.80% | 34.2% | 54% | 67% | 0.80% | 34.8% | 42% |
Note: EAD are on-balance sheet EAD and are expressed in €bn.
10.3 Residential Mortgage risk characteristics
UK, Dutch, Spanish and French RMBS represent €467 bn or 79% of the European Total RMBS Principal Outstanding. We provide in Table 10.3 the risk characteristics of assets from top IRB lenders in those countries.
According to UK Finance, a trade association for the UK banking and financial services sector, the largest mortgage lenders, representing almost 2/3 of the market share, are (based on the MM10 report, dated June 2021): Lloyds Banking Group, Nationwide Building Society, Santander UK, NatWest Group and Barclays.
Dutch bank origination is mainly derived from the three banks ING, Rabobank and ABN Amro.
According to the European Mortgage Federation, mortgage lending in Spain is always provided by financial institutions. Banks and former saving banks stand for the major part of the market, representing around a 91% of total outstanding mortgage lending. The remaining 9% is covered by credit cooperatives (8%) and financial credit establishments (1%).[76] Spanish bank origination is mainly derived from the quattro Santander / CaixaBank / BBVA / Sabadell.
With regards to France, according to the European Mortgage Federation, the three main categories of credit institutions, involved in property lending are: private banks with a market of 34.2%, mutual and cooperative banks with a market share of 65.3% and specialised institutions with the remainder. French bank origination is mainly derived from the quattro Groupe BPCE / BNP Paribas / Crédit Agricole / Société Générale.
| Table 10.3: Top IRB | Residential | Mortgage | Lenders | Pillar 3 | – Asset | risk | characteristics | ||||
|---|---|---|---|---|---|---|---|---|---|---|---|
| ‘Resi’ Mortgage | “All” | “All, | excl. Defaults” | “Top | Part | (PD<2.5%)” | |||||
| Lender | EAD | PD | LGD | RW | PD | LGD | RW | Size | PD | LGD | RW |
| Lloyds (UK) | 314 | 1.89% | 10.0% | 11% | 1.07% | 10.0% | 11% | 98% | 0.60% | 10.1% | 10% |
| Nationwide (UK) | 186 | 0.53% | 11.6% | 6% | 0.33% | 11.6% | 6% | 98% | 0.14% | 11.5% | 5% |
| Santander UK | 188 | 3.47% | 10.0% | 17% | 1.59% | 9.7% | 17% | 96% | 1.75% | 10.0% | 16% |
| Natwest (UK) | 182 | 1.47% | 11.0% | 9% | 0.63% | 10.9% | 9% | 98% | 0.37% | 10.9% | 8% |
| Barclays (UK) | 162 | 2.60% | 12.0% | 16% | 1.61% | 11.9% | 15% | 90% | 0.65% | 11.8% | 12% |
| ING (NL) | 296 | 1.57% | 16.1% | 11% | 0.50% | 16.1% | 10% | 96% | 0.22% | 16.0% | 8% |
| Rabobank (NL) | 191 | 0.87% | 9.0% | 8% | 0.55% | 9.0% | 8% | 97% | 0.30% | 8.8% | 7% |
| ABN Amro (NL) | 155 | 1.44% | 11.6% | 9% | 0.59% | 11.5% | 8% | 97% | 0.33% | 11.5% | 7% |
| Santander Group (ES) | 292 | 4.40% | 10.0% | 15% | 2.48% | 9.8% | 15% | 75% | 0.92% | 10.2% | 10% |
| CaixaBank (ES) | 135 | 5.81% | 21.4% | 16% | 1.03% | 21.2% | 16% | 88% | 0.25% | 21.0% | 13% |
| BBVA (ES) | 71 | 4.56% | 21.9% | 14% | 0.79% | 22.1% | 14% | 91% | 0.21% | 21.9% | 8% |
| Sabadell (ES) | 71 | 2.45% | 19.7% | 14% | 0.92% | 19.7% | 14% | 94% | 0.41% | 19.6% | 12% |
| Groupe BPCE (FR) | 266 | 1.77% | 10.8% | 9% | 1.02% | 10.6% | 9% | 92% | 0.36% | 10.5% | 6% |
| BNP Paribas (FR) | 173 | 2.67% | 12.5% | 14% | 0.72% | 11.8% | 10% | 94% | 0.39% | 11.7% | 8% |
| Crédit Agricole (FR) | 108 | 1.36% | 11.1% | 8% | 0.61% | 10.9% | 8% | 95% | 0.21% | 10.6% | 5% |
| Société Générale (FR) | 105 | 1.74% | 13.7% | 11% | 0.89% | 13.5% | 11% | 92% | 0.47% | 13.6% | 8% |
| Average | 2.41% | 13.3% | 12% | 0.96% | 13.1% | 11% | 93% | 0.47% | 13.1% | 9% |
Note: EAD are on-balance sheet EAD and are expressed in €bn, except for UK banks where they are expressed in £bn.
10.4 ‘Retail – Other’ risk characteristics for Auto loans / leases
German and Italian Auto ABS represent €67 bn or 73% of the European Total Auto ABS Principal Outstanding. Although Auto ABS also originate from banks, in Europe auto financing is moving towards ‘Captives’, i.e., banks that belong to automotive groups. The captives are interesting as they ‘isolate’ the auto risk in the EU CR6 templates from other assets.
No IRB data is publicly available for Germany. Volkswagen Bank GmbH, although it is under the supervision of the Single Supervisory Mechanism (SSM) of the ECB, does uses the SA approach instead of the IRB approach. As a result, the SA Output Floor will not directly impact Volkswagen Bank. The financial arms of Mercedes Benz or BMW do not publish separate Pillar 3 reports.
No IRB data is publicly available for Italy. Fiat Chrysler Automotives (FCA) Bank is also using the Standardised Approach.
RCI Bank and Services is the French captive of Renault and it is also supervised by the SSM. It uses the Advanced IRB for most of its assets and has €24.5 bn of on-balance sheet assets in the category “Retail No SME”.
PSA Banque France (Stellantis) is a captive for Peugeot, Citroën and DS brand customers and distribution networks. It is a joint venture with Santander Consumer Finance. It uses Advance IRB for some of its assets (for a total of €4.7 bn).
The IRB characteristics for RCI Bank and PSA Banque are given in Table 10.4.
10.5 ‘Retail – Other’ risk characteristics for Consumer loans
Italian and French Consumer ABS represent €60 bn or 72% of the European Total Consumer ABS Principal Outstanding.
In Italy, the two largest IRB consumer lenders are Unicredit and Intesa Sanpaolo. The others are far behind size-wise. In France, the top 4 IRB consumer lenders are Groupe BPCE, Crédit Agricole, BNP Paribas and Société Générale.
| Table 10.4: | Top IRB | ‘Retail-Other’ | Lenders | Pillar 3 | – Asset | risk | characteristics | |||||
|---|---|---|---|---|---|---|---|---|---|---|---|---|
| ‘Retail – | Other’ | “All” | “All, | excl. Defaults” | “Top | Part | (PD<2.5%)” | |||||
| Lender | EAD | PD | LGD | RW | PD | LGD | RW | Size | PD | LGD | RW | |
| RCI Banque | (Auto,FR) | 25 | 4.08% | 41.5% | 46% | 2.38% | 40.9% | 45% | 80% | 0.89% | 40.6% | 39% |
| Banque PSA | (Auto,FR) | 5 | 3.60% | 46.5% | 52% | 1.94% | 45.7% | 51% | 72% | 0.77% | 44.1% | 42% |
| Unicredit (IT) | 21 | 4.98% | 42.8% | 47% | 2.79% | 42.4% | 46% | 75% | 0.90% | 41.8% | 38% | |
| Intesa Sanpaolo | (IT) | 19 | 6.95% | 34.3% | 28% | 1.30% | 32.0% | 49% | 77% | 0.54% | 32.3% | 43% |
| Groupe BPCE | (FR) | 73 | 3.82% | 21.5% | 17% | 1.44% | 20.7% | 16% | 87% | 0.46% | 19.7% | 12% |
| Crédit Agricole | (FR) | 52 | 5.26% | 32.5% | 35% | 1.85% | 31.1% | 35% | 79% | 0.60% | 27.1% | 25% |
| BNP Paribas | (FR) | 41 | 7.34% | 41.2% | 40% | 1.97% | 39.8% | 40% | 78% | 0.60% | 38.9% | 33% |
| Société Générale | (FR) | 31 | 6.63% | 28.4% | 30% | 2.19% | 27.4% | 29% | 75% | 0.65% | 25.4% | 21% |
| Average | 5.33% | 36.1% | 37% | 1.98% | 35.0% | 39% | 78% | 0.68% | 33.7% | 31% |
Note: EAD are on-balance sheet EAD and are expressed in €bn.
11 Appendix on Detailed Results by Asset Class
11.1 Securitisations with Corporates (excl. SMEs)
This section is concerned with regulatory wholesale corporate exposures (excluding SMEs).
11.1.1 Corporate: SEC-IRBA with Pool IRB RW
When taking the wholesale corporate exposures portfolio characteristics (excluding defaulted assets) as representative of securitised corporate pools (excluding SMEs), the average EAD-weighted risk weight across the 15 banks in the sample (Data Annex 6) is 47.6%. Within this there is a very wide dispersion between the pool with the lowest at 24.0% and the highest at 62.6%. We refer to those pools as “All, excl. Defaults”. The average EAD-weighted probability of default for the pools is 1.02% and the average EAD-weighted loss-givendefault is 35.50% (thus, a proxy for the implicit one-year expected loss for non-defaulted assets is 36.2 bps). A summary is provided in Table 11.1.1 and the details for each bank are provided in Table A6.1.1 in Data Annex 6.
In order to assess the impact of SEC-IRBA, we assume that the corporate loan pools that share the risk characteristics found in the Pillar 3 reports of banks would be securitised. In addition to the risk parameters PD, LGD and RW, we need an assumption with regards to the level granularity of such pools. We decided to set the value at 75. We also need an assumption on a non-risk parameter, the tranche maturity. For this we set the value at the 5-year cap, corresponding to the value for most new issuances for corporate securitisations.
We also need to decide whether the securitisation is Non-STC or STC. We will assume here that Non-STC parametric values will be chosen for asset pools that are ‘unfiltered’ at issuance and contain high risk assets (except Defaults). There are many factors that are considered when deciding whether a securitisation can be STC, but we use asset quality as a proxy This is because STC transactions are more likely to be executed with higher quality assets.[77] The main impact of STC calibration is the lower senior risk weight and the halving of p"#$% (subject to a floor of 30%). For securitisation using the STC parametric values, we will limit those to the ‘Top Part” of the Pillar 3 distributions where the PD of the assets is less than 2.5%. In the case of wholesale corporate exposures portfolio characteristics for ‘Top Part (PD<2.5%), the average pool EAD-weighted risk weight is 39.5% with a wide dispersion between the pool with the lowest at 20.1% and the highest at 47.9% (Table A6.1.2). The other risk characteristics are Pool EAD-weighted PD of 0.39% and pool EAD-weighted LGD of 35.85%. Thus, a proxy for the implicit one-year expected loss for non-defaulted assets is thus 14.0 bps.
We then need an assumption on the tranching. As the SEC-IRBA Knn•% function has additive mathematical properties for all non-senior tranches, we can split the structures into two tranches: a senior one and a nonsenior one, the latter representing the thickness of all non-senior tranches. Having a senior tranche enables us to ‘exploit’ a design flaw linked to the existence of a fixed value for the senior tranche risk weight floor (15% for Non-STC securitisations, and 10% for STC securitisations). We thus ‘optimise’ the senior tranche attachment point by lowering up to the point that gives equality between the Knn•% capital and the capital resulting from the application of the senior tranche risk weight floor. This optimisation would indeed by performed by financial structurers and has the effect of reducing the effect of the capital surcharge generated by the medium seniority parameter. The overall result is that the SEC-IRBA RW of all tranches calculated this way is the lowest possible.
By calculating the Post-securitisation RW of all tranches to the Pre-securitisation RW of the pool, one obtains the ratio Post/Pre-securitisation Capital Multiplier.
For the pools “All, excl. Default” and Non-STC securitisations, the average Post/Pre-securitisation Capital Multiplier is 1.67x. This means that the capital of all tranches (if kept in the regulated banking system) has increased by 67% by the mere action of securitising, even though no additional credit risk has been added to the underlying pool. The lowest capital multiplier is 1.55x and the highest of 1.72x which is a fair range between the minimum and maximum.
For the pools “Top Part (PD<2.5%)” and STC securitisations, the average Post/Pre-securitisation Capital Multiplier is 1.36x, i.e., a 36% increase just due to the act of securitising. The lowest capital multiplier is 1.34x and the highest of 1.37x This narrow range indicates that there has been a loss of risk sensitivity. Indeed, under the STC the ‘p’ values for all 15 lenders drops to 30%, the so-called ‘p-floor’; whereas for Non-STC, the ‘p’ values for senior tranches varied from 45.6% to 55.6% (average 51.6%) and from 56.1% to 59.5% (average 58.0%) for non-senior tranches.
We can decompose the content of the Post/Pre-securitisation Capital Multiplier into its four main components:
1) The first component is linked to the pre-securitisation capital of the pool, i.e., always equal to 100%.
2) The second component associated with an issue dating back to the Basel II era, is the non-recognition of Future Margin Income (FMI) to cover up to the equivalent of 1-year of expected loss at the pool level. This FMI recognition is given to the underlying assets but not to the same assets once a pool is securitised. We, therefore, need to isolate this value as part of the overall increase in capital requirement generated by the SEC-IRBA formula.[78]
3) The third component is the medium seniority effect for the non-senior tranches, i.e., the capital embedded in all non-senior tranchelettes that attach at an attachment point above 1.00x K"#$ and detaching at the optimised point where the senior tranche’s risk weight is exactly equal to the securitisation risk weight floor.[79] As a result of the optimisation of the senior tranche thickness, the medium seniority contribution is often less than the value of p. For situations when the risk weight floor is too high in relation to the underlying pool risk weight, the ‘optimised’ attachment point drops below 1.00x K"#$. In this instance there is no effect from p, i.e., a p is calculated but its smoothing effect is discarded,[80]and the component is computed as a negative value.
4) The fourth component is the risk weight floor of the senior tranche. Because the latter is not based on a proportion of the underlying pool risk, one must assess its own contribution to the overall increase in capital requirement. When the fourth and third components are taken together they give values that are commensurate with the value of p for non-senior tranches.
Figure 11.1.1. shows the breakdown of the four components for Non-STC (Panel a)) and STC securitisations (Panel b)). For Non-STC securitisations, the medium seniority (25.8% of pool RWAs) and the senior tranche floor at 15% (31.4% of pool RWAs) sums to 57.2% of pool RWAs (commensurate with the average non-senior ‘p’ of 58.0%). For STC securitisations the medium seniority (5.5% of pool RWAs) and the senior tranche floor at
10% (25.8% of pool RWAs) sums to 31.3% of pool RWAs (commensurate with the average non-senior p of 30.0%).
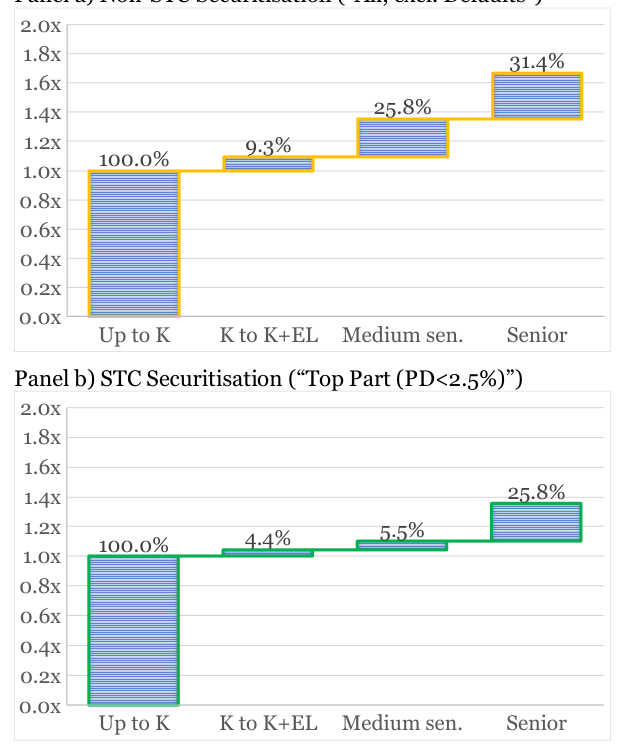
| Pool | EAD- Pool EAD- | Pool EAD- | Tranches EAD- | Post/Pre- |
|---|---|---|---|---|
| Average weighted | PD weighted LGD | weighted RW | weighted RW | securitisation |
| (Pre- | (Post- | Capital Multiplier | ||
| securitisation) | Securitisation) | with SEC-IRBA | ||
| Defaults | ||||
| 1.02% 35.50% | 47.6% | 79.4% | 1.67x | |
| Non-STC | ||||
| (PD<2.5%) | ||||
| 0.39% 35.85% | 39.5% | 53.6% | 1.36x | |
| STC |
11.1.2 Corporate: SEC-SA with Pool SA RW
For the input for the pool SA RW we use the values under the Method 1 in Tale 4.1.2. We simulate new securitisations with zero delinquencies at issuance date. With SEC-SA, the p-factor value is 100% for both senior and non-senior tranches for Non-STC securitisations, and 50% for STC securitisations. The senior tranche risk weight floor is the same in SEC-IRBA and SEC-SA, i.e., 15% for Non-STC securitisations, and 10% for STC securitisations, while for non-senior tranches there is a 15% floor regardless of STC status.
For Non-STC securitisations using the pools “All, excl. Defaults”, we calculate the ‘optimised’ senior tranche attachment points for each corporate lender in Table A6.2.1. The average value is 2.85x K% (equivalent to an attachment point of 17.9% when expressed as a percentage of the capital structure), with the lowest at 2.73x K% and the highest at 3.01x K%. Under such optimisation, the Post/Pre-securitisation Capital Multiplier is 2.00x (100% increase). When the senior tranche attachment point is not optimised, this multiplier is even higher. The average SA risk weight for the pool of 78.3% becomes 156.6% post-securitisation for all tranches for Non-STC.
For STC securitisations using the pools “Top Part (PD<2.5%)), we calculate the ‘optimised’ senior tranche attachment points for each corporate lender in Table A6.2.2. The average ‘optimised’ attachment point for the senior tranche is 1.68x K% (equivalent to an attachment point of 9.4% when expressed as a percentage of the capital structure), with the lowest at 1.63x K% and 1.72x K%. Under such optimisation, the Post/Presecuritisation Capital Multiplier is 1.50x (50% increase). When the senior tranche is not optimised, this multiplier is even higher. The average SA risk weight for the pool of 70.1% becomes 105.1% post-securitisation for all tranches.
Figure 11.1.2 shows the average breakdown of the four components of the 100% capital requirement increase for Non-STC securitisation (Panel a)) and for the 50% capital requirement increase (Panel b)):
• 1st component: 100%, the SA pool RWAs of the underlying pool
• 2nd component: 0%, as the SA approach does not create a mismatch between post and presecuritisation, as the FMI is not recognised under the SA approach for the underlying assets. We add it here to enable proper like-for-like comparisons with the components of the SEC-IRBA capital increases in Figure 11.1.1.
• 3rd component: Non-STC medium seniority: 84.2% of pool RWAs; compared to 37.0% of pool RWAs for STC.
• 4th component: the senior tranche risk weight floor at 15% for Non-STC represents 15.8% of pool RWAs; and for STC, the 10% floor represents 13.0% of pool RWAs.
The third and fourth components, when summed up are exactly equal to the ‘p’ of 100% for SEC-SA for Non- STC and 50% for STC that is applied to securitisation (including non-senior) tranches.
It is obvious from the visual interpretation of Figure 11.1.2 that a smoothing function that generates 84.2% of the pool RWAs, in excess of the 100 % Pool RWAs itself, leaves a lot to be desired as far as its calibration is concerned.
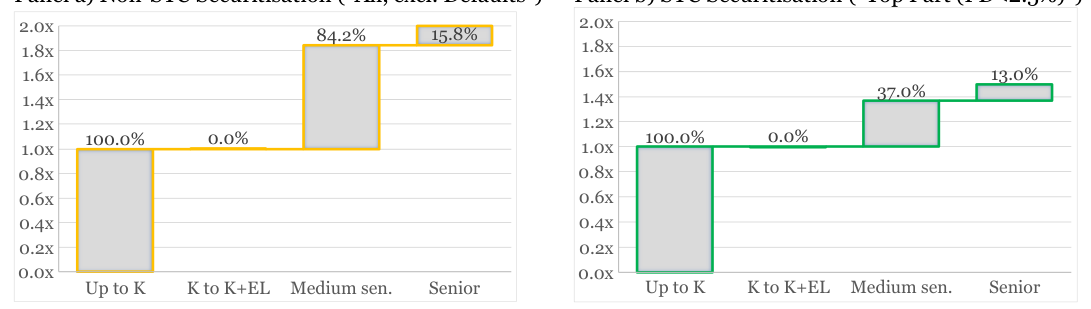
| Optimised Senior | Tranche | Post/Pre- | ||||
|---|---|---|---|---|---|---|
| Corporate | Attachment Point | Pool EAD- | Tranches EAD- | securitisation | ||
| Lenders | Average | As % capital | As multiplier | weighted RW | weighted RW | Capital Multiplier |
| structure | of | (Pre-securitisation) | (Post-securitisat.) | with SEC-SA | ||
| Pools: All, excl. | Defaults | K% | ||||
| 17.9% | 2.85x | 78.3% | 156.6% | 2.00x | ||
| Securitisations: | Non-STC | |||||
| Pools: Top Part | (PD<2.5%) | |||||
| 9.4% | 1.68x | 70.1% | 105.1% | 1.50x | ||
| Securitisations: | STC |
11.1.3 Corporate: SA Output Floor Implementation
To analyse the impact of the SA Output Floor, one needs to compare the exiting IRB risk weight with a value that equals the SA Output Floor (which varies over a 6-year implementation plan from 50% to 72.5% of the SA risk weight[81]. Table 11.1.3 gives the key results for Non-STC securitisations using the “All, excl. Defaults” pools, and Table 11.1.4 for STC securitisations for the “Top Part (PD<2.5%)). The full breakdown is provided in the data annexes, in Tables A6.3.1 and A6.3.2.
To assess which banks would be impacted (when looking at the regulatory asset class level, rather than at the bank wide level), we can calculate the ratio of the SA Output Floor RW to the IRB RW. When a ratio is below 1.00x then the IRB method will prevail, and when above 1.00x the SA Output Floor will prevail. Figure 11.1.3 (for Non-STC) and Figure 11.1.4 (for STC) shows a green tick when IRB prevails, and a red cross when the SA Output Floor will prevail. Panel a) of those figures concern the asset side and Panel b) the securitisation side. The move from a green tick to a red cross is the year when the SA Output Floor will prevail.
Over the 6-year implementation phase of the SA Output Floor, the overall expected increase in capital requirements for corporate IRB pools (“All assets, excl. Defaults”) will be 19% (=56.8%/47.6%).From Figure 11.1.3, everything else being equal, some banks such as ING or Group BPCE will have their corporate portfolio immediately impacted in Year 1 (in the case of ING, the estimated SA Output Floor RW is 37.5%, greater than IRB 24%)[82]. In Year 6, all banks (bar Crédit Agricole) will have a SA Output Floor risk weight that is greater than the IRB risk weight. On average, the switch occurs in Year 4. The overall expected increase in capital requirements for corporate IRB Non-STC securitisations will be 43% (=113.5%/79.4%) over the 6-year implementation phase of the SA Output Floor. This is more than the 19.3% expected increase for the underlying assets. The switch will occur in Year 2. We can, therefore, conclude that Non-STC securitisations of corporate exposures will become less attractive over time in comparison to today’s regulatory regime. This should lead to a contraction of the market for corporate securitisations.
However, with the expected reduction of attractiveness of securitisation, we expect an increase in STC-like securitisations for corporates, as the SA Output Floor impacts earlier the higher quality portfolio. The overall increase of 29% (=50.8%/39.5%) in pool capital requirement narrows the gap with the overall increase of 42% (=76.2%/53.6%) of STC securitisation capital requirement.
Panel b) Non-STC Securitisation
Non-STC Securitisation Year 1 Year 2 Year 3 Year 4 Year 5 Year 6 HSBC (UK) 0.94x 1.03x 1.13x 1.22x 1.31x 1.36x ING (NL) 2.02x 2.22x 2.42x 2.62x 2.82x 2.92x BNP Paribas (FR) 0.92x 1.02x 1.11x 1.20x 1.29x 1.34x Deutsche Bank (DE) 1.12x 1.23x 1.34x 1.45x 1.56x 1.62x Unicredit (IT) 0.97x 1.07x 1.17x 1.26x 1.36x 1.41x Santander (ES) 0.88x 0.97x 1.06x 1.15x 1.24x 1.28x Intesa Sanpaolo (IT) 1.07x 1.17x 1.28x 1.39x 1.49x 1.55x Société Générale (FR) 1.16x 1.28x 1.40x 1.51x 1.63x 1.69x Natwest (UK) 1.06x 1.16x 1.27x 1.37x 1.48x 1.53x Crédit Agricole (FR) 0.79x 0.87x 0.95x 1.03x 1.11x 1.15x UBS (CH) 0.87x 0.96x 1.05x 1.13x 1.22x 1.26x Barclays (UK) 0.86x 0.95x 1.03x 1.12x 1.21x 1.25x Crédit Suisse (CH) 0.81x 0.89x 0.97x 1.05x 1.13x 1.18x Groupe BPCE (FR) 1.28x 1.41x 1.54x 1.67x 1.80x 1.86x Lloyds (UK) 0.83x 0.92x 1.00x 1.08x 1.17x 1.21x Average 0.99x 1.08x 1.18x 1.28x 1.38x 1.43x
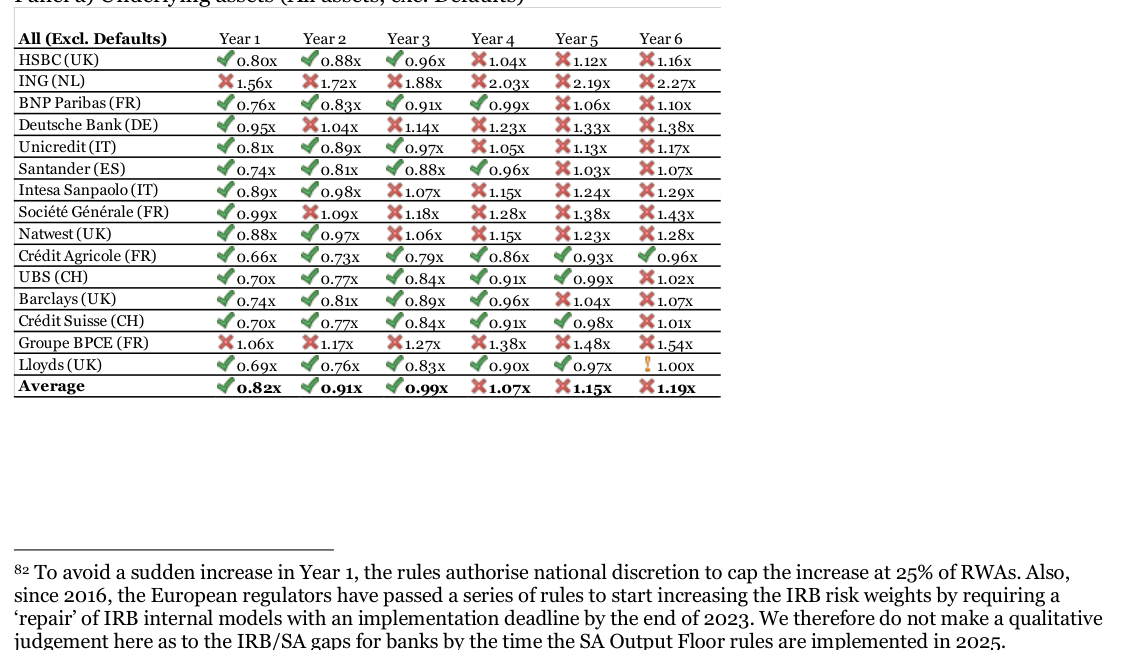
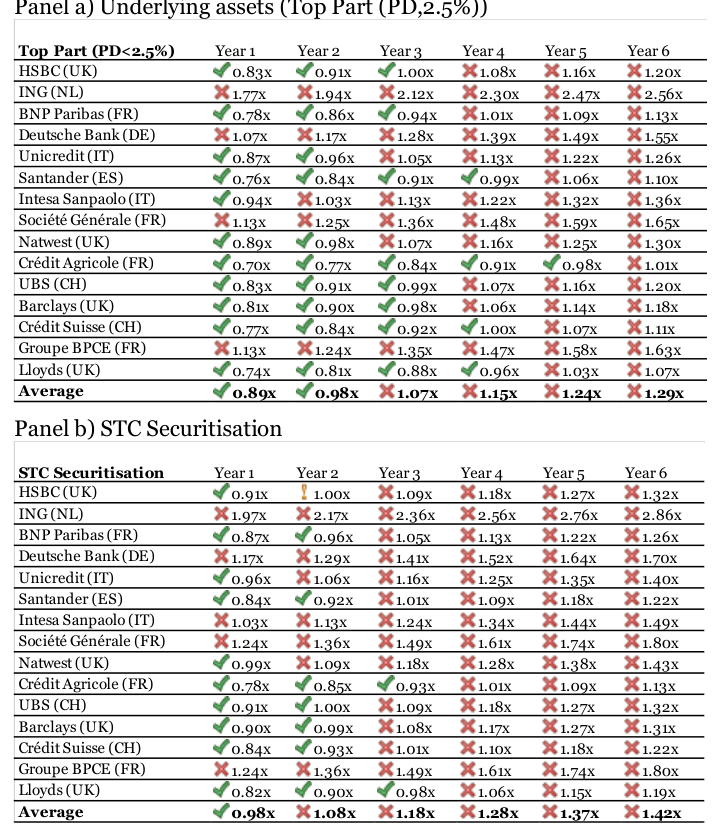
| Corporate Lenders Average | IRB RW (Pre-securitis.) | Year 1 | Year 2 | Year 3 | Year 4 | Year 5 | Year 6 | SA RW (Pre-securitis.) | |||||||||
|---|---|---|---|---|---|---|---|---|---|---|---|---|---|---|---|---|---|
| SA Output Floor Percent. | 50% | 55% | 60% | 65% | 70% | 72.5% | |||||||||||
| Pools: All, excl. Defaults | 47.6% | 39.1% | 43.1% | 47.0% | 50.9% | 54.8% | 56.8% | 78.3% | |||||||||
| Securitisations: Non-STC | 79.4% | 78.3% | 86.1% | 94.0% | 101.8% | 109.6% | 113.5% | 156.6% |
| Corporate IRB RW Lenders Average (Pre-securitis.) | Year 1 | Year 2 | Year 3 | Year 4 | Year 5 | SA RW Year 6 (Pre-securitis.) | |||||||||
|---|---|---|---|---|---|---|---|---|---|---|---|---|---|---|---|
| SA Output Floor Percent. | 50% | 55% | 60% | 65% | 70% | 72.5% | |||||||||
| Pools: Top Part (PD<2.5%) | 39.5% | 35.0% | 38.5% | 42.0% | 45.5% | 49.1% | 50.8% | 70.1% | |||||||
| Securitisations: STC | 53.6% | 52.6% | 57.8% | 63.1% | 68.3% | 73.6% | 76.2% | 105.1% |
11.1.4 Corporate: SRT with the SA Output Floor
Let us assume that banks will only retain the senior tranche (with optimised attachment points) so that the IRB tranche risk weight floor applies. We assume that all the portion below 1.00x K"#$ is placed with investors along with all the mezzanine portion impacted by the medium seniority parameter. From Figure 11.1.1, 31.4% of the pre-securitisation capital remains with the issuing banks. But the recognition of this risk weight is not just the result of the application of a mechanical formula and certain conditions of significant risk transfer (SRT) need to be satisfied to be able to recognise the results from the formula. There are many conditions to satisfy in Europe (some are not in the Basel rulebook). For instance, the significance, commensurateness and effectiveness. One of the ratios to assess commensurateness is the Principle Based Approach (PBA) test whereby a minimum of 50% of the “Regulatory UL”[83] of the underlying portfolio should be transferred to third parties. Therefore, the PBA test fails if this ratio is below 50% (i.e., if the ratio of retained RWAs is greater than 50%), in which case the entire SRT is deemed a failure. If this occurs, the RWA of the tranches calculated by the securitisation approaches (SEC-IRBA or SEC-SA) need to be replaced by the RWAs of the underlying pool of assets.
Summary results of the SRT Analysis are provided in Table 11.1.5 (with details per corporate lender in Table A6.5.1 and A6.5.2 in the Data Annexes). Optimised IRB senior tranches from Non-STC transactions, currently with a 15% risk weight, will have an average risk weight of 66.5% after application of the SA Output Floor, i.e., a 343% increase. The average attachment point of optimised IRB senior tranches, currently at 1.44 times the Presecuritisation IRB pool risk weight (equivalent to 1.32x of K"#$ when the effect of non-recognition of FMI is added), representing 5.6% of the capital structure, are then translated into an average of 0.89 times the presecuritisation SA pool risk weight. On average, the IRB senior tranches would then contain 110.8% of the presecuritisation SA pool RWAs. In other words, the senior tranche has an average SA RWA that is greater than the SA RWA of the pool itself, without any credit enhancement.
Is the situation better for STC-type SRT transactions? Optimised IRB senior tranches from STC transactions, currently with a 10% risk weight, will have an average risk weight of 45.5% after application of the SA Output Floor, a 355% increase. The average attachment point of optimised IRB senior tranches, currently at 1.11 times the Pre-securitisation IRB pool risk weight (equivalent to 1.14x of K"#$ when the effect of non-recognition of FMI is added), representing 3.6% of the capital structure, are then translated into an average of 0.64 times the pre-securitisation SA pool risk weight. On average, the IRB senior tranches would then contain 86.4% of the pre-securitisation SA pool RWAs.
Needless to say, as per the last column of Table A6.5.1, all bar one SRT corporate transactions currently optimised for Non-STC SEC-IRBA will fail the PBA test by the time of the implementation of the SA Output Floor.[84] This failure is not just a question of ratio between the IRB pool RW and the SA Output Floor applied to the SA pool RW. It is also a question of having to calculate the SRT tests under SEC-SA in the first place, with securitisation capital structures that have been designed to satisfy Non-STC SEC-IRBA. And, as described in Table A6.5.1, all SRT corporate transactions currently optimised for STC SEC-IRBA will fail the PBA test by the time of the implementation of the SA Output Floor.
It is our view that all efficient IRB SRT transactions, currently approved by regulators, will fail with the implementation of the SA Output Floor, at least for corporate assets. One cannot make a direct economic assessment of this expected failure rate. There are several outcomes: either the legislators change the rules currently proposed by the regulators, or banks will cease using securitisation altogether for the purpose of managing their risk. They will, however, continue using securitisation for other reasons,[85] with highly specialised portfolio, leading to a reduction in the SRT investor base. Another outcome is that the anticipated reduction in the risk transfer technology will push banks to increase their use of insurance instruments. We might even see the establishment of quasi-sovereigns or supranationals that are not subject to Basel rules (similar to the US model) who will take a proportional risk (like US SBA) or a tranched risk (like European EIF). These institutions will then in turn use the securitisation technique to off-load risk (like US Fannie Mae).
| Table | 11.1.5 – | Corporate | –SRT | Analysis | ||||||||
|---|---|---|---|---|---|---|---|---|---|---|---|---|
| IRB | Senior | |||||||||||
| Pre- | IRB Senior | tranche | tranche | RWA as | ||||||||
| SRT | Considerations | for | ||||||||||
| Securitisation | Attachment | Point | (A) | IRB Senior | tranche | RW | % of Pool | RWA | ||||
| IRB | Senior | tranches | ||||||||||
| ≤50%, | ||||||||||||
| Pool | RW | expressed | as: | (Pass | ||||||||
| Fail>50%) | ||||||||||||
| Mult. | Mult. | Final | ||||||||||
| % of | ||||||||||||
| Corporate | IRB | SA | SEC- | SEC- | SA | Retain. | Retain. | |||||
| IRB | SA | Cap. | ||||||||||
| Lenders | Average | Pool | Pool | IRBA | SA | Output | IRB | SA | ||||
| Struc. | ||||||||||||
| Cap. | Cap. | Floor | ||||||||||
| Pools: | All, excl. | Defaults | ||||||||||
| 47.6% | 78.3% | 5.6% | 1.44x | 0.89x | 15.0% | 91.7% | 66.5% | 31.4% | 110.8% | |||
| Securitisations: | Non-STC | |||||||||||
| Pools: | Top Part | (PD<2.5%) | ||||||||||
| 39.5% | 70.1% | 3.6% | 1.11x | 0.64x | 10.0% | 62.8% | 45.5% | 25.8% | 86.4% | |||
| Securitisations: | STC |
11.2 Securitisations with SMEs (excl. Retail)
This section is concerned with regulatory SME corporate exposures (excluding SME retail exposures).
11.2.1 SME: SEC-IRBA with Pool IRB RW
In addition to the risk parameters provided from the SME lenders Pillar 3 disclosures, we use a granularity of 150 for securitised SME pool and a non-risk parameter of 5 years for tranche maturity in order to enable the computation of the p-factor under SEC-IRBA. This applies both for Non-STC and STC securitisations.
When taking the SME corporate exposures portfolio characteristics (“All, excl. Defaults”) of the Pillar 3 reports as representative of securitised SME pools (excluding SME retail), the average EAD-weighted risk weight across the 10 banks in the sample (Data Annex 7) is 53.8%, with a very wide dispersion between the pool with the lowest at 33.7% and the highest at 87.1%. The average EAD-weighted PD for the pools is 2.80% (a high level of risk for an average value) and the average EAD-weighted LGD is 34.18% (thus, a proxy for the implicit one-year expected loss for non-defaulted assets is 95.7 bps). Details for each bank are provided in Table A7.1.1.
When the lower risk part of those pools is taken (“Top Part (PD<2.5%)”), the average EAD-weighted risk weight across the 10 banks in the sample is 42.3%, with a wide dispersion between the pool with the lowest at 27.0% and the highest at 58.6%. The average EAD-weighted PD for the pools is 0.80% and the average EAD-weighted LGD is 34.77% (hence, a proxy for the implicit one-year expected loss for non-defaulted assets is 27.8 bps). Details for each bank are provided in Table A7.1.2.
When using SEC-IRBA, for the pools “All, excl. Default” and Non-STC securitisations, the average Post/Presecuritisation Capital Multiplier is 1.81x. This means that the capital of all tranches (if kept in the regulated banking system) has increased by 81% by the mere action of securitising, even though no additional credit risk has been added to the underlying pool. The lowest capital multiplier is 1.65x and the highest of 1.89x, a fair range between the minimum and maximum.
For the pools “Top Part (PD<2.5%)” and STC securitisations, the average Post/Pre-securitisation Capital Multiplier is 1.41x, i.e., a 41% increase just due to the act of securitising. The lowest capital multiplier is 1.39x and the highest of 1.43x, a very narrow range indicating that there has been a loss of risk sensitivity. Indeed, under the STC the ‘p’ values for all 15 lenders drops to 30%, the so-called ‘p-floor’. Whereas, for Non-STC, the ‘p’ values for senior tranches varied from 43.9% to 51.4% (average 46.4%) and from 52.6% to 56.9% (average 54.6%) for non-senior tranches.
The key IRB values are summarised in Table 11.2.1.
We can distinguish the content of the Post/Pre-securitisation Capital Multiplier into four main components, as described in the corporate section 5.1.1. The waterfall breakdown of the increased components, 80.7% for Non- STC securitisations is given in Panel a) of Figure 11.2.1. and the 40.8% is given in Panel b).
For Non-STC securitisations, the non-recognition of FMI counts for 22.4% of the pool RWAs while the medium seniority contribution for 29.7% of the pool RWAs and the senior tranche risk weight floor of 15% account for 28.6% of the pool RWAs. Together, the medium seniority and the risk weight floor components make up for an average of 58.3% of the pool RWAs, to be compared with the average p-factor value for the non-senior tranches of 54.6%.
For STC securitisations, the non-recognition of FMI counts for 8.3% of the pool RWAs. The medium seniority contribution for 7.5% of the pool RWAs and the senior tranche risk weight floor of 10% contribute to 25.0% of the pool RWAs. Together, the medium seniority and the risk weight floor components count for an average of 32.5% of the pool RWAs, to be compared with the average p-factor value for the non-senior tranches of 30.0%.
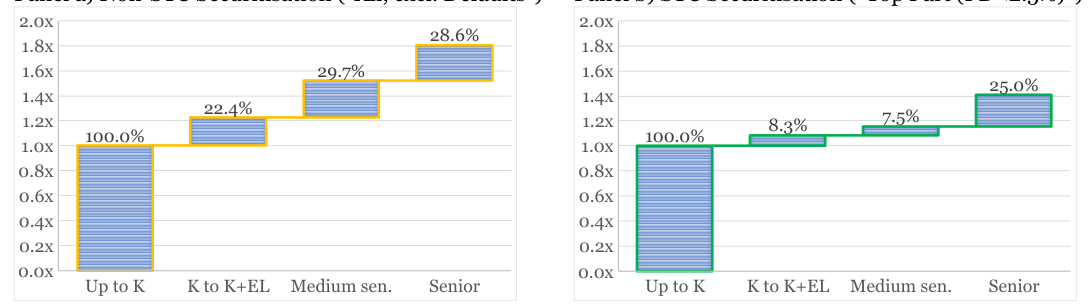
| Inputs | from Pillar 3 | reports | SEC-IRBA | Results | |||
|---|---|---|---|---|---|---|---|
| SME | Pool | EAD- | Pool EAD- | Pool EAD- | Tranches EAD- | Post/Pre- | |
| Lenders | Average | weighted PD | weighted LGD | weighted RW | weighted RW | securitisation | |
| (Pre-securitisation) | (Post-securitisat.) | Capital Multiplier | |||||
| with SEC-IRBA | |||||||
| Pools: All, excl. | Defaults | ||||||
| 2.80% | 34.18% | 53.8% | 97.7% | 1.81x | |||
| Securitisations: | Non-STC | ||||||
| Pools: Top Part | (PD<2.5%) | ||||||
| 0.80% | 34.77% | 42.3% | 59.5% | 1.41x | |||
| Securitisations: | STC | ||||||
| It is our view | that the American | legislators will | not implement the | European rules | when | discussing the | implementation |
| the Basel | implementation, as | commensurateness | is a European gold | plating. |
11.2.2 SME: SEC-SA with Pool SA RW
For this part, we take the SA risk weight for SME pools as 85%, regardless of the PD distribution and we take as a core assumption that all the SME exposures are unrated. We simulate new securitisations with zero delinquencies at issuance date. Therefore, all 10 SME lenders will have the same Post/Pre-securitisation Capital Multiplier of 2.00x for Non-STC securitisations and 1.50x for STC securitisations. The optimised senior tranche attachment point is 2.96x K% (10.1% of the capital structure) for Non-STC and 1.79x K% (12.2% of the capital structure) for STC. The key figures are provided in Table 11.2.2.
Figure 11.2.2 shows the average breakdown of the four components of the 100% capital requirement increase for Non-STC securitisation (Panel a) and for the 50% capital requirement increase (Panel b):
• 1st component: 100%, the SA pool RWAs of the underlying pool.
• 2nd component: 0%, as the SA approach does not create a mismatch between post and presecuritisation because the FMI is not recognised under the SA approach for the underlying assets. We add it here to enable proper like-for-like comparisons with the components of the SEC-IRBA capital increases in Figure 11.2.1.
• 3rd component: Non-STC medium seniority: 85.9% of pool RWAs; compared to 39.7% of pool RWAs for STC.
• 4th component: the senior tranche risk weight floor at 15% for Non-STC represents 14.1% of pool RWAs; and for STC, the 10% floor represents 10.3% of pool RWAs.
The third and fourth components, when summed up are exactly equal to the ‘p’ of 100% for SEC-SA for Non- STC and 50% for STC that is applied to securitisation (all, including non-senior) tranches.
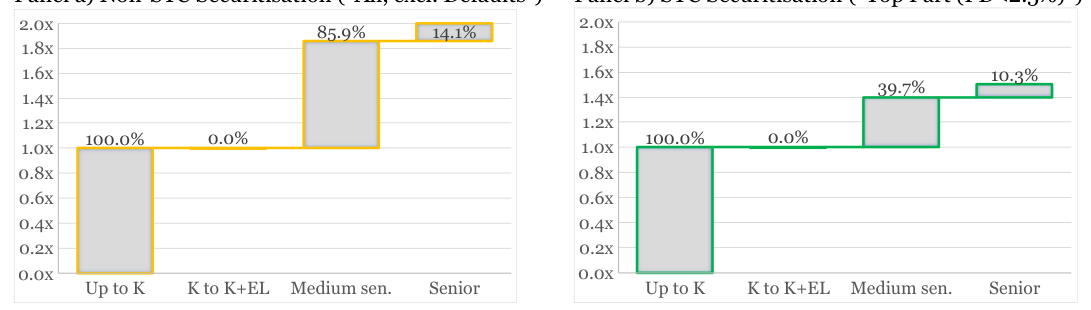
| Optimised Senior | Tranche | Post/Pre- | ||||
|---|---|---|---|---|---|---|
| SME | Attachment Point | Pool EAD- | Tranches EAD- | securitisation | ||
| Lenders | Average | As % capital | As multiplier | weighted RW | weighted RW | Capital Multiplier |
| structure | of | (Pre-securitisation) | (Post-securitisat.) | with SEC-SA | ||
| Pools: All, excl. | Defaults | K% | ||||
| 20.1% | 2.96x | 85.0% | 170.0% | 2.00x | ||
| Securitisations: | Non-STC | |||||
| Pools: Top Part | (PD<2.5%) | |||||
| 12.2% | 1.79x | 85.0% | 127.5% | 1.50x | ||
| Securitisations: | STC |
11.2.3 SME: SA Output Floor Implementation
The implementation of the SA Output Floor is the same for all SME lenders, and provided in Table 11.2.3 and Table 11.2.4.
To assess which banks would be impacted (when looking at the regulatory asset class level, rather than at the bank wide level), we can calculate the ratio of the SA Output Floor RW to the IRB RW. When a ratio is below 1.00x then the IRB method will prevail, and when above 1.00x the SA Output Floor will prevail. Figure 11.2.3 (for Non-STC) and Figure 11.2.4 (for STC) shows a green tick when IRB prevails, and a red cross when the SA Output Floor will prevail. Panel a) of those figures concern the asset side and Panel b) the securitisation side. The move from a green tick to a red cross is the year when the SA Output Floor will prevail.
Panel b) Non-STC Securitisation
Non-STC Securitisation Year 1 Year 2 Year 3 Year 4 Year 5 Year 6 Intesa Sanpaolo (IT) 0.73x 0.80x 0.88x 0.95x 1.02x 1.06x Unicredit (IT) 1.30x 1.43x 1.56x 1.68x 1.81x 1.88x Banco BPM (IT) 1.27x 1.39x 1.52x 1.65x 1.77x 1.84x MPS (IT) 0.89x 0.98x 1.06x 1.15x 1.24x 1.29x KBC (BE) 1.53x 1.68x 1.83x 1.99x 2.14x 2.22x Belfius (BE) 0.69x 0.76x 0.83x 0.90x 0.96x 1.00x Santander (ES) 0.70x 0.77x 0.84x 0.91x 0.98x 1.02x CaixaBank (ES) 0.99x 1.09x 1.19x 1.29x 1.39x 1.44x BBVA (ES) 0.52x 0.57x 0.62x 0.67x 0.72x 0.75x Sabadell (ES) 1.04x 1.15x 1.25x 1.35x 1.46x 1.51x Average 0.87x 0.96x 1.04x 1.13x 1.22x 1.26x
The overall expected increase in capital requirements for corporate IRB pools (“All assets, excl. Defaults”) will be 14% (=61.6%/53.8%) over the 6-year implementation phase of the SA Output Floor. From Figure 11.1.3, everything else being equal, 4 banks out of 10 will stay in IRB mode (for details see Table A7.3.3) whereas 6 banks will be impacted by the SA Output Floor. On average, the switch occurs in Year 4. At the end of the 6-year implementation phase of the SA Output Floor, the overall expected increase in capital requirements for corporate IRB Non-STC securitisations will be 26% (=123.3%/97.7%). This is more than the 14% expected increase for the underlying assets. The switch will occur in Year 3. We can thus conclude that Non-STC securitisations of SME corporate exposures (excluding SME Retail) will become less attractive over time, compared to today’s regulatory regime. This should lead to a contraction of the market for SME securitisations.
However, within an expected reduction of attractiveness of securitisation, we expect an increase in STC-like securitisations for corporates because the SA Output Floor impacts earlier the higher quality portfolio and the overall increase in capital requirements 46% (=61.6%/42.3%) for the pool narrows the gap with the overall increase of 55% (=92.5%/59.5%) for STC securitisations.
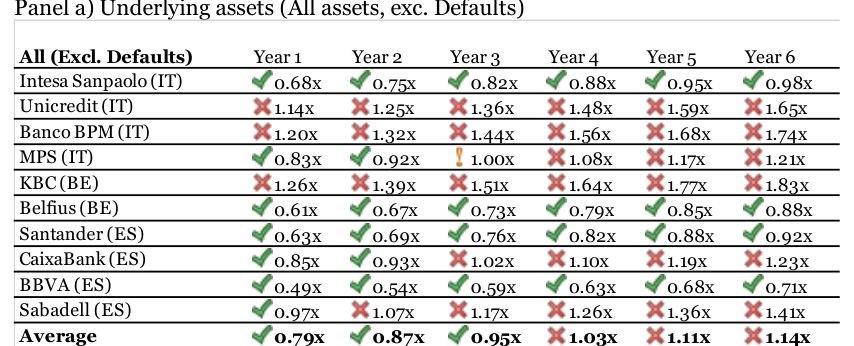
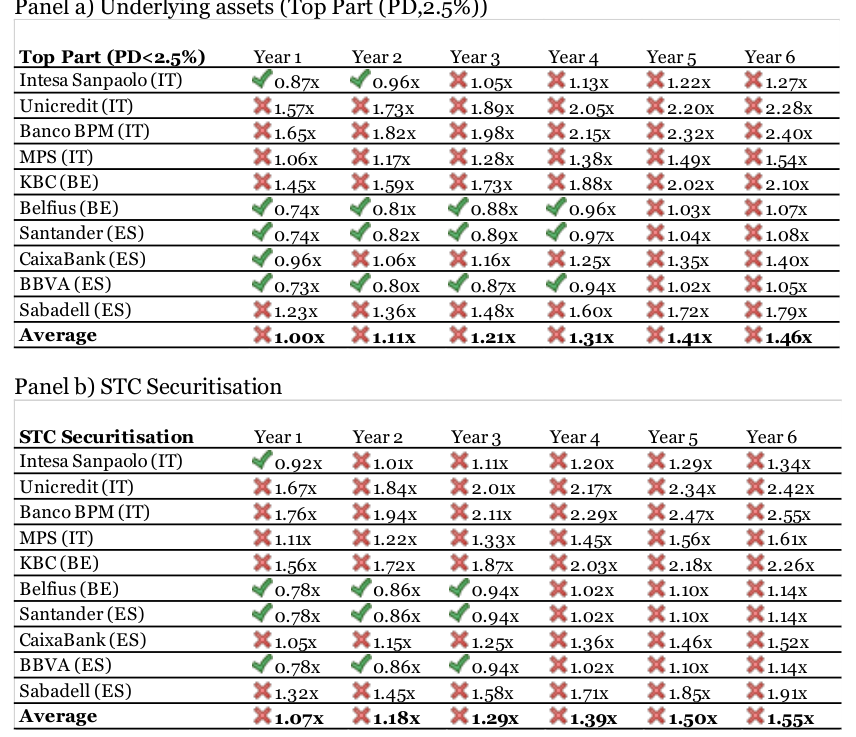
| SME IRB RW Lenders Average (Pre-securitis.) | Year 1 | Year 2 | Year 3 | Year 4 | Year 5 | SA RW Year 6 (Pre-securitis.) | |||||||||
|---|---|---|---|---|---|---|---|---|---|---|---|---|---|---|---|
| SA Output Floor Percent. | 50% | 55% | 60% | 65% | 70% | 72.5% | |||||||||
| Pools: All, excl. Defaults | 53.8% | 42.5% | 46.8% | 51.0% | 55.3% | 59.5% | 61.6% | 85.0% | |||||||
| Securitisations: Non-STC | 97.7% | 85.0% | 93.5% | 102.0% | 110.5% | 119.0% | 123.3% | 170.0% |
| SME IRB RW Lenders Average (Pre-securitis.) | Year 1 | Year 2 | Year 3 | Year 4 | Year 5 | SA RW Year 6 (Pre-securitis.) | |||||||||
|---|---|---|---|---|---|---|---|---|---|---|---|---|---|---|---|
| SA Output Floor Percent. | 50% | 55% | 60% | 65% | 70% | 72.5% | |||||||||
| Pools: Top Part (PD<2.5%) | 42.3% | 42.5% | 46.8% | 51.0% | 55.3% | 59.5% | 61.6% | 85.0% | |||||||
| Securitisations: STC | 59.5% | 63.8% | 70.1% | 76.5% | 82.9% | 89.3% | 92.5% | 127.5% |
11.2.4 SME: SRT with the SA Output Floor
The key results for the PBA tests are provided in Table 11.2.5. Details are for individual SME lenders are provided in Tables A7.5.1 and A7.5.2. Interpretation for those tables is given section 5.1.4.
The main conclusion is that all bar one Non-STC SME securitisations, as currently optimised under SEC- IRBA with realistic (i.e., corresponding to Pillar 3 disclosures) SME pool characteristics, are expected to fail the PBA test. Indeed, optimised senior attachment points are on average at 1.65x the pool IRB risk weight, which would become 1.10x the pool SA risk weight. The only exception would be pools with risk characteristics similar to the BBVA data. Indeed, BBVA has an unusually high-risk weight of 87.1% for its IRB SME pool, higher than the 85% SA RW. The optimised attachment point of the senior tranche is therefore already high at 14.3% of the capital structure.
When the characteristics of the pools “Top Part (PD<2.5%)” of the banks’ SME exposures are used to calculate the STC securitisations results, we can perform the PBA test (Table A7.5.2). The results: they all fail without exceptions.
| SRT Considerations | for | Securitisation | Attachment Point | (A) | IRB Senior | tranche | RW | % of Pool | RWA | |
|---|---|---|---|---|---|---|---|---|---|---|
| IRB Senior | tranches | |||||||||
| ≤50%, | ||||||||||
| Pool | RW | expressed as: | (Pass | |||||||
| Fail>50%) | ||||||||||
| Mult. | Mult. | Final | ||||||||
| % of | ||||||||||
| SME | IRB | SA | SEC- | SEC- | SA | Retain. | Retain. | |||
| IRB | SA Cap. | |||||||||
| Lenders | Average | Pool | Pool | IRBA | SA | Output | IRB | SA | ||
| Struc. | ||||||||||
| Cap. | Cap. | Floor | ||||||||
| Pools: All, excl. | Defaults | |||||||||
| 53.8% | 85.0% 7.4% | 1.65x | 1.09x | 15.0% | 89.0% | 64.5% | 28.6% | 98.2% | ||
| Securitisations: | Non-STC | |||||||||
| Pools: Top Part | (PD<2.5%) | |||||||||
| 42.3% | 85.0% 4.1% | 1.18x | 0.60x | 10.0% | 79.1% | 57.3% | 25.0% | 89.6% | ||
| Securitisations: | STC |
11.3 Securitisations with Residential Mortgages
This section is concerned with regulatory retail residential mortgage exposures.
11.3.1 Residential Mortgages: SEC-IRBA with Pool IRB RW
In addition to the risk parameters provided from the Residential Mortgage lenders Pillar 3 disclosures, we are using a non-risk parameter of 5 years for tranche maturity in order to enable the computation of the p-factor under SEC-IRBA. This applies for both Non-STC and STC securitisations.
When taking the residential mortgage exposures portfolio characteristics (“All, excl. Defaults”) of the Pillar 3 reports as representative of securitised residential mortgage pools, the average EAD-weighted risk weight across the 16 banks in the sample (Data Annex 8) is 11.2%, with a wide dispersion between the pool with the lowest at 6.0% and the highest at 16.5%. The average EAD-weighted PD for the pools is 0.96% and the average EAD-weighted LGD is 13.14% (therefore, a proxy for the implicit one-year expected loss for non-defaulted assets is 12.6 bps). Details for each bank are provided in Table A8.1.1.
When the lower risk part of those pools is taken (“Top Part (PD<2.5%)”), the average EAD-weighted risk weight across the 16 banks in the sample is 8.9%, with a very wide dispersion between the pool with the lowest at 5.3% and the highest at 16.4%. The average EAD-weighted PD for the pools is 0.47% and the average EAD-weighted LGD is 13.10% (a proxy for the implicit one-year expected loss for non-defaulted assets is thus 6.2 bps). Details for each bank are provided in Table A8.1.2.
When using SEC-IRBA for the pools “All, excl. Default” and Non-STC securitisations, the average Post/Presecuritisation Capital Multiplier is 2.51x, meaning that the capital of all tranches (if kept in the regulated banking system) has increased by 151% by the mere action of securitising. This is despite the fact that no additional credit risk has been added to the underlying pool. The lowest capital multiplier is 2.38x and the highest of 2.63x, a fair range between the minimum and maximum. The Non-STC ‘p’ values for senior tranches varied from 115.9% to 126.3% (average 121.7%) and from 131.8% to 139.9% (average 136.3%) for non-senior tranches.
For the pools “Top Part (PD<2.5%)” and STC securitisations, the average Post/Pre-securitisation Capital Multiplier is 1.77x, i.e., a 77% increase just due to the act of securitising. The lowest capital multiplier is 1.69x and the highest of 2.03x, a fair range between the minimum and maximum. The STC ‘p’ values for senior tranches varied from 58.0% to 65.1% (average 61.8%) and from 66.0% to 71.5%% (average 68.9%) for nonsenior tranches.
The key IRB values are summarised in Table 11.3.1.
We can separate the content of the Post/Pre-securitisation Capital Multiplier into its four main components, as described in the corporate section 5.1.1. When the senior tranche attachment points are optimised, because the risk weights of the underlying pool are very low compared to the senior tranche risk weight floor, a numerical aberration occurs with the regulatory formula, and there is ‘negative smoothing’ if one were to divide the capital increase multiplier into its four components as in Figure 11.3.1. Data Annex 8 explains this in details. But when the attachment point of the senior tranche is not optimised, in the sense that it is set such that it cannot go lower than 1.00x K"#$, a more classic waterfall appears as in Figure 11.3.2. What is common between the two set of figures is the disproportionate weight of the senior tranche risk weight floor, which at 15% for non-STC securitisations represents 144% of the pool RWAs and for STC securitisations 124% of RWAs. Any situation where the senior tranche RWAs is more than the pool RWAs demonstrates mathematically the flaws in the regulatory formula. This is the regulatory equivalent of “demonstration par l’absurde” in mathematics.
Figure 11.3.2 – Residential Mortgages – Average components of capital requirement increase for SEC-IRBA with senior tranche attachment points at least equal to 1.0x K"#$ (not optimised) Panel a) Non-STC Securitisation (“All, excl. Defaults”) Panel b) STC Securitisation (“Top Part (PD<2.5%)”) 3.0x 3.0x 144.1%
2.5x 2.5x 124.0%
2.0x 2.0x
1.5x 1.5x 16.1% 12.9% 7.5% 0.3% 100.0% 100.0% 1.0x 1.0x
0.5x 0.5x
0.0x 0.0x Up to K K to K+EL Medium sen. Senior Up to K K to K+EL Medium sen. Senior
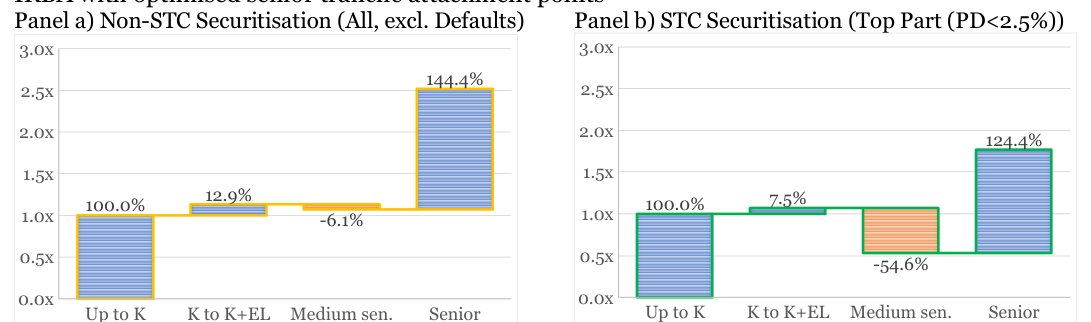
| Table 11.3.1 – | Residential | Mortgage Securitisations – | Key Average IRB | values | |
|---|---|---|---|---|---|
| Inputs from Pillar 3 | reports | SEC-IRBA | Results | ||
| Residential | Mortgage Pool | EAD- Pool EAD- | Pool EAD- | Tranches EAD- | Post/Pre- |
| Lenders | Average | weighted PD weighted LGD | weighted RW | weighted RW | securitisation |
| (Pre-securitisation) | (Post-securitisat.) | Capital Multiplier | |||
| with SEC-IRBA | |||||
| Pools: All, excl. | Defaults | ||||
| 0.96% 13.14% | 11.2% | 28.3% | 2.51x | ||
| Securitisations: | Non-STC | ||||
| Pools: Top Part | (PD<2.5%) | ||||
| 0.47% 13.10% | 8.9% | 15.6% | 1.77x | ||
| Securitisations: | STC |
11.3.2 Residential Mortgages: SEC-SA with Pool SA RW
Since the LTV is be the primary factor of risk weight allocation for residential mortgages, each lender would have an average risk weight that depends on its product range. Pillar 3 reports do not contain such disclosure and LTV values cannot be easily extrapolated from the PD or LGD breakdown. We will therefore take the current lowest value for mortgage risk weight, i.e., 35% as a potential future point of reference under the Final standards, regardless of the PD distribution. We simulate new securitisations with zero delinquencies at issuance date.
Because of this, all 16 residential mortgage lenders will have the same Post/Pre-securitisation Capital Multiplier of 2.00x for Non-STC securitisations and 1.50x for STC securitisations. The optimised senior tranche attachment point is 1.90x K% (5.3% of the capital structure) for Non-STC and 1.30x K% (3.6% of the capital structure) for STC. The key figures are provided in Table 11.3.2.
Figure 11.3.2 shows the average breakdown of the four components of the 100% capital requirement increase for Non-STC securitisation (Panel a)) and for the 50% capital requirement increase (Panel b)):
• 1st component: 100%, the SA pool RWAs of the underlying pool.
• 2nd component: 0%, as the SA approach does not create a mismatch between post and presecuritisation, as the FMI is not recognised under the SA approach for the underlying assets.
• 3rd component: Non-STC medium seniority: 59.3% of pool RWAs; compared to 22.5% of pool RWAs for STC.
• 4th component: the senior tranche risk weight floor at 15% for Non-STC represents 40.7% of pool RWAs; and for STC, the 10% floor represents 27.5% of pool RWAs. The third and fourth components when summed up are exactly equal to the ‘p’ of 100% for SEC-SA for Non- STC and 50% for STC that is applied to securitisation (of all, including non-senior) tranches.
The main conclusion drawn from Figure 11.3.2 compared to Figure 11.3.1, is that under SEC-SA, the calibration of the p-factor matters. Whatever is not absorbed by the senior tranche risk weight floor reappears in the medium seniority component. Additionally, for Non-STC securitisations, the proportion of the RWAs for the senior tranche, 40.7% of the pool’s RWAs, with an average attachment point at 1.90x (almost two times capital as credit enhancement), is clearly disproportionate.
Regarding STC securitisations, for a more reasonable attachment point at 1.30x capital, the senior tranche component has close to a third of the RWAs of the pool. While the attachment point is reasonable, the medium seniority component is too low – it should be higher, and the increase should be taken from the first component by discounting the portion up to 1.0x pool capital. The technique and justification for this is out of scope of this paper.
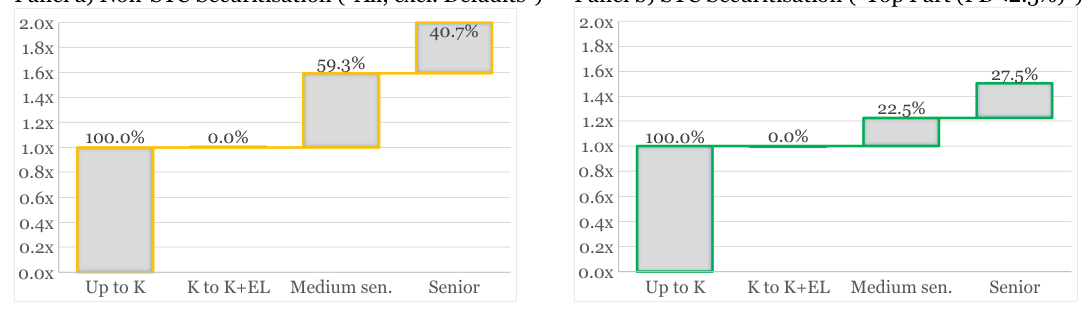
| Optimised Senior | Tranche | Post/Pre- | ||||
|---|---|---|---|---|---|---|
| Residential | Mortgage | Attachment Point | Pool EAD- | Tranches EAD- | securitisation | |
| Lenders | Average | As % capital | As multiplier | weighted RW | weighted RW | Capital Multiplier |
| structure | of | (Pre-securitisation) | (Post-securitisat.) | with SEC-SA | ||
| Pools: All, excl. | Defaults | K% | ||||
| 5.3% | 1.90x | 35.0% | 70.0% | 2.00x | ||
| Securitisations: | Non-STC | |||||
| Pools: Top Part | (PD<2.5%) | |||||
| 3.6% | 1.30x | 35.0% | 52.5% | 1.50x | ||
| Securitisations: | STC |
11.3.3 Residential Mortgages: SA Output Floor Implementation
The implementation of the SA Output Floor is the same for all residential mortgage lenders, and provided in Table 11.3.3 and Table 11.3.4.
To assess which banks would be impacted (when looking at the regulatory asset class level, rather than at the bank wide level), we can calculate the ratio of the SA Output Floor RW to the IRB RW. When a ratio is below 1.00x then the IRB method will prevail, and when above 1.00x the SA Output Floor will prevail. Figure 11.3.3 (for Non-STC) and Figure 11.3.4 (for STC) shows a green tick when IRB prevails, and a red cross when the SA Output Floor will prevail. Panel a) of those figures concern the asset side and Panel b) the securitisation side. The move from a green tick to a red cross is the year when the SA Output Floor will prevail.
Panel b) STC Securitisation
STC Securitisation Year 1 Year 2 Year 3 Year 4 Year 5 Year 6 Lloyds (UK) 1.55x 1.71x 1.86x 2.02x 2.17x 2.25x Nationwide (UK) 2.63x 2.89x 3.15x 3.41x 3.68x 3.81x Santander UK 0.90x 0.99x 1.07x 1.16x 1.25x 1.30x Natwest (UK) 1.96x 2.16x 2.35x 2.55x 2.74x 2.84x Barclays (UK) 1.24x 1.36x 1.48x 1.61x 1.73x 1.79x ING (NL) 2.00x 2.20x 2.40x 2.60x 2.80x 2.90x Rabobank (NL) 2.36x 2.60x 2.84x 3.07x 3.31x 3.43x ABN Amro (NL) 2.14x 2.36x 2.57x 2.78x 3.00x 3.11x Santander Group (ES) 1.49x 1.64x 1.79x 1.94x 2.09x 2.16x CaixaBank (ES) 1.22x 1.35x 1.47x 1.59x 1.71x 1.78x BBVA (ES) 1.79x 1.97x 2.15x 2.33x 2.51x 2.60x Sabadell (ES) 1.28x 1.41x 1.53x 1.66x 1.79x 1.85x Groupe BPCE (FR) 2.56x 2.82x 3.08x 3.33x 3.59x 3.72x BNP Paribas (FR) 1.90x 2.09x 2.28x 2.46x 2.65x 2.75x Crédit Agricole (FR) 2.63x 2.89x 3.15x 3.41x 3.68x 3.81x Société Générale (FR) 1.80x 1.98x 2.16x 2.34x 2.52x 2.61x Average 1.68x 1.85x 2.01x 2.18x 2.35x 2.43x
The impact for the underlying assets is clear: the SA Output Floor will start immediately for all IRB banks in the sample (unless our assumption of 35% as a central point is too high or unless the IRB risk weight have been substantially increased to a 20% level prior to the first year of implementation via the various regulatory interventions that are taking place with regards to the appropriateness of IRB models). IRB Residential Mortgage banks will see a substantial increase in RWAs for the underlying pool, average of 127% (=25.4%/11.2%) for “All, excl. Defaults” and 186% (=25.4%/8.9%) for “Top Part (PD<2.5%)”.[86]
In this context, does the 80% (=50.8%/28.3%) increase in RWAs for Non-STC securitisations, and the 43% (=38.1%/15.6%) for STC securitisations, matter? The answer is “Not really”. Indeed, what will matter is the ratio of the senior risk tranche risk weight to the underlying pool risk weight. This is the key ratio that is being assessed when executing a securitisation with risk transfer.
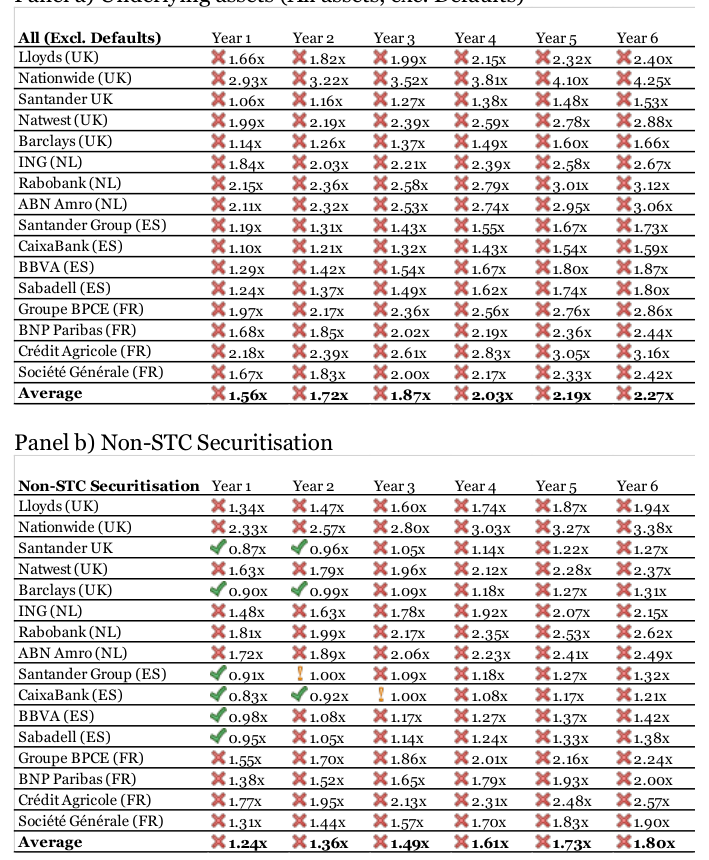
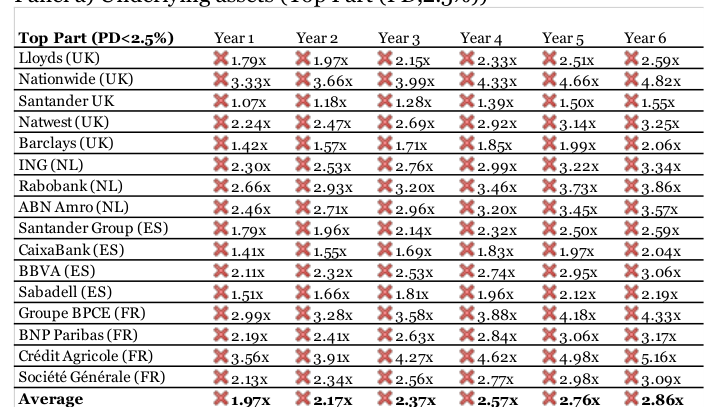
| Residential Mortgage IRB RW Lenders Average (Pre-securitis.) | Year 1 | Year 2 | Year 3 | Year 4 | Year 5 | SA RW Year 6 (Pre-securitis.) | |||||||||
|---|---|---|---|---|---|---|---|---|---|---|---|---|---|---|---|
| SA Output Floor Percent. | 50% | 55% | 60% | 65% | 70% | 72.5% | |||||||||
| Pools: All, excl. Defaults | 11.2% | 17.5% | 19.3% | 21.0% | 22.8% | 24.5% | 25.4% | 35.0% | |||||||
| Securitisations: Non-STC | 28.3% | 35.0% | 38.5% | 42.0% | 45.5% | 49.0% | 50.8% | 70.0% |
| Residential Mortgage IRB RW Lenders Average (Pre-securitis.) | Year 1 | Year 2 | Year 3 | Year 4 | Year 5 | SA RW Year 6 (Pre-securitis.) | |||||||||
|---|---|---|---|---|---|---|---|---|---|---|---|---|---|---|---|
| SA Output Floor Percent. | 50% | 55% | 60% | 65% | 70% | 72.5% | |||||||||
| Pools: Top Part (PD<2.5%) | 8.9% | 17.5% | 19.3% | 21.0% | 22.8% | 24.5% | 25.4% | 35.0% | |||||||
| Securitisations: STC | 15.6% | 26.3% | 28.9% | 31.5% | 34.1% | 36.8% | 38.1% | 52.5% |
11.3.4 Residential Mortgages: SRT with the SA Output Floor
The key results for the PBA tests are provided in Table 11.2.5. Details are for individual residential mortgage lenders are provided in Tables A8.5.1 and A8.5.2. Interpretation for those tables is given section 5.1.4.
All SRT transactions, with optimised senior attachment points, fail in SEC-IRBA and in SEC-SA. The underlying IRB risk weights are just too low. They would only work with other techniques (SEC-ERBA where rating agencies methodology arbitrage occurs with recognition of excess spread, or with high risk weight pools with low quality collateral).
However, once the SA Output Floor takes effect, we expect potential securitisation transactions to be structured around SEC-SA rather than SEC-IRBA because the senior tranche risk weight will become materially lower than the pool risk weights. In other words, increase in RMBS with risk transfer will not occur because of the various advantages that the securitisation technique offers, but instead because the financial burden in increasing capital requirement for the underlying pools will be quite high.
| SRT Considerations | for | Securitisation | Attachment Point | (A) | IRB Senior | tranche | RW | % of Pool | RWA | |
|---|---|---|---|---|---|---|---|---|---|---|
| IRB Senior | tranches | |||||||||
| ≤50%, | ||||||||||
| Pool | RW | expressed as: | (Pass | |||||||
| Fail>50%) | ||||||||||
| Mult. | Mult. | Final | ||||||||
| % of | ||||||||||
| Residential | Mortgage | IRB | SA | SEC- | SEC- | SA | Retain. | Retain. | ||
| IRB | SA Cap. | |||||||||
| Lenders | Average | Pool | Pool | IRBA | SA | Output | IRB | SA | ||
| Struc. | ||||||||||
| Cap. | Cap. | Floor | ||||||||
| Pools: All, excl. | Defaults | |||||||||
| 11.2% | 35.0% 1.1% | 1.10x | 0.40x | 15.0% | 56.7% | 41.1% | 144.4% | 160.4% | ||
| Securitisations: | Non-STC | |||||||||
| Pools: Top Part | (PD<2.5%) | |||||||||
| 8.9% | 35.0% 0.5% | 0.53x | 0.16x | 10.0% | 47.0% | 34.1% | 124.4% | 133.7% | ||
| Securitisations: | STC |
11.4 Securitisations with Auto and Consumer loans (Retail – Other)
This section is concerned with regulatory category ‘Retail – Other’. Auto loans and consumer loans would be in this category.
11.4.1 ‘Retail – Other’: SEC-IRBA with Pool IRB RW
In addition to the risk parameters provided from the ‘Retail – Other’ lenders Pillar 3 disclosures, we are using a non-risk parameter of 5 years for tranche maturity to enable the computation of the p-factor under SEC-IRBA, both for Non-STC and STC securitisations.
When taking the ‘Retail – Other’ exposures portfolio characteristics (“All, excl. Defaults”) of the Pillar 3 reports as representative of securitised ‘Retail – Other’ pools, the average EAD-weighted risk weight across the 8 banks in the sample (Data Annex 9) is 39.0%. There is a wide dispersion between the pools with the lowest at a risk weight of 16.2% and the highest at a risk weight of 51.2%. The average EAD-weighted PD for the pools is 1.98% and the average EAD-weighted LGD is 34.98% (thus, a proxy for the implicit one-year expected loss for nondefaulted assets is 69.2 bps). Details for each bank are provided in Table A8.1.1. in the Data Annexes.
When the lower risk part of those pools is taken (“Top Part (PD<2.5%)”), the average EAD-weighted risk weight across the 8 banks in the sample is 31.4%, with a very wide dispersion between the pool with the lowest at 11.8% and the highest at 42.8%. The average EAD-weighted PD for the pools is 0.68% and the average EAD-weighted LGD is 33.74% (a proxy for the implicit one-year expected loss for non-defaulted assets is thus 22.9 bps). Details for each bank are provided in Table A8.1.2.
When using SEC-IRBA, for the pools “All, excl. Default” and Non-STC securitisations, the average Post/Presecuritisation Capital Multiplier is 2.73x, meaning that the capital of all tranches (if kept in the regulated banking system) has increased by 173% by the mere action of securitising. This occurs even though no additional credit risk has been added to the underlying pool. The lowest capital multiplier is 2.41x and the highest of 2.92x, a fair range between the minimum and maximum. The Non-STC ‘p’ values for senior tranches varied from 110.6% to 122.8% (average 116.2%) and from 127.8% to 137.2% (average 132.1%) for non-senior tranches.
For the pools “Top Part (PD<2.5%)” and STC securitisations, the average Post/Pre-securitisation Capital Multiplier is 1.78x, i.e., a 78% increase just due to the act of securitising. The lowest capital multiplier is 1.68x and the highest of 1.84x, a fair range between the minimum and maximum. The STC ‘p’ values for senior tranches varied from 58.0% to 63.1% (average 61.7%) and from 66.0% to 69.9%% (average 68.8%) for nonsenior tranches.
The key IRB values are summarised in Table 11.4.1.
We can separate the content of the Post/Pre-securitisation Capital Multiplier into its four main components, as described in the corporate section 5.1.1. The waterfall breakdown of the increase components, 173.4% for Non- STC securitisations is given in Panel a) of Figure 11.2.1. and the 78.4% is given in Panel b).
For Non-STC securitisations, the non-recognition of FMI counts for 23.1% of the pool RWAs, the medium seniority contributes to 110.3% (the smoothing is more than the pool itself!) of the pool RWAs and the senior tranche risk weight floor of 15% makes up 40.0% of the pool RWAs. Together, the medium seniority and the risk weight floor components accounts for an average of 150.3% of the pool RWAs, compared with the average p-factor value for the non-senior tranches of 132.1%.
For STC securitisations, the non-recognition of FMI counts for 9.5% of the pool RWAs, the medium seniority for 32.3%and the senior tranche risk weight floor of 10% for 36.6%. Together, the medium seniority and the risk weight floor components represent an average of 68.9% of the pool RWAs, compared with the average p-factor value for the non-senior tranches of 68.8%.
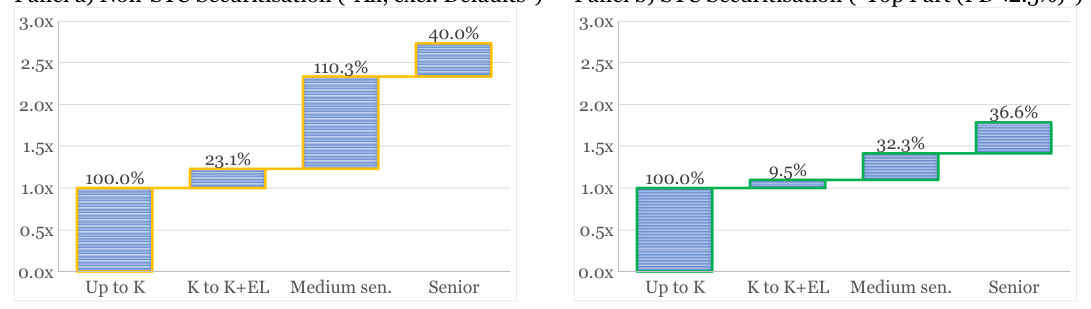
| Inputs from Pillar 3 | reports | SEC-IRBA | Results | ||
|---|---|---|---|---|---|
| – ‘Retail | Pool Other’ | EAD- Pool EAD- | Pool EAD- | Tranches EAD- | Post/Pre- |
| Lenders | Average | weighted PD weighted LGD | weighted RW | weighted RW | securitisation |
| (Pre-securitisation) | (Post-securitisat.) | Capital Multiplier | |||
| with SEC-IRBA | |||||
| Pools: All, excl. | Defaults | ||||
| 1.98% 34.98% | 39.0% | 106.3% | 2.73x | ||
| Securitisations: | Non-STC | ||||
| Pools: Top Part | (PD<2.5%) | ||||
| 0.68% 33.74% | 31.4% | 56.1% | 1.78x | ||
| Securitisations: | STC |
11.4.2 ‘Retail – Other’: SEC-SA with Pool SA RW
For this part, we take the SA risk weight for ‘Retail – Other’ as 75%, regardless of the PD distribution and we take as a core assumption that all the Auto and Consumer loans are ‘Non-revolving Retail’. We simulate new securitisations with zero delinquencies at issuance date. Therefore, all 8 ‘Retail-Other’ lenders will have the same Post/Pre-securitisation Capital Multiplier of 2.00x for Non-STC securitisations and 1.50x for STC securitisations. The optimised senior tranche attachment point is 2.79x K% (16.8% of the capital structure) for Non-STC and 1.71x K% (10.3% of the capital structure) for STC. The key figures are provided in Table 11.4.3.
Figure 11.4.2 shows the average breakdown of the four components of the 100% capital requirement increase for Non-STC securitisation (Panel a) and for the 50% capital requirement increase (Panel b):
• 1st component: 100%, the SA pool RWAs of the underlying pool.
• 2nd component: 0%, as the SA approach does not create a mismatch between post and presecuritisation, as the FMI is not recognised under the SA approach for the underlying assets.
• 3rd component: Non-STC medium seniority: 83.3% of pool RWAs. This is compared to 38.0% of pool RWAs for STC.
• 4th component: the senior tranche risk weight floor at 15% for Non-STC represents 16.7% of pool RWAs and for STC, the 10% floor represents 12.0% of pool RWAs. The third and fourth components, when summed up, are exactly equal to the ‘p’ of 100% for SEC-SA for Non- STC and 50% for STC that is applied to securitisation (all, including non-senior) tranches.
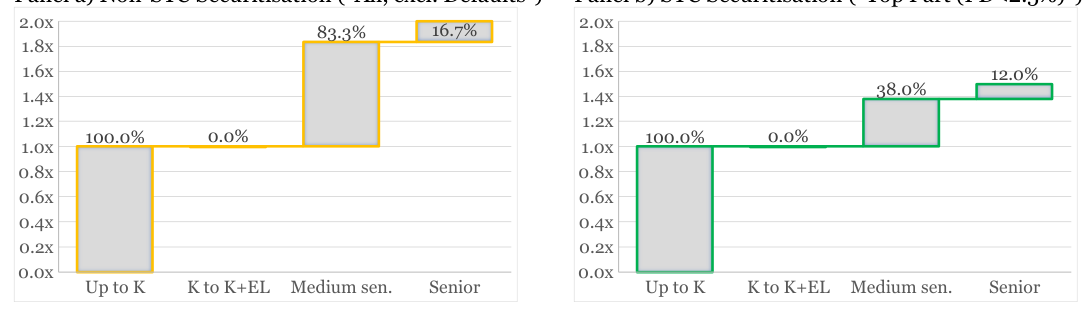
| Optimised Senior | Tranche | Post/Pre- | ||||
|---|---|---|---|---|---|---|
| – ‘Retail | Other’ | Attachment Point | Pool EAD- | Tranches EAD- | securitisation | |
| weighted RW | weighted RW | |||||
| As % capital | As multiplier | Capital Multiplier | ||||
| Lenders | Average | structure | of | (Pre-securitisation) | (Post-securitisat.) | with SEC-SA |
| Pools: All, excl. | Defaults | K% | ||||
| 16.8% | 2.79x | 75.0% | 150.0% | 2.00x | ||
| Securitisations: | Non-STC | |||||
| Pools: Top Part | (PD<2.5%) | |||||
| 10.3% | 1.71x | 75.0% | 112.5% | 1.50x | ||
| Securitisations: | STC |
11.4.3 ‘Retail – Other’: SA Output Floor Implementation
The implementation of the SA Output Floor is the same for all ‘Retail-Other’ lenders, and provided in Table 11.4.3 and Table 11.4.4.
To assess which banks would be impacted (when looking at the regulatory asset class level, rather than at the bank wide level), we can calculate the ratio of the SA Output Floor RW to the IRB RW. When a ratio is below 1.00x then the IRB method will prevail and when it is above 1.00x, the SA Output Floor will prevail. Figure 11.4.3 (for Non-STC) and Figure 11.4.4 (for STC) show a green tick when IRB prevails, and a red cross when the SA Output Floor prevails. Panel a) of those figures concerns the asset side and Panel b) the securitisation side. The move from a green tick to a red cross signifies the year when the SA Output Floor will prevail.
Over time, the risk weight differential between both forms of financial instruments (securitised or notsecuritised) will reduce. The introduction of the SA Output Floor will have little impact on the Non-STC securitisations. This is because the increase is a marginal 2% (=108.7%/106.3%) and because the underlying pools will be impacted by a 45% increase (=54.4%/39.0%) which means one can even expect to see more securitisation in the consumer / auto areas. Those securitisations might not necessarily be of the STC-type though and, as for the high quality underlyings, the securitisation RWAs will increase by 45% (=81.6%/56.1%) while the underlying will see a 73% increase (=54.4%/31.4%).
Panel b) Non-STC Securitisation
Non-STC Securitisation Year 1 Year 2 Year 3 Year 4 Year 5 Year 6 RCI Banque (Auto,FR) 0.59x 0.65x 0.71x 0.76x 0.82x 0.85x Banque PSA (Auto,FR) 0.54x 0.59x 0.65x 0.70x 0.76x 0.78x Unicredit (IT) 0.55x 0.61x 0.67x 0.72x 0.78x 0.80x Intesa Sanpaolo (IT) 0.64x 0.71x 0.77x 0.83x 0.90x 0.93x Groupe BPCE (FR) 1.68x 1.85x 2.02x 2.19x 2.35x 2.44x Crédit Agricole (FR) 0.80x 0.88x 0.96x 1.04x 1.12x 1.16x BNP Paribas (FR) 0.67x 0.74x 0.80x 0.87x 0.94x 0.97x Société Générale (FR) 0.93x 1.02x 1.11x 1.20x 1.30x 1.34x Average 0.71x 0.78x 0.85x 0.92x 0.99x 1.02x
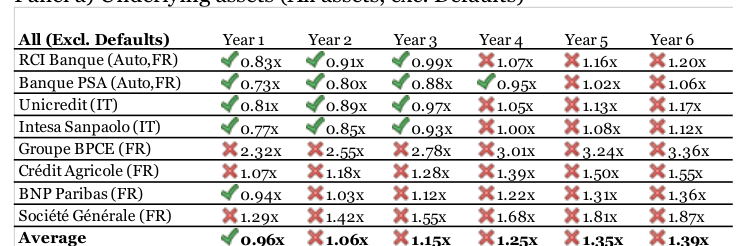
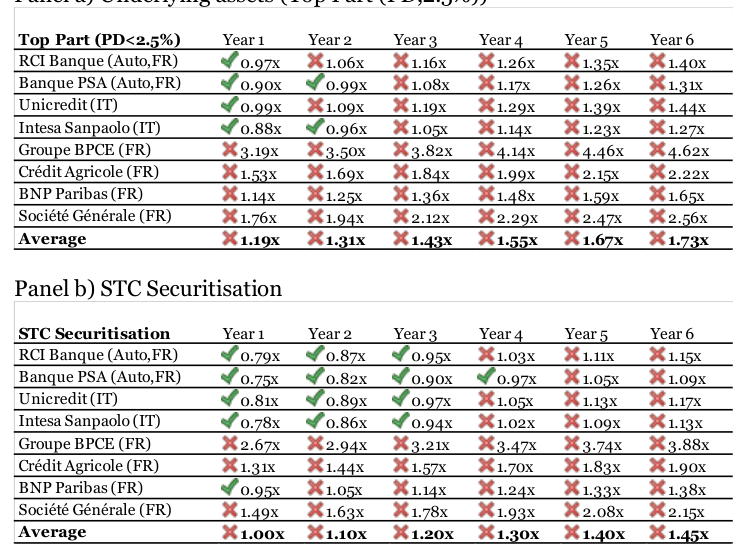
| – ‘Retail Other’ IRB RW Lenders Average (Pre-securitis.) | Year 1 | Year 2 | Year 3 | Year 4 | Year 5 | SA RW Year 6 (Pre-securitis.) | |||||||||
|---|---|---|---|---|---|---|---|---|---|---|---|---|---|---|---|
| SA Output Floor Percent. | 50% | 55% | 60% | 65% | 70% | 72.5% | |||||||||
| Pools: All, excl. Defaults | 39.0% | 37.5% | 41.3% | 45.0% | 48.8% | 52.5% | 54.4% | 75.0% | |||||||
| Securitisations: Non-STC | 106.3% | 75.0% | 82.5% | 90.0% | 97.5% | 105.0% | 108.7% | 150.0% |
| – ‘Retail Other’ IRB RW Lenders Average (Pre-securitis.) | Year 1 | Year 2 | Year 3 | Year 4 | Year 5 | SA RW Year 6 (Pre-securitis.) | |||||||||
|---|---|---|---|---|---|---|---|---|---|---|---|---|---|---|---|
| SA Output Floor Percent. | 50% | 55% | 60% | 65% | 70% | 72.5% | |||||||||
| Pools: Top Part (PD<2.5%) | 31.4% | 37.5% | 41.3% | 45.0% | 48.8% | 52.5% | 54.4% | 75.0% | |||||||
| Securitisations: STC | 56.1% | 56.2% | 61.9% | 67.5% | 73.1% | 78.7% | 81.6% | 112.5% |
11.4.4 ‘Retail – Other’: SRT with the SA Output Floor
The key results for the PBA tests are provided in Table 11.4.5. Details are for individual ‘Retail – Other’ lenders are provided in Tables A9.5.1 and A9.5.2. Interpretation for those tables is given section 5.1.4.
Of the 8 lenders in the sample, 7 Non-STC securitisations would be compatible with the PBA test in SEC-IRBA when the senior tranche attachment point is optimised, and 5 would still be valid transactions under the SEC- SA. For higher quality pools, 7 out of the 8 STC securitisations would be compatible with the PBA test in SEC- IRBA, but only 1 out of 8 would still be valid transactions under the SEC-SA.
Once again, the introduction of the SA Output Floor will require new types of transactions to be SEC-SA compatible for SRT purpose. Since the underlying risk weight will be adjusted upwards much faster than for securitisation tranches, we do expect an increase in this type of transactions (albeit at a higher attachment point than current transactions).
However, the SRT transfer can be implemented in Europe via an increased use for rated transactions. Indeed, the recognition of FMI by rating agencies methodologies might generate attachment points for the senior tranche that are much lower than those which would be obtained with the regulatory definition for the use of the SEC-SA. This is especially true for the auto loan sector.
| SRT Considerations | for | Securitisation | Attachment | Point | (A) | IRB Senior | tranche | RW | % of Pool | RWA | |
|---|---|---|---|---|---|---|---|---|---|---|---|
| IRB Senior | tranches | ||||||||||
| ≤50%, | |||||||||||
| Pool | RW | expressed | as: | (Pass | |||||||
| Fail>50%) | |||||||||||
| Mult. | Mult. | Final | |||||||||
| – | % of | IRB | SA | SEC- | SEC- | SA | Retain. | Retain. | |||
| ‘Retail | Other’ | IRB | SA | Cap. | |||||||
| Lenders | Average | Struc. | Pool | Pool | IRBA | SA | Output | IRB | SA | ||
| Cap. | Cap. | Floor | |||||||||
| Pools: All, excl. | Defaults | ||||||||||
| 39.0% | 75.0% | 10.3% | 3.17x | 1.72x | 15.0% | 48.2% | 34.9% | 40.0% | 59.2% | ||
| Securitisations: | Non-STC | ||||||||||
| Pools: Top Part | (PD<2.5%) | ||||||||||
| 31.4% | 75.0% | 4.2% | 1.58x | 0.70x | 10.0% | 62.2% | 45.1% | 36.6% | 80.0% | ||
| Securitisations: | STC | ||||||||||
| Risk Control | 13-14 Dean | Street | London W1D | 3RS | +44(0)2033070730 | www.riskcontrollimited.com |
Notes
[1] This revised version corrects the editing on Page 17.
[2] This paper was prepared by Georges Duponcheele, Risk Control and William Perraudin, Risk Control. Please address comments to: georges.duponcheele@riskcontrollimited.com or william.perraudin@riskcontrollimited.com. The study was commissioned by the Association for Financial Markets in Europe (AFME).
[3] The maximum risk weight of 1250% is calibrated on this 8% capital ratio, as 1250% times 8% equals 100% capital requirement. However, while the risk weight scale from 0% to 1250% has not changed, the capital ratio has been regularly increased.
[4] The Internal Assessment Approach (IAA) also exists and mirrors aspects of SEC-ERBA.
[5] While risk takers might prefer to have the component (ii) first and (i) second, this would add confusion between the expected loss that is in a pool (a risk notion), with the future margin income of that pool (an income notion) that offsets the VaR calculation at a one-year horizon as recognised in the IRB regulatory formulae when calculating K. As for on-balance sheet assets the FMI recognition when calculating K is capped at one-year EL, therefore, the first conceptual tranche has a thickness K, and the second conceptual tranche as a thickness FMI capped at the 1-year EL, i.e, EL.
[6] First loss retentions are often sized based on the pool EL. This is not the same as component (ii) which is an income stream on underlying assets, also sized (due to the regulatory cap) to be equal to 1-year EL. The non-recognition of FMI in securitisation tranches, leads to various market compensating mechanisms, such as one-year rolling Synthetic Excess Spread, that are not in the scope of this study.
[7] For an originating bank which has passed the SRT test under IRB, (i.e., passed the operational requirements for the recognition of risk transference as in BIS CRE40.24 and is able to calculate SEC-IRBA on the retained position), for the purpose of calculating the risk weights in SA, it should not be required to redetermine the operational requirements for the recognition of risk transference under the SA. The operational requirements for the recognition of risk transference state that: “(40.24) An originating bank may exclude underlying exposures from the calculation of risk-weighted assets only if all of the following conditions have been met. Banks meeting these conditions must still hold regulatory capital against any securitisation exposures they retain. (1) Significant credit risk associated with the underlying exposures has been transferred to third parties. (2) The transferor does not maintain effective or indirect control over the transferred exposures. […]”
[8] The group includes the Association for Financial Markets in Europe (AFME), the Dutch Securitisation Association, the European Banking Federation (EBF), the International Association of Credit Portfolio Managers (IACPM), Leaseurope, Eurofinas, Paris EUROPLACE, PCS and True Sale International (TSI).
[9] While our recommendation is for a sound, scientifically based, data-driven recalibration, until such work is performed, a temporary provisional adjustment proposed in the Joint-Letter of halving ‘p’ factors for securitisation transactions would avoid a sudden market stop during a phased implementation of the SA Output Floors. Halving ‘p’ in SEC-SA would also create a level-playing field with the US which has not so far employed a ‘p’ value of 1.0 (as does Europe), instead setting ‘p’ to 0.5.
[10] Another name used by market practitioners for traditional securitisations is ‘cash’ securitisations.
[11] These latter have proved an important safety valve for European banks, permitting them to increase lending within their existing capital envelopes.
[12] Another name used by market practitioners for on-balance sheet securitisations is ‘synthetic’ securitisations.
[13] In some cases, exposures were deducted from capital.
[14] Such MCR had to be covered by a combination of Core equity, Additional Tier 1 equity, and Tier 2 subordinated debt.
[15] The risk sensitivity in Basel III SA has increased compared to Basel II SA. For example, the Basel II SA assigns a flat risk weight to all residential mortgages, whereas in the Basel III SA, the mortgage risk weights depend on the loan-to-value (LTV) ratio of the mortgage.
[16] The idea of using the SA for capital floors was formally presented in 2014 (BCBS d351).
[17] To reduce the sudden shock in the increase in capital requirements that will occur for some banks in Year 1 of the transition phase, the increase in RWAs from one year to the next may be capped at 25%, subject to supervisory discretion.
[18] This represents the Future Margin Income of the underlying assets, capped at the 1-year Expected Loss.
[19] To minimize the size of this paper, the data annexes are compiled in a separate document.
[20] Although BNP Paribas Fortis is the largest bank in Belgium by Total Assets, it does not disclose EU CR6 data on its assets in its Pillar 3 disclosures; EU CR6 asset riskiness is consolidated in the BNP Paribas Group Pillar 3 disclosures, but it is not possible to isolate in the latter the part relevant to Belgium only. ING Belgium is the fourth largest bank, and does not disclose detailed EU CR6 data on Belgium only, as its data is consolidated at ING Group level in the Netherlands.
[21] Based on the MM10 report, dated June 2021
[22] Exposure at Default (EAD) post Credit Risk Mitigation (CRM) and post Credit Conversion Factor (CCF)
[23] The Basel STC framework derived from a joint taskforce BCBS/IOSCO was adopted, and gold-plated in European legislation, under the Simple, Transparent and Standardised (STS) regulation.
[24] Extract from DNB’s notification to the EBA: “The intended measure is expected to increase the risk weights of the IRB banks concerned, on average, by more than 25%. […] For each individual exposure item in scope of the measure, a 12% risk weight is assigned to the portion of the loan not exceeding 55% of the market value of the property that serves to secure the loan, and a 45% risk weight is assigned to the remaining portion of the loan. This means the risk weights of the individual loans to be used for this calculation increase with the LTV ratio of the loans: from 12% for loans with an LTV ratio up to 55% to 26.85% for loans with an LTV ratio of 100%.” DNB (2020)
[25] The Bank of England consultative paper on managing deficiencies in model risk capture for UK mortgage IRB risk weights includes a proposal to set a minimum risk weight of 7% at the individual mortgage level, and an override with a minimum risk weight of 10% at the pool level. BoE (2020)
[26] Our SA estimate for the Year 6 horizon is slightly underestimated, as we have assumed a favourable split between rated investment grade corporates at 65% SA and others rated at 100%.
[27] In Europe, the SME asset class RW is reduced by a non-Basel compliant SME supporting factor. This is one of the rare cases where European lawmakers have overruled Basel or the gold-plating from European regulators. As this supporting factor is not in the Basel agreements, we did not take it into account in this study for the SA Output Floor. If it is maintained (and probably will) at the Year 6 horizon, the difference noted between IRB and SA Output Floor will be reduced.
[28] Note that, for Non-STC securitisations, we use the risk characteristics from “All, excl. Defaults”, and, for STC securitisations, the characteristics corresponding to “Top Part (PD<2.5%)”.
[32] Because the third component (‘’) is calculated after the fourth component, it can become negative as in Table 3.5 for residential mortgages. This occurs with SEC-IRBA when the senior tranche risk weight is too high in comparison to the underlying pool risk weight, and the attachment point of the senior tranche is below 1.0 times pool capital.
[33] There are many other technical issues in the EBA 2020 report that are out of scope of this paper.
[34] Banking industry representatives, using private data on existing transactions expect a high failure rate resulting from the application of counterfactual concepts presented in the EBA paper, resulting in situations where the UL in tranches can be calculated as greater than the outstanding pool itself.
[35] In practice, attachment points are a bit higher, as the pools being securitised are not based on a prorata share of the assets on the balance sheet, but are subject to selection criteria tending towards assets consuming more capital than the average requirement for the relevant asset class.
[36] See the fourth IRB component in Table 3.5.
[37] This numerical example illustrates why regulators had to put a cap in the regulation to the RWA amounts of a tranche not exceeding the RWA amount of the whole underlying pool. Only risk formulae with in-built design deficiencies require a credit-enhanced protected senior tranche RW to be corrected by a cap at the level of the RW of the whole pool with no credit-enhancement protection. Those deficiencies are more pronounced the greater the ‘p’ value in the SSFA.
[38] The average senior tranche SA RWAs represents 86.4% of pool SA RWAs, i.e., more than 50%, therefore the test fails.
[39] We consider that this practice of ‘optimisation’ will only stop once policymakers replace the non-risk-sensitive ‘fixed’ floor with one that is a) risk sensitive and linked to the underlying pool risk weight and b) is a layer of additional risk weight rather than an absolute minimum value.
[45] The Operational requirements for the recognition of risk transference state that: (40.24) An originating bank may exclude underlying exposures from the calculation of risk-weighted assets only if all of the following conditions have been met. Banks meeting these conditions must still hold regulatory capital against any securitisation exposures they retain. (1) Significant credit risk associated with the underlying exposures has been transferred to third parties. (2) The transferor does not maintain effective or indirect control over the transferred exposures. […]
[46] It, therefore, excludes SRT and private lending.
[47] Due to a change in sources of securitisation data used in AFME’s reports over the years, small discrepancies may be found with other data sources. This table excludes data on European CLOs/CDOs, as this sector has been omitted from AFME Securitisation Data reports since 2020. This asset class represents about €130 billion in Principal Outstanding in 2021. The European CLO/CDO asset class mainly consists of ‘spread arbitrage’ securities with ‘Stop & Go’ issuance features. It is, therefore, less relevant for the funding of the European economy than are other asset classes. It is also less affected by capital regulation.
[48] The UK PO dropped suddenly to €277 billion in 2015 from €408 bn in 2014. This resulted from large-scale amortisation of 2008 UK issuances. The yearly UK issuance peaked at €256 billion in 2008 and then fell to €89 billion in 2009.
[49] A funding crisis in 2012, especially with regard to USD funding, changed the attitude of French banks to the diversification of funding sources. Nevertheless, securitisation in France has been mainly motivated by creating collateral for ECB funding.
[50] Greece is the only EU 27 country whose economy has shrunk since 2012: while the EU 27 averages a 27% GDP growth between 2012 and 2021, Greece is a negative 3%.
[51] Retained securitisations are usually fully consolidated on the institutions’ balance sheets and are, therefore, not subject to securitisation capital requirements.
[52] Unlike the sources used for the Principal Outstanding data, the sources used by AFME to compile issuance data include European CLOs/CDOs. Thus, the true retention rate of non ‘spread arbitrage’ securitisations in Europe is even higher that what is shown in Figure 7.2.
[53] Unlike the US, due to the regulated nature of most assets being securitised in Europe, there were very little credit losses on non-junior securitisation tranches from European securitisations. Most losses on have been mark-to-market losses.
[54] “More than a decade after GFC, the EU securitisation market falls short of full recovery in size and reputation. Placed volume has crept up to reach just €90bn in 2021, which is a far cry from the €270bn+ volumes issued annually before the Global Financial Crisis and the current EU capital market needs. Post crisis, covered bonds unabashedly cannibalised RMBS, the mainstay of securitisation.” (Batchvarov, Eurofi 2022)
[55] In the UK context, Nationwide defines ‘prime residential mortgage’ as “mainstream residential loans, which typically have a higher credit quality and fit standard underwriting processes. As such, they are likely to have a good credit history, and pass a standard affordability assessment at the point of origination.”
[56] Data source vary considerably. For 2021, Dutch RMBS outstanding stands at €144.2 bn whereas according to DNB, Dutch placed and retained outstanding stands at €167.6 bn. This report does not intend to address the discrepancies between data sources, but rather concentrates on the inherent message that is embedded in the overall trends within a homogeneous use of data sources.
[57] https://www.dnb.nl/en/statistical-news/value-of-outstanding-dutch-securitisations-below-that-of-covered-bonds-for- the-first-time/
[58] Dutch mortgage debt growth is relatively subdued from a historical perspective in relation to the rise in house prices. Since 2015, house prices have grown in the Netherlands 5-10% year-on-year, way above the EU average. This is not fuelled by the ease of finance, as the mortgage loan market has only grown 2-3% year-on-year over the same time period.
[61] However, this risk parameter, the asset maturity, is replaced later in SEC-IRBA by a non-risk parameter, the tranche maturity which can be taken for the purpose of this study at 5 years (as the situations where it will be less than 5 years are fairly minimal at time of issuance).
[62] The BCBS position is that the calibration at 15% for the asset correlation is high and includes a long-term maturity effect.
[63] The final RWAs in IRB was slightly higher as from 2006 to 2020, this value was multiplied by a scaling factor of 1.06. This scaling factor was removed in March 2020. We will therefore not include it in our assessment.
[64] The SSFA was first presented in a Basel working paper in 2001 (BCBS WP10).
[65] Remedies do exist though, and policymakers interested in addressing the deficiencies of the securitisation framework can contact the authors to understand the drafting options available.
[66] The exact legal wording: “The resulting risk weight is subject to a floor risk weight of 15%.” (BCBS, CRE44.26) gives rise to an (unhealthy) senior tranche attachment point optimisation process described in Step 4 of Appendix 10. Policymakers interested in solving this issue should contact the authors.
[67] The calibration around the central point of 2.5 years embedded in the Final Maturity Adjustment, is replaced, most of the time by a 5 years value for tranche maturity.
[68] The final calibration was published in 2014 (BCBS d374), and the STC calibration in 2016 (BCBS Revised d374).
[69] US banks, however, who are not allowed to use external ratings in the calculation of their capital requirement, assign a 100% RW to all corporate exposures (excluding SMEs) with the exception of those identified as “investment grade” (based on the bank’s judgement, and within given regulatory constraints) in which case the RW is equal to 65% (Method 2).
[70] This is not an official mapping, but a reasonable mapping done by the authors for the purpose of this paper.
[71] Some risk managers estimates that the RW is likely to be close to 85% RW, rather than the 70.1% used in this study. In that case the difference we calculate for corporates is understated.
[72] As mentioned previously, there is no guarantee that the SME supporting factor of 0.7619 that applies in Europe and that moderates the Base RW will stay. By not taking it into account, the difference we calculate in Year 6 is overstated.
[73] Under the Basel III Finalised Standards, the regulatory retail category has been made more risk sensitive by differentiating ‘transactors’ and ‘non-transactors’ for revolving assets. Transactors are obligors in relation to facilities such as credit cards and charge cards where the balance has been repaid in full at each scheduled repayment date for the previous
[12] months. Obligors in relation to overdraft facilities would also be considered as transactors if there has been no drawdown over the previous 12 months.
[74] In the initial December 2012 proposal, the exponential smoothing parameter p is set at 150% (BCBS 236). We had shown that this level is not coherent with realistic correlation structures (Duponcheele et al. (2013b)). The value of 150% has been kept in the December 2013 proposal for re-securitisations (BCBS 269).
[75] Of the European countries tracked by OECD (2022), the SME loans as a percentage of total outstanding business loans is the lowest for Italy (17.13%). Belgium has one of the highest shares (68.43%). Spain’s share is in the centre of the distribution (51.17%). This suggests that there is no link between the fact that a country securitises its SME loans and the importance of the SME sector in the overall corporate loan books of that country.
[76] https://eurodw.eu/wp-content/uploads/HYPOSTAT-2021_vdef.pdf
[77] There are many other criteria for STC securitisations. We make the Non-STC/STC split to assess the potential impact of both labels, by using the risk characteristics of “All assets, excluding Defaults” for Non-STC, and the “Top Part” of the portfolio where the assets have a PD less than equal to 2.5% for STC.
[78] It has been claimed by BCBS that the lower calibration of the p-factor for senior tranches takes into account this FMI recognition for the senior tranche only. The calibration data of BCBS is unpublished and has not been the subject of peer- review. From our point of view, it can easily be shown that for corporate assets, the delta between senior and non-senior p- factors does not result from the capture of asset FMI. For poor quality mortgage pool (e.g. US subprime), we agree with BCBS’s claim.
[79] It would be better to remove this design flaw by having a layer of additional risk weight linked to the underlying pool capital rather than using a formula based on the word ‘minimum’. Regulators believe that the existence of a floor is conservative; financial structurers understand it is a design flaw and will push the attachment point of the senior tranche as low as possible until equality to the floor as been reached. Future regulation should address this and remove incentive of lowering senior tranche attachment points.
[80] The fact that this is mathematically possible to a have an attachment point below 1.00x K"#$ shows the inadequacy of a fixed risk weight floor for the senior tranche, that is insensitive to the underlying risk of the pool, and at 15%, clearly too high in relation to the pool risk weight of 24.0% for ING data. The BCBS fixed value calibration decided in 2013 was done to ensure that US subprime mortgage securitisations would be covered, but is applied across the board, across all geographies, across all assets, including on a European corporate portfolio with risk characteristics that have nothing to do with US subprime mortgages. When designing Basel V, the next generation of regulators ought to set the risk weight floor as a percentage of the underlying SA risk weight of the performing assets of the pool.
[83] This test has serious conceptual issues in its fine prints, as ‘Regulatory UL’ has been redefined in Europe by adding the Long-Term Expected Loss (LTEL) and other elements. There are many other issues that are out of scope of this paper.
[84] The optimisation done with the ING data also fails under SEC-IRBA. In order to pass, the attachment point would have to be increased above this mathematical optimisation, resulting in RWA for that tranche that are greater than one would have with just the application of Knn•%.
[86] For some banks, the shock of the introduction of the SA Output Floor is so high, that regulators have allowed any increase to be capped, at a consolidated level, to 24% per annum. Over the 6-year implementation phase, such banks should be able to reach the target level implied by the final percentage of 72.5% of SA RWAs.