

European policy-makers view the revival of the securitisation market as a key step in (i) restoring orderly funding to European banks and (ii) boosting lending necessary for growth. Current and proposed regulatory capital rules are, however, major impediments to reviving the securitisation market. Since the crisis, changes in ratings agencies methodologies have boosted the conservatism of ratings based capital requirements rules applied to European banks. The Ratings Based Approach (RBA) contained in the current Basel II agreement and implemented in Europe via the Capital Requirements Regulation is now profoundly discouraging to new issuances of High Quality Securitisations (HQS). The Basel Committee’s Ratings and Securitisation Workstream (RSW) has proposed a new set of capital rules (see BCBS (2013c)) under which US banks would employ simple capital formulae while European banks would de facto employ an approach based on agency ratings. The latter approach, the External Ratings Based Approach (ERBA), would boost the level of conservatism in capital requirements beyond that implied by the RBA. In this paper, we present a quantitative impact study of the different approaches employed in the current rules and proposed by regulators and the industry. Using a sample of 1,771 actual European securitisation tranches, we show how the approaches compare and benchmark them against a closedform, analytic capital model developed by Duponcheele et al. (2014c), namely the Conservative Monotone Approach (CMA). We concisely describe current and proposed approaches to calculating regulatory capital for securitisations, comment on whether they are excessively conservative and explain the inconsistency implied by the Basel Committee’s latest proposed hierarchy. We propose a simple solution to the regulatory capital roadblock, which is preventing a revival of the European securitisation market. Our proposed solution is that the European authorities immediately adopt, in the case of HQS, a slightly adjusted version of the Simplified Supervisory Formula Approach (SSFA) in the current Basel proposals. Banks in Europe should be permitted to apply this “European SSFA” instead of the current RBA for HQS.
1. Introduction
Central bankers seeking to increase the financing opportunities of companies as well as to restore access to funding for European banks have identified the revival of the securitisation market as an urgent priority. In November 2013, Yves Mersch, Executive Board member of the European Central Bank (ECB), said “I see strengthening capital markets through securitisation as an important complement to bank lending” (Mersch, 2013). In September 2014, ECB President Mario Draghi argued that “the development of a well-functioning market for simple, transparent and real assetbacked securities (ABS)” deserved “particular attention” (Draghi, 2014a).
The priority is also reflected in the recently expressed policy objectives of the European Commission. In President Jean-Claude Juncker’s September 2014 mission letter to the incoming Commissioner for Financial Stability, Financial Services and Capital Markets Union, Jonathan Hill, the first of the seven policy objectives is identified as “presenting concrete initiatives on the long-term financing of the economy” (Juncker, 2014). The text continues: “This will include seeking appropriate ways to revive sustainable and high quality securitisation markets to reduce the cost of raising capital in the Union and to develop alternatives to our companies’ dependence on bank funding.” Jonathan Hill is asked to outline concrete measures in this regard within three months of the start of the Commission’s mandate, i.e., by the end of January 2015.
The policy initiatives taken so far by European authorities have included the announcement by Mario Draghi of the ABS Purchase Programme (ABSPP) under which the ECB will start purchasing “simple and transparent asset-backed securities” starting in November 2014 (Draghi, 2014b). The ECB has said that it plans to purchase senior tranches. It is also considering purchasing mezzanine tranches if national governments agree to indemnify it against possible losses; but some national authorities have already expressed criticism of this idea.
A major impediment to a revival of the market remains the regulatory environment for securitisations. This is explicitly recognised in the joint Bank of England (BoE)-ECB paper published in May 2014 which includes the statement: “Potential impediments to [the revival of activity in public securitisation markets in Europe include] […] structural factors, such as regulatory treatment of securitisation […].” (BoE and ECB, 2014b). In October 2014, Mark Carney, Governor of the BoE, said “As the Bank of England [and] the ECB have argued, there is a strong case for differentiating between securitisations that are simple, transparent and consistent, and those that are not. The regulatory treatment of those securitisations should reflect their lower risk profile” (Carney, 2014).
Key components of the regulatory environment are Basel proposals for bank regulatory capital (see BCBS (2012) and (2013c)), for bank liquidity regulation (see BCBS (2013b) and EC LCR Delegated Act (2014)) and for insurer capital (see EIOPA (2013) and EC Solvency 2 Delegated Act (2014)).
One may argue that these various proposals involve a tightening of regulation that is excessive as far as European securitisations are concerned. With the exception of (a) commercial mortgage backed securitisations (CMBS) (some of which are subject to significant refinancing risk) and
(b) Collateralised Debt Obligations (CDOs) of ABS tranches with exposure to US deals, the securitisation market in Europe exhibited negligible default rates in the recent crisis. This was despite the fact that declines in GDP in many European countries exceeded that experienced in the US.[3]
Regulations that discourage the revival of the securitisation market result in a high economic cost in Europe because: (i) bank funding in much of the region remains weak, (ii) senior securitisation tranche purchases by European banks have in the past played an important role in facilitating a secured transfer of resources from banks with surplus funding to those with weaker funding bases[4], and (iii) small and medium enterprises (SMEs) – representing a large share of European companies – are often unable to directly access capital markets through traditional instruments[5] and rely on securitisation for indirect access.
The BoE-ECB Discussion papers of March and May 2014 (BoE and ECB, 2014a and 2014b) floated the idea that a category of high quality securitisations termed “Qualifying Securitisations” might be devised, which would be subject to a “specific” (i.e., preferential) “regulatory treatment”.
An important component of the regulatory environment for securitisations is, of course, the framework for bank capital. Over the last four years, the Ratings and Securitisation Workstream (RSW) of the Basel Committee has been engaged in the development of revised capital rules appropriate in a post-crisis context. The RSW’s proposed rules have evolved substantially over time in the face of comments from the industry (critical of the extreme non-neutrality of pre- and postsecuritisation capital that the proposals implied) and from senior regulators (who reportedly felt that earlier versions of the proposals were overly complex).
Despite the significant overhaul of the previous BCBS (2012) proposals, there remain significant deficiencies in the current BCBS (2013c) proposals. Perraudin (2014c) highlights major inconsistencies between the capital levels implied by current proposals and the excessive conservatism of the External Ratings Based Approach (ERBA). But, it seems unlikely that, after working for four years on these topics, the RSW will adopt the further changes in the current proposals that would be necessary to fit the needs of the prime or HQS securitisation market.
At a global level, work on HQS has been devolved to a joint BCBS-IOSCO Task Force on Securitisation Markets (TFSM) led by IOSCO board Chairman Greg Medcraft and David Rule of the Bank of England. The TFSM aims to develop criteria for simple, transparent and consistent securitisations (see Medcraft (2014)). In addition, the Basel Committee has recently announced that the timetables for the work of the RSW and the TFSM would not be linked.
Even if Basel were to adopt HQS-style differentiations in capital rules, before it is transposed into European law, the European market would remain subject to the current Capital Requirements Regulation (CRR) which would deter a revival of securitisation in Europe. Except for a small number of originator positions, European banks currently use the Basel II Ratings Based Approach (RBA).[6] Since the crisis, ratings agencies have increased the conservatism of ratings[7], demanding higher attachment points if a tranche is to attain a given rating. This means that the calibration of the current RBA is no longer appropriate and RBA capital charges are more conservative than in the first years of Basel II.[8]
This leaves European regulators in a quandary. Both the current RBA and the proposals likely to emerge from the RSW are ill-suited to simple, transparent securitisations in the European market and will prevent the recovery in that market that the authorities would like to see.
The appropriate response for European regulators would, therefore, appear to be an immediate adjustment in the regulatory capital rules for High Quality Securitisations. In the short run, the adjustment for HQS would have the effect of altering the Basel II rules so as to off-set partially the boost in conservatism that has come from the tightening of ratings agencies criteria. In the longer run, the adjustment for HQS could form part of the framework that emerges from the work of the RSW.
The subject of this paper is how such an adjustment for HQS might be devised. This is an important topic for, while there has been extensive public debate of what might be included in a HQS category (on this, see the important recent contribution from the European Banking Authority (EBA) (2014), Perraudin (2014c) and (2014d)), there has, so far, been little or no analysis of how HQS status might be recognised by preferential capital treatment.
In summary, our proposal is (i) that the European authorities adopt the Simplified Supervisory Formula Approach (SSFA) framework which, in its Internal Ratings Based Approach (IRBA) and Standardised Approach (SA) versions, is a key component of the current BCBS (2013c) proposals; but that (ii) this SSFA framework be adapted and implemented with a simple adjustment for HQS positions[9].
If the European authorities, responding to the ECB’s objective of revitalising the European securitisation market, implemented this approach through ad hoc regulation dealing with HQS, they would remove the regulatory capital roadblock preventing recovery of the market. The approach would be consistent with the SSFA framework that is likely to appear in future Basel rules. In this sense, Europe would be early adopters of the future Basel securitisation framework.
Taking this approach would be comparable to the one taken by the US authorities who in October 2013 (OCC/FRB (2013)) adopted their own “Action: Final Rule” for “Basel III implementation”, by implementing what was in reality an entirely new set of rules that were not present in the official Basel accord but which had been in use for several years in the US trading book regulations. In the “Final Rule”, the US version (referred to here as “US SSFA”) has a capital surcharge of 50% (in the sense that the capital for all the tranches is 50% more than the capital for the underlying pool assets). This US solution was then promoted energetically by the US in the Basel discussions as an “SA” to be applied internationally (BCBS (2013c)). This latter SA is more conservative than the US SSFA in that it implies a capital surcharge of 100% rather than 50%.[10]
In this paper, to develop the rationale for our proposal, we set out in simple terms the various capital approaches currently in operation and those proposed by the RSW, as well as some alternatives that we have suggested in earlier papers. We show how these approaches perform by implementing them for a sample of 1,771 actual European securitisation tranches.[11][12]
The data we employ provides good coverage of different European countries. The countries include some that have been caught up in the recent sovereign solvency crisis and some that have been less affected. It covers multiple asset classes such as residential mortgages, SME lending, and other retail loans (including auto loans). Our dataset is constructed from public data sources and does not employ confidential information from banks.[13]
Simply comparing the capital implied by different regulatory approaches does not shed light on what capital levels “should” be.[14] To provide a reference point, we employ the capital implied by the Conservative Monotone Approach (CMA) of Duponcheele et al. (2014c). This approach is derived from a rigorous portfolio model, with components similar to that reportedly employed by the RSW for justifying capital calibration.[15] The calibration of the CMA we use is described in Duponcheele et al. (2014c) and is based on data from multiple banks. We regard comparisons with CMA capital as informative of what a scientific bottom-up analysis of risk would yield.
The remainder of the paper is organised as follows. Section 2 describes in a simple intuitive manner the key capital approaches. Section 3 describes the sample of securitisation tranches we study and how data were collected. Section 4 evaluates the current Basel II capital framework comprising the Ratings Based Approach (RBA), the Supervisory Formula Approach (SFA) and the US Simplified Supervisory Formula Approach (US SSFA). Section 5 analyses the BCBS (2013c) proposals including the Internal Ratings Based Approach (IRBA), External Ratings Based Approach (ERBA) and Standardised Approach (SA). Section 6 looks at alternatives to the Basel models generated by the AFA quant group[16] in a series of papers. Section 7 presents our HQS capital proposal for Europe. Section 8 concludes.
2. Capital approaches
In this section, we concisely describe current and proposed approaches to calculating regulatory capital for securitisations.
1. These approaches (see Figure 1) include the Basel II approaches, an approach currently employed in the US, the approaches proposed in BCBS 269 and approaches suggested by the AFA quant group.
2. We comment on important aspects relevant to each approach.
3. In particular, we point out several technical errors in the approaches proposed in BCBS 269. This section is relatively technical. Readers who are not technically inclined may choose to review the categorisation of approaches shown in Figure 1 (page 46) and then proceed to Section 3.
Current Basel II Approaches
Current Ratings- or Ratings-Methodology-Based Approaches
The original Basel rules (set out in BCBS (2006)) include the Standardised Approach (SA), the Ratings Based Approach (RBA), the Internal Assessment Approach (IAA) and the Supervisory Formula Approach (SFA). The SA and the RBA are ratings based approaches in which capital charges (or equivalently, risk weights) are deduced from simple lookup tables. We shall refer to the current Basel II Standardised Approach as SA(RB) (where “RB” stands for “ratings based”) to distinguish it from the similarly named Standardised Approach (SA) included in the Basel RSW’s recent proposals (BCBS (2013c)).
Under the RBA (used in IRB[17]), tranche risk weights depend on: (a) the tranche external rating,
(b) whether the credit rating (external or inferred) represents a long-term or a short-term credit rating,
(c) the granularity category of the underlying pool and (iv) the tranche seniority. Under the SA(RB), the risk weights depend solely on the tranche’s external rating. Table 1 shows the look-up tables[18] from BCBS (2006) for granular pools, for both the RBA and SA(RB).
The RBA was calibrated, in part, using the analysis of Peretyatkin and Perraudin (2004). That paper employed a two-factor Pykhtin-Dev model (see Pykhtin and Dev (2002)) and a multi-period Monte Carlo credit portfolio model developed by Perraudin that can perform Value at Risk calculations for portfolios containing multi-period securitisations.[19]
The Internal Assessment Approach (IAA) included in Basel II is ratings-methodology-based rather that ratings-based. It is used for determining capital charges for liquidity facilities and credit enhancements that banks extend to Asset-Backed Commercial Paper (ABCP) conduits.[20] Under the IAA, banks develop an internal approach to assigning ratings to such facilities that is consistent with the methodologies employed by credit rating agencies.[21] The internal ratings approach that a bank employs is subject to a set of operational standards, and requirements on model governance including regular audits. IAA methodologies are deemed refined approaches as they can incorporate risk drivers[22] that are impossible to incorporate into simple formula-based approaches. Once a rating has been obtained using an IAA, capital charges are deduced using the RBA lookup tables.
Current Formula-Based Approaches
The one formula-based approach in the current Basel II rules is the Supervisory Formula Approach (SFA). The SFA was devised by Gordy and Jones (2003). It represents an extension of the one-factor analytical model used for whole loan capital charges under Basel II. Applying the single factor Basel II model to securitisation tranches leads to an undesirable “cliff effect” whereby tranches attract a 1250% risk weight if their detachment point is less than a certain threshold[23] and attract zero risk weight if the attachment point of the tranche exceeds that same threshold. The SFA avoids this problem through the technical modelling device of assuming random attachment points.
The SFA has been criticised because the randomness in attachment points, represented by the parameter τ, appears (i) counterfactual and (ii) impossible to calibrate using data. Also, the approach is not flexible enough to permit adequate “spreading” of capital into senior tranches. For this latter reason, the SFA has turned out to be a license for capital arbitrageurs. So much so that some jurisdictions have ceased to permit banks to use this approach. In Europe, even if the use of SFA is permitted, an additional restriction exists since January 2014 (when the CRR became effective), as an institution other than the originator institution may only use the SFA subject to the prior permission of the regulator, which is a new requirement for sponsor banks.
Under the SFA, the capital charge for a securitisation tranche depends on five key inputs: pool’s capital requirement (inclusive of 1-year expected losses) KIRB, tranche’s credit enhancement level L, tranche thickness T, pool’s effective number of exposures N, and pool’s exposure weighted average loss-given-default LGD. It is calculated as follows:
Max((0.0056 × T),(S[L+T] − S[L])) (1) KTrancℎe = T
The supervisory formula S[. ] is defined as:
L wℎen L≤KIRB S[L] = { (2) KIRB + K[L] −K[KIRB] + (d× KIRB/ω)(1 −eω(KIRB−L)/KIRB) wℎen KIRB < L
N KIRB ℎ= (1 − LGD ) KIRB c= (1−ℎ) (LGD− KIRB)×KIRB+0.25×(1−LGD)×KIRB v= N v+KIRB2 (1−KIRB)×KIRB− v f= ( −c[2]) + 1−ℎ (1−ℎ)×τ (3) (1−c)×c g= −1 f a= g× c b= g× (1 −c) d= 1 −(1 −ℎ) × (1 −Beta[KIRB; a, b]) K[L] = (1 −ℎ) × ((1 −Beta[L; a, b]) × L+ Beta[L; a+ 1, b] × c) {
Here, the parameters[24] take the values τ= 1000, ω= 20, and Beta[L; a, b] denotes the cumulative Beta distribution function evaluated at L with parameters a and b. When the bank holds only a proportional interest in the tranche, that position’s capital charge equals the prorata share of the capital charge for the entire tranche. Having obtained tranche capital KTrancℎe, the tranche risk weight is calculated by multiplying KTrancℎe by 12.5.
Under the Basel II rules (see BCBS (2006)), the approaches must be used in the following order. Sponsors, originating and investing banks that have received approval to use the Internal Ratings Based Approach (IRBA)[25] must calculate capital charges on their securitisation exposures by applying the RBA if the tranches are externally rated, or if an inferred rating is available. In the absence of a rating, sponsors and investing banks that can calculate KIRB on the underlying pool may use the SFA subject to receiving approval from their national regulator, on a case by case basis.[26] In the specific case of banks that have obtained the permission by their regulator to use the IAA for ABCP, the risk weight of an unrated exposure in the ABCP programme can be calculated using the RBA risk-weight table and the mapping between internal ratings and external ratings.
Thus, under Basel II, the RBA has been the predominant approach. When the rules were initially introduced, this fact meant that inconsistencies between the capital implied by the formula-based SFA and the lookup table based RBA were not a major issue. Recently, however, Dodd-Frank has led to the removal of permission for US banks to use the RBA. Since banks in Europe and other jurisdictions primarily employ the RBA, this has made the lack of consistency between the capital implied by the different approaches a major issue for the securitisation market.
The BCBS 269 Approaches
The latest Basel proposals are contained in BCBS (2013c) (also known as BCBS 269). These include an Internal Ratings Based Approach (IRBA), an External Ratings Based Approach (ERBA) coupled with the IAA and a Standardised Approach (SA). These three approaches are organised in a hierarchy headed by the IRBA, followed by the ERBA and with the SA at the bottom. Banks are expected to use the highest approach in the hierarchy that is feasible given the data available and what is permitted in their jurisdiction.
The IRBA and the SA are based on a simple ad hoc formula, referred to as the Simplified Supervisory Formula Approach (SSFA). This formula was suggested in the very first Basel Committee working paper on securitisation capital (BCBS (2001)) but was subsequently dropped when the SFA and RBA were developed. In recent years, it has been employed in US trading book rules and as an interim US rule, when the US implementation of Dodd-Frank required eliminating reliance on ratings.
Under the SSFA framework, the capital charge of a tranche KTrancℎe, attaching at A and detaching at D, is calculated as follows. The adjusted lower and upper boundaries (l and u) of the tranche are defined as:
= max (0, A−KT) {l (4) u = D−KT
In equation (4), KT is a threshold level, defined below. Capital is calculated using the exponential function:
eau−eal (5) KSSFA(l, u) = a(u−l)
Here, the variable a is defined as: −1 a= (6) p×KP
Here, KP is a measure of the total capital for the underlying asset pool of the securitisation, discussed further below.
If the tranche detachment point D is below the threshold KT, the capital charge of that tranche is 100%. If a tranche has an attachment point A above the threshold KT, the capital charge of that tranche is calculated directly using the KSSFA(l, u) function. If the tranche attachment and detachment points straddle the threshold, the capital charge for the fraction above the threshold is evaluated using the formula and capital charge for the fraction below is evaluated based on 100% of the par:
→ 100% D≤KT → KT ≤A KSSFA(l, u) (7) KTrancℎe = { KT−A D−KT → ( A< KT < D D−A + D−A × KSSFA(l, u))
The tranche risk weight is calculated by multiplying KTrancℎe by 12.5. As a final step, a floor of 15% is applied to the tranche risk weight.
The SSFA Parameterisation for the SA
In the SA, as described in BCBS 269, the SSFA framework is employed using the following parameterisation:
= KT KA = {KP KA (8) p = pSA where: = KA (1 −W) × KSA + W× 0.5 {KSA = RWPool,SA × 8% (9) = 1.0 pSA
Here, W is the pool delinquency ratio, i.e., the fraction of the pool that has defaulted in the Basel sense. Specifically, W equals the cumulated value of loans in arrears for at least 90 days. KSA is the Basel II Standardised Approach pool capital as specified in BCBS (2006)[27].
The parameter p equals unity under the SA for all tranches except re-securitisations. For these latter, the prescribed value is 1.5.
It is to be noted that this official version of the SA in the BCBS 269 proposals contains a conceptual error in that it includes the delinquent assets (via KA) in KP. This in effect means that the capital associated with provisions for the delinquent assets is allocated to the senior tranches via the exponential function and the parameter a. To correct this conceptual error, KP should simply equal pool capital for performing loans and should not be a function of W. The delinquent assets should only affect the 100% capital charge threshold KT. It is important to distinguish between KT and KP to avoid making errors.[28]
An even more significant inaccuracy in the formulation of the SSFA, inherited from the SFA, is in the definition of attachment and detachment points. We highlighted this issue in Duponcheele et al. (2014b). Basel defines the attachment point as the par value of tranches more junior to the tranche in question, divided by the par value of outstanding pool assets. The detachment point in Basel is then equal to the attachment point plus the thickness of the tranche. This approach may be referred to as a bottom up approach as it involves inferring attachment points from more junior tranches in the capital structure.
The Basel approach is reasonable if the par values of pool assets and securitisation tranches are equal but if the deal is over- or under-collateralised, it can lead to incorrect results. Even if pool and tranche pars are equal at the issue date, some structures may become under-collateralised as pool losses accumulate.
A correct approach, which is robust to the presence of under- or over-collateralisation, is to calculate the attachment point for a tranche as the asset value minus the par values of pari-passu and more senior tranches all divided by the asset value. This approach, which one may refer to as a top-down approach, yields the same answer as the Basel approach if the attachment points in the latter are adjusted for under- or over-collateralisation.
Using the Basel approach without such adjustment, gross errors are only avoided for cash flow waterfalls like those employed in the US RMBS market and in synthetic deals in which par value for junior tranches is written off as pool losses occur. However, for other sectors of the market (including almost all European securitisation asset classes), the Basel approach is inappropriate.
Duponcheele et al. (2014b) presents compelling numerical examples to demonstrate the errors that may arise. Appendix 2 of this paper provides a reconciliation of the top-down and bottom-up approaches and shows that, to be correct, a Basel-style bottom up approach must include adjustment for over- or under-collateralisation.
In effect, this second conceptual error injects noise into tranche capital calculations, leading to some tranches (typically in over-collateralised deals), which one would objectively regard as less risky, attracting high capital, whereas others (typically in under-collateralised deals), which are genuinely risky, attract insufficient capital.[29]
The SSFA parameterisation for IRBA
The IRBA, as set out in BCBS 269, resembles the SA, since it is also based on the SSFA framework, but with the following parameterisation:
= = {KP KIRB (10)
(11) pIRBA = max (0.3, A+ B× N + C× KIRB + D× LGD+ E× MT)
Here, A, B, C, D and E are fixed coefficients. Their values depend on (a) the regulatory framework (wholesale or retail), (b) the tranche seniority (senior/non-senior) and (c) the granularity of the underlying pool (granular/non-granular).[30]
The 4 inputs to pIRBA that are weighted by these coefficients are: (i) the underlying pool capital requirement (inclusive of 1-year expected losses) KIRB, (ii) the weighted-average pool loss given default LGD, (iii) the contractual maturity of the tranche (with a cap of 5 years) MT, and (iv) the number of effective exposures N.
It is to be noted that this official version of the IRBA in the BCBS 269 proposals contains two key conceptual errors. The first is the complete absence of an adjustment for delinquent assets in that there is no W in the formula. This is particularly a problem because it implies there is inadequate adjustment of attachment and detachment points for delinquencies. Ideally, KT should reflect delinquencies (i.e., W) and be set equal to (1 −W) × KIRB + W× LGD and KP = KIRB would be included in the exponential function of the SSFA. The failure to adjust attachment and detachment points for delinquencies, as we shall see in Section 5, also leads to undesirable discrepancies between the IRBA and SA capital charges.
The second conceptual error is the use of a tranche maturity instead of pool maturity in the formula. Moreover, the use of tranche maturity as defined in the proposal is highly discriminatory in Europe. (See comments below and the discussion in Duponcheele et al. (2014b).)
The ERBA parameterisation
The ERBA, as described in BCBS 269, consists of a lookup approach similar to the RBA. However, pool granularity no longer affects capital which now depends on (a) the tranche’s external rating (as before), (b) whether the tranche is the most senior in its structure (as before), (c) tranche thickness T for non-senior tranches, and (d) tranche maturity MT.[31] Specifically, for a tranche with a particular rating, one looks up the 1 and 5 year maturity risk weights, as shown in Table 2, and then deduces tranche capital KTrancℎe from the following equations.
For senior tranches:
5−MT MT−1 (12.a) KTrancℎe = (( ) × RW[5]) × 0.08 4 ) × RW[1] + ([4]
For non-senior tranches:
5−MT MT−1 (12.b) KTrancℎe = (1 −min(T, 0.5)) × (([4] ) × RW[1] + ([4] ) × RW[5]) × 0.08
Here, for non-senior tranches, T is tranche par value divided by total pool asset par. The two “boundary” risk weights, corresponding to the minimum 1-year maturity, RW[1], and to the maximum 5-year maturity, RW[5], depend on whether or not the tranche is the most senior in its structure.
One may criticise the use of tranche maturity, especially legal maturity[32], not simply because it is the wrong risk driver (being a poor proxy for the more appropriate risk driver of the weighted average life of the asset pool). Also, in the European context, use of tranche maturity is discriminatory, in that in countries with slow legal processes, legal tranche maturity is always very long even if pool assets are of short maturity. Hence, securitisation capital for some European countries may substantially exceed that of others because of the pace of legal processes in a way that is unrelated to risk.[33]
Summary of Technical Errors in the BCBS 269 Approaches
To summarise, there are four technical errors in the approaches included in BCBS 269:
Nb Description of the technical error In the SSFA (as in the SFA), the attachment and detachment points are defined without adjusting for under- or over-collateralisation. This makes little difference in the US RMBS and synthetic CDO markets, but in almost all European securitisation markets, it is a major #1 failing. Tranches that are under- or over-collateralised either at issue or after delinquencies can attract totally wrong capital because of this error.
In the SA version of the SSFA, delinquencies (W) are used not just in adjusting the attachment and detachment points but also enter into the exponential term in the formula and #2 are, hence, “spread” out over the tranches.
In the IRBA version of the SSFA, the pool capital, as it enters into the adjusted attachment and detachment points, is not adjusted for delinquencies (W). This leads to inadequate #3 recognition of delinquencies in capital calculations and inconsistency with the SA.
In the IRBA and the ERBA, maturity is inappropriately defined and the definition employed #4 is discriminatory in a European context.
Rectifying these problems tends to reduce the incoherence between capital calculated using different approaches and in particular increases the correlation with the capital implied using a proper model based approach. In the next subsection, we set out a reference model based approach against which the regulatory formulae may be evaluated.
Model Based Approaches
The approaches described above are ad hoc. They have been calibrated more or less effectively to underlying models but do not, in themselves, constitute sensible bottom-up models. Comparing the capital levels that they imply gives no guidance on what level of capital a tranche “should” attract. In order to provide a benchmark for our discussion, we employ here the Conservative Monotone Approach (CMA).[34]
The CMA is a variant of the Arbitrage Free Approach (AFA) developed by a group of industry quantitative analysts in a series of research papers, see Duponcheele et al. (2013a, b, c, d). The CMA uses an asset-class-based approach to calibration and is described in Duponcheele et al. (2014c). Compared to approaches based on agency ratings, the CMA has the advantage that, postsecuritisation, it respects the risk hierarchy of different asset classes specified by regulators in the presecuritisation whole-loan capital charges of Basel II. Last, the CMA includes sensitivity to sudden deterioration in the pool, provided appropriate definitions are used for attachment and detachment points, A and D.
∗ be a threshold linked to W, the fraction of the pool that is delinquent, and to LGDW, the par- Let KT value-weighted loss given default of this fraction, by:
(13) KT∗ = W× LGDW
One may determine the risk weight of a tranche with attachment point, A, and detachment point, D, as follows. The adjusted lower and upper tranche boundaries, l and u, respectively are given by:
∗ A−KT l = max (0, ∗) 1−KT { ∗ (14) D−KT u = ∗ 1−KT
Under the CMA, tranche capital, denoted KCMA, depends on four parameters (as well as the adjusted attachment and detachment points), namely: pool capital Kp, pool par-value-weighted loss given default LGDp, the Capital Surcharge Scaling Factor CSSFM, and the conditional pool correlation ∗ . coefficient ρM
∗ ) (15) KCMA(l, u) = MVaR(l, u, Kp, LGDp, CSSFM, ρM
Here, MVaR for the tranche equals[35]:
(16) MVaR= 12.5 × SPDTrancℎe(l) × SLGDTrancℎe(l, u)
subject to the following definitions:
x ∗ N−1(KP×CSSFM LGDP ) − N−1(LGDP)×√1−ρM ) SPDTrancℎe(x) = N ( ∗ √ρM (17) (SPDTrancℎe(u)SPDTrancℎe(l)×u)−l LGDP BV(l)−BV(u) + SLGDTrancℎe(l, u) = (u−l) (u−l) × (SPDTrancℎe(l)) CSSFM ∗ ) BV(x) = N[2] (N−1 (KP × { LGDP ) , N−1(SPDTrancℎe(x)), √ρM
Note that N[2](a, b, r) is the bivariate cumulative standard normal distribution function.
∗, the capital charge of that tranche is If a tranche has a detachment point D below the threshold KT ∗, the capital charge of that 100%. If a tranche has an attachment point A above the threshold KT tranche is calculated using the KCMA(l, u) function directly. If the tranche attachment and detachment points straddle the threshold, the capital charge for the fraction above the threshold is evaluated using the formula and capital charge for the fraction below is evaluated based on 100% of the par:
∗ → 100% D≤KT ∗ ≤A → KT KCMA(l, u) (18) KTrancℎe = { ∗ ∗−A KT D−KT ∗ < D → ( A< KT D−A + D−A × KCMA(l, u))
Having obtained tranche capital KTrancℎe, the tranche risk weight is calculated by multiplying KTrancℎe by 12.5. As a final step, a risk weight floor of 15% is applied to the tranche.[36]
Graphical Exposition
Figures 2 and 3 provide a graphical comparison of some of the main approaches to calculating securitisation capital. We use for illustration, inputs corresponding to a granular SME-loan deal. The key inputs are: KIRB = 0.06, LGDIRB = 0.25, M= 5, KSA = 0.06, LGDSA = 0.45, W= 0.08, LGDW = 0.5, ρM∗ = 0.15, CSSFM = 1.17.
Figure 2 shows the thin-tranche capital corresponding to the SFA, IRBA and SA approaches (prior to taking into account the floor effect). Both the SFA and the IRBA approaches imply 100% thin-tranche capital for attachment points below KIRB = 0.06. As one may observe, the IRBA is much more conservative than the SFA for tranches attaching to the right of the value KIRB. Thin-tranche capital only approaches zero for attachment points exceeding 15% under the IRBA, whereas under the SFA very low capital is reached for attachment points of 8%.
One may also observe in Figure 2 that the SA approach thin-tranche capital equals 100% until the attachment point equals: KT = 0.92 × 0.06 + 0.08 × 0.5 = 0.0952. The SA is more conservative than the other approaches and very low thin capital is only reached for attachment points in excess of 20%.
Figure 3 shows the thin-tranche capital implied by the CMA with IRBA and SA inputs. Thin-tranche ∗ = 0.04. The CMA approaches, with IRBA capital equals 100% for attachment points less than KT and SA inputs, exhibit cliff effects less extreme than those implied by the regulatory approaches. These cliff effects have stimulated extensive capital arbitrage activities under the current approach in jurisdictions in which the SFA is permitted.
3. Data
Key points regarding the data we employ are:
1. We use information on 1,771 European securitisation tranches including RMBS, SMEbacked deals and Other Retail loan-backed deals.
2. Using publicly available data from Intex and Reuters, we calculate capital under different approaches.
3. For approaches that require complex inputs such as IRBA estimates of pool capital, we perform our own estimates based on proxy data.
The data employed in this paper are obtained from Intex and Reuters. Our objective is to calculate capital under different approaches. We perform our calculations using data corresponding to the first working day of 2014. We begin with raw data on 4,108 tranches. Our analysis requires pool delinquency data both for calculations of capital under the BCBS Standardised Approach (SA) and as inputs to our IRBA capital calculations. The necessity of having delinquency data reduces the number of useable observations from our initial dataset of 4,108 tranches to 2,944. In Appendix 1, we explain in more detail the filtering process we go through in narrowing the dataset as just described.
Finally, we drop exposures: (i) lacking ratings, (ii) lacking data on tranche contractual maturities or
(iii) in asset classes for which we have insufficient observations to reach dependable conclusions. This leaves us with fully consistent data on three asset classes: RMBS, SME loan-backed securities and Other Retail (which includes auto loan-backed securities). We have 1,771 observations in this final dataset.
Panel a) of Figure 4 shows the breakdown of our 1,771 tranche sample. A large fraction of the sample consists of residential mortgage-backed tranches. It also contains a significant number of granular SME-loan-backed tranches. Tranches that are the most senior in their structures make up 31% of the sample by number.[37] We have a relatively large number of tranches from Spain and other Eurozone periphery countries. This is in some ways helpful as these countries, suffering from persistently reduced bank lending after the crisis, remain the most challenging for European policy-makers seeking to revive the securitisation market, and, hence, are the natural focus of this paper. Panel a) of Figure 4 also shows the wide range of ratings included in our sample. Just 13% of the individual tranches in our sample are AAA-rated.
Panel b) of Figure 4 shows results comparable to those of Panel a) but with individual observations weighted by par value. The asset class breakdown is little affected in that RMBS remains much the largest category, while granular SME-loan-backed tranches also contribute a significant share of total par value. The breakdown by seniority, however, is significantly affected when tranche numbers are weighted by par value. The “Most Senior” tranches now contribute 68% of the whole.
Par-weighting of observations also changes substantially the breakdown of the sample by country and ratings in that 24% of the total are now from Great Britain (rather than the corresponding number from Panel a) of 16%) and 39% are AAA-rated (compared to 13% in Panel a)).
Recall that to implement the SFA and the IRBA versions of the SSFA and the CMA, we need estimates of KIRBA (to which one adds one-year expected losses to obtain KIRB when relevant) and of pool LGD. Appendix 1 provides information on how we go about estimating pool default probabilities for the tranches in our sample required to calculate KIRBA.
In brief, we estimate default probabilities using averages of pool delinquency rates reported by Intex in January 2012, 2013 and 2014. If fewer than three January observations are supplied by Intex, we average over the observations that are available. We impose country and asset-class-specific floors on the default probabilities of the pools corresponding to individual tranches. As estimates of LGDs we use reasonable, country- and asset-class-specific values based on our market experience and informed by asset-class LGD estimates supplied by different banks participating in the AFA quant group. We also take into account the LGD estimates published by the EBA (EBA, 2013).
4. Analysis of current approaches
Key points emerging from the analysis of this section are:
1. The SFA is much less conservative than any other approach.
2. The RBA is very conservative, implying RMBS risk weights ten times higher than the SFA and four times higher than the US SSFA.
3. The CMA yields risk weights slightly less conservative than the US SSFA and comparable to the US SSFA when a technical error in the latter is corrected.
4. The results imply complete dislocation between the capital that US and European banks must hold.
In this section, we analyse the existing Basel II capital approaches using our dataset of 1,771 European securitisation tranches. The analysis may be viewed as a Quantitative Impact Study (QIS) of the current framework, from which a clear and informed assessment of the current situation can be drawn.
When the Basel II framework was put in place, QIS exercises were, of course, performed. But, reliance on agency ratings means that changes in the policies of agencies can transform the picture. Also, the rule changes in the US, following Dodd-Frank, mean that inconsistency in capital across different approaches have more serious implications than they did in the past in that banks from the US and other jurisdictions face very different regimes.
The existing Basel II approaches consist of: (i) the Ratings Based Approach (RBA), (ii) the Ratings Based Standardised Approach (SA(RB)) and (iii) the Supervisory Formula Approach (SFA). In addition, the US has an additional approach, the Simplified Supervisory Formula Approach (US SSFA).
Figure 5 compares the SFA and RBA risk weights. In the upper panels of the figure, each point represents a comparison between the SFA risk weights (shown on the vertical axis) and the RBA risk weight (on the horizontal axis) for the same individual tranche.
The left hand panel contains a scatter plot for all the 1,771 tranches in our dataset while the right hand panel shows a scatter plot only for those tranches that have risk weights less than 200% under both approaches being compared, i.e., the higher credit quality segment of the market.
The lower panels of the figure show the frequency distribution of the gap between the SFA and RBA risk weights. These figures give an idea whether there is a bias between the two approaches being compared and whether there are large discrepancies in the form of greater or lesser conservatism.
The risk weights implied by the two approaches clearly bear little relationship to each other. Conditioning on RBA risk weights being equal to 1,250%, one may observe a very wide range of SFA risk weights. Again, for tranches with risk weights less than 200% (see the upper right hand panel in the figure), there seems to be no relationship between the risk weights implied by the two approaches. Although there are peaks in the vicinity of zero in the frequency distribution of differences between the risk weights (see the lower panels of the figure), there are significant numbers of observations over the whole range of possible differences.
Following Dodd-Frank, US banks are precluded from using agency ratings in securitisation capital calculations. Instead, they use the SFA if they are IRB banks, and a wholly US version of the Simplified Supervisory Formula Approach if they are SA banks. On the other hand, banks in Europe and other jurisdictions continue to employ the RBA as the primary way of calculating capital. Figure 5 shows that the existing capital system has already generated a profoundly uneven playing field for the capital calculations of banks from different jurisdictions that invest in securitisations.
Note also that, in Figure 5, the RBA generates thick lines of points with very different capital levels. Small changes in ratings will, therefore, lead to large jumps in capital. This is one of the factors that is currently driving bank investors away from the securitisation market. Under the RBA, tranches rated “B+” or below receive risk weights of 1250% regardless of seniority, thickness or the reason for the downgrade (for example, performance or methodology changes). This feature, which implies big jumps in capital if a rating falls below the lowest investment grade rating of BBB-, is known among specialists as the “rating cliff-effect”.
QIS-style analysis of the sort we present here does not reveal whether capital levels are consistent with the true risks of the securities involved. While the Basel II approaches were calibrated when the framework was devised more than a decade ago, use of approaches based on ratings means that changes in the policies of ratings agencies may have totally changed the picture. In this sense, reliance on ratings in capital calculations consists of “handing the keys” of banking regulation to the ratings agencies.
It is, therefore, interesting and important to compare the capital levels implied by the approaches with a scientific, bottom-up calculation of risk and capital. The Conservative Monotone Approach (CMA) is a variant of the AFA model described in a series of papers by industry quants organised in the AFA Quant Group (see Duponcheele et al. (2013a,b,c,d)). The CMA is a closed-form model. Its calibration is described in Duponcheele et al. (2014c). That calibration was performed using data from multiple banks and is consistent with the Basel II assumptions on whole loan capital and loan correlations.
The CMA may be implemented either with IRBA or SA inputs. The main difference is that in the IRBA version, pool capital is represented by KIRBA whereas, under the SA version, pool capital is represented by KSA. It is more appropriate to compare the RBA and the SA(RB) to the SA version of the CMA since both employ public information.
Figures 6 and 7 present comparisons of the RBA and SA(RB) risk weights to those implied by the SA version of the CMA. The results show the inconsistency between the model-based and ratings-based risk weights. One may see, either from the upper or lower panels, that some tranches which are deducted under the RBA attract low capital under the CMA.
Figure 8 provides a comparison of risk weights under the SFA and under the CMA with IRBA inputs. The results show that the SFA is, in general, much less conservative than the CMA. The only tranches that have somewhat higher capital under the SFA are a small fraction of tranches that attract close to the maximum 1250% risk weight.
Dissatisfaction with the SFA has led some regulatory authorities to withdraw permission for its use. In the US, the SFA has survived in the post-Dodd-Frank rules for IRBA capital calculations but an alternative Simplified Supervisory Formula Approach (SSFA) has been adopted for SA calculations.[38]
This latter “US SSFA” approach resembles the SSFA described in Section 2, in that it consists of a simple exponential function of attachment and detachment points with a smoothing parameter p. In the “US version” of the SSFA for SA capital calculations, the p parameter equals 0.5.
Figure 9 shows a comparison of the US SSFA (with p= 0.5) to the CMA. Both approaches are calculated using the SA pool capital, KSA, as input adjusted for delinquencies.[39] One may observe that the cluster of points is closer to the diagonal than in the previous figures, suggesting that the approaches are somewhat more consistent.
Figure 10 compares the CMA to the US SSFA subject to a slight modification. As argued in Section 2, it is a mistake in the current SSFA implementations that KT (which consists of pool capital adjusted for delinquencies) is included in the exponential function which spreads capital across tranches. While KT should be used in calculating adjusted attachment and detachment points, KP (in this case KSA) should be inserted into the exponential function. This is what we have done for the “Adjusted” version of the US SSFA shown in Figure 10. Rectifying this conceptual error in the US SSFA creates distinctly greater coherence between the Adjusted US SSFA and the more rigorous, model-based CMA, as one may observe.
Table 3 summarises the comparisons of the risk weights implied by the different approaches for different asset classes and for “Most Senior” and “Other” tranches, using simple statistics. Here, the means are either simple arithmetic averages or averages weighted by the relative par values of the tranches in question. The asset classes we examine are prime RMBS, SME and Other Retail.
As well as the RBA, SFA, and the SA(RB), we include the US SSFA in its standard version. We also include an “adjusted” version of the US SSFA in which KP rather than KT is included in the exponential smoothing function, as advocated above. In all cases, the SFA is the least conservative approach. The CMA is slightly less conservative than the US SSFA but yields average risk weights that are quite close to those implied by the Adjusted US SSFA.
A striking feature of Table 3 is the extremely conservative results obtained using the ratings based approaches, the RBA and the SA(RB). For “Most Senior” RMBS tranches, risk weights are four times higher under the RBA than under the US SSFA and the CMA and ten times higher than under the SFA. For “Other” tranches, the ratios are not so extreme but the RBA nevertheless implies much higher capital than the other approaches.
Table 4 shows the rank correlations between the individual tranche capital amounts for pairs of approaches. For any two variables, the rank order correlations are calculated by attributing an integer ranking to each observation and then calculating the linear correlation of the two integer rankings.[40] If two approaches to calculating capital were completely consistent, the ranking of the capital that they would yield for a set of tranches would coincide, and hence their rank order correlation would equal one. If two capital approaches bear no relationship to each other, the rank order correlation would be close to zero.
For “Most Senior” tranches, the SFA risk weights have an almost negligible rank order correlation with the ratings based approaches of the RBA and the SA(RB). The low rank-order correlations for the “Most Senior” tranches between the different approaches is partly a reflection of the fact that almost all “Most Senior” tranches under the SFA hit the 7% floor[41] and will have the same rank, whereas there will be a variety of external ratings and a variety of mapped tranche risk-weights and a variety of ranks under the RBA and SA(RB).
The correlations for “Other” tranches between the current external ratings based approaches (RBA and SA(RB)) and the current SFA are fairly low (at 42% and 43% respectively) and marginally better
39 To be precise, the capital input employed is (1 −W) × KSA + W× 0.5, where W is a measure of delinquencies. 40 The linear correlation of two variables is simply the ratio of the covariance of two variables to the product of their standard deviations. 41 In Table 3, the mean of “Most Senior” tranche risk weights under the SFA is equal to 7%, the floor under this approach.
with the US SSFA (at 54% and 54% respectively). This shows that external ratings based approaches do not create a level-playing field with formula based approaches. The rank-order correlation between the SFA and the US SSFA rises to 61%.
It is striking, though, that the CMA (SA) and US SSFA have a high rank order correlation equal to 94%. This becomes even greater at 97% when the latter is adjusted by including KP in the exponential function, as we advocate. This is an important result, as it shows that the SSFA framework can be adapted to match the CMA, and that the matching is an issue of calibration rather than methodology. This finding is an important motivation for the proposal we make in Section 7.
5. Analysis of the bcbs 269 approaches
Key points emerging from the analysis of this section are:
1. Again, the risk weights implied by the ratings based approach, the ERBA, is unrelated to that implied by the formula-based approaches, the IRBA and SA.
2. For “Most Senior” tranches of RMBS and SME securitisations, the ERBA risk weights are on average five times higher than those implied by the formula-based IRBA and SA and twice as high for Other Retail tranches.
3. The results are qualitatively similar for “Other” tranches although the ratios between the capital implied by the pair of approaches are smaller.
4. Under the IRBA and SA, the risk weights for a very large fraction of “Most Senior” tranches is determined by the 15% floor, suggesting that these approaches are not risk sensitive for the high credit quality part of the market.
In this section, we turn to an analysis of the three approaches advocated in the current Basel proposals BCBS (2013c), also known as BCBS 269. As in Section 4, we present our results using scatter plots, histograms and tables of means and rank order correlations. Again, we use the CMA as a benchmark, so we are not just performing a QIS exercise, but also benchmarking the models against a scientifically established standard.
To reiterate, the approaches proposed in BCBS 269 are: (i) the Internal Ratings Based Approach (IRBA), (ii) the External Ratings Based Approach (ERBA) and (iii) the Standardised Approach (SA).
As explained in Section 2, the first and third of these make use of the Simplified Supervisory Formula Approach (SSFA), an ad hoc exponential smoothing function with a parameter, p. In the SA, the p-parameter is set equal to 1.0 for all tranches except re-securitisations (for which the parameter equals to 1.5). The SA is identical to the “US SSFA” discussed in Section 4, except that the p-parameter in the US SSFA is 0.5. In the IRBA, the p-parameter is a linear function of tranche and pool characteristics.
This section compares the risk weights implied by the SA, IRBA and ERBA approaches. Figure 11 presents scatter plots of the relationships between the risk weights implied by the three BCBS (2013c) approaches for our 1,771 tranches. As in the last section, the left hand side figures show risk weight plots including all the tranches in our sample. The right hand side figures “zoom in” on tranches for which both of the two approaches illustrated imply risk weights less than 200%. The right hand side figures, therefore, shed light on the high quality part of the market.
The plots reveal the inconsistency of the risk weights implied by the three approaches. In the scatter plots, there are clouds of points in the lower left and upper right section of the plots which reflect some connection between the very highest risk and lowest risk tranches under pairs of approaches. But there are many tranches which are evaluated in totally different ways by one pair of approaches or another.
The histograms from Panels a), b) and c) of Figure 11 show, in broad terms, that the IRBA and SA bear the closest connection but that the ERBA is completely incoherent with the formula-based approaches of IRBA and SA. Even the IRBA and SA are not that close, as the spike in the left histogram of Panel a) is likely to reflect observations for which tranches hit the 15% floor under the two approaches or are deducted under both approaches. But a sizeable discrepancy is evident in the histogram, representing instances of substantial deviations between the capital levels implied by the two approaches.
To facilitate comparison of the ratings based approaches, Figure 12 presents a scatter plot of ERBA versus the current RBA capital. One may observe that the ‘rating cliff effect’ is partially mitigated in the ERBA. The figure reveals that for low quality tranches, the RBA is more conservative, whereas for highly rated tranches (which matter much more for bank investment in securitisations), the ERBA is substantially more conservative.
The IRBA and SA would yield closer results, if it were not for Technical Error #3 discussed in Section 2: the inadequate adjustment for delinquencies in the IRBA version of the SSFA. Figure 13 compares the pool capital under the two approaches, after adjusting correctly for delinquencies. Panel a) shows, for our dataset of tranches, KIRB versus KPool(SA) (= (1 −W) × KSA + W× 0.5)) while Panel b) plots (1 −W) × KIRBA + W× LGDW against KPool(SA). It is apparent that adjusting KIRBA (and thus KIRB) would bring the IRBA and SA capital calculations much closer together.[42]
Figure 14 compares the BCBS 269 approaches with the CMA for our dataset of individual tranches. As we argued in Section 4, such comparisons allow one to go beyond a pure QIS exercise and to see how the capital levels implied by the regulatory approaches compare to a scientifically derived estimate of appropriate capital.
Panel a) of Figure 14 shows IRBA capital versus the CMA with IRBA inputs. There is some correlation apparent between the tranche capital levels implied by the two approaches. The IRBA appears generally more conservative.[43] Panel b) compares ERBA and CMA capital for individual tranches. The ERBA is much more conservative, especially for higher credit quality tranches. Judging from the plot, the two approaches appear little correlated. Panel c) compares SA capital to that implied by the SA version of the CMA. The SA is substantially and consistently more conservative than the CMA using SA inputs, especially for “Most Senior” tranches, but the plot suggests the two approaches are somewhat correlated.
Table 5 presents a comparison of the mean levels of the risk weights implied by the different approaches, distinguishing between individual asset classes and between “Most Senior” and “Other” tranches. The means are presented both in the form of simple arithmetic averages and averaging across tranche risk weights weighted by the relative par values of the tranches involved.
Table 5 suggests some striking comparisons. ERBA risk weights for “Most Senior” RMBS and SME tranches are five times higher under the ERBA than under the IRBA and the SA. For Other Retail, the ERBA risk weights are about twice as high as under the formula-based approaches for “Most Senior” tranches. This finding is unaffected when one calculates averages inclusive of par-value weights. With “Other” tranches, the contrast is qualitatively the same, although the ratios are less extreme.
Table 5 allows one, also, to compare the average risk weights levels implied by the BCBS 269 approaches with the average CMA risk weights. The CMA risk weights are similar to those implied by the SA and IRBA for “Most Senior” tranches since both are constrained by the floor. For “Other” tranches, the CMA suggests risk weights slightly lower than the IRBA, about 30% below the SA and about 40% less than the ERBA.
Table 6 shows tranche risk weight rank order correlations for the three BCBS 269 approaches (IRBA, ERBA and SA) and for the CMA with its IRBA and SA variants. The low rank order correlations for the “Most Senior” tranches between the different approaches again reflect the influence of the fixed 15% capital floor. For the “Other” tranches, the ERBA risk weights rank order correlations are much lower than those observed between the formula-based approaches among themselves. We hypothesise that this reflects the differences in the view of relative risk taken by ratings agencies and regulators. This is not just an issue of calibration and raises the fundamental question of whether it is sensible for regulators to delegate bank capital decisions to ratings agencies which take very different views on the relative risk of different asset classes, for example, from the regulators themselves.
6. Alternative approaches
Key points that emerge from the analysis of this section are:
1. By using the SSFA (including delinquencies) with a single p-parameter that is asset class specific, it is possible to replicate quite accurately the capital implied by the model based CMA, with a very good fit for all but the most junior tranches.
2. By adjusting this variant of the SSFA with an additional parameter, it is possible to obtain a good approximation to the CMA for all tranches.
In this section, we examine alternatives to the BCBS 269 approaches. Duponcheele et al. (2014b) propose re-parameterised versions of the SSFA. The first re-parameterised version consists of using the SSFA in ways similar to the SA and IRBA models, but allowing the p-parameter to take different values depending on asset class. These p-parameter values are constant for any given asset class.[44]
In the case of the SA version of this single-p SSFA version (by SA version, we mean here that SA inputs are employed, most notably KSA), one obtains a model that is better calibrated than the BCBS 269 SA and possesses greater and more plausible risk sensitivity since it distinguishes appropriately between different asset classes. In the case of the IRBA version of the model, we employ IRBA inputs in the form of KIRBA and employ constant, asset-class-specific p-parameters (rather than attempting to allow p to depend linearly on deal characteristics as in the IRBA).[45]
Panel a) of Figure 15 compares the SSFA with an asset-class-specific p-value to the CMA with SA inputs. The risk weight plots show that it is possible to achieve a close match to CMA risk weights using this approach. The re-calibrated SSFA gives slightly more conservative risk weights in that the dots shown appear just above the diagonal. The sub-200% frequency plot is the best plot of all the different sub-200% figures presented in this paper, with over 95% of the tranches with a risk weight of less than 200% having “very small” differences in risk weight from those implied by the benchmark CMA.
Panel b) of Figure 15 compares a Modified SSFA (MSSFA) to the CMA with SA inputs. This MSSFA adds a degree of freedom to the single p-parameter SSFA. Again, the two p-parameters in this model are asset class specific and calibrated for representative deals using the CMA[46]. The 0%- 1250% frequency plot is the best plot of all the different 0%-1250% figures in this paper, with over 95% of all tranches having “small” risk weight differences between this version of the SSFA and the benchmark CMA.
The results suggest that the two p-parameter version does a better job than the one p-parameter SSFA in fitting the mezzanine tranches. The cluster of points is closer to the diagonal in the left hand plot which shows results for all the tranches in the sample. The accuracy of the fit between the SSFA and the CMA for the sub-200% risk weight tranches is slightly worse compared to Panel a), however it is making capital slightly more conservative, it appears.
Figure 16 resembles Figure 15 except that the inputs of the benchmark CMA employed are IRBA rather than SA. The conclusions obtained from Figure 15 hold for Figure 16.
Tables 7 and 8 provide risk weight averages and rank order correlation estimates, respectively, for the alternative industry models. These include the Calibrated SSFA and the Calibrated MSSFA with IRBA and SA inputs developed by Duponcheele et al. (2014c). These models are “calibrated” in the sense that asset-class specific parameters are employed in calculating risk weights.
The risk weight results on the calibrated SSFA and MSSFA may be compared in the tables with those implied by the CMA in its IRBA and SA versions. It is apparent that the average risk weight levels for different asset classes and the rank order correlations for these calibrated models are very close to those of the CMA. (The tables also include results for an HQS SSFA model to which we shall return in the next section.)
7. Our proposal: a european ssfa
The key points we make in this section are:
1. For High Quality Securitisations (HQS), European regulators should adopt a European SSFA reflecting the specificities of the European market.
2. In the long run, this European SSFA could be consistent with the variants of the SSFA that emerge from the work of the Basel RSW for securitisation in general. These latter variants could be applied to non-HQS.
3. In the short-run, the European SSFA should be added to the current Basel II set of approaches in the CRR and should be treated as higher in the regulatory hierarchy than the RBA.
4. The European SSFA we propose would be extremely similar in form to the SSFA used in the SA. Nevertheless, it would correct the several technical errors in the BCBS 269 proposals discussed in Section 2.
The Proposal
Building on the insights provided by earlier sections, we now consider how regulators in Europe might devise appropriate capital for European High Quality Securitisations (HQS). We recognise, in framing our proposal, a set of constraints on what is feasible. These are:
1. Simplicity[47] – For example, regulators do not wish, it seems, to differentiate charges for different asset classes.
2. Consistency with Basel – The approach should be consistent with the approaches likely to be adopted by the RSW and applied in jurisdictions outside Europe, most notably the US.
3. Having precedents – The approach taken should resemble adjustments made in the past by European and other authorities actively involved in framing the Basel rules.
We suggest that, once the European authorities have determined an HQS category, they adopt a “European SSFA” that would be used to calculate regulatory capital for this category. The current rules would remain for non-HQS tranches until new rules corresponding to the current Basel proposals are implemented. The European version of these rules would allow for the continuation of the European SSFA for HQS.
The European SSFA would be similar in form to the US SSFA but would have a different value of the p-parameter, and would apply a multiplicative adjustment factor, AFHQS, to pool capital for performing assets. The approach may be expressed mathematically as follows:
The pool capital inputs are [48]:
KT = AFHQS × (1 −W) × KP + W× 0.5 { in IRBA mode (19) KP = for performing assets{KIRBA in SA mode KSA
Here, terms that enter the European SSFA but not the US SSFA are shown in bold font. W is the percentage of delinquent assets. KIRBA and KSA are the capital charges on performing assets in IRBA and SA mode, respectively. These inputs are simple and transparent.
The parameter a is modified to take into account the HQS nature of the pool, the other equations being the same as in the SSFA framework. As above, A and D denote the attachment and detachment points of the tranche.
= l max (0, A−KT) = u D−KT −1 a = (20) pHQS × KP eau−eal = KSSFA(l, u) { a(u−l)
We calculate the attachment and detachment points by taking into account the over- or undercollateralisation. Making this adjustment rectifies Technical Error #1 from Section 2. Note that in the model as described in equation (20), pool capital for performing assets KP (rather than KT) enters the a parameter, correcting Technical Error #2 from Section 2. The fact that in equation (19), KT is adjusted for delinquencies W (as it enters into the expression for KT) serves to correct Technical Error #3 from in Section 2. Finally the European SSFA does not include the inappropriately defined tranche maturity MT (which is discriminatory in a European context), thus correcting Technical Error #4 as described in Section 2.
Finally, tranche capital is determined in a standard manner within the SSFA framework as follows:
→ 100% D≤KT → KT ≤A KSSFA(l, u) (21) KTrancℎe = { KT−A D−KT → ( A< KT < D D−A + D−A × KSSFA(l, u))
The tranche risk weight equals KTrancℎe multiplied by 12.5. Finally, after calculating capital using the above formula, a floor value is imposed.
To summarise, the primary differences between the formulae in the European SSFA for HQS and the US SSFA are shown above in bold font; these consist of: (i) an HQS Adjustment Factor AFHQS,
(ii) the possibility of using KIRBA as an input and (iii) a constant parameter pHQS, which takes a different value from the corresponding parameter in the US SSFA. Additionally, in the parameter a of the exponential function, we use the variable KP instead of KT.
Note that our approach permits both IRBA and SA uses. Banks would be able to employ as inputs either KIRBA or KSA depending on what information was available to them. As we saw in Section 5, correctly adjusting KIRBA for delinquencies in the calculation of the threshold KT is likely to yield SA and IRBA risk weights that are more correlated.
Our HQS calibration suggests that the HQS Adjustment Factor AFHQS, should be set at 0.6. In Duponcheele et al. (2014b), a calibration of the SSFA per asset class is proposed, as well as a modified version of the SSFA (MSSFA) with 2 parameters. In both cases the calibration is made using the benchmark model, the CMA. For the key asset classes relevant to the HQS category (Low Risk Weight RMBS, SME and Other Retail), the parameter p[1] (equivalent to (1 −AFHQS)) was 0.42, 0.54 and 0.57 respectively for Senior tranches, and 0.31, 0.49 and 0.48 respectively for Non-Senior tranches, giving a weighted average[49] p[1] value of 0.37, or in other terms, an average AFHQS of 0.62. The value of 0.6 is thus chosen for a “regulatory” AFHQS.
In Duponcheele et al. (2014b), the parameter p[2] of the MSSFA (equivalent to pHQS) for the HQS category (Low Risk Weight RMBS, SME and Other Retail) was 0.62, 0.65 and 0.73 respectively for Senior tranches and 0.86, 0.73 and 0.9 respectively for Non-Senior tranches, giving a weighted average p[2] value of 0.78. A value of 0.8 is thus chosen for a “regulatory” pHQS.
The combined choice of AFHQS = 0.6 and pHQS = 0.8, will lead to a capital surcharge[50] post securitisation of +40% when compared to the situation pre-securitisation, before taking into account the additional capital surcharge linked to the application of the floor.
In a recent speech, Mark Carney stated that: “[The regulators have] learned about the unintended consequences of prudential capital and retention requirements on the securitisation market. Regulatory changes arguably treat asset-backed securities in ways that appear to be unduly conservative, particularly relative to other forms of long-term funding. Efforts to rebalance these incentives are now a priority” (Carney, 2014).
In Europe, covered bonds are the main form of long-term funding product which competes with securitisations. To avoid the product arbitrage alluded to in the above statement and created by unduly conservative capital treatment for securitisations, we suggest that European regulators apply as soon as possible a 10% risk weight floor for a HQS tranche when using SA inputs. 10% is the specific risk weight that Europe applies to covered bonds (even though Basel recommends 20%[51]).
When using IRBA inputs, and while the RBA is in force for non-HQS securitisations, we propose that the floor of 7% risk weight should apply. Indeed, there should not be a situation where the floor for non-HQS is lower than for HQS. Under the current mapping, 7% risk weight is the value that a non- HQS granular AAA-rated senior securitisation tranche would have.
Our proposal for the HQS floors when using IRBA and SA inputs is reflected in the decision tree in the next section.[52]
Panel a) of Figure 17 compares the HQS European SSFA with the existing SFA using IRBA inputs. The scatter plot is similar to the one representing the SFA vs. CMA (IRBA) in Figure 8. Panel b) of Figure 17 compares the HQS European SSFA in SA mode, with the existing RBA (and is a similar plot to the RBA vs. CMA (SA) plot in Figure 6). Panel c) of Figure 17 compares the HQS European SSFA in SA mode with the existing SA(RB) (and is comparable to the SA(RB) vs. CMA (SA) plot in Figure 7).
Particularly interesting are the results in Figure 18. Panel a) of Figure 18 shows the HQS European SSFA (IRBA) vs. the CMA using IRBA inputs, while Panel b) shows the HQS European SSFA (SA) vs. the CMA using SA inputs. In both figures, the plotted points are concentrated around the diagonal indicating that discrepancies between the capital implied by the two approaches is small. The HQS European SSFA, thus, supplies a very good approximation to the capital implied by the benchmark CMA model.
Let us now return to Tables 7 and 8 which compared risk weights obtained using industry alternative models to those implied by the CMA. These tables also include results and comparisons for the HQS European SSFA developed in this section.[53] It is apparent from Table 7 that the average risk weight levels of the HQS European SSFA and CMA are close. The rank order correlations are very high (94% and 97% for the IRBA and SA versions) for “Other” tranches. They are lower for the “Most Senior” tranches just because of the floor. When we drop the floor in the calculation, the rank order correlations return to very high levels for the “Most Senior” tranches.
Table 9 shows the fraction of observations for which risk weights equal the floor values implied by the different formula-based approaches. One may observe from the table that 96% of “Most Senior” tranches have capital equal to the 15% floor under the IRBA and 92% under the SA and 97% under the HQS European SSFA (IRBA) and 99% under the HQS European SSFA (SA).
The large fraction of “Most Senior” tranches which have risk weights equal to 15% underlines the fact that the “fixed” floors in formula-based approaches may substantially reduce the risk sensitivity of these approaches for high quality securitisations. Our view is that even the floor should be sensitive to risk. One could achieve this, for example, by setting the floor equal to 5% plus 10% times the SA pool risk weight, reflecting the idea that securitisations with very low risk weight pools are likely to have fewer hard-to-assess sources of risk.
For “Other” tranches, the percentages for which risk weights equal a fixed floor of 15% is surprisingly high (between 26% and 46% depending on the assessment method). We hypothesise that this reflects the fact that ratings agencies oblige issuers to devise structures with high senior-tranche attachment points by viewing some asset classes very conservatively compared, for example, to regulators.
Other Considerations
There are two significant considerations that might justify modifying the calibration of the European SSFA suggested above.
First, the proposed, capital formula has as pool capital input KIRBA rather than KIRB. This is in contrast to the Basel II SFA and the proposed BCBS 269 IRBA which both take as capital inputs KIRB. Recall that KIRB = KIRBA + EL where KIRBA equals the unexpected loss based Basel II capital for the pool assets and EL is the expected loss of those assets. (In Europe, the expected loses are measured over a 1 year horizon).
Why is it preferable to employ KIRBA as an input? Using KIRBA makes the impact of securitisation capital formula much more transparent in the sense that one can infer directly from the scaling and power parameters in the formula the ratio of the capital a bank would hold against all the tranches to the capital it would hold against all the assets (leaving aside the additional impact on capital of the floor included in the securitisation capital formula).
While we therefore advocate use of KIRBA in the European SSFA, we recognise that, for simplicity and the desire to make as few changes as possible vis-à-vis current arrangements, regulators may want to use KIRB as the capital input. In this case, it would be necessary to adjust the calibration of the European SSFA described above.
Second, in Europe, IRBA inputs can be calculated only by banks which are formally authorised by their regulators to use IRB methodologies for a given asset class, after a stringent review of the process and on-going monitoring. Therefore, a sponsor or originating bank will only calculate IRBA inputs if the “IRB standards”, described in Articles 142 to 146 of the European CRR, are respected.
In the future, one may expect that regulators in Europe, like those in other jurisdictions, will permit the use of IRBA capital formulae with estimates of KIRBA or KIRB under looser informational and regulatory requirements. (To illustrate, our QIS exercises, reported above, involve calculating IRBA inputs to the different formulae using proxies to the data available to originators operating under IRB standards.) In this event, a second reason for adjusting the calibration described above would be to impose more conservative regime on banks relying on proxy capital data inputs rather than on estimates derived under IRB standards.
These considerations serve as the basis for a calibration we have performed, details of which are provided in Appendix 3. Balancing the need for simplicity and transparency and given (i) that European banks currently produce IRBA inputs under “IRB standards” and (ii) KIRB is already defined in European legislation, we suggest that in an immediate implementation of the European SSFA the authorities should employ AFHQS = 0.55 and pHQS = 0.6 and KP = KIRB when using IRB inputs. This proposal for a version of the European SSFA to be implemented immediately is summarised in Table 10-a.
Once the region’s immediate needs have been tackled, European regulators could consider reflecting its HQS treatment within the Basel proposals. As mentioned above, one might expect that use of IRB proxies (as employed in the US) will become possible for banks in Europe. On the other hand, there will be no need to retain use of KIRB in place of the more transparent capital input KIRBA. Hence for HQS, we suggest parameters corresponding to Choice #4 of the table in Appendix 3, i.e., AFHQS = 0.6 and pHQS = 0.8, and KP = KIRBA or KSA.
For non-HQS tranches, with SA inputs, the factor pHQS could be increased from 0.6 to 1.0 (to be compatible with BCBS 269 SA). The parameter AFHQS could be raised from 0.6 to 0.8 (instead of an implicit 1.0 in the BCBS 269 SA). Combined, these parameters imply a capital surcharge of +80% of KSA (before taking into account the additional effect of delinquencies and of the floor).
For non-HQS tranches, with IRBA inputs, the factor pHQS could be increased from 0.8 to 0.9 slightly lower than the 1.0 chosen for SA inputs. The parameter AFHQS could be raised from 0.6 to 0.7, slightly lower than the 0.8 for SA inputs. Combined, it generates a capital surcharge of +60% of KIRBA (before taking into account the effect of the delinquencies and of the floor).
The values mentioned in the previous two paragraphs for non-HQS tranches are not deduced from a scientific approach or based on a QIS as the ones presented for HQS tranches in this paper. Instead, they may be viewed as sensible choices if it is thought that, for a given pool risk weight, non-HQS securitisations should have greater capital charges than HQS securitisations, and that an SA-based calculation should lead to a higher capital charge than an IRBA-based one.
For the floor, both HQS and non-HQS could have a risk-sensitive floor, equal to 5% plus 10% times the SA pool risk weight (for IRBA and SA calculations), but the HQS floor would have a maximum of 15%, and the non-HQS floor would have a minimum of 15%.
Lastly, we propose that an external-ratings-based approach should, as the least reliable method of calculating capital, be placed at the bottom of the hierarchy.[54] Use of the external ratings based approach would be appropriate for non-standard cases, such as future flow securitisation, for example, for which it is not possible to calculate attachment points based on collateral and one must, therefore, rely on an unreliable risk parameter, namely tranche subordination, instead. For those situations, Europe could still employ a ratings based approach, while the US, subject to Dodd-Frank, would use the formula with tranche subordination data inputs.
This hierarchy (HQS IRBA, HQS SA, Non-HQS IRBA, Non-HQS SA, Non-HQS ERBA) would have the major advantage of establishing a level playing field between US and Europe banks and would discipline the securitisation industry towards simple, transparent and consistent HQS securitisations.
Table 10-b summarises the above, and represents what could be done in a future capital accord.
8. Conclusion
European banks primarily rely on the Basel II Ratings Based Approach (RBA) in calculating regulatory capital for securitisations. Since the crisis, ratings agencies have increased the conservatism of their ratings criteria. Thus, even if regulatory capital rules remained unchanged[55], post-crisis methodology changes by ratings agencies have substantially increased the conservatism of the capital framework in Europe.
The significant boost in conservatism is hard to square with the generally good performance of the European securitisation market during the crisis. Despite a macroeconomic stress more severe than the one experienced in the US, most European securitisation sectors exhibited negligible default rates. (Exceptions were the European CMBS market which was subject to refinancing risk and European CDOs of ABS transactions that included some US ABS tranches in their pools.)
Senior European policy-makers have recently emphasised the need to revive the market in securitisations. For this, Europe needs to remove the regulatory capital roadblock on investment in securitisations, at least in the simpler, more transparent segment of the market. A possible approach was mooted by the Bank of England (BoE) and the European Central Bank (ECB) in their joint papers (BoE-ECB (2014a) and (2014b)). The approach would consist of identifying a category of High Quality Securitisations that would be subjected to a differentiated treatment in rules pertaining to bank capital and liquidity.
While there has been much discussion since the publication of the BoE-ECB papers of how HQS might be defined, there has, so far, been little informed debate on how capital rules might be adjusted for HQS. The recent EBA Discussion Paper on simple, standard and transparent securitisations (EBA, 2014) published this October addresses issues core to the HQS debate but does not suggest a possible formulation for HQS capital charges.
This paper develops a proposal for a simple set of measures that would be effective in reviving the European market. Our proposal involves the immediate adoption of a “European Simplified Supervisory Formula Approach (SSFA)”. The SSFA is already employed in US regulations and is the basis of much of the current Basel proposals on securitisation capital developed by the Basel Ratings and Securitisation Workstream (RSW).
Europe should push ahead with the implementation of an adjusted SSFA for HQS. This approach could be made consistent with the version of the SSFA that emerges from the Basel RSW (see BCBS (2013c)). The notion of adopting a Basel capital formula with an adjustment suitable for European conditions has precedents in the adjustment adopted for retail SME lending in Europe or in the treatment in Europe of Covered Bonds. Similar types of legislation should be adopted for European HQS by the European authorities.
In a significant departure from the Basel framework, the US Congress passed the Dodd-Frank act to remove the detrimental effect of agency ratings on bank capital requirements. In the context of securitisation capital, to enable greater use of formula-based capital approaches, this involved relaxing the IRB standards and introducing the “US SSFA”. In a similar way, the European Parliament could pass amendments to remove or reduce substantially the detrimental effects of agency ratings. This could be achieved by introducing a “European SSFA” and by altering the hierarchy used in capital rules so that agency ratings are employed as a last resort rather than as the de facto primary basis for calculating capital.
In any case, at a minimum, the European Parliament should pass the necessary amendments to correct the four technical errors (described in Section 2 of this paper) present in the proposed Basel rules (see BCBS (2013c)).[56]
To summarise, allowing for legacy issues in IRB and the need to differentiate regulatory bank capital for HQS, we propose that the decision rule a European bank would follow in using the “European SSFA” would be as shown in the graphic below:
A Bank’s Decision Rule Under the Proposed HQS European SSFA[57]
Apply European SSFA with Yes Yes Is the Are A, D, KP = KIRB transaction W and KIRB AFHQS = 0.55 and pHQS = 0.6 HQS? known? (resulting surcharge of +15%) RW Floor= 7%
No
Apply European SSFA with Yes Are A, D, KP = KSA No W and KSA AFHQS = 0.6 and pHQS = 0.8 known? (resulting surcharge of +40%) RW Floor= 10%
No
Apply Current CRR with RBA/SA(RB)/SFA/IAA
The European SSFA for HQS is summarised in equation (22) appearing in the text box below. It should be used with the parameters specified in the decision tree above:
European SSFA User inputs: W, KP, A, D Regulatory inputs: AFHQS, pHQS, Floor
KT = AFHQS × (1 −W) × KP + W× 0.5 l= max (0, A−KT) u= D−KT −1 a= pHQS × KP eau−eal KSSFA(l, u) = a(u−l) → 100% D≤KT → KT ≤A KSSFA(l, u) KTrancℎe = { KT−A D−KT → ( A< KT < D D−A + D−A × KSSFA(l, u)) RWTrancℎe = max (Floor; KTrancℎe × 12.5) (22)
Capital requirements that depart from neutrality in a controlled and reasonable manner are the key to reviving sustainable, high quality securitisations in Europe. The “European SSFA” we propose, while consistent in approach to the BCBS 269 approaches, is a solution adapted to simple, transparent and consistent securitisations.
9. References
Bank of England and European Central Bank (2014a) “The Impaired EU Securitisation Market: Causes, Roadblocks and How to Deal With Them,” Bank of England and European Central Bank Joint Statement, March
Bank of England and European Central Bank (2014b) “The Case for a Better Functioning Securitisation Market in the European Union: A Discussion Paper,” Bank of England and European Central Bank Joint Publication, May
Basel Committee on Bank Supervision (2001) “Working Paper on the Treatment of Asset Securitisation,” Bank for International Settlements, October
Basel Committee on Bank Supervision (2006) “International Convergence of Capital Measurement and Capital Standards: A Revised Framework, Comprehensive Version,” Bank for International Settlements, June
Basel Committee on Bank Supervision (2012) “Revisions to the Basel Securitisation Framework,” Consultative Document, Bank for International Settlements, December, (BCBS 236)
Basel Committee on Banking Supervision (2013a) “The regulatory framework: balancing risk sensitivity, simplicity and comparability,” Discussion Paper, Bank for International Settlements, July
Basel Committee on Banking Supervision (2013b) “Basel III, the Liquidity Coverage Ratio and liquidity risk monitoring tools,” Bank for International Settlements, January
Basel Committee on Bank Supervision (2013c) “Revisions to the securitisation framework,” Consultative Document, Bank for International Settlements, December, (BCBS 269)
Board of Governors of the Federal Reserve System (2013), “Implementing the Supervisory Formula Approach for Securitization Exposures,” October
Carney, Mark (2014) “Regulatory work underway and lessons learned,” 29th Annual G30 International Banking Seminar, Washington D.C., Speech
Draghi, Mario (2014a) “Keynote Speech at the Eurofi Financial Forum,” Milan, 11th September, Speech
Draghi, Mario (2014b) “Introductory Statement to the Press Conference (with Q&A),” Frankfurt Am Main, 4th September, Speech
Duponcheele, Georges, William Perraudin and Daniel Totouom-Tangho (2013a) “A Principles-Based Approach to Regulatory Capital for Securitisations,” BNP Paribas mimeo, April, available at: http://www.riskcontrollimited.com/public/Regulatory_capital_for_securitisations.pdf
Duponcheele, Georges, William Perraudin and Daniel Totouom-Tangho (2013b) “The Simplified Arbitrage-Free Approach: Calculating Securitisation Capital based on Risk Weights Alone,” BNP Paribas mimeo, July, available at: http://www.riskcontrollimited.com/public/Simplified_AFA_revised.pdf
Duponcheele, Georges, William Perraudin and Daniel Totouom-Tangho (2013c) “Maturity Effects in Securitisation Capital: Total Capital Levels and Dispersion Across Tranches,” BNP Paribas mimeo, September, available at: http://www.riskcontrollimited.com/public/Maturity_Effects_in_Securitisation_Capital.pdf
Duponcheele, Georges, William Perraudin, Alastair Pickett and Daniel Totouom-Tangho (2013d) “Granularity, Heterogeneity and Securitisation Capital,” BNP Paribas mimeo, September, available at: http://www.riskcontrollimited.com/public/Granularity_Heterogeneity_and_Securitisation_Capital.pdf
Duponcheele, Georges, William Perraudin and Daniel Totouom-Tangho (2014a) “Reducing the Reliance of Securitisation Capital on Agency Ratings,” BNP Paribas mimeo, February, available at: http://www.riskcontrollimited.com/public/Reducing_the_Reliance.pdf
Duponcheele, Georges, William Perraudin and Daniel Totouom-Tangho (2014b) “Calibration of the Simplified Supervisory Formula Approach,” BNP Paribas mimeo, March, available at: http://www.riskcontrollimited.com/public/Calibration_of_SSFA.pdf
Duponcheele, Georges, William Perraudin, Alexandre Linden and Daniel Totouom-Tangho (2014c) “Calibration of the CMA and Regulatory Capital for Securitisations,” BNP Paribas mimeo, April, available at: http://www.riskcontrollimited.com/public/Calibration_of_CMA.pdf
European Banking Authority (2013) “Third interim report on the consistency of risk-weighted assets SME and residential mortgages,” External report, December.
European Banking Authority (2014) “Discussion Paper on simple, standard and transparent securitisations,” (EBA/DP/2014/02), October
European Commission LCR Delegated Act (2014), October
European Commission Solvency II Delegated Act (2014), October
European Insurance and Occupational Pensions Authority (2013) “Discussion Paper on Standard Formula Design and Calibration for Certain Long Term Investments,” EIOPA Discussion Paper (163), April
Fitch Ratings (2014) “Basel III Capital Charges Affect Investor Confidence in European Securitisation Market,” Fitch Ratings Structured Finance: Special Report, September
Gordy, Michael and David Jones (2003) “Random tranches,” Risk, pp78-83, March
Juncker, Jean-Claude (2014) “Mission Letter, Jonathan Hill, Commissioner for Financial Stability, Financial Services and Capital Markets Union,” 10th September
Medcraft, Greg (2014) “Building securitisation markets to last – The way forward,” The Eurofi Financial Forum, Milan, September
Mersch, Yves (2014) “For a European capital markets union – Securing stability, overcoming fragmentation,” Frankfurt Am Main, 10th September, Speech.
Office of the Comptroller of the Currency, Treasury, and the Board of Governors of the Federal Reserve System (2013) “Final Rule,” Federal Register Rules and Regulations, 78(198), October
Perraudin, William (2014a) “Covered Bond versus ABS Liquidity: A Comment on the EBA’s Proposed HQLA Definition,” Risk Control Limited Research Paper, 17, January, available at: http://www.afme.eu/WorkArea/DownloadAsset.aspx?id=10360
Perraudin, William (2014b) “High Quality Securitisation: An Empirical Analysis of the PCS Definition,” June, available at: http://www.riskcontrollimited.com/public/High_Quality_Securitisation.pdf
Perraudin, William (2014c) “Quantitative Impacts of BCBS 269 Securitisation Capital Approaches,” Risk Control Limited Report, 14-73a, August, available at: http://www.riskcontrollimited.com/public/Quantitative_Impacts_of_BCBS_269_Securitisation_Capital_Approaches.pdf
Perraudin, William (2014d) “Securitisation Purchases by the ECB - What is ‘Senior Enough’?,” Risk Control Limited Report, 14-81a, September, available at: http://www.riskcontrollimited.com/public/Securitisation_Purchases_by_the_ECB_What_is_Senior_Enough.pdf
Peretyatkin, Vladislav and William Perraudin (2004) “Capital for Structured Products,” Risk Control Limited Report, November, available at: http://www.riskcontrollimited.com/research_papers/Peretyatkin_Perraudin_ref4_2.pdf
Pykhtin, Michael and Ashish Dev (2002) “Credit Risk in Asset Securitisations: Analytical Model,” Risk, 15(5), S16-S20, May
Standard & Poor’s (2013) “Transition Study: Six Years On, Only 1.5% of European Structured Finance Has Defaulted,” S&P Capital IQ, December.
Appendix 1: delinquency and pd estimates
Here, we explain how we inferred delinquency measures for individual securitisation pools. We adopted the following rules:
1. If Intex reports a 90+ day delinquency observation and this observation includes defaults, we take it to equal the delinquency rate, W
2. If Intex reports that the recorded delinquency data do not include defaults, we adjust the delinquency 90+ rate by adding defaulted assets percentage and use this as our estimate of the delinquency rate, W
3. If Intex does not report a default rate in Case 2, we again employ the 90+ day delinquency as our estimate of W
To obtain an estimate of the IRBA pool, PD, we average values of 90+ delinquency rates excluding defaults across the first working days of 2012, 2013 and 2014. If one or more of these values is not available (for example, because the tranche was issued in 2013), we average over those values that are available. To ensure that estimates are conservative, we apply a PD floor by country/asset classes.
We exclude from the dataset tranches that have one of the following asset types: Non-Conforming RMBS, Small Business Commercial Mortgages and Non-Conforming Consumer Loans. The data for these asset types are all from a single country, namely the UK. They appear systematically different from the corresponding prime asset type and so it makes no sense to retain them in the sample. The tranches that have no available PD information or PD values of 0 or 1 are also removed from the dataset as are observations for which no rating data is available. Once we have dropped observations with no delinquency data, excluded some asset classes and made the other adjustments just described, we are left with a useable dataset of 1,771 tranches.
Tables A1.1, A1.2 and A1.3 provide summaries of the individual tranche-level estimates of PD and KIRB we obtain. The results are grouped by so-called “Eurozone periphery countries” (Spain, Italy, Portugal, Greece and Ireland) and other European countries including so-called “Eurozone core countries” and the UK. The results show intuitive patterns of variations across regions and asset classes.
Appendix 2: attachment and detachment points
In Section 2, we explain how the Basel formula-based approaches employ an erroneous definition of attachment points. Under Basel, the attachment point of a tranche is defined as the ratio of the sum of the par values of more junior tranches to the par value of the pool assets. The detachment point is defined as the attachment point plus tranche thickness.
This approach yields clearly incorrect results when transactions are significantly over- or undercollateralised either at issue or, because of how collateral losses/gains have accumulated over time. The issue is not so material for US RMBS or for synthetic CDOs because realised losses lead to the writing down of the par value of junior tranches in these markets but is very important for European securitisation markets. The issue is discussed in detail in Duponcheele et al. (2014c).
To explain the issue, the attachment point (AP) of a given tranche can be thought of as the proportion of the pool assets remaining when all pari-passu and more senior tranches are repaid:
total assets − sum of senior and pari−passu tranches AP = (A2.1) total assets
We refer to calculation of attachment points using equation (A2.1) as being the top down approach. This approach follows the logic of the cash flow waterfall according to which asset cashflows are distributed first to senior tranches, i.e. directed to the top of the capital structure.
As the sum of senior and pari-passu tranches equals total tranches minus subordinated tranches, we can transform equation (A2.1) into:
total assets − (total tranches − subordinated tranches) AP = (A2.2) total assets
Defining over-collateralisation (OC) to be total assets minus total tranches (when OC is negative we call it under-collateralisation), one obtains:
OC + subordinated tranches AP = (A2.3) total assets
We refer to (2.3) as being the bottom up approach as it follows the logic that losses will be first allocated to the subordinated tranches.
The current Basel definition of AP amounts to:
subordinated tranches AP = (A2.4) total assets
Comparing (A2.4) and (A2.3), it is apparent that the current Basel definition of AP is incorrect and should be adjusted to allow for OC.
Having calculated the attachment point either by the top down method or the bottom up method (appropriately adjusted for over-collateralisation and under-collateralisation), the detachment point (DP) is calculated as AP plus the tranche thickness. This latter quantity is defined in Basel as the ratio between the tranche nominal value and the total assets. Below, we provide a numerical example.
Numerical example of a senior tranche with initial AP of 20% and DP of 100%: Assets and Tranche par equals assets Under-collateralisation Over-collateralisation Tranches Pool balance of 100m and Pool balance of 90m and Pool balance of 110m and Calculation tranches balance of 100 m tranche balance of 100m tranche balance of 100m approach
AP top down (100assets - 80senior) / 100assets (90assets - 80senior) / 90assets (110assets - 80senior) / 110assets = 20.0% = 11.1% = 27.3 approach
AP bottom up (20sub + 0oc) / 100assets (20sub - 10oc) / 90assets (20sub + 10oc) / 110assets approach = 20.0% = 11.1% = 27.3%
Thickness of (80senior) / 100assets (80senior) / 90assets (80senior) / 110assets tranche = 80.0% = 88.9% = 72.7%
DP= 20.0% + 80.0% 11.1% + 88.9% 27.3% + 72.7% = 100% = 100% = 100% AP+ Tℎickness
To understand the significance of the different approaches to calculating attachment and detachment points, we present in Table A2.1 average risk weights for different capital approaches obtained using the Basel attachment and detachment point definitions and in Table A2.2 corresponding results using definitions adjusted to take into account under- or over-collateralisation.
By comparing the results in these tables, we can observe that the definitions make an appreciable difference to average risk weights, leading in some cases to 20% discrepancies between the corresponding entries. This is due to the fact that our sample contains many securitisations with an under-collateralisation situation, and hence the risk weights with the adjusted definitions are higher than when using the Basel definitions.
Appendix 3: legacy issues
Legacy issue: KIRB vs. KIRBA
Under the IRB framework, banks calculate the capital requirement K (which does not contain the expected loss) and then multiply this value by the scaling factor 1.06. This provides KIRBA = K× 1.06, the on-balance sheet capital for the underlying assets. However, when calculating the SFA (BCBS 2006), the notion of capital is slightly changed in that it includes the expected loss.[58] Europe has a technical ruling that requires to add the one-year expected loss EL1 to KIRBA to obtain KIRB, so KIRB = K× 1.06 + EL1. Some jurisdictions outside Europe calculate KIRB differently and some banks have developed IT systems that give access to KIRB but do not enable them yet to calculate KIRBA directly.
The use of KIRB as an input o the SSFA significantly reduces transparency since one cannot tell how much capital post securitisation is boosted compared to the pre-securitisation capital (which is based on KIRBA rather than KIRB. So, the question arises: can we calibrate the HQS European SSFA differently when using KIRB instead of KIRBA? The answer is yes, by determining the relationship between EL1 and KIRBA for the HQS perimeter. For this we use the Basel II formula using relevant LGD and the standardised risk weight for the asset class to obtain an appropriate PD and we can then deduce EL1 and KIRBA, and thus the ratio between the two components. For the HQS perimeter, a ratio of 10% is retained.[59]
So, as the capital surcharge with KIRBA is +40%, this generates a multiplier of 1.4, and thus a reduction of 14% (=10%*1.4) if one were to use KIRB. We propose to lower this 14% reduction to only 10%. This means that the surcharge of +40% with KIRBA should be +30% with KIRB. Since the +40% surcharge is achieved by having AFHQS = 0.60 and pHQS = 0.80, by choosing AFHQS = 0.55 and pHQS = 0.75, one achieves +30% surcharge.
58 Including the one-year expected loss is a technical necessity of the current SFA model, but not needed in other credit models. Once use of the SFA is disallowed (as proposed in BCBS (2013)), keeping using KIRB instead of KIRBA would lead to having “legacy” definitions in the framework. 59 For the 3 asset class in the perimeter of this study with have the following: Asset Class RW (SA) LGD PD Basel ρ KIRBA EL1 Ratio RMBS 35% 25% 1.10% 15.0% 2.83% 0.28% 10% SME 75% 45% 1.75% 13.0% 6.00% 0.79% 13% Other Retail 75% 75% 0.85% 12.7% 6.02% 0.64% 11% Using a ratio of EL1/KIRBA of about 10% for the HQS category is appropriate.
IRB input mode: “IRB standards” vs. “IRB proxies”
In Europe, IRBA inputs can be calculated by banks which are formally authorised by their regulators to use IRB methodologies for a given asset class, after a stringent review of the process and on-going monitoring. Therefore, a sponsor or originating bank will only calculate IRBA inputs if the “IRB standards”, described in Articles 142 to 146 of the European CRR, are respected.
In the US, Congress passed the Dodd-Frank act to remove the detrimental effect of agency ratings on bank capital requirements, and in the context of securitisation, to enable the implementation of such a decision, US regulators relaxed[60] the IRB standards to enable a greater use of the SFA formula (Fed Board (2013)). For example, a bank investor can use IRB proxies to calculate the risk associated with the assets in a country where it does not originate, which would not be possible under the European IRB standards.
Relaxing the IRB standards is not dissimilar to what we have done in this study, where the IRBA inputs of the 1,771 tranches were determined by proxies. Using IRB proxies are a useful way of monitoring risk[61], but from a regulatory perspective, it would make sense to differentiate the capital surcharge when using IRB proxies instead of IRB standards.
As a matter of principle, we consider that the capital surcharge, when calculating capital requirements with IRB proxies, should be higher than when the IRB standards are respected. One may then ask: how much this difference be?
Although a direct quantification is hard to achieve, one may nevertheless apply logic to reach a reasonable answer. The use of proxies creates more uncertainties to the risk weight of tranches which are not close to the 1250% risk weight value. Hence, it should impact pHQS more than AFHQS. We, therefore, suggest using the same values of AFHQS whether or not proxies are employed, i.e. 0.55 when using KIRB and 0.60 when using KIRBA.
One could take the view that the capital surcharge, when respecting the IRB standards, should be lower than the capital surcharge, when using IRB proxies. Let’s assume that there is small difference between the two input modes, and let’s put this difference at -15%.
This provides a surcharge, when respecting IRB standards, of +25% when using KIRBA and +15% when using KIRB. Having constrained the variables, we would have the resulting values for pHQS of 0.65 when using KIRBA and 0.60 when using KIRB.
Combined Effect
The constraints of KIRB v. KIRBA and the judgement applied to IRB standards vs. IRB proxies can be summarised as 4 possible combinations presented in the table below:
Resulting Quality of Choice Input type AFHQS pHQS capital Comment IRBA inputs surcharge Due to EL content in Respect of KIRB, 10% less than #1 KIRB 0.55 0.60 +15% IRB Standards KIRBA surcharge (Choice #2) -15% from surcharge Respect of #2 KIRBA 0.60 0.65 +25% using IRB proxies IRB Standards (Choice #4) Due to EL content in Use of KIRB, 10% less than #3 KIRB 0.55 0.75 +30% IRB Proxies KIRBA surcharge (Choice #4) As determined Use of #4 KIRBA 0.60 0.80 +40% by this study, IRB Proxies with KIRBA
HQS Pool Input (IRB/SA) AFHQS pHQS Floor (RW) Surcharge (before Hierarchy floor effect) Apply European SSFA 1 Yes 0.55 0.6 7%, Fixed +15% of KIRB with W and KIRB[1] Apply European SSFA 2 Yes 0.6 0.8 10%, Fixed +40% of KSA with W and KSA Apply Current CRD 3 No Rules N/A N/A N/A N/A (RBA/SA(RB)/SFA/IAA)
b) Version to be applied as part of the subsequent implementation of the RSW recommendations (Items 3, 4 and 5 to be coordinated with the Basel RSW)
Resulting Capital Order in HQS Pool Input (IRB/SA) AFHQS pHQS Floor (RW) Surcharge Hierarchy (before floor effect) Apply European SSFA +40% of 1 Yes 0.6 0.8 Lesser of with W and KIRBA KIRBA
a) 5%+10%*KSA Apply European SSFA and b) 15% 2 Yes 0.6 0.8 +40% of KSA with W and KSA Apply European SSFA +60% of 3 No 0.7 0.9 Greater of with W and KIRBA KIRBA
a) 5%+10%*KSA Apply European SSFA and b) 15% 4 No 0.8 1.0 +80% of KSA with W and KSA 5 No Use External Ratings N/A N/A N/A N/A
Notes on table:
• With IRBA or SA inputs, the floor is now risk sensitive. The use of KSA in the formula for the floor, even when using IRBA inputs, removes the possibility of using the internal rating based method for possible capital arbitrage at the floor level. The floor has a maximum of 15% for HQS tranches and a minimum of 15% for non-HQS tranches.
• With IRBA inputs, the resulting capital surcharge for non-HQS tranches (+60% of KIRBA) is higher than for HQS tranches (+40% of KIRBA).
• With SA inputs, the resulting capital surcharge for non-HQS tranches (+80% of KSA) is higher than for HQS tranches (+40% of KSA).
• The parameter magnitudes respect the hierarchy as both AFHQS and pHQS are smaller for HQS than for non-HQS. Securitisation of lower quality pools is not rewarded under this hierarchy.
• Non-HQS tranches with SA inputs (+80%) have a greater capital surcharge than with IRBA inputs (+60%).
• Moving external ratings to the foot of the hierarchy reduces reliance on agency ratings and restores a level playing field with the US where Dodd-Frank precludes use of ratings.
Table A1.1: KIRB, PD , LGD and KIRBA Distributions for Dataset of All Countries
PD LGD KIRB KIRBA Asset Class Count Mean Std. Mean Std. Mean Mean Std.
RMBS 1406 3.39% 1.93% 3.05% 3.38% 15.56% 2.75% 1.34%
SME 221 10.08% 2.78% 6.34% 3.61% 34.68% 7.42% 1.44%
Other Retail 144 4.84% 2.92% 2.64% 4.55% 40.00% 3.57% 1.08%
Table A1.2: KIRB, PD , LGD and KIRBA Distributions of Eurozone Periphery Countries
PD LGD KIRB KIRBA Asset Class Count Mean Std. Mean Std. Mean Mean Std.
RMBS 860 3.80% 1.81% 3.38% 3.29% 15.91% 3.08% 1.21%
SME 206 10.41% 2.60% 6.65% 3.54% 35.02% 7.62% 1.29%
Other Retail 35 6.33% 2.97% 4.32% 5.05% 40.00% 4.34% 0.94% Note: here periphery countries are defined as Spain, Italy, Portugal, Greece and Ireland.
Table A1.3: KIRB, PD , LGD and KIRBA Distributions of Eurozone Non-Periphery and the UK
PD LGD KIRB KIRBA Asset Class Count Mean Std. Mean Std. Mean Mean Std.
RMBS 546 2.74% 1.94% 2.53% 3.45% 15.00% 2.23% 1.36%
SME 15 5.61% 0.00% 2.00% 0.00% 30.00% 4.72% 0.00%
Other Retail 109 4.36% 2.75% 2.10% 4.26% 40.00% 3.32% 1.01% Note: The PDs of all tranches in SME are constrained by 2% floor.
Table A2.1: Means and Weighted Average of Risk Weights for various Approaches using “Basel AP and DP”
Mean Weighted Average BCBS HQS HQS BCBS HQS HQS CMA CMA BCBS CMA CMA BCBS SFA 269 SSFA SSFA SFA 269 SSFA SSFA (IRBA) (SA) 269 SA (IRBA) (SA) 269 SA IRBA (IRBA) (SA) IRBA (IRBA) (SA) Most Senior Tranches RMBS 7% 15% 15% 16% 16% 7% 10% 7% 15% 15% 16% 16% 7% 10% SME 7% 15% 15% 15% 16% 7% 10% 7% 15% 15% 15% 16% 7% 10% Other Retail 7% 15% 15% 15% 20% 7% 10% 7% 15% 15% 15% 18% 7% 11% Other Tranches RMBS 182% 331% 345% 412% 497% 315% 331% 49% 107% 110% 130% 185% 98% 102% SME 205% 290% 251% 285% 443% 319% 276% 90% 144% 125% 145% 260% 163% 139% Other Retail 90% 159% 236% 206% 396% 166% 253% 25% 47% 72% 63% 130% 44% 75%
Table A2.2: Means and Weighted Average of Risk Weights for various Approaches using “Adjusted AP and DP”
Mean Weighted Average BCBS HQS HQS BCBS HQS HQS CMA CMA BCBS CMA CMA BCBS SFA 269 SSFA SSFA SFA 269 SSFA SSFA (IRBA) (SA) 269 SA (IRBA) (SA) 269 SA IRBA (IRBA) (SA) IRBA (IRBA) (SA) Most Senior Tranches RMBS 7% 15% 15% 16% 16% 7% 10% 7% 15% 15% 16% 16% 7% 10% SME 7% 15% 15% 16% 17% 8% 10% 7% 15% 15% 15% 16% 7% 10% Other Retail 7% 15% 15% 15% 20% 7% 11% 7% 15% 15% 15% 22% 7% 12% Other Tranches RMBS 172% 349% 364% 432% 506% 328% 346% 54% 128% 127% 150% 205% 118% 119% SME 193% 320% 280% 310% 466% 348% 303% 92% 175% 149% 167% 288% 195% 161% Other Retail 52% 169% 242% 190% 397% 165% 240% 21% 72% 99% 78% 168% 66% 96%
Breakdown per Countries Breakdown per Current External Ratings
b) By Par Value of Tranches Breakdown per Asset Class Breakdown per Seniority
Breakdown per Countries Breakdown per Current External Ratings
c) ERBA vs. SA
1400 200
1000 140
ERBA(%) ERBA(%) 80
0 0 0 200 400 600 800 1000 1200 1400 0 50 100 150 200 SA(%) SA(%)
100 100
90 90
80 80
70 70
60 60
50 50
40 40 Frequency(%) Frequency(%)
30 30
20 20
10 10
0 0 -1000 -500 0 500 1000 -200 -100 0 100 200 ERBA - SA ERBA - SA
c) SA vs. CMA (SA)
1400 200
1000 140
SA(%) SA(%) 600 80
0 0 0 200 400 600 800 1000 1200 1400 0 50 100 150 200 CMA(SA)(%) CMA(SA)(%)
100 100
90 90
80 80
70 70
60 60
50 50
40 40 Frequency(%) Frequency(%)
30 30
20 20
10 10
0 0 -1000 -500 0 500 1000 -200 -100 0 100 200 SA - CMA(SA) SA - CMA(SA)
b) Calibrated MSSFA (SA) with p[1] and p[2] vs. CMA (SA)
1400 200
1000 140 Calib. MSSFA(SA)(%) 400 Calib. MSSFA(SA)(%) 60
0 0 0 200 400 600 800 1000 1200 1400 0 50 100 150 200 CMA(SA)(%) CMA(SA)(%)
100 100
90 90
80 80
70 70
60 60
50 50
40 40 Frequency(%) Frequency(%)
30 30
20 20
10 10
0 0 -1000 -500 0 500 1000 -200 -100 0 100 200 Calib. MSSFA(SA) - CMA(SA) Calib. MSSFA(SA) - CMA(SA)
b) Calibrated MSSFA with p[1] and p[2] (IRBA) vs. CMA (IRBA)
1400 200
1000 140 Calib. MSSFA(IRBA)(%) 400 Calib. MSSFA(IRBA)(%)
0 0 0 200 400 600 800 1000 1200 1400 0 50 100 150 200 CMA(IRBA)(%) CMA(IRBA)(%)
100 100
90 90
80 80
70 70
60 60
50 50
40 40 Frequency(%) Frequency(%)
30 30
20 20
10 10
0 0 -1000 -500 0 500 1000 -200 -100 0 100 200 Calib. MSSFA(IRBA) - CMA(IRBA) Calib. MSSFA(IRBA) - CMA(IRBA)
b) Current RBA vs. HQS European SSFA (SA)
1400 200
1000 140
Current RBA(%) Current RBA(%)
0 0 0 200 400 600 800 1000 1200 1400 0 50 100 150 200 HQS European SSFA (SA)(%) HQS European SSFA (SA)(%)
100 100
90 90
80 80
70 70
60 60
50 50
40 40 Frequency(%) Frequency(%)
30 30
20 20
10 10
0 0 -1000 -500 0 500 1000 -200 -100 0 100 200 Current RBA - HQS European SSFA (SA) Current RBA - HQS European SSFA (SA)
c) Current SA(RB) vs. HQS European SSFA(SA)
1400 200
1000 140 Current SA(RB)(%) Current SA(RB)(%)
0 0 0 200 400 600 800 1000 1200 1400 0 50 100 150 200 HQS European SSFA (SA)(%) HQS European SSFA (SA)(%)
100 100
90 90
80 80
70 70
60 60
50 50
40 40 Frequency(%) Frequency(%)
30 30
20 20
10 10
0 0 -1000 -500 0 500 1000 -200 -100 0 100 200 Current SA(RB)- HQS European SSFA (SA) Current SA(RB)- HQS European SSFA (SA)
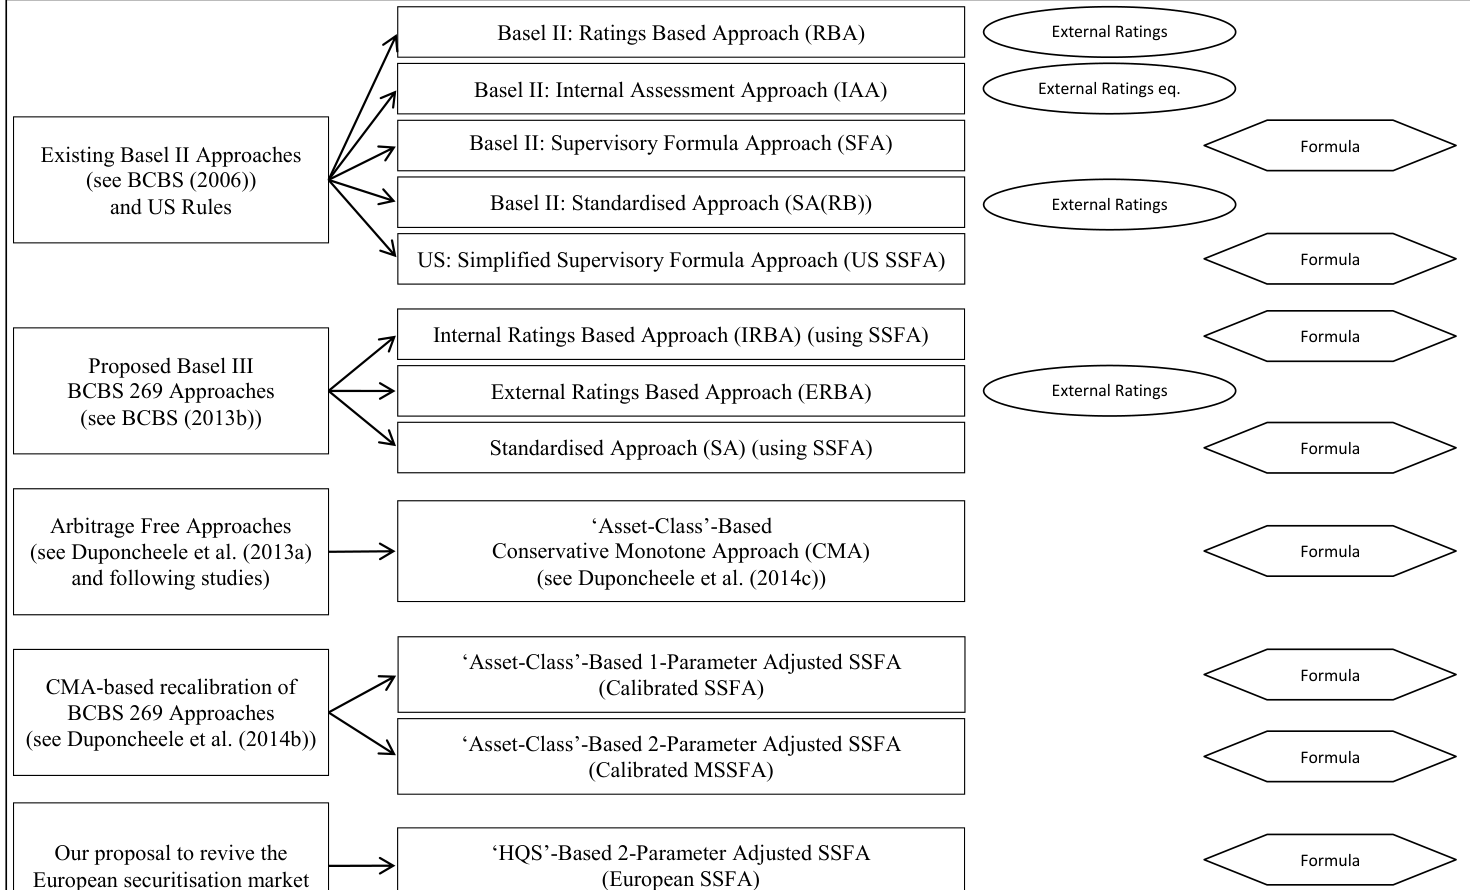
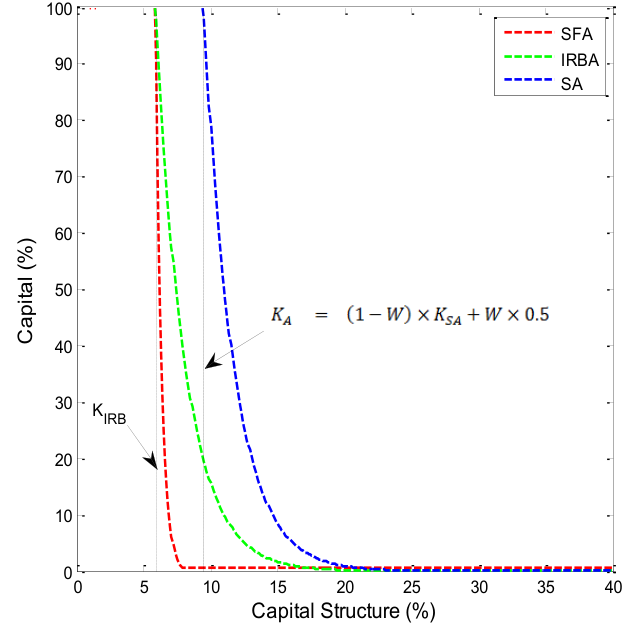
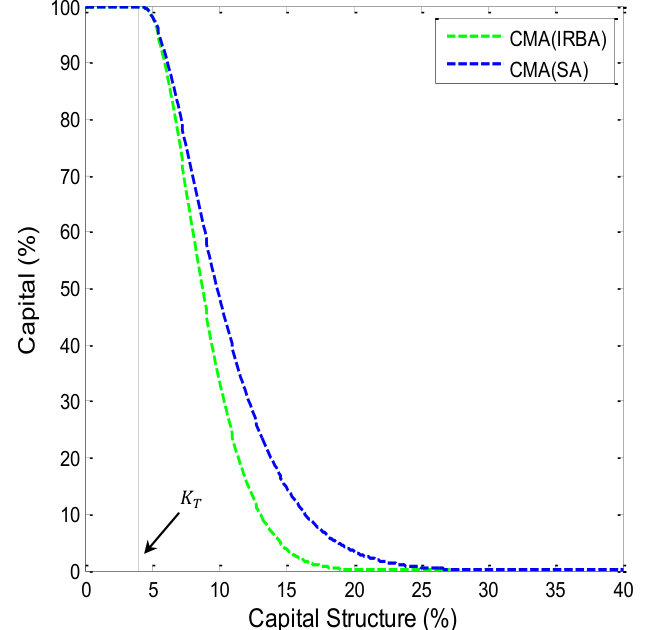
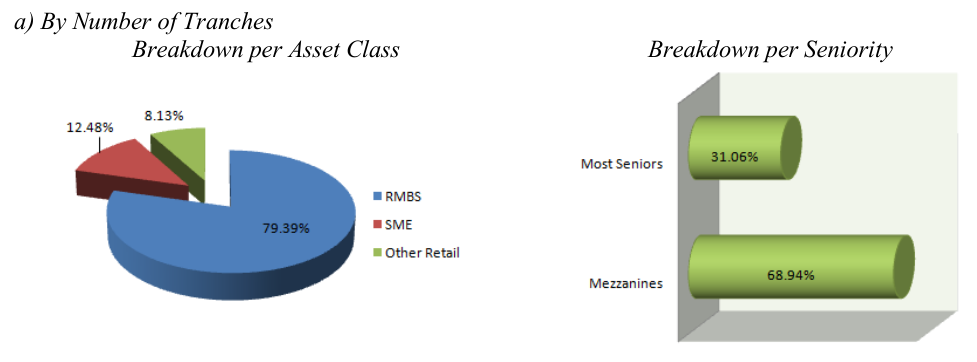
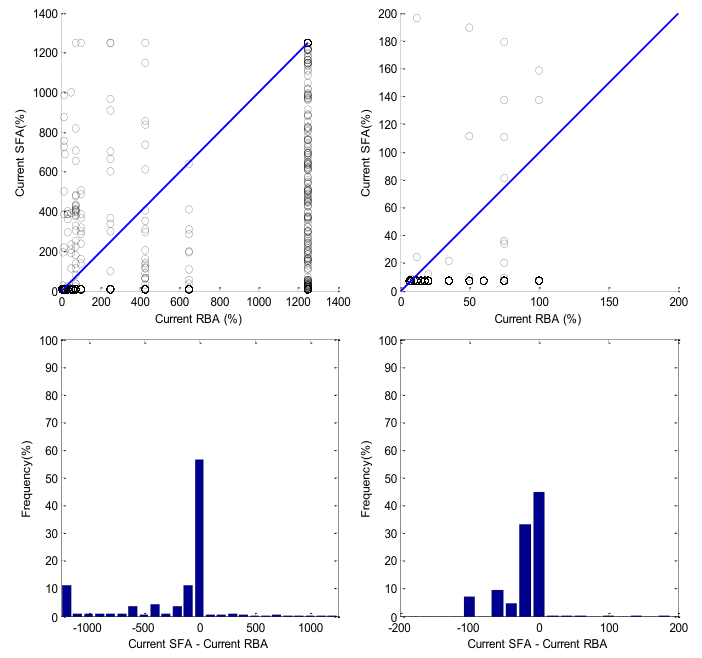
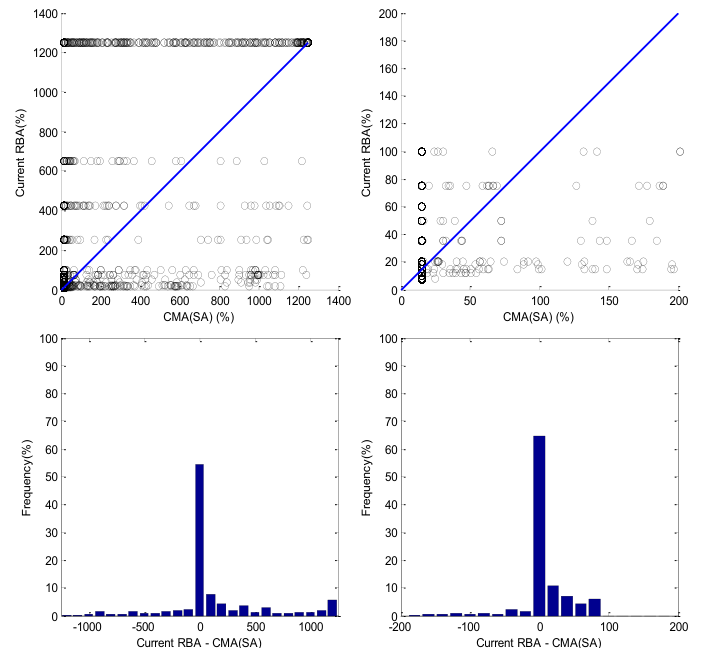
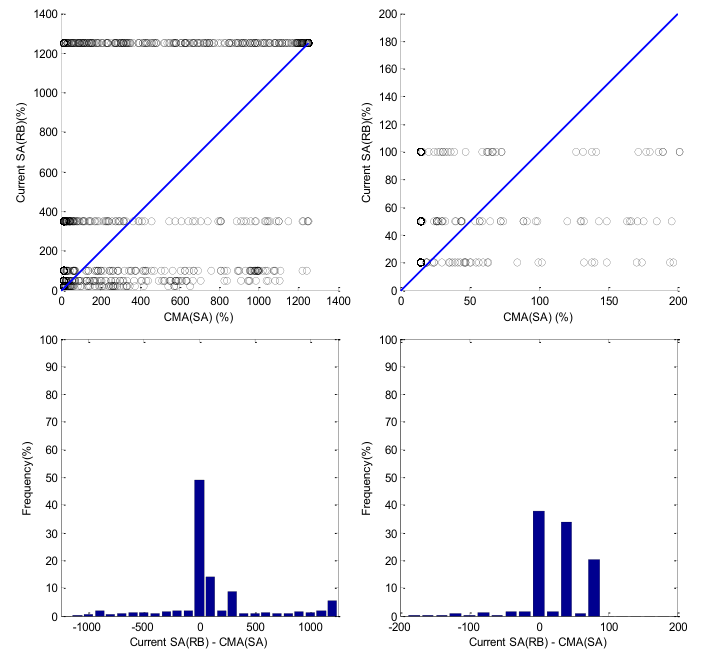
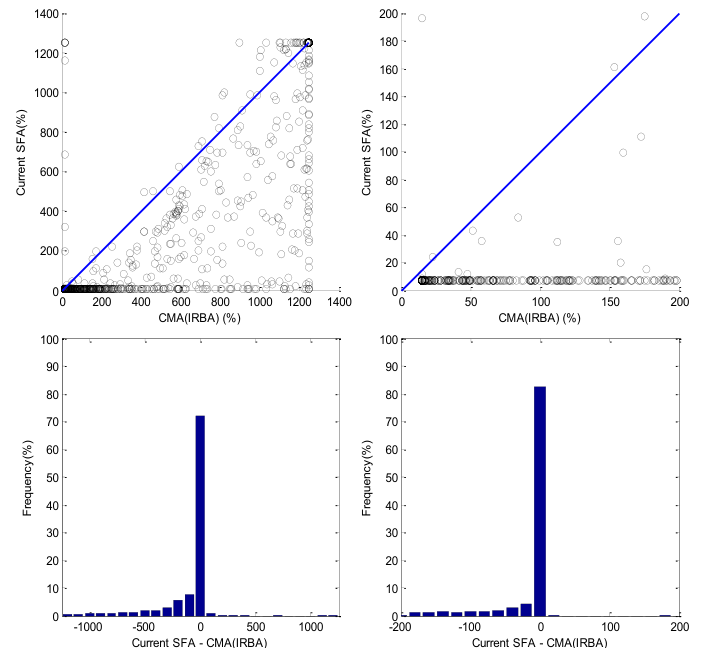
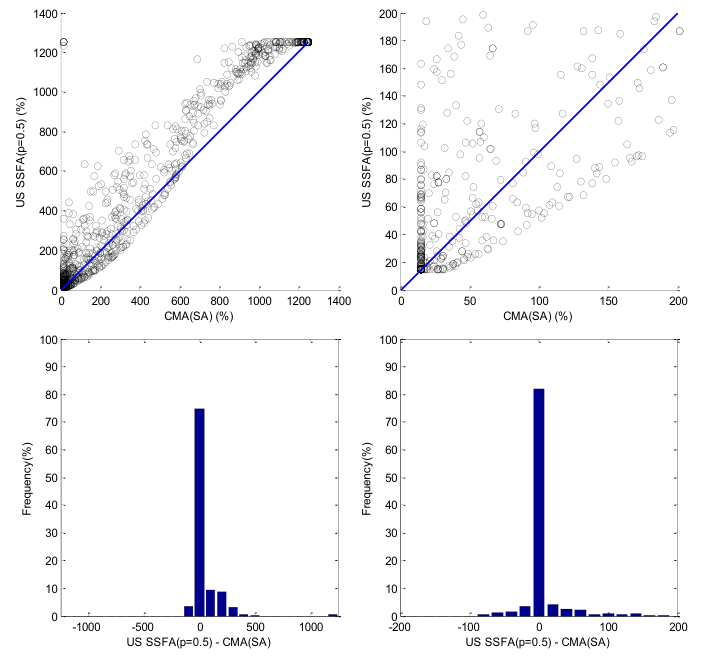
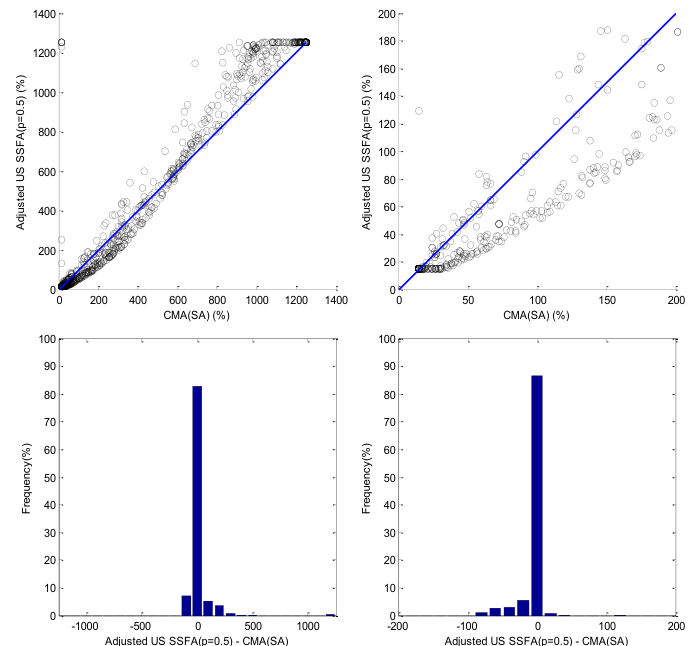
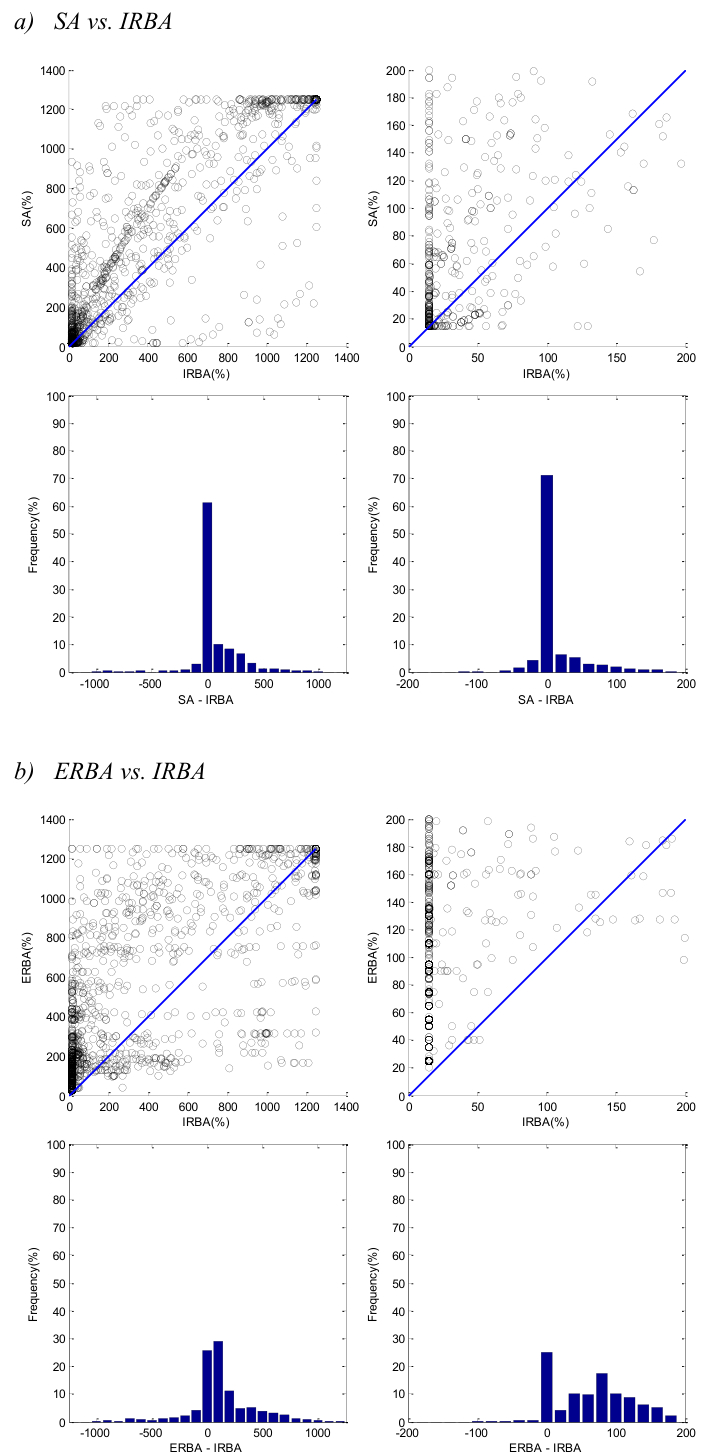
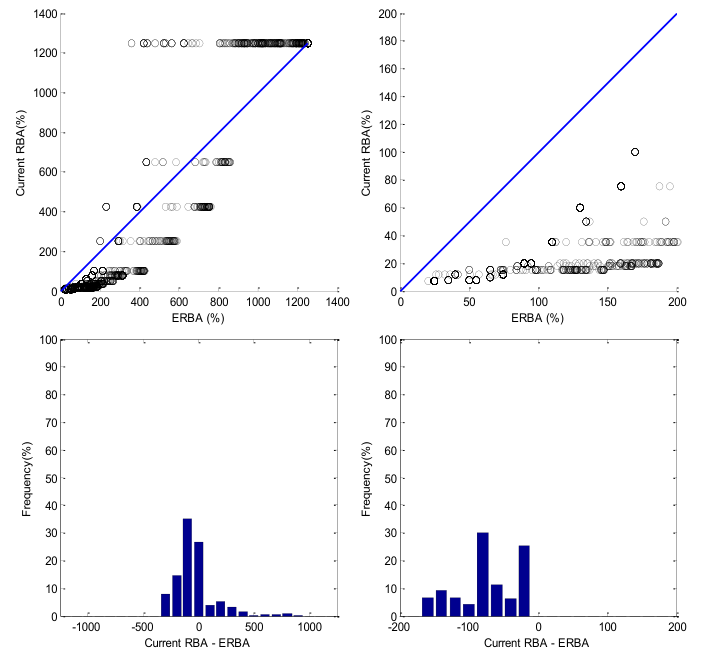
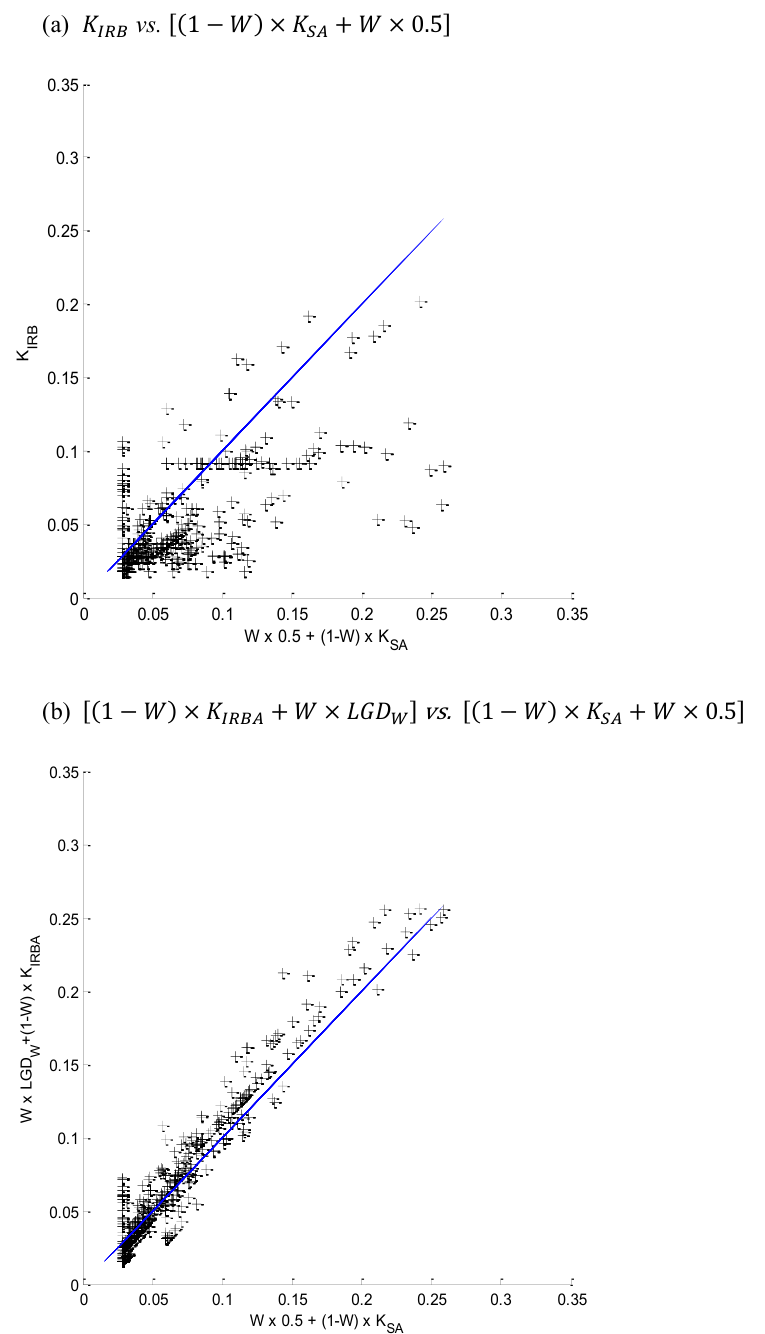
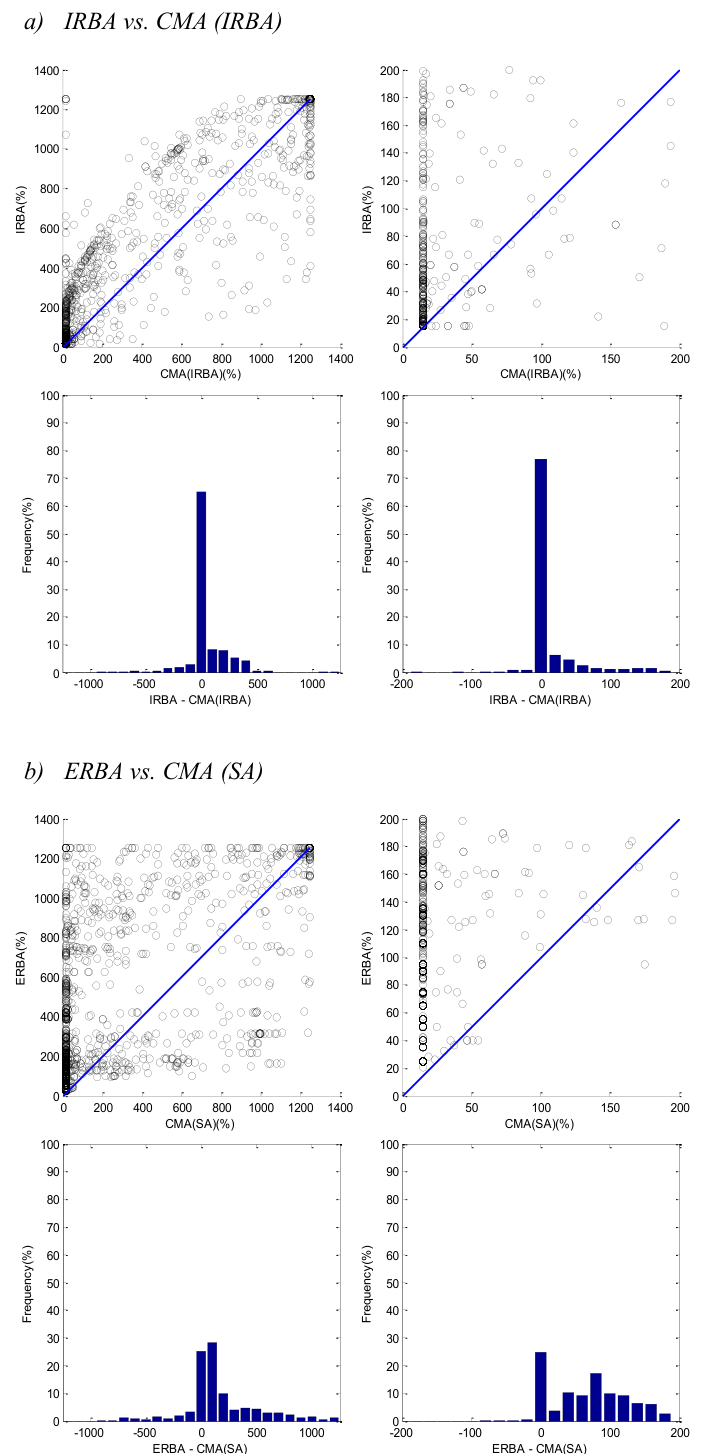
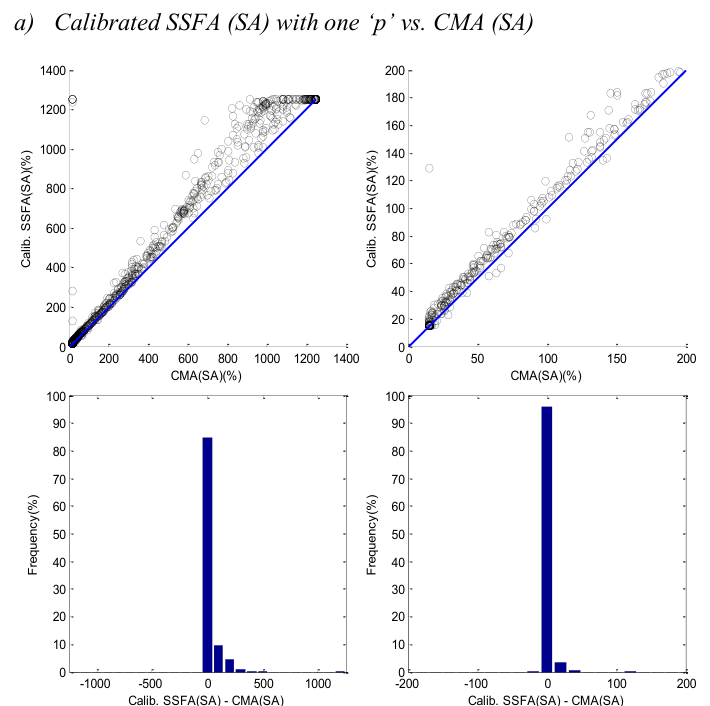
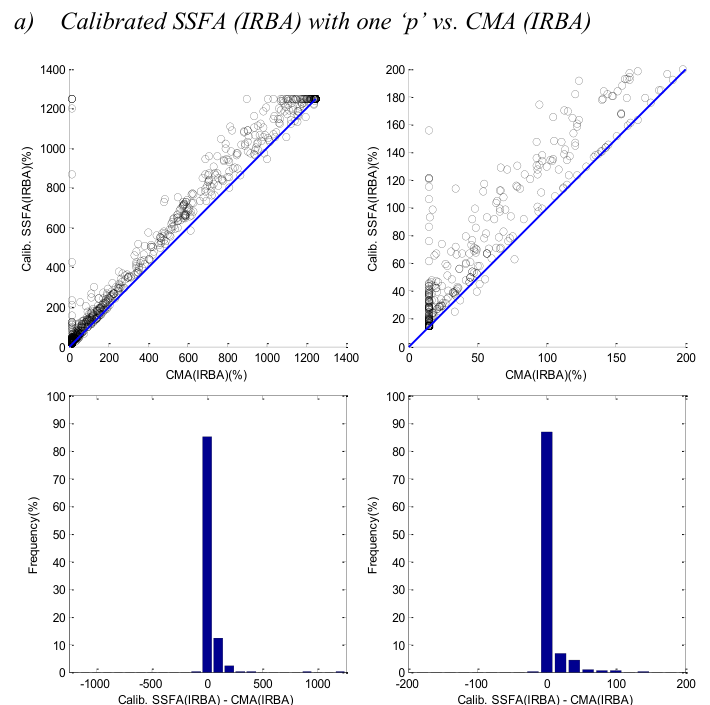
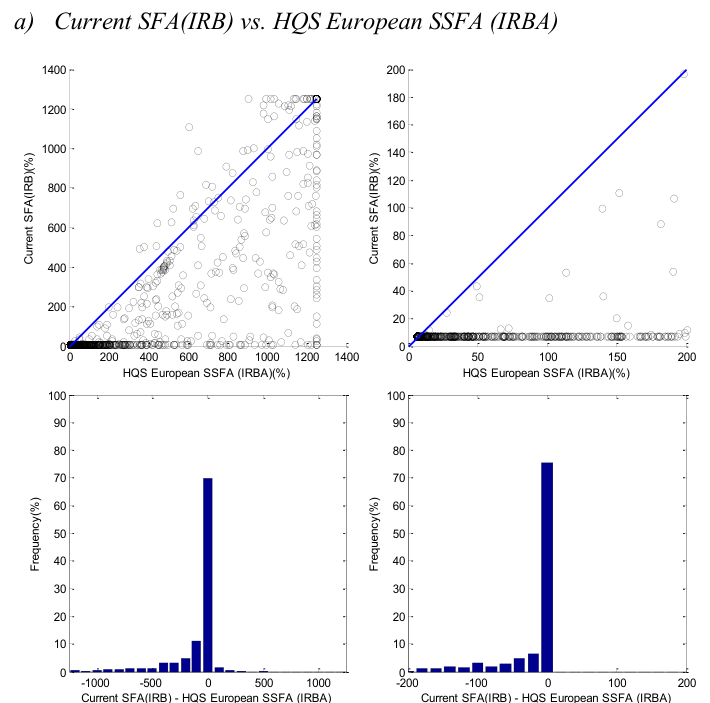
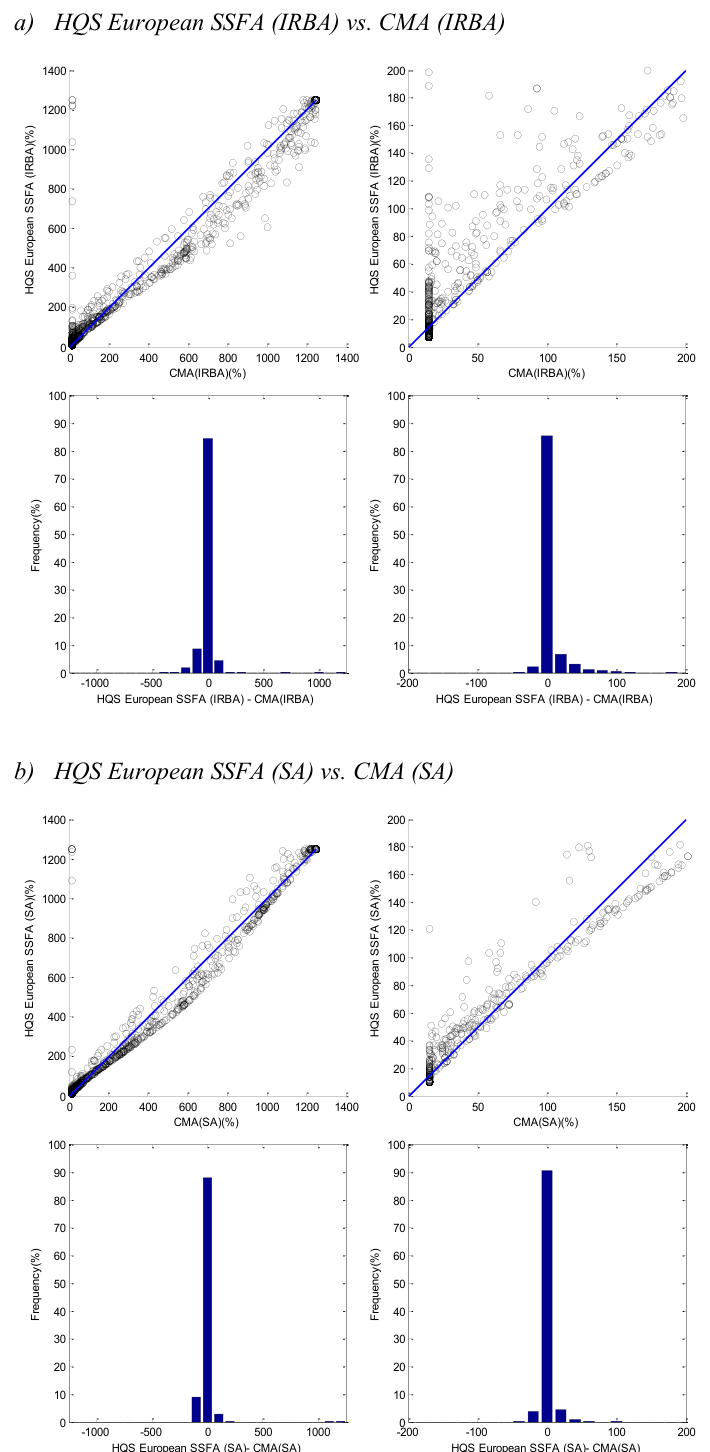
| RBA | SA(RB) | Senior Tranche | Non-Senior (Thin) | Tranche | ||||
|---|---|---|---|---|---|---|---|---|
| Tranche | Tranche | |||||||
| Rating | RW RW | Rating | RW1 | RW5 | RW1 | RW5 | ||
| RW | ||||||||
| (Senior) (Non-senior) | 1 | year 5 | years 1 | year 5 | years | |||
| AAA | 7% | 12% | 20% | AAA | 15% | 25% | 15% | 80% |
| AA+ | 8% | 15% | 20% | AA+ | 15% | 35% | 15% | 100% |
| AA | 8% | 15% | 20% | AA | 25% | 50% | 30% | 130% |
| AA- | 8% | 15% | 20% | AA- | 30% | 55% | 40% | 150% |
| A+ | 10% | 18% | 50% | A+ | 40% | 65% | 60% | 170% |
| A | 12% | 20% | 50% | A | 50% | 75% | 80% | 190% |
| A- | 20% | 35% | 50% | A- | 60% | 90% | 120% | 220% |
| BBB+ | 35% | 50% | 100% | BBB+ | 75% | 110% | 170% | 270% |
| BBB | 60% | 75% | 100% | BBB | 90% | 130% | 220% | 320% |
| BBB- | 100% | 100% | 100% | BBB- | 120% | 170% | 330% | 430% |
| BB+ | 250% | 250% | 350% | BB+ | 140% | 200% | 470% | 590% |
| BB | 425% | 425% | 350% | BB | 160% | 230% | 620% | 770% |
| BB- | 650% | 650% | 350% | BB- | 200% | 290% | 750% | 870% |
| B+ | 1250% | 1250% | 1250% | B+ | 250% | 360% | 900% | 960% |
| B | 1250% | 1250% | 1250% | B | 310% | 420% | 1050% | 1050% |
| B- | 1250% | 1250% | 1250% | B- | 380% | 440% | 1130% | 1130% |
| CCC [+/-] | 1250% | 1250% | 1250% | CCC [+/-] | 460% | 530% | 1250% | 1250% |
| Below CCC- | 1250% | 1250% | 1250% | Below CCC- | 1250% | 1250% | 1250% | 1250% |
Note: Tables 1 and 2 exclude risk weights for re-securitisations. Table 1 excludes RBA risk weights for non-granular pools
| RBA | SA (RB) | SFA | CMA (IRBA) | CMA (SA) | US SSFA (p= 0.5) | Adjusted US SSFA (p= 0.5) | RBA | SA (RB) | SFA | CMA (IRBA) | CMA (SA) | US SSFA (p= 0.5) | Adjusted US SSFA (p= 0.5) | |||||||||||||
|---|---|---|---|---|---|---|---|---|---|---|---|---|---|---|---|---|---|---|---|---|---|---|---|---|---|---|
| Most Senior Tranches | ||||||||||||||||||||||||||
| RMBS | 67% | 90% | 7% | 15% | 15% | 15% | 15% | 67% | 88% | 7% | 15% | 15% | 15% | 15% | ||||||||||||
| SME | 21% | 51% | 7% | 15% | 15% | 15% | 15% | 22% | 50% | 7% | 15% | 15% | 15% | 15% | ||||||||||||
| Other Retail | 10% | 26% | 7% | 15% | 15% | 15% | 15% | 8% | 22% | 7% | 15% | 15% | 15% | 15% | ||||||||||||
| Other Tranches | ||||||||||||||||||||||||||
| RMBS | 502% | 499% | 182% | 331% | 345% | 396% | 358% | 284% | 288% | 49% | 107% | 110% | 131% | 111% | ||||||||||||
| SME | 555% | 555% | 205% | 290% | 251% | 339% | 286% | 373% | 373% | 90% | 144% | 125% | 179% | 145% | ||||||||||||
| Other Retail | 196% | 211% | 90% | 159% | 236% | 309% | 272% | 114% | 126% | 25% | 47% | 72% | 90% | 80% |
| RBA | SA (RB) | SFA | CMA (IRBA) | CMA (SA) | US SSFA (p= 0.5) | Adjusted US SSFA (p= 0.5) | |||||||
|---|---|---|---|---|---|---|---|---|---|---|---|---|---|
| Most Senior Tranches | |||||||||||||
| RBA | 1.00 | 0.95 | 0.01 | 0.01 | 0.02 | 0.02 | -0.01 | ||||||
| SA (RB) | 0.95 | 1.00 | 0.00 | 0.03 | 0.01 | 0.01 | -0.02 | ||||||
| SFA | 0.01 | 0.00 | 1.00 | 0.08 | 0.14 | 0.06 | 0.09 | ||||||
| CMA (IRBA) | 0.01 | 0.03 | 0.08 | 1.00 | 0.58 | 0.45 | 0.50 | ||||||
| CMA (SA) | 0.02 | 0.01 | 0.14 | 0.58 | 1.00 | 0.78 | 0.87 | ||||||
| (p= 0.5) US SSFA | 0.02 | 0.01 | 0.06 | 0.45 | 0.78 | 1.00 | 0.89 | ||||||
| (p= 0.5) Adjusted US SSFA | -0.01 | -0.02 | 0.09 | 0.50 | 0.87 | 0.89 | 1.00 | ||||||
| Other Tranches | |||||||||||||
| RBA | 1.00 | 0.99 | 0.42 | 0.63 | 0.50 | 0.54 | 0.50 | ||||||
| SA (RB) | 0.99 | 1.00 | 0.43 | 0.64 | 0.51 | 0.54 | 0.51 | ||||||
| SFA | 0.42 | 0.43 | 1.00 | 0.64 | 0.60 | 0.61 | 0.64 | ||||||
| CMA (IRBA) | 0.63 | 0.64 | 0.64 | 1.00 | 0.92 | 0.90 | 0.90 | ||||||
| CMA (SA) | 0.50 | 0.51 | 0.60 | 0.92 | 1.00 | 0.94 | 0.97 | ||||||
| (p= 0.5) US SSFA | 0.54 | 0.54 | 0.61 | 0.90 | 0.94 | 1.00 | 0.96 | ||||||
| (p= 0.5) Adjusted US SSFA | 0.50 | 0.51 | 0.64 | 0.90 | 0.97 | 0.96 | 1.00 |
| IRBA | ERBA | SA | CMA (IRBA) | CMA (SA) | IRBA | ERBA | SA | CMA (IRBA) | CMA (SA) | |||||||
|---|---|---|---|---|---|---|---|---|---|---|---|---|---|---|---|---|
| Most Senior Tranches | ||||||||||||||||
| RMBS | 16% | 79% | 16% | 15% | 15% | 16% | 72% | 16% | 15% | 15% | ||||||
| SME | 15% | 84% | 16% | 15% | 15% | 15% | 83% | 16% | 15% | 15% | ||||||
| Other Retail | 15% | 37% | 20% | 15% | 15% | 15% | 33% | 18% | 15% | 15% | ||||||
| Other Tranches | ||||||||||||||||
| RMBS | 412% | 564% | 497% | 331% | 345% | 130% | 303% | 185% | 107% | 110% | ||||||
| SME | 285% | 539% | 443% | 290% | 251% | 145% | 365% | 260% | 144% | 125% | ||||||
| Other Retail | 206% | 269% | 396% | 159% | 236% | 63% | 134% | 130% | 47% | 72% |
| IRBA | ERBA | SA | CMA (IRBA) | ||||
|---|---|---|---|---|---|---|---|
| Most Senior Tranches | |||||||
| IRBA | 1.00 | 0.20 | 0.32 | 0.23 | |||
| ERBA | 0.20 | 1.00 | 0.15 | 0.01 | |||
| SA | 0.32 | 0.15 | 1.00 | 0.16 | |||
| CMA (IRBA) | 0.23 | 0.01 | 0.16 | 1.00 | |||
| CMA (SA) | 0.39 | 0.02 | 0.27 | 0.58 | |||
| Other Tranches | |||||||
| IRBA | 1.00 | 0.73 | 0.87 | 0.88 | |||
| ERBA | 0.73 | 1.00 | 0.66 | 0.71 | |||
| SA | 0.87 | 0.66 | 1.00 | 0.88 | |||
| CMA (IRBA) | 0.88 | 0.71 | 0.88 | 1.00 | |||
| CMA (SA) | 0.87 | 0.61 | 0.92 | 0.92 | |||
| RW less than 200% | |||||||
| IRBA | 1.00 | 0.26 | 0.52 | 0.24 | |||
| ERBA | 0.26 | 1.00 | 0.38 | 0.04 | |||
| SA | 0.52 | 0.38 | 1.00 | 0.24 | |||
| CMA (IRBA) | 0.24 | 0.04 | 0.24 | 1.00 | |||
| CMA (SA) | 0.62 | 0.12 | 0.48 | 0.39 |
| Mean | Weighted Average | ||||||||||||||||||
|---|---|---|---|---|---|---|---|---|---|---|---|---|---|---|---|---|---|---|---|
| CMA (IRBA) | CMA (SA) | Calib. SSFA (IRBA) | Calib. SSFA (SA) | Calib. MSSFA (IRBA) | Calib. MSSFA (SA) | HQS SSFA (IRBA) | HQS SSFA (SA) | CMA (IRBA) | CMA (SA) | Calib. SSFA (IRBA) | Calib. SSFA (SA) | Calib. MSSFA (IRBA) | Calib. MSSFA (SA) | HQS SSFA (IRBA) | HQS SSFA (SA) | ||||
| Most Senior Tranches | |||||||||||||||||||
| 15% | 15% | 15% | 15% | 15% | 15% | 7% | 10% | 15% | 15% | 15% | 15% | 15% | 15% | 7% | 10% | ||||
| 15% | 15% | 15% | 15% | 15% | 15% | 7% | 10% | 15% | 15% | 15% | 15% | 15% | 15% | 7% | 10% | ||||
| 15% | 15% | 15% | 15% | 15% | 15% | 7% | 10% | 15% | 15% | 15% | 15% | 15% | 15% | 7% | 11% | ||||
| Other Tranches | |||||||||||||||||||
| 331% | 345% | 366% | 387% | 343% | 361% | 315% | 331% | 107% | 110% | 118% | 121% | 112% | 114% | 98% | 102% | ||||
| 290% | 251% | 330% | 285% | 300% | 261% | 319% | 276% | 144% | 125% | 169% | 144% | 152% | 130% | 163% | 139% | ||||
| 159% | 236% | 188% | 287% | 172% | 257% | 166% | 253% | 47% | 72% | 55% | 87% | 51% | 80% | 44% | 75% |
| CMA (IRBA) | CMA (SA) | Calib. SSFA (IRBA) | Calib. SSFA (SA) | Calib. MSSFA (IRBA) | Calib. MSSFA (SA) | HQS SSFA (IRBA) | |||
|---|---|---|---|---|---|---|---|---|---|
| Most Senior Tranches | |||||||||
| CMA (IRBA) | 1.00 | 0.58 | 0.71 | 0.58 | 1.00 | 0.58 | 0.25 | ||
| CMA (SA) | 0.58 | 1.00 | 0.82 | 1.00 | 0.58 | 1.00 | 0.42 | ||
| Calib. SSFA (IRBA) | 0.71 | 0.82 | 1.00 | 0.82 | 0.71 | 0.82 | 0.35 | ||
| Calib. SSFA (SA) | 0.58 | 1.00 | 0.82 | 1.00 | 0.58 | 1.00 | 0.42 | ||
| Calib. MSSFA (IRBA) | 1.00 | 0.58 | 0.71 | 0.58 | 1.00 | 0.58 | 0.25 | ||
| Calib. MSSFA (SA) | 0.58 | 1.00 | 0.82 | 1.00 | 0.58 | 1.00 | 0.42 | ||
| HQS SSFA (IRBA) | 0.25 | 0.42 | 0.35 | 0.42 | 0.25 | 0.42 | 1.00 | ||
| HQS SSFA (SA) | 0.36 | 0.62 | 0.50 | 0.62 | 0.36 | 0.62 | 0.25 | ||
| Other Tranches | |||||||||
| CMA (IRBA) | 1.00 | 0.92 | 0.96 | 0.90 | 0.95 | 0.90 | 0.94 | ||
| CMA (SA) | 0.92 | 1.00 | 0.89 | 0.98 | 0.89 | 0.97 | 0.89 | ||
| Calib. SSFA (IRBA) | 0.96 | 0.89 | 1.00 | 0.91 | 0.99 | 0.91 | 0.98 | ||
| Calib. SSFA (SA) | 0.90 | 0.98 | 0.91 | 1.00 | 0.91 | 0.99 | 0.91 | ||
| Calib. MSSFA (IRBA) | 0.95 | 0.89 | 0.99 | 0.91 | 1.00 | 0.92 | 0.99 | ||
| Calib. MSSFA (SA) | 0.90 | 0.97 | 0.91 | 0.99 | 0.92 | 1.00 | 0.91 | ||
| HQS SSFA (IRBA) | 0.94 | 0.89 | 0.98 | 0.91 | 0.99 | 0.91 | 1.00 | ||
| HQS SSFA (SA) | 0.90 | 0.97 | 0.91 | 0.99 | 0.92 | 1.00 | 0.92 |
| No. Obs. | BCBS 269 IRBA No. (%) | BCBS 269 SA No. (%) | CMA (IRBA) No. (%) | CMA (SA) No. (%) | Calib. SSFA (IRBA) No. (%) | Calib. SSFA (SA) No. (%) | Calib. MSSFA (IRBA) No. (%) | Calib. MSSFA (SA) No. (%) | HQS SSFA (IRBA) No. (%) | HQS SSFA (SA) No. (%) | ||||||||||||||||
|---|---|---|---|---|---|---|---|---|---|---|---|---|---|---|---|---|---|---|---|---|---|---|---|---|---|---|
| Most Senior Tranches | ||||||||||||||||||||||||||
| RMBS | 452 | 433 | 96% | 425 | 94% | 451 | 100% | 449 | 99% | 450 | 100% | 449 | 99% | 451 | 100% | 449 | 99% | 436 | 96% | 448 | 99% | |||||
| SME | 45 | 45 | 100% | 38 | 84% | 45 | 100% | 45 | 100% | 45 | 100% | 45 | 100% | 45 | 100% | 45 | 100% | 44 | 98% | 45 | 100% | |||||
| Other Retail | 53 | 52 | 98% | 44 | 83% | 53 | 100% | 53 | 100% | 53 | 100% | 53 | 100% | 53 | 100% | 53 | 100% | 53 | 100% | 49 | 92% | |||||
| Total | 550 | 530 | 96% | 507 | 92% | 549 | 100% | 547 | 99% | 548 | 100% | 547 | 99% | 549 | 100% | 547 | 99% | 533 | 97% | 542 | 99% | |||||
| Other Tranches | ||||||||||||||||||||||||||
| RMBS | 954 | 199 | 21% | 140 | 15% | 408 | 43% | 355 | 37% | 333 | 35% | 334 | 35% | 297 | 31% | 305 | 32% | 278 | 29% | 304 | 32% | |||||
| SME | 176 | 80 | 45% | 20 | 11% | 87 | 49% | 91 | 52% | 79 | 45% | 92 | 52% | 72 | 41% | 83 | 47% | 53 | 30% | 76 | 43% | |||||
| Other Retail | 91 | 38 | 42% | 22 | 24% | 63 | 69% | 43 | 47% | 61 | 67% | 42 | 46% | 53 | 58% | 38 | 42% | 49 | 54% | 38 | 42% | |||||
| Total | 1221 | 317 | 26% | 182 | 15% | 558 | 46% | 489 | 40% | 473 | 39% | 468 | 38% | 422 | 35% | 426 | 35% | 380 | 31% | 418 | 34% |

Notes
[1] Dr. Georges Duponcheele is Head of Banking Solutions, BNP Paribas. Alexandre Linden, CFA, is a Senior Quantitative Structurer, BNP Paribas. Dr. William Perraudin is Director of RCL and Adjunct Professor of Imperial College, London. Correspondence may be sent to the authors at: georges.duponcheele@bnpparibas.com, alexandre.linden@bnpparibas.com, or william.perraudin@riskcontrollimited.com.
[2] The authors thank Alexander Batchvarov, Ian Bell, Shalom Benaim, Didier Blanchard, Vivien Brunel, Paola Busca, Michel Cusenza, Thomas Demians d’Archimbaud, Iuliana Dincov, Alice Dub, Dominique Graber, Jennifer Medina, Stephan Meili, Volker Meissmer, Véronique Ormezzano, Eric Rossignol, Erwan Roze, Naceur Saadaoui, Eric Silie, Richard Sinclair, Fabrice Susini, Daniel Totouom-Tangho, Beatrice Vaccari for numerous helpful comments and Huaidong Wang, Thomas Wickstead and, especially, Peng Yang for their help with the detailed calculations and their insights. Any errors are ours. The views expressed are the authors’ own and not necessarily either those of BNP Paribas or those of the individuals with whom we had discussions or their firms.
[3] Perraudin (2014b) calculates the peak to trough GDP declines for UK, France, Spain and Italy after 2007 as being 7.2%, 4.4%, 5.0%, and 7.2% respectively, compared to 4.3% for the US. Excluding CDOs of ABS, CMBS and other CDOs, the default rate of European securitisations was 0.12%. Data in Standard & Poor’s (2013) implies cumulative default rates in Europe between 2007 and 2013 for RMBS, Other Consumer ABS, Credit Card ABS and SME CLOs of 0.10%, 0.13%, 0.00% and 0.41%, respectively.
[4] Even if one has the view that securitisations should not be employed as a means to transfer funding between banks, driving bank investors out of the securitisation market would severely impair liquidity, reducing the scope for non-bank investors to buy and sell securitisation holdings efficiently.
[5] Some direct access initiatives have been launched in Germany and Italy for example, but volumes are very small and restricted in practice to the largest SMEs.
[6] In the European CRR, the RBA is referred to as the Ratings Based Method (RBM).
[7] This compounds the fact that, even before the crisis, some key European asset classes, most notably SME backed securitisations, were treated too conservatively by ratings agencies. Effectively, the agencies use criteria appropriate for leveraged loans when they evaluate SME pools despite the fact that the former have much inferior default performance.
[8] Also worth noting is the fact that since the original calibration was performed, regulatory changes have effected significant improvements in market practices, e.g., in the areas of retention and transparency.
[9] See page 29 below for the decision tree and equation (22) for the implementation.
[10] In fact, the total surcharge is even higher because of the impact of the risk weight floor included in the formula-based approaches.
[11] In our comparisons of how capital rules perform for actual transactions, our results are complementary to those of Perraudin (2014c), a study of the quantitative impact of the BCBS (2013c) proposals based on data from GFMA banks. The data in that study came primarily from US banks (although banks from other regions contributed data) and so the results are more revealing about US deals. This paper is solely focused on European securitisations.
[12] Some of the capital calculation approaches we study, notably the Basel (2013c) IRBA and the version of the CMA using IRBA inputs, require complex inputs such as KIRB and pool-specific, weighted average Loss Given Default (LGD) rates. To estimate these quantities, we employ reasonable proxy information, including pool- specific delinquency rates, of the kind that an investor bank might use if the current regulatory practices in Europe were altered to allow top-down KIRB estimates (as are currently permitted in the US).
[13] In this, it differs from Perraudin (2014c).
[14] We can say that a particular approach is more or less conservative than another when comparing individual tranche risk weights, but this comparison does not give any information on another form of conservatism: the capital charges of all tranches of a given securitisation compared to capital charge of the pool underlying that securitisation. For example, the SFA is less conservative than the SSFA but still conservative vis-à-vis the pool.
[15] See the comments on changes to the MSFA model in BCBS (2013c, pg. 10).
[16] The AFA quant group is an informal collaboration between risk quantitative analysts specialising in securitisation capital from major international banks. Papers generated by the group may be found at http://www.riskcontrollimited.com/afa_capital.html.
[17] Internal Ratings Based approach.
[18] These tables exclude the specific treatment for re-securitisations.
[19] A development of that multi-period Monte Carlo risk model was used in Duponcheele at al. (2013d) to analyse capital for securitisations with long maturities.
[20] ABCP conduits can also use the SFA (see below) in IRB model.
[21] In some jurisdictions, “consistent” is interpreted as meaning the approach must closely follow a ratings agency approach. In others, it is interpreted as meaning that the approach must be analogous to a ratings agency approach but not a direct replica of such an approach.
[22] A typical issue is that, for ABCP conduits with trade receivables, the methodology to allocate capital charges to securitisation tranches for dilution and commingling risks, together “seller risk”, has not been formally described in the regulation. It is helpful that the recent EBA discussion paper (see EBA (2014)) focusses on ABS and leaves aside ABCP. This gives time to devote further thought to how seller risk could be accommodated in an HQS context.
[23] This technical threshold is the pool’s Value at Risk at 99.9%, KIRB. For the pool, the relationship between Value at Risk KIRB, Unexpected Loss K and Expected Loss EL is such that KIRB = K+ EL. In IRB, regulatory capital is based on Unexpected Loss K multiplied by 1.06. Thus, in this paper, we use the notation: KIRBA = K× 1.06. European regulation defines KIRB = K× 1.06 + EL1, where EL1 is the one-year expect loss. Hence, we have KIRB = KIRBA + EL1.
[24] The parameter ω is not from a credit model, but is a useful mathematical smoothing technique to remove a secondary cliff-effect that appears between S[KIRB] and K[KIRB].
[25] The IRBA can be used under a Foundation mode (F-IRBA) or Advanced mode (A-IRBA).
[26] Needing regulator approval to use the SFA on a case-by-case basis may be an issue if the regulator does not have to provide an answer within a fixed deadline. This is also true in the new securitisation framework (BCBS 269).
[27] The language in the BCBS 269 SA proposal lacks clarity, in that it is unclear whether risk weights for delinquent assets should be included in KSA. Some banks interpret BCBS 269 as saying they should, others take the opposite view.
[28] When the threshold level is set as follows: KT = KP, one may show that the capital for all the tranches of the deal KAllTrancℎes, is a multiple of the pool capital in that: KAllTrancℎes = (1 + p) × KP. KT KIRB p = pIRBA
[29] See Appendix 2 for an analysis of the sensitivity of capital calculations to definitions of attachment and detachment points.
[30] These values can be found in BCBS (2013c).
[31] Note that there is no notion of asset class in this approach. For example, the capital treatment of a AAA subprime-backed tranche is the same as that of a similarly rated prime asset-backed tranche.
[32] When structuring a securitisation, all arrangers will take into account the portfolio behaviour of the pool of assets in designing the liability structure. One technical point that arrangers need to address is the final legal maturity of the tranches. There are 3 key elements taken into account in this process: 1) the replenishment period (sometimes called the reinvestment period), 2) the longest possible contractual cash flow in the pool of assets (based on covenants), and 3) the length of the judicial process in the jurisdiction in which the assets are originated to allow time for the resolution of pool asset insolvency proceedings. The legal final maturity will typically be the sum of these 3 components.
[33] Length of legal process is already reflected in the assumed loss given default of the assets when determined with “IRB Standards”.
[34] The CMA framework provides a powerful set of tools for risk management of structured products and it is applicable in a range of applications. For example, a simple, thin-tranche version of the CMA is proposed by Perraudin (2014d) as an alternative to agency ratings in answering whether tranches that are candidates for HQS status are ‘Senior Enough’, i.e., whether they have reasonably high seniority.
[35] Please contact the authors for an Excel implementation.
[36] We used the fixed value of 15% for the floor to make the analysis compatible with the BCBS 269 proposals. However, we advocate the use of a simple, risk-sensitive floor equal to the value of (5% + 10% × RWSA), where RWSA is the risk weight of the associated asset class in the pool; so that the floor is higher for low quality pools and lower for high quality pool. For example, a high quality mortgage portfolio with RWSA = 35% would give a floor of 8.5% (= 5% + 10% × 35%); a low quality pool with RWSA = 150% would give a floor of 20% (= 5% + 10% × 150%). As a matter of principle, we consider that low quality pools warrant higher floors than high quality pools. Of course, in formulating regulations, one may wish to take into account other elements, such as compatibility with other rules. Our proposal contains different floors and we explain later the reasons of our choices.
[37] Here, Senior indicates the most senior tranche still having outstanding par in the structure. For a few tranches that Intex labels “mezzanine”, all the par of more senior tranches has been repaid whereupon we re-categorise them as Senior.
[38] In fact, the US has used the SSFA since 2010 as part of its trading book capital regulations. In July 2013, the US published new banking book rules (phased in for advanced banks in January 2014) under which the SFA is employed as an IRBA solution with proxy inputs if available, and the SSFA with p= 0.5 is used as the SA solution.
[42] It is better to distinguish the delinquent pool from the performing pool, using W as a measure of delinquent assets and KIRBA as a capital measure for the performing assets. Making this distinction is analytically preferable and has the advantage of improving consistency between the IRBA and the SA calculations.
[43] This is because our European sample contains mainly high quality RMBS and under the BCBS 269 proposals the pIRBA parameter is larger for good quality pools, implying a higher capital surplus. For subprime mortgages, the CMA would typically imply higher capital than under the IRBA.
[44] The values for the single p-parameter can be found in Duponcheele et al. (2014b).
[45] We view the use of such a linear function as misguided because key inputs like maturity are only regulatorily acceptably available in a very noisy form. For instance, the ‘true’ risk driver of Weighted Average Life cannot be employed since it requires judgment by the user, so the much less relevant variable tranche legal maturity is used instead. Replacing the linear p-function with an asset-class-specific value derived from representative, asset-class-specific deals therefore reduces noise and is a substantial improvement on the current proposals in our view.
[46] The values for the two p-parameters, p[1] and p[2], can be found in Duponcheele et al. (2014b).
[47] Basel (2013a) sets out principles that the Basel Committee believes should guide the development of financial regulations, namely Simplicity, Comparability, and Transparency.
[48] The parameter KT should be calculated, ideally, such that W is multiplied by LGDw instead of 0.5. However, this would require an additional definition for LGDw, and our proposal is motivated by having an efficient formula with the minimum amount of legislative changes.
[49] We use for the asset class weights the values given in Figure 4-a, Breakdown per Seniority.
[50] One may define the capital surcharge as the proportionate increase in capital if a bank holds all the tranches in a deal rather than all the pool assets of the securitisation. One may readily demonstrate that the capital surcharge, before the effect of delinquencies and of the floor, equals (pHQS + AFHQS −1).
[51] There are almost no covered bonds in the US market. So the Basel recommendation of 20% would apply mainly to Europe. Covered bonds is one of few cases where the European authorities have overridden the Basel recommendation to have a regulatory capital treatment adapted to the needs of the European economy.
[52] Also summarised in Table 10-a.
[53] The HQS European SSFA is simply labelled “HQS SSFA” in the tables section.
[54] In the case of the IAA, ABCP sponsors may consider using the SSFA to reduce reliance on external ratings via the risk weight mapping. (Some ABCP sponsors already use the current SFA in IRB mode.) It should be possible to keep an internal methodology close to the current IAA (i.e. consistent with the methodologies employed by credit rating agencies) taking into account all the risks related to an ABCP programme (portfolio risk, seller risk, interest risk, legal risk…). This IAA would not assign an internal rating but instead would produce the inputs needed to calculate the “European SSFA”. (Also, investors in ABCP paper may want to use the SSFA instead of the external ratings based method). But there are two important issues to address: 1: Specific jurisdiction issues: for many German ABCP transactions backed by trade receivables, the portfolio is 100% credit insured and the attachment point is not risk driven but a compromise between low insurance premium (the higher the first loss the lower the premium) and receivables derecognition in the seller’s financial statement (a too high first loss destroys the accounting true sale). To derive risk weights out of parameters that are not risk driven is not appropriate. 2: How to take into account the seller risk: this could be done with the parameters of the SSFA such as (i) the capital input prior to securitisation (where seller risk can be present), (ii) the attachment and detachment point to not double count the seller risk and pool risk, or (iii) the capital allocation of the SSFA itself, using for example different exponential allocations of capital charges for the pool and the seller risk. We believe that it is possible to find a capital charge methodology, based on the SSFA, that could delink completely the ABCP capital charges from external ratings based methods, but for this to be achieved, further discussion between regulators and the industry should take place.
[55] Post crisis, the mapping between external ratings and capital requirements was changed for re- securitisations, but not for securitisations.
[56] We are of the view that legislation should be built on sound foundations.
[57] If KIRBA is used instead of KIRB, then the parameters should be AFHQS = 0.6 and pHQS = 0.65
[60] We use the term “relaxed” in a regulatory context. This does not mean that the individual value of KIRB produced in this way is systematically lower than if one were to use the IRB standards. Simply, it means that non-originators can still produces IRBA inputs even if faced with data shortcomings. To compensate this effect, Fed guidance ask to “incorporate appropriate conservatism to address any data shortcomings”.
[61] Some are of the view that using “IRB by proxies” inputs instead of “SA” inputs should not be dependent on the underlying assets regulatory approval (“IRB bank” or “SA bank”), but rather the availability of data on the respective ABS/Conduit transaction. In that sense, an “SA bank” could, or even should be encouraged to, use “IRB by proxies” inputs. Reciprocally, an “IRB bank” could, or even should be encouraged to invest in “SA bank” securitisation issuances. Not being able to do so restricts trade within Europe, and reduces the role of financial markets in European integration. For example, if Bank A is IRB-approved for SME loans it cannot invest in the SME origination of an “SA bank” Bank B. This is true because Bank A would be obliged to apply IRB standards (which is not possible as the Bank B does not produce the IRB information) and Bank A is not permitted to switch to SA treatment for the Bank B transaction (as it needs to apply IRB standards to all its transactions, without exception). This is another example of an issue that is irrelevant for the Basel framework as it is developed internationally (European integration is not the mandate of Basel), but is very important for Europe.
[1] If KIRBA is used instead of KIRB, then the parameters should be AFHQS = 0.6 and pHQS = 0.65.