

Research Paper
How Risky are Structured Exposures
Compared to Corporate Bonds?
Evidence from Bond and ABS Returns
Date:2004 Reference Number:4/1
How Risky are Structured Exposures Compared to Corporate Bonds?
Evidence from Bond and ABS Returns
William Perraudin* and Astrid Van Landschoot **
May 2004
Abstract
This paper compares the risk of structured exposures with that of defaultable
corporate bonds with the same agency ratings. Risk is defined in a variety of ways
including return volatility, Value at Risk, Expected Shortfall and betas with credit
portfolios.
* Risk Control Limited and Imperial College,
william.perraudin@riskcontrollimited.com
** Astrid Van Landschoot, National Bank of Belgium,
Astrid.VanLandschoot@nbb.be
The views expressed are those of the authors and not of the institutions to which they are affiliated.
Introduction
Understanding the relative risks involved in investing in different sectors of credit markets will always be important for market participants and regulators alike. However, the debate about capital initiated by the Basel Committee’s recently published proposals on regulatory capital make this issue especially topical. (See Basel Committee on Banking Supervision (2003).)
In brief, the Committee’s proposals involve requiring each bank to hold capital to cover its banking book credit exposures largely based on the rating of these exposures.[1] For bonds and loans, the ratings for most banks will be internally generated based on systems approved by supervisors. For structured products, the ratings will be mostly agency ratings provided by the major international rating agencies.
Whether internal or external, the rating for an exposure is based on its expected loss or default probability. These aspects of an exposure are not the same as the exposure’s unexpected loss, which is generally thought to be an appropriate basis for setting capital. But experience suggests that, for reasonably homogeneous categories of assets, one may expect to find a stable relationship between expected loss and default probabilities and hence ratings on the one hand and unexpected loss and hence capital on the other hand.
Under the current Basel proposals, very different capital charges are envisaged for bonds and loans than for securitisation exposures such as holdings of tranches of Collateralised Debt Obligations (CDOs) or Asset Backed Securities (ABS). In general, the capital charges for securitisation exposures are considerably greater than similarly rated bonds or loans (i.e., bonds or loans with the same expected losses or default probabilities). For some industry practitioners, this has been controversial.
This chapter investigates the relative risks involved in investing in bonds and in tranches of securitisations by examining secondary market returns on these securities. We begin by investigating return volatility, Value-at-Risk (VaR) and Expected Shortfall (ES)[2] for investments in individual structured products and bonds that have the same agency rating. The relative risks associated with investing in individual assets depend on the portfolio within which they are held, however. Volatilities on individual assets are uninformative on the incremental risks that exposures contribute to portfolios.
Indeed, one might expect, a priori, that returns on structured exposures will be less volatile than returns on the underlying exposures in their pools as they represent claims to derivatives written on diversified pools of assets and hence are not much affected by idiosyncratic risks. On the other hand, structured exposures could contribute significantly to risk when held in a wider portfolio, as the risks they contain are largely factor or systematic risks that will in many cases be closely positively correlated with shocks to overall portfolio value.
To investigate the factor risk in bonds versus that in structured exposures, we also look at the volatility, VaRs and ES of broad indices. Individual exposures may have highly volatile returns but the index may be quite stable if the return volatility is idiosyncratic. By looking at index return statistics, we are able to filter out much of the idiosyncratic risk.
Furthermore, we examine the beta’s of individual exposures calculated against the indices for their respective market returns.[3] The use of a beta as a measure of incremental risk is suggested by the role beta’s play in asset pricing theory. Under the assumptions of the Capital Asset Pricing model, beta is a sufficient statistic for the incremental risk that a security contributes to a wider portfolio. When asset returns are normally distributed, the beta is also closely related to the marginal value of risk of an exposure, i.e., the amount by which investing in an additional unit of the investment in question boosts total portfolio VaR.
The data we employ in our study consists of secondary market time series returns on the constituent bonds and structured exposures in the Merrill Lynch Asset-Backed Securities Master Index and the Merrill Lynch corporate bond index. We restrict attention in both cases to the fixed rate, US-dollar denominated bonds and ABS tranches in these indices.
Despite the practical importance of this topic, there has been relatively little academic investigation of diversification in defaultable debt markets. Pedrosa and Roll (1998) study the distribution of factors driving changes in credit spreads. Varotto (2000) looks at whether credit risk reduction can be better achieved by diversifying across industry or country.
Data
The data we employ consists of weekly observations of returns on individual US ABS exposures and US corporate bonds in the period January 1997 to December 2003. The ABS exposures in question are those included in the US asset-backed securities master index (fixed rate) constructed by Merrill Lynch. The US corporate bonds are those included in the US corporate bond master index constructed by Merrill Lynch. We restrict attention to US dollar-denominated tranches and bonds.
For each tranche or corporate bond, we obtained a monthly rating series, the type, the maturity, and the coupon rate. Merrill Lynch distinguishes between ABS exposures with six different types of underlying collateral: (i) home equity loans (HEL), (ii) credit cards (Cards), (iii) automobile (Auto), (iv) manufactured housing (MH), (v) utilities (Util), and (vi) miscellaneous (Misc). Table 1 provides the different collateral types and a definition of the corresponding structured exposure. Corporate bonds are divided in three types according to the nature of the issuer: (i) financials (Fin), (ii) industrials (Ind), and (iii) utilities (Util).
The Merrill Lynch ABS and corporate bond indices only include investment grade assets. When we condition on ratings, we distinguish between AAA, AA, A, and BBB rated assets. If we only looked at returns on securities while they were part of the Merrill Lynch indices, this would induce a survivorship bias in that large negative returns associated with periods in which the security was downgraded and ceased to be investment grade would be omitted from our dataset. However, our approach is to condition on the rating that a security has on January 1st in any given calendar year and then to track the subsequent returns on that security even if the security falls out of the index.
This approach does not entirely eliminate survivorship bias as it is typically the case that securities on average become less liquid when their rating falls below investment grade levels. In this case, the security is less likely to be quoted and hence time series returns are less likely to be available. Nevertheless, one may expect this survivorship bias to be less serious than the one we avoid by our approach.
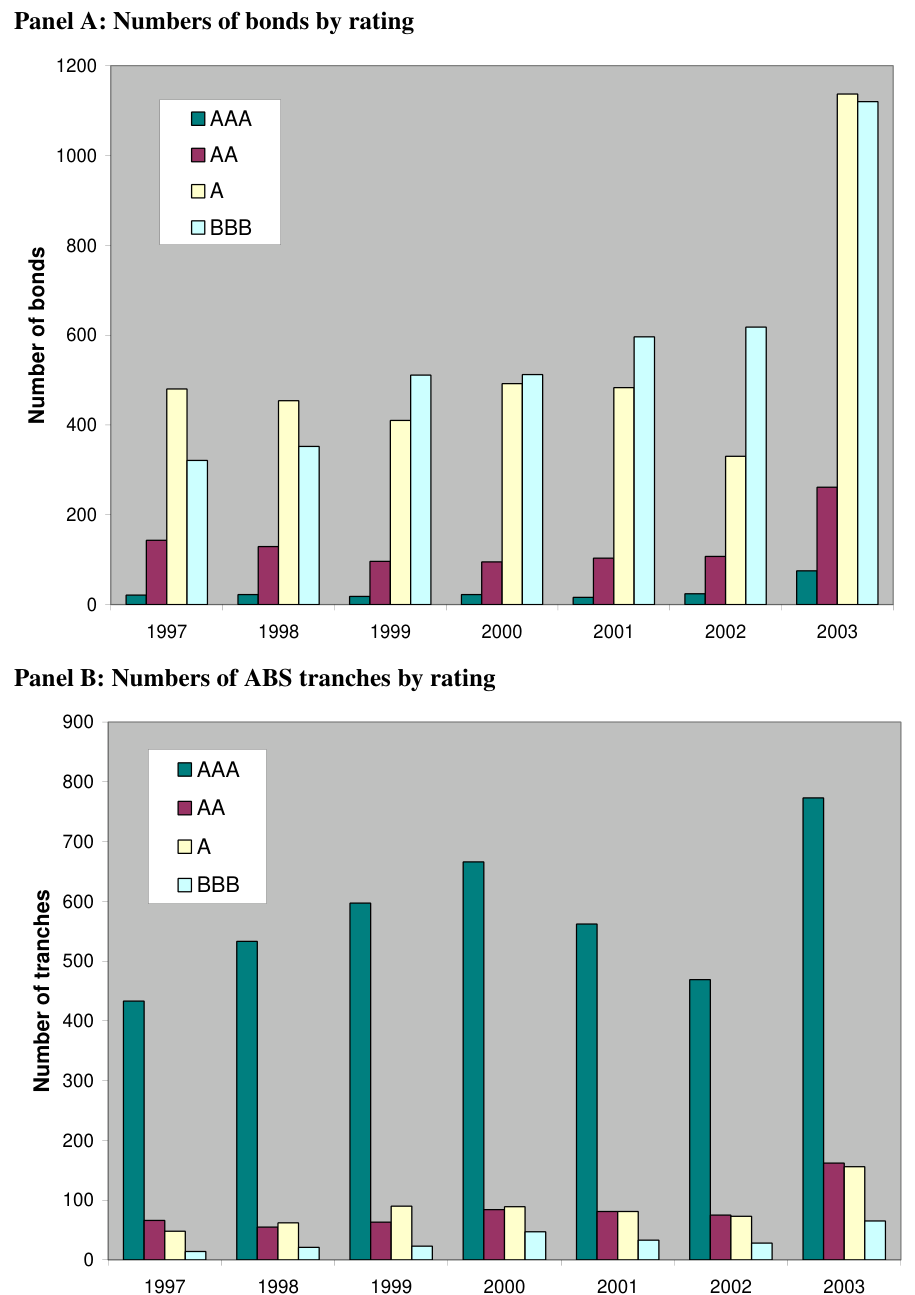
To estimate the statistics of returns such as volatilities, we require that at least 25 weekly returns are available in a given year. Figure 1 shows the availability of bonds and ABS tranches satisfying our criterion of 25 weekly returns year by year for different ratings (AAA, AA, A, and BBB) and, in the case of ABS tranches, for different collateral types (HEL, Cards, Auto, MH, Util, and Misc).
The histograms show that the distribution by rating of the bond and ABS samples are very different in that there are very few AAA and AA bonds whereas a large fraction of the ABS tranches are in these highest rating categories. Equally, there are comparatively few BBB ABS tranches while a large fraction of the bonds in the sample are rated BBB.
The number of bonds and ABS tranches in our sample has tended to increase over time although not exponentially. The largest increase in the number of securities occurred in the last year of our sample for bonds. Among ABS tranches, those with home equity loan, utility receivables and miscellaneous increased most over the sample period although in the case of the latter two categories this was from a very low base. The number of tranches with manufactured housing and credit card collateral was fairly consistent over the sample period.
One should stress that the number of securities in the sample is not directly indicative of the size of the market in the categories included. Rather it indicates the size of the liquid market that Merrill Lynch decided to include in its indices. The results just described are therefore primarily useful for the reader in interpreting results we obtain on risk measures described below.
Table 2 shows the average maturities of corporate bonds and ABS tranches in our sample. The table indicates that, for our sample at least, the average maturities for ABS tranches for different rating categories are greater than for similarly rated corporate bonds. This is no longer true if one restricts attention to ABS tranches with credit card or auto loan collateral. Manufactured Housing and Home Equity loan ABS tranches have very long average maturities. It is likely that our sample contains a higher proportion of relatively newly issued securities, which are more likely to be liquid “on-the-run” issues. This is especially the case for ABS tranches since this market expanded considerably through our sample period.
Empirical results
Individual exposures For each tranche and corporate bond return series, we estimate the mean, volatility, skewness and kurtosis of the annualised weekly returns for each of the years in our sample, i.e., 1997-2003. The averages of these statistics across individual securities are reported in Panels A to D of Table 3.
The returns are calculated as changes in the natural logarithm of ‘clean prices’, i.e., prices adjusted upwards to allow for accrued interest. So they are expressed on an annual basis, we multiply average weekly returns by 52. Similarly, volatilities calculated from weekly data are multiplied by the square root of 52. Skewness and kurtosis coefficients are dimensionless and hence do not require transformation.
The mean returns reported in Panel A of Table 3 should be seen as indicators of how the market performed in these years and not as estimates of equilibrium expected returns. To estimate the latter much longer time series would be required. The table shows significant year-to-year volatility in bonds while in the ABS market a period of modest gains and losses was followed by a distinct deterioration at the end of the sample period.
The volatilities reported in Panel B of Table 3 exhibit a similar pattern with low volatilities in the earlier years particularly for ABS tranches with a sharp rise in volatilities at the end of the sample period. For ABS tranches, the increase in volatility for the lower credit quality tranches in 2002 and 2003 is spectacular.
Comparing the average volatilities across the whole sample period for bonds and ABS tranches for given rating categories, the results suggest that the volatility of A and AA grade ABS tranches resembled that on bonds while AAA and BBB ABS tranches had lower and higher return volatilities respectively than similarly rated bonds. As stressed in the introduction, this does not of itself imply that, for example, AAA ABS tranches are less risky than AAA-rated bonds as the former may have greater factor correlation that will boost the risk of holding a wider portfolio.
Panels C and D of Table 3 contain estimates of skewness and kurtosis coefficients for bond and ABS tranche returns. These suggest that while there is some variation in the relative skewness of bond and ABS tranche returns, ABS tranche returns are more fat tailed than bond returns.
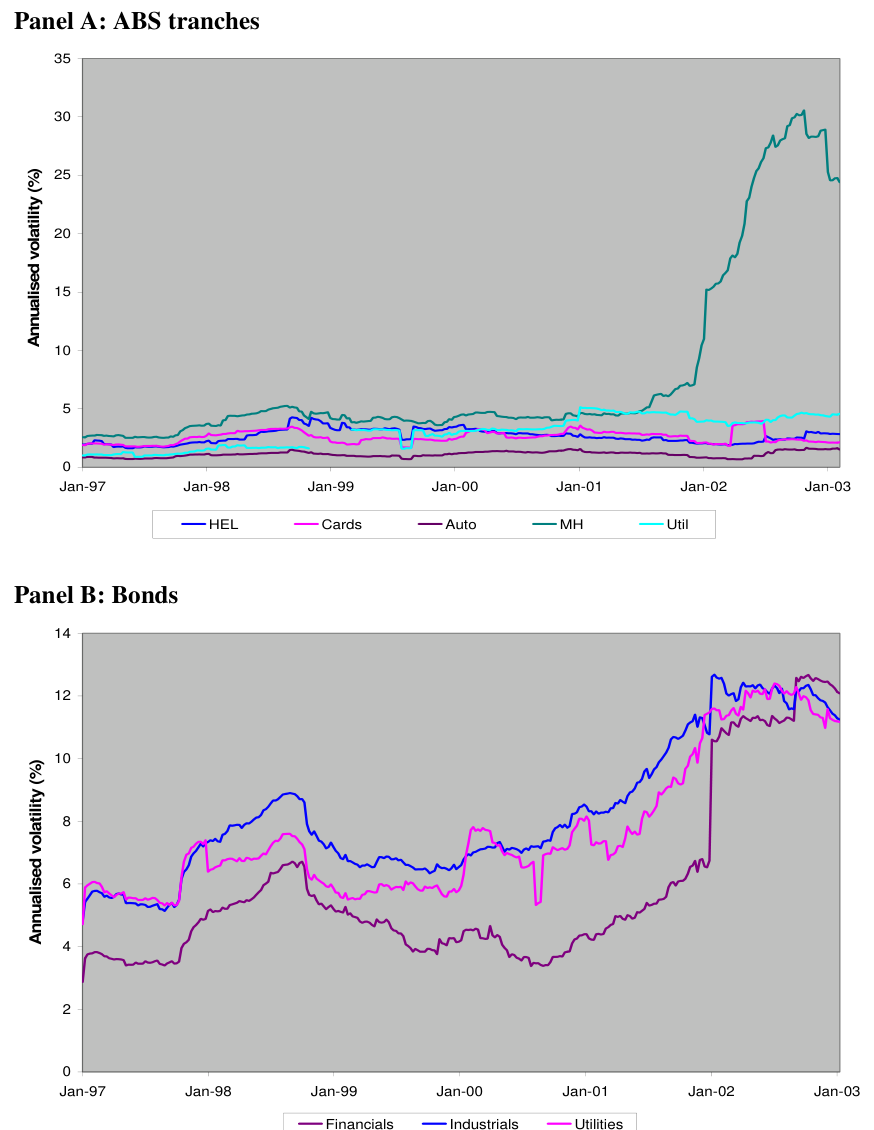
Table 4 contains sample statistics similar to those in Table 3 but broken down by issuer type (for bonds) and collateral type (for ABS tranches) rather than by rating. The results show that while the sample distribution of bond returns varies relatively little across issuer type, ABS tranche return sample distributions have exhibited very pronounced differences across collateral categories. To be specific, the volatility of returns for tranches with auto loan collateral has been low while that for tranches with manufactured housing collateral have, at the end of the sample period, been exceedingly high.
Interestingly, the kurtosis of returns on ABS tranches has been similar for different collateral types and consistently higher than that for bond returns of different issuer types.
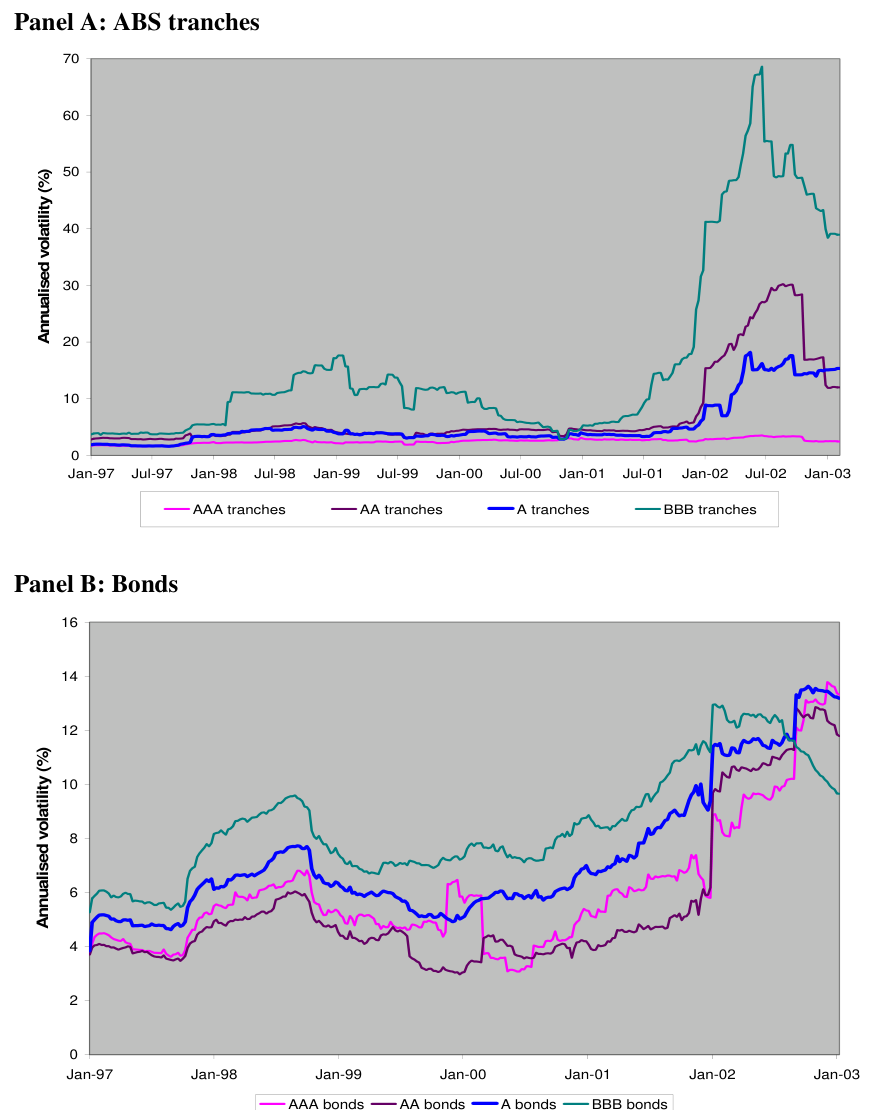
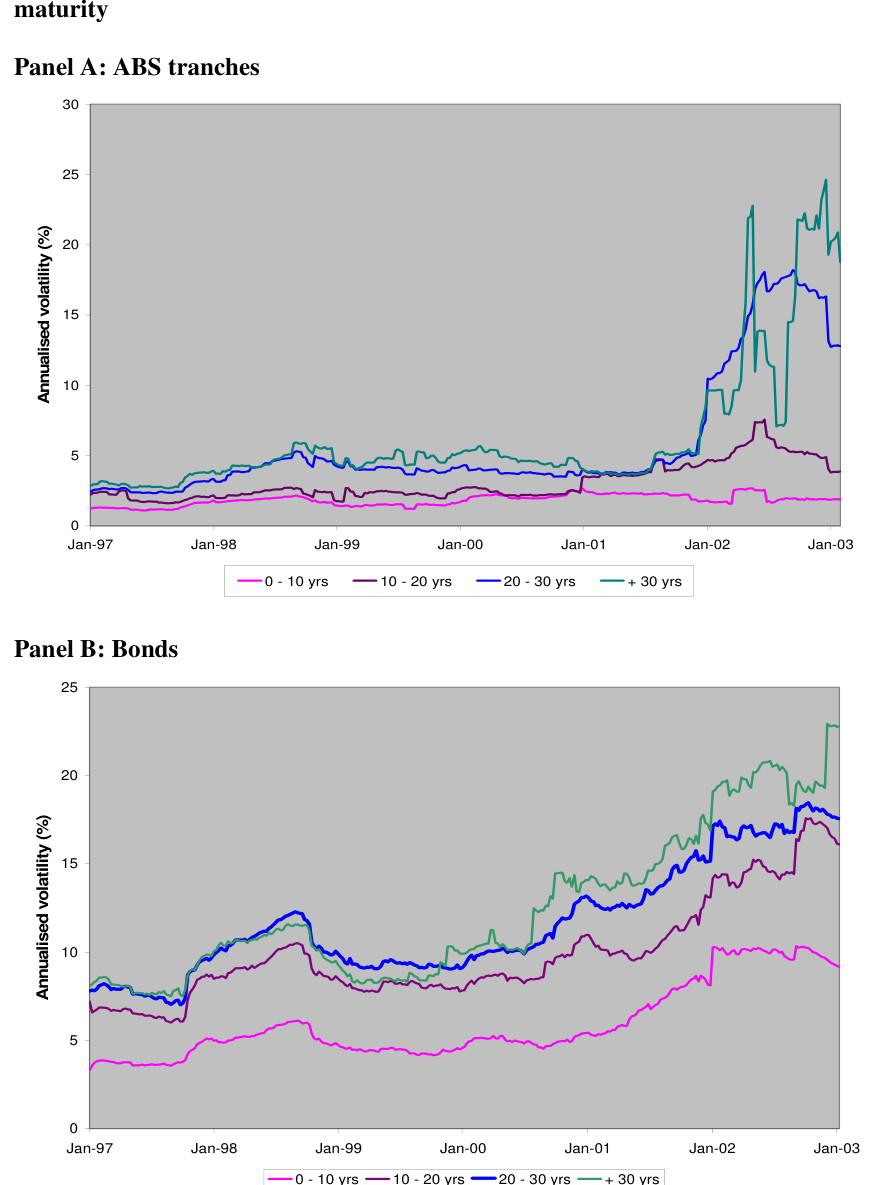
Figure 2 shows time series plots of volatilities on ABS and bond returns over the sample period. The plots rather dramatically illustrate the fact that the bond volatilities behave similarly for bonds of different rating categories (although they are generally higher for lower rating grades). In contrast, ABS-tranche return volatilities are very different for different rating categories, with lower ratings grades being very much riskier.
It also seems to be true that ABS tranche return volatilities experience regime changes in stress periods. At the end of the sample period, ABS return volatilities for all rating categories except AAA increase dramatically. The plots show the extent to which this increase is caused by deterioration in the credit standing of tranches with manufactured housing collateral. Leaving aside this sector, the increases in ABS volatilities at the end of the sample period are quite small.
To understand what happened to the manufactured housing sector during our sample period, one may consult sources such as Wachovia Securities (2000). This suggests that industry fundamentals in this sector were under considerable stress. Symptoms included excess dealer inventory, continued retail consolidation and rising repossessions. Over all, the deterioration in the general economy and a spike in the jobless rate caused a decline in the credit performance of securitised manufactured housing transactions. The market was further undercut by sales of repossessed units so that by the start of 2001 annualised manufactured housing shipments had dropped to their lowest level since 1991. A vicious circle arose in which the drop in prices further discouraged new purchases.
Tables 5 and 6 report panel regressions of individual security volatilities on rating dummies, issuer/collateral type dummies, maturity in years and annual time dummies for bonds and for ABS tranches. To be more precise, we estimate the following random effects model σit = µ+λt + β' xit +αi + uit
Here, µ is the constant term and λ the time dummies. x includes rating and type dummies and maturity in years. For ABS, we include 5 collateral type dummies (HEL, Cards, Auto, MH, Util) and for corporate bonds, we include 2 issuer type dummies (Fin and Ind). Our data set includes ABS and corporate bonds that are considered a random sample from some larger populations. It is therefore appropriate to use a random effects model. We assume that the random variables α and u are normally distributed.
The bond regression results in Table 5 suggest there is a consistent maturity effect and that volatilities for bonds issued by financials appear significantly higher but that the only other significant differences between volatilities are associated with the year in which the volatility is measured. In particular, rating does not play a significant role. These results suggest that the primary drivers for volatility in this market are factors that do not depend on expected loss or default probability such as liquidity and possibly risk premiums.
In contrast, the volatility of ABS tranche returns have a range of strongly significant explanatory variables in the regression results reported in Table 6. Rating and sector play big roles. (To some degree, these may appear more significant than they actually are as there could be omitted interaction effects between date and sector.) The lower rating categories are much more volatile and tranches with collateral made up of manufactured housing, utility and credit card receivables have the highest volatilities. Maturity is also a significant influence on ABS return volatility although not as large in magnitude as the maturity effect in bond volatilities.
Table 7 reports average Value at Risk (VaR) and Expected Shortfall (ES) for individual exposures, both bonds and ABS tranches. The confidence level for both risk measures is 5% (i.e., the VaR is the loss that will be exceeded on 5% of occasions). The results reinforce some of the conclusions of the analysis of volatilities presented above. For AAA grades, ABS returns are less risky than bond returns. As one moves down the investment grade categories to BBB, the ABS tranche returns appear substantially riskier. The ES measure that is very sensitive to outliers makes the ABS exposures appear particularly risky in that the AA as well as the BBB categories have much higher ES than the equivalent bond categories while for the Agrade categories the risk is roughly the same by this measure.
Portfolios of exposures As mentioned in the introduction, the measures of risk most relevant for calculating appropriate levels of economic or regulatory capital are those that reflect the contribution that individual exposures make to fluctuations in the value of a wider portfolio within which they are held. One can examine such contributions to volatility by considering the distribution of returns on indices of individual securities in which idiosyncratic volatility has been to a large extent diversified away. Alternatively, one may look at individual-security measures of incremental risk such as the beta of a security return with the return on a market index.
Table 8 contains results similar to those contained in Table 7 but for returns on indices of corporate bonds and ABS tranches. The indices are equal weighted indices created by the authors, sorting securities into rating categories according to the rating observed at the start of each calendar year. The qualitative picture that emerges from the table resembles that suggested by the individual security results in Table 7. Again, the BBB-rated ABS tranches are much riskier than the BBB-rated corporate bonds. The contrast is especially when one looks at the Expected Shortfall measure. AAArated bonds are riskier than AAA-rated ABS tranches. AA and A-rated bonds are broadly as risky as similarly rated ABS tranches.
We argued in the introduction that beta’s with respect to a market index (defined as covariances between individual security returns and the index return divided by the variance of the index return) may provide some insight into the contribution of single securities to the total risk faced by an investor who holds the index portfolio. Tables 9 and 10 report average beta’s of individual exposure returns on an aggregate investment in an equally-weighted index of the same exposures. (Note that this means that, in the case of ABS tranches, for example, the beta is the covariance of a single ABS tranche return with the return on an equally weighted index of ABS tranche investments.)
Over all the ABS tranches have higher beta’s with respect to an index of ABS tranche returns than do bonds with respect to a bond index. Interestingly, the beta’s for ABS tranches decline sharply with the rating whereas the beta’s for bonds are fairly stable for different rating categories. This suggests that there are multiple factors driving ABS tranches and they are particularly important for lower rating grades, whereas there are few common factors driving bond returns. It is also interesting to note that the levels of the average beta’s tend to decline over time for both bond and ABS securities.
Conclusion
This chapter has examined the risks involved in holding exposures to dollardenominated US corporate bonds or tranches of ABS. The results suggest that the behaviour of returns in these two markets is very different in that while bond volatilities and other risk measures behave in a reasonably consistent way over time and across sectors of the market, ABS tranche returns exhibit regime changes in which a particular sector deteriorates dramatically with substantial increases in risk over a relatively short period.
Our conclusions in this regard must be treated with caution as the regime change to which we allude occurs in a single sector, ABS with manufactured housing collateral, and once in our sample period. In effect, the volatilities we report should be seen as sample statistics revealing systematic patterns in the particular realisation of the last few years rather than reliable estimates of unconditional moments. Thus, for example, if the stress event driving our results had been greater in magnitude, one might expect that returns on higher rated tranches would exhibit regime-change like behaviour.
However, it is fair to conclude from the results we report that the operation of risks in the ABS market as very different from that in bonds. If one models, ABS tranche returns in a reduced form way as we do here, one must allow for regime shifts in which volatilities and other risk measures suddenly exhibit extreme behaviour. Future research should attempt to model risk in ABS tranches in a more structural way, explicitly allowing for the fact that they are generated non-linearly through shocks to highly levered claims written on pools of underlying assets. Within such a framework, one might hope to explain the dynamics of these markets without assuming regime changes.
References
Basel Committee on Banking Supervision, (2003) Overview of the New Basel Accord, Bank for International Settlements, Basel, April.
Pedrosa, M. and Roll, R., (1998) “Systematic Risk in Corporate Bond Credit Spreads”, Journal of Fixed Income, Volume 8, Number 3, December, pages 7-26.
Varotto, Simone, (2003) “Credit Risk Diversification and Bank Capital”, November, Bank of England Working Paper number 199.
Wachovia Securities (2002), “Manufactured housing loss severities remain stubbornly high”, www.securitization.net.
Home equity loans Securitization of home equity lines of credit, e.g. a revolving line of credit secured (collateralized) by your home Credit cards Securitization of retail credit card receivables (both bankcard and proprietary credit card receivables). Automobile loans Securitization of retail automobile loans including auto warehouse loans, automobile leases, and automobile loans. Manufactured housing Securitization of factory-built or pre-fabricated homes (includes mobile homes). Manufactured homes are the only homes with a national building code. Utility A structured security backed by various forms of mutual fund related revenues such as gas or electricity receivables.
5.99 HEL 4.96 7.5 5.62 5.88 5.71 5.63 6.64 Cards 4.52 6.36 4.68 5.11 6.84 4.82 4.48 5.26 5.92 Auto 4.68 6.99 5.41 5.41 7.92 5.18 5.88 MH 4 6.36 5.54 5.53 5.8 9.97 11.8 7.00 5.13 Util 4.92 6.02 - 3.48 4.9 6.23 5.2 Misc - - - - - - 8.67 8.67
Note: Home Equity Loans (HEL), Credit Cards (Cards), Automobile (Auto), Manufactured Housing (MH), Utilities (Util), and Miscellaneous (Misc).
0.83 Beta Mean 1.08 1.00 0.89 0.77 1.09 0.74 0.21 Stdev 0.48 0.59 0.37 0.49 0.55 0.38 0.24 # regressions 20 21 16 18 12 11 64 AA bonds Beta Mean 1.13 1.12 1.35 1.06 1.17 0.75 0.22 0.97 Stdev 0.59 0.61 0.85 0.45 0.48 0.54 0.25 # regressions 130 120 83 77 63 29 233 A bonds Beta Mean 0.99 0.92 0.92 0.81 0.84 0.46 0.23 0.74 Stdev 0.53 0.52 0.63 0.52 0.52 0.35 0.25 # regressions 449 424 378 443 401 180 1006 BBB bonds Beta Mean 0.73 0.61 0.66 0.49 0.59 0.46 0.53 0.58 Stdev 0.32 0.3 0.42 0.3 0.35 0.37 0.66 # regressions 317 349 501 500 567 543 1038
Panel C: Numbers of ABS tranches by sector
HEL Cards
Auto MH
Util Misc
Number of tranches
1997 1998 1999 2000 2001 2002 2003
| AAA | AA | A | BBB | ||||
|---|---|---|---|---|---|---|---|
| Bonds | mean | 11.53 | 7.53 | 10.68 | 13.35 | ||
| min | 1.31 | 1.19 | 1.05 | 1.24 | |||
| max | 68.06 | 43.75 | 90.49 | 90.50 | |||
| ABS | mean | 16.20 | 22.97 | 12.17 | 22.81 | ||
| tranches | min | 1.01 | 1.25 | 1.67 | 5.97 | ||
| max | 37.64 | 33.71 | 30.24 | 33.51 | |||
| HEL | Cards | Auto | MH | Util | Misc | ||
| ABS | mean | 22.70 | 5.58 | 3.47 | 26.45 | 8.15 | 10.34 |
| tranches | min | 4.61 | 1.39 | 1.06 | 6.97 | 2.05 | 1.50 |
| max | 37.52 | 11.77 | 9.93 | 31.99 | 18.00 | 29.25 |
| Panel | A: Average | Annualised Weekly | Returns | |||||
|---|---|---|---|---|---|---|---|---|
| Part 1: | Corporate Bonds | |||||||
| 1997 | 1998 | 1999 | 2000 | 2001 | 2002 | 2003 | Total | |
| AAA | 3.33 | 1.77 | -8.09 | 2.14 | 2.9 | 3.76 | -1.27 | 0.65 |
| AA | 3.65 | 1.44 | -5.97 | 3.24 | 2.92 | 2.01 | -1.75 | 0.79 |
| A | 2.84 | 0.93 | -8.87 | 1.82 | 2.71 | 3.31 | -0.29 | 0.35 |
| BBB | 5.27 | -0.9 | -9.1 | 2.22 | 2.15 | 2.7 | 3.64 | 0.85 |
| Part 2: | Asset-Backed | Securities | ||||||
| 1997 | 1998 | 1999 | 2000 | 2001 | 2002 | 2003 | Total | |
| AAA | 0.58 | -0.06 | -2.08 | 2.46 | 1.88 | 0.1 | -0.92 | 0.28 |
| AA | 1.88 | -0.87 | -3.2 | 2.41 | 1.92 | -3.44 | -4.3 | -0.80 |
| A | 0.44 | -0.32 | -2.91 | 2.73 | 2.77 | -3.19 | -9.88 | -1.48 |
| BBB | 2.32 | -4.1 | -6.4 | 2.86 | 2.95 | -25.41 | -43.8 | -10.23 |
| Panel | B: Volatility of | Annualised | Weekly Returns | |||||
| Part 1: | Corporate Bonds | |||||||
| 1997 | 1998 | 1999 | 2000 | 2001 | 2002 | 2003 | Total | |
| AAA | 3.98 | 5.28 | 4.8 | 5.18 | 4.33 | 5.12 | 12.59 | 5.90 |
| AA | 3.7 | 4.68 | 4.11 | 2.65 | 3.26 | 3.86 | 11.08 | 4.76 |
| A | 4.62 | 5.78 | 5.97 | 4.69 | 5.82 | 7.6 | 12.61 | 6.73 |
| BBB | 5.76 | 8.11 | 7.35 | 7.12 | 8.69 | 11.22 | 9.21 | 8.21 |
| Part 2: | Asset-Backed | Securities | ||||||
| 1997 | 1998 | 1999 | 2000 | 2001 | 2002 | 2003 | Total | |
| AAA | 1.67 | 2.25 | 2.16 | 2.36 | 3.06 | 2.57 | 2.44 | 2.36 |
| AA | 2.79 | 3.51 | 4.22 | 4.34 | 4.6 | 8.52 | 12.61 | 5.80 |
| A | 1.83 | 3.59 | 3.98 | 3.55 | 4.03 | 6.11 | 15.04 | 5.45 |
| BBB | 3.72 | 5.51 | 15.83 | 10.86 | 4.56 | 27.64 | 40.05 | 15.45 |
| Panel | C: Skewness of | Annualised | Weekly | Returns | ||||
|---|---|---|---|---|---|---|---|---|
| Part 1: | Corporate Bonds | |||||||
| 1997 | 1998 | 1999 | 2000 | 2001 | 2002 | Total | ||
| AAA | 0.11 | -0.38 | 0.06 | -0.69 | -0.19 | -0.2 | -0.12 | -0.20 |
| AA | 0.12 | -0.15 | 0.12 | -0.22 | 0.1 | 0.06 | -0.04 | 0.00 |
| A | 0.05 | -0.35 | 0.08 | -0.46 | -0.23 | -0.39 | -0.06 | -0.19 |
| BBB | 0.08 | -0.75 | -0.01 | -0.55 | -0.61 | -0.29 | -0.07 | -0.31 |
| Part 2: | Asset-Backed | Securities | ||||||
| 1997 | 1998 | 1999 | 2000 | 2001 | 2002 | Total | ||
| AAA | -0.08 | 0.64 | 0.2 | -0.04 | 0 | 0.01 | -0.16 | 0.08 |
| AA | 0.06 | -0.03 | 0.11 | -0.45 | -0.66 | -1.54 | -0.21 | -0.39 |
| A | 0.02 | 0.06 | -0.36 | -0.19 | -0.42 | -0.6 | -0.54 | -0.29 |
| BBB | 0.23 | -0.74 | -1.81 | 0.31 | -0.27 | -1.68 | -1.86 | -0.83 |
| Panel | D: Kurtosis of | Annualised | Weekly Returns | |||||
| Part 1: | Corporate Bonds | |||||||
| 1997 | 1998 | 1999 | 2000 | 2001 | 2002 | Total | ||
| AAA | 3.41 | 4.83 | 2.98 | 5.84 | 4.93 | 4.58 | 4.53 | 4.44 |
| AA | 3.38 | 4.49 | 3.07 | 3.94 | 4.91 | 4.15 | 4.71 | 4.09 |
| A | 3.49 | 5 | 3.27 | 4.4 | 4.91 | 6.3 | 4.38 | 4.54 |
| BBB | 3.12 | 5.36 | 4.29 | 5.39 | 5.48 | 6.38 | 4.97 | 5.00 |
| Part 2: | Asset-Backed | Securities | ||||||
| 1997 | 1998 | 1999 | 2000 | 2001 | 2002 | Total | ||
| AAA | 4.42 | 6.95 | 5.04 | 4.82 | 6.35 | 5.58 | 5.66 | 5.55 |
| AA | 3.98 | 6.83 | 4.67 | 4.68 | 6.39 | 12.27 | 10.58 | 7.06 |
| A | 4.82 | 5.72 | 6.12 | 5.13 | 5.94 | 7.01 | 9.09 | 6.26 |
| BBB | 3.28 | 5.16 | 14.38 | 17.39 | 5.69 | 15.81 | 16 | 11.10 |
| Panel A: Average | Annualized Weekly | Returns | ||||||
|---|---|---|---|---|---|---|---|---|
| Part 1: Corporate | Bonds | |||||||
| 1997 | 1998 | 1999 | 2000 | 2001 | 2002 | 2003 | Total | |
| Fin | 2.23 | 0.73 | -6.01 | 1.2 | 3.01 | 2.27 | -0.35 | 0.44 |
| Ind | 4.43 | -0.05 | -9.24 | 2.25 | 2.37 | 3.2 | 1.63 | 0.66 |
| Util | 3.42 | 2.1 | -9.57 | 3.65 | 1.59 | 1.26 | 4.33 | 0.97 |
| Part 2: | Asset-Backed | Securities | ||||||
| 1997 | 1998 | 1999 | 2000 | 2001 | 2002 | 2003 | Total | |
| HEL | 0.63 | -0.35 | -2.01 | 3.01 | 2.35 | 0.49 | -1.2 | 0.42 |
| Cards | 0.46 | 0.4 | -2.8 | 2.63 | 2.5 | 1.48 | -1.58 | 0.44 |
| Auto | -0.04 | 0.21 | -1.16 | 0.99 | 1.2 | -1.76 | -1.37 | -0.28 |
| MH | 1.57 | -0.91 | -3.67 | 2.31 | 1.56 | -6.41 | -17.43 | -3.28 |
| Util | -0.03 | 0.24 | - | 4.37 | 4.14 | 4.34 | -0.75 | 2.05 |
| Misc | - | - | - | - | - | - | -2.89 | -2.89 |
| Panel B: Volatility | of | Annualised | Weekly Returns | |||||
| Part 1: Corporate | Bonds | |||||||
| 1997 | 1998 | 1999 | 2000 | 2001 | 2002 | 2003 | Total | |
| Fin | 3.42 | 4.89 | 4.68 | 3.73 | 3.52 | 4.89 | 11.43 | 5.22 |
| Ind | 5.25 | 7.09 | 7.01 | 6.25 | 8.03 | 10.29 | 10.84 | 7.82 |
| Util | 5.68 | 6.28 | 5.53 | 5.63 | 7.68 | 11.38 | 10.38 | 7.51 |
| Part 2: | Asset-Backed | Securities | ||||||
| 1997 | 1998 | 1999 | 2000 | 2001 | 2002 | 2003 | Total | |
| HEL | 1.92 | 2.22 | 3.38 | 3.45 | 2.84 | 2.04 | 2.92 | 2.68 |
| Cards | 1.86 | 2.64 | 2.17 | 2.38 | 3.54 | 2.08 | 2.13 | 2.40 |
| Auto | 0.82 | 1.08 | 1.03 | 1.03 | 1.46 | 0.78 | 1.42 | 1.09 |
| MH | 2.57 | 3.69 | 4.22 | 4.31 | 4.64 | 9.98 | 25.55 | 7.85 |
| Util | 1.01 | 1.53 | - | 2.84 | 5.18 | 4.13 | 4.4 | 3.18 |
| Misc | - | - | - | - | - | - | 3.1 | 3.10 |
Note: Home Equity Loans (HEL), Credit Cards (Cards), Automobile (Auto), Manufactured Housing (MH), Utilities (Util), and Miscellaneous (Misc).
| Panel C: | Skewness of | Annualized | Weekly | Returns | ||||
|---|---|---|---|---|---|---|---|---|
| Part 1: Corporate | Bonds | |||||||
| 1997 | 1998 | 1999 | 2000 | 2001 | 2002 | 2003 | Total | |
| Fin | 0.1 | -0.25 | 0.01 | -0.34 | 0 | -0.04 | -0.02 | -0.08 |
| Ind | 0.06 | -0.54 | 0.04 | -0.53 | -0.49 | -0.3 | -0.09 | -0.26 |
| Util | 0.08 | -0.6 | 0.11 | -0.46 | -0.61 | -0.52 | 0 | -0.29 |
| Part 2: | Asset-Backed | Securities | ||||||
| 1997 | 1998 | 1999 | 2000 | 2001 | 2002 | 2003 | Total | |
| HEL | -0.07 | 0.83 | 0.26 | 0.12 | -0.07 | 0.2 | -0.28 | 0.14 |
| Cards | 0.04 | 0.56 | -0.04 | -0.07 | -0.17 | -0.21 | -0.16 | -0.01 |
| Auto | -0.19 | 0.65 | 0.02 | -0.08 | 0.81 | 0.67 | -0.12 | 0.25 |
| MH | 0 | 0.11 | -0.13 | -0.37 | -0.66 | -1.3 | -0.75 | -0.44 |
| Util | -0.05 | 0.71 | - | 0.06 | -0.43 | 0.38 | 0.11 | 0.13 |
| Misc | - | - | - | - | - | - | -0.16 | -0.16 |
| Panel D: Kurtosis | of | Annualised | Weekly Returns | |||||
| Part 1: Corporate | Bonds | |||||||
| 1997 | 1998 | 1999 | 2000 | 2001 | 2002 | 2003 | Total | |
| Fin | 3.34 | 5.27 | 3.52 | 4.07 | 5.05 | 5.33 | 4.52 | 4.44 |
| Ind | 3.24 | 5 | 3.92 | 5.11 | 5.28 | 6.11 | 4.66 | 4.76 |
| Util | 3.98 | 4.95 | 2.83 | 4.61 | 4.8 | 7.5 | 5.38 | 4.86 |
| Part 2: | Asset-Backed | Securities | ||||||
| 1997 | 1998 | 1999 | 2000 | 2001 | 2002 | 2003 | Total |
| (1) | (2) | (3) | (4) | (5) | |
|---|---|---|---|---|---|
| ct | 8.67 | 8.73 | 3.78 | 2.92 | 1.23 |
| (0.00) | (0.00) | (0.00) | (0.00) | (0.06) | |
| AA | -1.20 | -0.28 | -0.27 | ||
| (0.08) | (0.65) | (0.65) | |||
| A | -0.18 | 0.30 | 0.54 | ||
| (0.78) | (0.61) | (0.33) | |||
| BBB | 0.62 | 0.80 | 0.54 | ||
| (0.35) | (0.18) | (0.34) | |||
| Fin | -0.41 | 1.30 | 0.66 | ||
| (0.36) | (0.00) | (0.08) | |||
| Ind | 0.16 | -0.07 | -0.04 | ||
| (0.71) | (0.84) | (0.90) | |||
| Maturity | 0.34 | 0.34 | 0.32 | ||
| (0.00) | (0.00) | (0.00) | |||
| dum98 | 1.27 | ||||
| (0.00) | |||||
| dum99 | 0.33 | ||||
| (0.12) | |||||
| dum00 | -0.01 | ||||
| (0.95) | |||||
| dum01 | 1.45 | ||||
| (0.00) | |||||
| dum02 | 3.22 | ||||
| (0.00) | |||||
| dum03 | 3.71 | ||||
| (0.00) | |||||
| Adj R² | 1.1% | 0.6% | 22.1% | 22.3% | 29.3% |
| BP LM test | 756.1 | 766.5 | 301.2 | 299.4 | 244.6 |
| (p-value) | 0.00 | 0.00 | 0.00 | 0.00 | 0.00 |
Note: Dependent variable: annualised weekly volatility of corporate bond returns. Random effects model is used to do the analysis. BP LM test is the Breusch-Pagan Lagrange Multiplier test for random effects. p-values are given between brackets. Coefficients that are significant at a 5% level are bold.
| (1) | (2) | (3) | (4) | (5) | |
|---|---|---|---|---|---|
| ct | 2.26 | 3.16 | -0.57 | -2.99 | -5.67 |
| 0.00 | 0.08 | 0.08 | 0.09 | 0.00 | |
| AA | 3.62 | 1.76 | 1.00 | ||
| 0.00 | 0.00 | 0.04 | |||
| A | 4.92 | 4.83 | 4.59 | ||
| 0.00 | 0.00 | 0.00 | |||
| BBB | 19.73 | 16.76 | 16.48 | ||
| 0.00 | 0.00 | 0.00 | |||
| HEL | -0.29 | -1.94 | 2.10 | ||
| 0.87 | 0.26 | 0.23 | |||
| Cards | -0.76 | 1.45 | 4.02 | ||
| 0.68 | 0.40 | 0.02 | |||
| Auto | -2.01 | 1.38 | 3.21 | ||
| 0.27 | 0.43 | 0.06 | |||
| MH | 5.43 | 1.67 | 6.51 | ||
| 0.00 | 0.34 | 0.00 | |||
| Util | 0.75 | 3.65 | 5.91 | ||
| 0.70 | 0.05 | 0.00 | |||
| Maturity | 0.23 | 0.25 | 0.15 | ||
| 0.00 | 0.00 | 0.00 | |||
| Dum98 | 0.51 | ||||
| 0.35 | |||||
| Dum99 | 0.75 | ||||
| 0.16 | |||||
| Dum00 | 0.27 | ||||
| 0.61 | |||||
| Dum01 | 0.19 | ||||
| 0.73 | |||||
| Dum02 | 1.54 | ||||
| 0.01 | |||||
| Dum03 | 4.56 | ||||
| 0.00 | |||||
| Adj R² | 12.8% | 6.9% | 5.5% | 18.5% | 20.5% |
| BP LM test | 82.0 | 63.0 | 75.3 | 25.1 | 31.0 |
| (p-value) | 0.00 | 0.00 | 0.00 | 0.00 | 0.00 |
Note: Dependent variable: annualised weekly volatility of weekly ABS returns. Random effects model is used to do the analysis. BP LM test is the Breusch-Pagan Lagrange Multiplier test for random effects. p-values are given between brackets. Coefficients that are significant at a 5% level are bold. Home Equity Loans (HEL), Credit Cards (Cards), Automobile (Auto), Manufactured Housing (MH), Utilities (Util).
| Panel | A: Average | Value-at-Risk | for individual | exposures | ||||
|---|---|---|---|---|---|---|---|---|
| Part 1: | Corporate Bonds | |||||||
| 1997 | 1998 | 1999 | 2000 | 2001 | 2002 | 2003 | Total | |
| AAA | 49.46 | 68.22 | 64.76 | 49.65 | 67.03 | 74.75 | 168.46 | 77.48 |
| AA | 44.04 | 64.30 | 55.11 | 31.16 | 41.85 | 46.50 | 140.16 | 60.45 |
| A | 56.92 | 75.26 | 76.43 | 61.66 | 78.61 | 88.74 | 163.40 | 85.86 |
| BBB | 67.74 | 110.09 | 92.12 | 96.32 | 113.7 | 140.89 | 108.42 | 104.18 |
| Part 2: | Asset-Backed | Securities | ||||||
| 1997 | 1998 | 1999 | 2000 | 2001 | 2002 | 2003 | Total | |
| AAA | 19.01 | 27.24 | 25.54 | 24.84 | 39.88 | 30.77 | 29.94 | 28.17 |
| AA | 29.82 | 42.42 | 49.15 | 46.69 | 60.48 | 80.53 | 151.35 | 65.78 |
| A | 20.56 | 46.67 | 43.94 | 32.62 | 55.05 | 78.51 | 194.21 | 67.37 |
| BBB | 39.16 | 86.16 | 127.69 | 83.54 | 63.97 | 291.02 | 506.71 | 171.18 |
| Panel | B: Average | Expected Shortfall | ||||||
| Part 1: | Corporate Bonds | |||||||
| 1997 | 1998 | 1999 | 2000 | 2001 | 2002 | 2003 | Total | |
| AAA | 55.56 | 91.85 | 71.10 | 85.18 | 75.73 | 84.33 | 202.11 | 95.12 |
| AA | 48.93 | 78.86 | 62.37 | 38.78 | 50.64 | 55.86 | 174.91 | 72.91 |
| A | 64.87 | 99.75 | 90.48 | 80.00 | 97.00 | 125.20 | 197.45 | 107.82 |
| BBB | 75.12 | 149.86 | 114.63 | 126.37 | 150.32 | 190.89 | 137.73 | 134.99 |
| Part 2: | Asset-Backed | Securities | ||||||
| 1997 | 1998 | 1999 | 2000 | 2001 | 2002 | 2003 | Total | |
| AAA | 23.72 | 34.92 | 33.33 | 32.26 | 51.38 | 44.32 | 40.90 | 37.26 |
| AA | 35.46 | 61.65 | 63.99 | 67.14 | 81.01 | 171.67 | 237.08 | 102.57 |
| A | 25.54 | 62.50 | 64.12 | 51.92 | 68.05 | 132.26 | 312.92 | 102.47 |
| BBB | 46.88 | 105.64 | 306.95 | 164.44 | 77.92 | 604.35 | 906.18 | 316.05 |
| Panel | A: Value-at-Risk | of Index | ||||||
|---|---|---|---|---|---|---|---|---|
| Part 1: | Corporate Bonds | |||||||
| 1997 | 1998 | 1999 | 2000 | 2001 | 2002 | 2003 | Total | |
| AAA | 47.13 | 77.31 | 50.96 | 50.13 | 52.82 | 51.34 | 68.92 | 56.94 |
| AA | 40.00 | 64.00 | 54.63 | 27.84 | 37.12 | 33.71 | 60.54 | 45.41 |
| A | 46.72 | 77.21 | 66.03 | 44.87 | 60.30 | 55.19 | 69.71 | 60.00 |
| BBB | 60.98 | 97.81 | 74.50 | 58.82 | 79.92 | 47.74 | 81.22 | 71.57 |
| Part 2: | Asset-Backed | Securities | ||||||
| 1997 | 1998 | 1999 | 2000 | 2001 | 2002 | 2003 | Total | |
| AAA | 16.10 | 31.07 | 19.35 | 18.38 | 34.51 | 20.82 | 20.85 | 23.01 |
| AA | 29.64 | 41.19 | 41.95 | 37.48 | 52.05 | 75.24 | 66.26 | 49.12 |
| A | 18.41 | 44.99 | 34.65 | 28.57 | 48.91 | 51.13 | 76.66 | 43.33 |
| BBB | 30.09 | 82.43 | 66.29 | 48.17 | 48.43 | 153.02 | 212.34 | 91.54 |
| Panel | B: Expected | Shortfall of Index | ||||||
| Part 1: | Corporate Bonds | |||||||
| 1997 | 1998 | 1999 | 2000 | 2001 | 2002 | 2003 | Total | |
| AAA | 51.37 | 94.04 | 63.26 | 65.91 | 73.88 | 59.99 | 70.98 | 68.49 |
| AA | 43.84 | 73.43 | 57.29 | 33.83 | 56.11 | 42.40 | 64.43 | 53.05 |
| A | 52.37 | 98.37 | 80.91 | 55.24 | 80.64 | 67.96 | 78.25 | 73.39 |
| BBB | 66.46 | 130.16 | 79.03 | 79.23 | 105.83 | 68.14 | 88.52 | 88.20 |
| Part 2: | Asset-Backed | Securities | ||||||
| 1997 | 1998 | 1999 | 2000 | 2001 | 2002 | 2003 | Total | |
| AAA | 20.42 | 31.91 | 21.16 | 23.37 | 45.00 | 29.63 | 27.47 | 28.42 |
| AA | 31.55 | 54.97 | 47.62 | 52.55 | 68.02 | 87.84 | 97.17 | 62.82 |
| A | 23.09 | 56.37 | 50.50 | 33.50 | 62.43 | 69.66 | 109.16 | 57.82 |
| BBB | 37.17 | 94.61 | 169.88 | 72.68 | 56.82 | 313.16 | 414.76 | 165.58 |
| 1997 | 1998 | 1999 | 2000 | 2001 | 2002 | 2003 | |
|---|---|---|---|---|---|---|---|
| All bonds | |||||||
| Beta Mean | 0.92 | 0.83 | 0.82 | 0.67 | 0.73 | 0.47 | 0.36 |
| Stdev | 0.5 | 0.5 | 0.59 | 0.46 | 0.46 | 0.38 | 0.5 |
| # regressions | 916 | 914 | 978 | 1038 | 1043 | 763 | 2341 |
| AAA bonds |
| 1997 | 1998 | 1999 | 2000 | 2001 | 2002 | 2003 | Total | ||
|---|---|---|---|---|---|---|---|---|---|
| All tranches | |||||||||
| Beta | Mean | 1.24 | 1.3 | 1 | 1.03 | 0.9 | 0.61 | 0.8 | 0.98 |
| Stdev | 0.85 | 1.03 | 0.83 | 0.89 | 0.53 | 0.5 | 0.93 | ||
| # regressions | 538 | 650 | 747 | 869 | 801 | 643 | 1036 | ||
| AAA tranches | |||||||||
| Beta | Mean | 1.32 | 1.4 | 1.11 | 1.14 | 0.98 | 0.69 | 1.01 | 1.09 |
| Stdev | 0.87 | 1.06 | 0.87 | 0.92 | 0.54 | 0.49 | 1.03 | ||
| # regressions | 417 | 515 | 578 | 649 | 593 | 465 | 651 | ||
| AA tranches | |||||||||
| Beta | Mean | 0.94 | 0.99 | 0.68 | 0.68 | 0.6 | 0.32 | 0.27 | 0.64 |
| Stdev | 0.81 | 0.9 | 0.56 | 0.56 | 0.35 | 0.35 | 0.33 | ||
| # regressions | 63 | 54 | 62 | 83 | 87 | 76 | 177 | ||
| A tranches | |||||||||
| Beta | Mean | 1.14 | 1 | 0.66 | 1.01 | 0.87 | 0.61 | 0.77 | 0.87 |
| Stdev | 0.52 | 0.74 | 0.46 | 0.78 | 0.51 | 0.53 | 0.69 | ||
| # regressions | 44 | 60 | 86 | 89 | 87 | 73 | 142 | ||
| BBB tranches | |||||||||
| Beta | Mean | 0.47 | 0.48 | 0.18 | 0.16 | 0.54 | 0.15 | 0.27 | 0.32 |
| Stdev | 0.19 | 0.23 | 0.23 | 0.26 | 0.28 | 0.24 | 0.46 | ||
| # regressions | 14 | 21 | 21 | 48 | 34 | 29 | 66 |
Notes
[1] For bonds and loans, the capital will be calculated by inputting default probabilities and loss given default (LGD) estimates and maturity into a formula. The regulatory capital for structured exposures that possess agency ratings will be determined by consulting a simple look up table of charges for different rating grades. Distinction is made in this table between senior tranches, low granularity tranches and all other tranches.
[2] The VaR for a return r over a given holding period and for a given confidence level α is defined implicitly by Probability(r<-VaR) =α. The ES for r is defined by ES=E(r|r<-VaR).
[3] The beta of one return, r[1], against another, r[2], is defined as Covariance(r[1],r[2])/Variance(r[2]).