

The risk and liquidity characteristics of securitisations vary greatly, posing challenges for investors and regulators alike. Recently, there has been interest in the possibility of identifying, through simple observable characteristics, a category of High Quality Securitisation (HQS) likely to exhibit lower risk and higher liquidity. Such securitisations might prove attractive to investors and merit favourable regulatory treatment. This paper (i) discusses existing ways of classifying securitisations employed by the industry, central banks and regulators and (ii) investigates statistically how securitisations satisfying key candidate characteristics for an HQS definition have performed in the past. We show that securitisations possessing these characteristics have indeed exhibited much lower risk and higher liquidity in recent years.
Section 1 – introduction
The poor credit and liquidity performance of some sub-sectors of the securitisation market contributed substantially to the recent financial crisis. Brunnermeier (2012) and Caprio, Demirgüç-Kunt and Kane
(2010) describe how the collapse in credit quality and liquidity of US sub-prime Residential Mortgage Backed Securities (RMBS) provoked a global liquidity crisis, affecting financial institutions exposed to those securities. This spiralled out into a bank and sovereign credit crisis in Europe which, in turn, led to recession and weakness in European securitisations vulnerable to refinancing risk.
While some sectors of the securitisation market performed poorly, others remained robust even in the face of what turned out to be very extreme stress events. To illustrate, since 2007 GDP in countries such as the UK, France, Spain and Italy showed peak to trough GDP declines of 7.2%, 4.4%, 5.0%, and 7.2% respectively[3]. Yet, European securitisations exhibited default rates of 2.5% between 2007 and 2013 (see Standard & Poor’s (2013)). This contrasted with outcomes in the United States where GDP declined by 4.3% peak to trough but US securitisations experienced default rates of 18.4%.
A large fraction of the defaults that made up the 2.5% for European securitisations was CDOs of ABS, many of which were exposed to US ABS tranches. Leaving out CDOs of ABS, the default rate was 1.8%. Also removing CMBS and other CDOs (including synthetic), the default rate drops to 0.12%. Retail and Small and Medium Enterprises (SME) loan backed securitisations in Europe proved strikingly robust to the crisis. RMBS, Other Consumer Asset Backed Securities (ABS), Credit Card ABS and SME CLOs experienced cumulative default rates of 0.10%, 0.13%, 0.00% and 0.41% respectively between 2007 and 2013 (again, see Standard & Poor’s (2013)).[4]
The striking variation in the performance of different segments of the securitisation market has encouraged proposals to develop a High Quality Securitisation (HQS) category that could be used as a guide for investors or as a basis for differentiation in regulatory treatment.
In a recent joint statement, the Bank of England and European Central Bank (ECB) (see Bank of England-ECB (2014)) argue in favour of reviving the securitisation market in Europe and suggest that one way to achieve this might be to afford favourable regulatory treatment to securitisations that conform to a HQS definition. Earlier, the European Insurance and Occupational Pension Authority (EIOPA) included proposals for the use of such a distinction in Solvency II rules for European insurer capital (see EIOPA (2013a) and (2013b)).
A related industry-based initiative has been developed by Prime Collateralised Securities (PCS), an industry body launched in 2012. PCS labels individual securities that conform to its HQS definition. Its objective in this has been to confirm for investors that a given securitisation has a simple and transparent structure with good quality asset pools and hence is likely to exhibit lower risk.
This paper aims to analyse the relative performance of a selected HQS segment of the European securitisation market, which we identify using a simplified version of the PCS criteria. In evaluating performance, we focus on the liquidity and risk of individual securitisation tranches. We measure liquidity performance using the size of bid-ask spreads. To assess risk, we calculate volatilities (standard deviation of the log price changes) of individual tranches based on rolling windows of overlapping observations. We adjust for statistical bias using a technique proposed by Kiesel, Perraudin and Taylor (2001) and (2003).
Note that volatility is a natural and widely used measure of risk. As one example among many, it was used in assessing appropriate Solvency II capital charges for securitisations by EIOPA (2013b). The appropriate measure to employ for liquidity is more controversial. The EBA in its recent work on the Liquidity Coverage Ratio (LCR) actually employs volatility along with turnover ratio as the two indicators of “liquidity” on which it bases it recommendations for LCR asset class eligibility. Perraudin (2014) is critical of this choice, arguing that the single most obvious measure of liquidity is the bid-ask spread, as employed here.
We find that HQS tranches exhibit substantially lower risk (as measured by volatility) and somewhat higher liquidity (as measured by bid-ask spreads) than non-HQS tranches. The effects are clear within asset classes as well as for the market as a whole, and appear consistent over time. The superior performance of HQS tranches remains when we focus on securities with a given rating grade, AAA.
In the exercise just described, how do we go about identifying High Quality Securitisations (HQS)? The PCS HQS definition is complex and elaborate. In an empirical study like this, we must necessarily focus on a few key criteria instead of examining the large number of characteristics required by PCS. The criteria on which we focus are that the tranche (i) is the most senior in its structure, (ii) is not subject to re-financing risk (excludes CMBS), (iii) has a par value more than a given threshold, and (iv) has been originated by an institution that is not following an originate to distribute business model.
Our interest in this study is to see if an HQS category might merit favourable regulatory treatment, i.e., if it conveys important information over and above indicators that are already reflected in regulatory rules. Since these rules frequently include ratings, we think it more interesting to check if the HQS definition adds information over and above that contained in ratings. For this reason, when we perform comparisons, we condition in a strict fashion on ratings, examining whether tranches identified with HQS characteristics have lower risk or higher liquidity holding ratings constant. For the analysis of risk (as measured by volatility), we focus on AAA-rated tranches alone. Our dataset of tranches for which we have bid-ask spread data is somewhat smaller, so in examining liquidity (as measured by bid-ask spreads), we condition on ratings being either AAA or AA.
To place the PCS HQS criteria in context, in Section 2 below, we compare them with alternative definitions of securitisation quality. These definitions include the collateral requirements employed by central banks. In particular, we describe the criteria employed by the Bank of England, Eurosystem and the Federal Reserve System. Also relevant are the criteria used by financial regulators, such as those recently adopted by EIOPA in its proposed Solvency II capital rules for European insurers. Finally, one might consider the approach taken by the European Banking Authority (EBA) in its recommendations on the eligibility of securities for the Basel III Liquidity Coverage Ratio (LCR).
This paper is organised as follows. Section 2 discuses HQS categorisations employed or proposed in other contexts by central banks and regulators. Section 3 describes the data and methodologies we employ. Sections 4 and 5 present results on risk and liquidity, respectively. Section 6 contains a comparison with another asset class, Covered Bonds, that has received very favourable regulatory treatment in Europe. The last section concludes. Finally, the Appendix contains additional information on PCS and central bank collateral eligibility criteria.
Section 2 – high quality securitisation definitions
In this section, we discuss the PCS definition of HQS and compare it with some relevant alternatives. These alternatives include the criteria used by central banks in their rules on discount window lending and other monetary operations requiring collateral. Among these, we focus on the collateral eligibility rules employed by the Eurosystem (ECB), the Bank of England and the US Federal Reserve Bank System (FRB). We also compare the PCS HQS definition with the criteria used by the European financial regulator, EIOPA, in its proposals for insurance capital regulations.
Before turning to the detailed PCS criteria, it is important to understand the four key pillars that PCS regards as the crucial, high level components of their label. These four pillars are:
1. Securitisations must not be issued under an originate-to-distribute business model.
2. Securitisations must not involve creating highly rated securitisation tranches out of pools containing lower rated, already credit-tranched securitisations.
3. Securitisations must not attempt to effect maturity transformation.
4. Securitisations should be transparent.
The motivation for Pillar 1 is that when financial institutions base their business models on originating loans which are then “sold” through securitisations, this dilutes their incentives to maintain high underwriting criteria at origination and to service and manage the loans prudently thereafter. Pillar 2 excludes re-securitisations the pricing and risk management of which have proved to be difficult.
On Pillar 3, while the large majority of securitisations are match funded (or, as is sometimes expressed, contain “self-liquidating” assets), some are subject to refinancing risk in that the securitisation can only pay back if one or more loans can be refinanced in the market within short windows of time (such as the period around the final maturity of the securitisation tranches). When market liquidity evaporates, maturity transforming securitisations typically face defaults.
Such problems do not just arise in the well-known case of Structured Investment Vehicles (SIVs) where short-dated liabilities were used prior to 2007 to finance long-dated, illiquid investments. They are also relevant for some Commercial Mortgage Backed Securities (CMBS). For such transactions, repayment of the underlying mortgages at the maturity date of the securitisation commonly requires refinancing of these mortgages. If the maturity date occurs during a period of credit or liquidity scarcity, the refinancing risk may be serious, generating default in securitisation tranches.
PCS aims to enforce the above four pillars through its criteria although the detailed criteria also implement other requirements. The detailed PCS requirements are complex (see PCS (2014b)), comprising 34 pages of conditions that tranches must meet to obtain an HQS label. If harmonised with existing or proposed regulatory or central bank criteria, PCS criteria could potentially be used as a proxy for regulation, enforcing criteria that are or could be no weaker than official requirements.
In what follows, we will not attempt to list the detailed PCS criteria but instead will pick out and discuss some of the more important individual requirements. When we turn to our empirical evaluation, we will focus mainly on high level pillars although we will also apply some of the detailed criteria as well in our choice of HQS tranches.
PCS categorises its criteria as follows:
1. Common Eligibility Criteria a. Alignment of Interests Standards b. No Iterative Credit Tranching c. No Embedded Maturity Transformation d. Transparency Standards e. Additional Transaction Quality Standards f. Liquidity Standards g. True Sale Standards h. General Underlying Asset Standards i. General Representations, Warranties and Undertakings
2. Asset Specific Eligibility Criteria
3. Jurisdiction Specific Eligibility Criteria
Below, we discuss key requirements in the categories shown above. For more detail on the criteria, see Table A1 in the Appendix.
The “Alignment of Interests Standards” require that the originator retain an economic interest in the securitisation. The economic interest criterion is satisfied, for example, if a transaction meets current European retention requirements.[5] These require originators to retain 5% of the deal. The 5% may take various forms including a vertical slice of the tranches sold to investors, an originator’s interest (for revolving pools) or a first loss piece.
The “No Iterative Credit Tranching” excludes re-securitisations. Re-securitisations should clearly be omitted from HQS as the experience of the crisis shows the difficulty of analysing their credit quality.
The “No Embedded Maturity Transformation” is aimed at excluding refinancing risk in securitisations where the Securities are designed to be repaid by the refinancing or sale of the assets used as security for the underlying debt obligations.
The “Transparency Standards” place numerous requirements on originators and issuers to disclose through the prospectus and subsequent announcements information about the structure of the securitisation and the performance of the assets.
“Additional Transaction Quality Standards” include requirements that the securitisation tranche in question be (i) the most senior in the structure, (ii) rated at the prospectus publication date by at least two credit rating agencies, (iii) the assets have been subject to third party credit quality review prior to the issue date and (iv) transaction documents contain provisions designed to ensure continuity in the event of default or insolvency in the servicer, derivative counter- party or bank account provider.
“Liquidity Standards” require that the principal amount of the tranche in question is no less than 100mn GBP or USD when denominated in those currencies or 100mn Euros when denominated in any other eligible currency. Information must be provided in initial investor reports on the amounts sold to investors who are not part of the originator group. The securities must be listed on regulated market in an eligible jurisdiction.
The “True Sale Standards” rule out synthetic securitisations and ensure that the originator is free to and has transferred its interest. Additionally, “True Sale Standards” ensure that the originator is located for solvency purposes in a jurisdiction that does not have severe clawback provisions.
“General Underlying Asset Standards” require that underlying pool assets are from a single eligible asset class. These classes are defined as: (a) Auto Dealer Floorplan Loans; (b) Auto-Loans and Auto Leases; (c) Consumer Loans; (d) Credit Card Receivables; (e) Non-Auto Leases; (f) Residential Mortgage Loans; (g) SME Loans. The choice of asset classes (which most notably omits securitisations with large corporate loan and commercial mortgage pools) has some overlap with the restriction on embedded maturity transformation risk. The “General Underlying Asset Standards” also require (i) that brokers were not involved in underwriting decisions, (ii) that loans were issued under the laws of an eligible jurisdiction, (iii) that loans were originated using the originator’s usual underwriting procedures, and (iv) that the pool obligors, on a specified date, were neither in breach of their loan agreements nor substantially in arrears.
In addition to the above criteria, there are additional requirements for specific asset classes and for individual jurisdictions (Germany and the Netherlands). For Dutch and UK RMBS, these, in some cases because of differences in market structure and behaviour, replace requirements for which these two asset classes receive carve-outs in the general requirements
Table 1 summarises collateral eligibility conditions for securitisation tranches at three central banks: the Eurosystem, the Bank of England and the FRB. The central banks’ requirements cover ratings, seniority, asset quality and transparency. (Additional information on the requirements of these central banks is provided in the Appendix.)
They also place some restrictions on particular underlying asset classes (for example, the Bank of England does not permit the use of leveraged loans and requires diversification in the pool) but are, overall, much less prescriptive in asset classes than PCS. Most notably, they do not seek to exclude asset classes that are subject to embedded maturity transformation. On the other hand, the central banks, like PCS, exclude synthetic deals and re-securitisations.
The PCS criteria for “Originate-to-distribute” focuses on Article 405 of the CRR which brings it into line with the effective central bank criteria on this issue. The central banks also do not restrict aspects of the underwriting process nor restrict the size of the issue.
The ECB has some rather specific requirements that one might note including ruling out deals from jurisdictions with clawback provisions, rejecting deals with heterogeneous pools and that the security be traded on a regulated market (see Table A2 in the Appendix). These were not included in the original PCS criteria (see PCS (2013a)) but have been introduced in the revised requirements (see PCS (2013b)).
1. Seniority After the delivery of an enforcement notice and where applicable an acceleration notice the tranche is not subordinated to other tranches in respect of receiving principal and interest payment.
2. True legal sale The cash flow generating assets backing the securitisation shall be acquired by the securitisation special purpose vehicle in a manner which is enforceable against any third party, and is beyond the reach of the seller and its creditors including in the event of the seller’s insolvency.
3. No severe There are no severe clawback provisions in the jurisdiction of the seller. This includes but is not limited to rules under which the sale of cash flow clawback generating assets backing the asset backed securities can be invalidated by the liquidator solely on the basis that it was concluded within a certain period (“suspect period”) before the declaration of insolvency of the seller or where the transferee can prevent such invalidation only if it can prove that it was not aware of the insolvency of the seller at the time of sale.
4. Servicing There shall be provisions to ensure that a default by the servicer does not lead to a termination of servicing. In addition, there shall be provisions for continuity the replacement of derivatives counterparties and liquidity providers. The cash flow generating assets backing the securitisation shall belong to
| Securitisations | ||||||||
|---|---|---|---|---|---|---|---|---|
| eligible as | Transparency | |||||||
| Credit | Standards | Asset and | Other Requirements | |||||
| collateral | Requirements | |||||||
| denoted: | ||||||||
| Marketable | Tranches must | not be | Acquisition of assets | governed by law | of EU | Loan-level data | ||
| Assets | subordinated to | other | member state and must | be acquired | in a 'True | on the pool of | ||
| Standard | Framework | Eligible for | tranches of the | same | Sale'. Must not consist | of tranches of | other | cash flow |
| use as | issue. Best and | second | securitisations, | credit-linked notes, | derivatives | generating | ||
| collateral in | best ECAI score | must | instruments or synthetic | securities. | No severe | assets required. | ||
| Eurosystem | be at least A- at | clawback provisions. | There must be | no | ECAI must | |||
| Eurosystem | Collateral | Credit | issuance and | over | subordination in the | cases of both | enforcement | submit regular |
| Operations1 | lifetime of | transaction. | and acceleration. | Cash-flow generating | assets | ratings and | ||
| Alternatively, | 2nd-best | must be homogenous. | There must be | only one | surveillance | |||
| rating of BBB | asset type and | heterogeneous asset | pools are | reports. | ||||
| permissible | given | not allowed. | ||||||
| conditions.2 certain | ||||||||
| Level A | No Securitisations | |||||||
| N/A | N/A | N/A | ||||||
| Collateral | qualify as Level | A | ||||||
| England | Level B | Broadly equivalent | to | Assets Securitisations’ | underlying | assets | ||
| Must release: | ||||||||
| Collateral | AAA. Most | senior | must be must be | cash: no synthetic | or re- | |||
| of | (previously | tranches only. | prime and securitisations. | Securities | for | Loan level | ||
| denoted | listed. which | credit quality | depends on a | information, | ||||
| Bank | transaction | |||||||
| 'Wider | guarantee | or insurance | provided | |||||
| collateral')3. | by a third | party (“a wrap”) | are not | documentation, | ||||
| transaction | ||||||||
| eligible. | Securities must | be | ||||||
| Level C | Broadly equivalent | to | Unlisted | overviews, | ||||
| capable | of being delivered | to the | ||||||
| Collateral | A3/A- or better. | securities | standardised | |||||
| bank via | delivery | mechanisms. | ||||||
| Most senior | eligible at | monthly | ||||||
| Certain | asset-types have | |||||||
| tranches/paper | only. | bank's | investor reports, | |||||
| additional | requirements | (e.g. pool | ||||||
| discretion. | and cash-flow | |||||||
| must be | diversified, no | leveraged | ||||||
| models. | ||||||||
| loans | permitted). | |||||||
| Discount | All at least | investment | Pledging institution | must have rights | in | |||
| Reserve | Window | grade. Certain | types of | securities to grant an | enforceable | security | ||
| Eligible | securitisations | must be | interest to the FRB. | Pledging process | is DTC | |||
| Collateral4. | AAA (see asset | (although Agency-Backed | Mortgages | use FSS | ||||
| requirements.) | though DTC can be | used on a limited | basis). | |||||
| Federal | CDOs, CMBS and | Private Label | CMOs must | |||||
| be AAA rated. Agency | Backed | Mortgages | ||||||
| (Pass Throughs and | CMOs) and Private | Label | ||||||
| CMOs exclude IO, | PO, Z, inverse | floater, and | ||||||
| residual tranches. |
Notes: Sources - Bank of England Collateral Framework Sources: Bank of England (2010, 2013a, 2013b, and 2013c); Eurosystem Standard Collateral Framework Sources: European Central Bank, (2011, 2012, 2013a, 2013b, 2014); and Federal Reserve Discount Window Sources: Federal Reserve (2014a). Additional requirements for central bank collateral frameworks are given in Table A2. 1. The Eurosystem also permits non-marketable assets eligible as collateral - namely retail mortgage-backed debt instruments and credit claims. Marketable assets can be used for all monetary policy operations. Non-marketable assets can only be used for reverse open market transactions and the marginal lending facility and intraday credit - not outright transactions. 2. Securitisations with a second-best rating of BBB are permissible provided all underlying asset belong to the same asset class and that that asset class comprises one of residential mortgages, loans to SMEs, commercial mortgages, Auto- Loans, leasing, consumer finance, or credit card receivables. Additionally, the securitisation must not include non- performing loans at time of issuance or which are non-performing when incorporated in the securitisation during the life of the securitisation, or which are structured syndicated or leveraged at any time; counterparty submitting an securitisation cannot act as interest rate swap provider in relation to the securitisation; transaction documents must contain servicing continuity provisions; all other requirements and procedures applicable to securitisations must be fulfilled. These securitisations are subject to a 22% haircut. securitisations issued in GBP, JPY, or USD are eligible if issued and held by a Euro Area issuer established in the EEA. 3. For more information on Bank of England collateral framework eligible securitisations, see Tables A4 and A5.For more information on Federal Reserve discount window eligible securitisations please see Table A3 in the Appendix.
5. Eligible
underlying one of the following asset classes: (i) residential mortgages; (ii) loans to small and medium sized enterprises (SME); (iii) Auto-Loans; (iv) leasing; assets
(v) consumer finance and (vi) credit card receivables. The cash flow generating assets backing the securitisation consist of only
6. Homogeneous
cash flows one type of assets as set out in [the eligible underlying asset criterion].
7. Type of The cash flow generating assets backing the securitisation shall not consist, underlying in whole or in part, actually or potentially, of credit-linked notes, swaps, other derivatives instruments or synthetic securities. This restriction does assets not include derivatives used strictly for hedging foreign exchange and interest rate risks.
8. Rating The securitisations shall have a credit assessment of at least credit quality requirements step 3 at issuance and at any time subsequently.
9. No credit The securitization shall not contain loans that were granted to credit impaired obligors. impairment
10. No The cash flow generating assets backing a securitisation shall not contain nonperforming loans which are in default as defined in point 44 of Annex VII to Directive loans 2006/48/EC at the time of issuance of the securitisation or when incorporated at any time after issuance.
11. At least one The securitisation, except for securitisations backed by credit card receivables, shall be backed by loans for which at least one payment has payment been made.
12. Listing The securitisation shall be admitted to trading on a regulated market in the requirement countries which are members of the EEA or the OECD.
13. Transparency, Loan by loan reporting: Comprehensive loan-level data in compliance with standards generally accepted by market participants is made available to reporting and disclosure existing and potential investors and regulators at issuance and on a regular basis. Standards issued by central banks shall be considered as generally accepted. General reporting: Relevant information on the transaction in accordance with standards generally accepted by market participants is made available to existing and potential investors and regulators at issuance and on a regular basis.
14. No self In the case of residential mortgage-backed securitisation, the securitisation shall not contain residential mortgages that were marketed and underwritten certification on the premise that the loan applicants and, where applicable, their intermediaries were made aware that any information provided might not be verified. For residential mortgages, the assessment of the creditworthiness shall meet
15. Process for
assessing credit the requirements as set out in [Art. 14 Par. 1 and Par. 2 (a) Mortgage Credit worthiness Directive] or equivalent requirements as set out in non-EEA jurisdictions. For consumer finance loans, the assessment of the creditworthiness shall meet the requirements as set out in [Art. 8 Par. 1 Consumer Credit Directive] or equivalent requirements as set out in non-EEA jurisdictions. Source: EIOPA (2013b)
Table 2 shows the requirements adopted by EIOPA in its draft proposals for a HQS definition to be used in Solvency II insurer capital rules (see EIOPA (2013)). That document provides a proposal for a high quality Type A securitisation definition, with other more risky securitisations being labelled Type B or “Other”. As EIOPA explicitly state: “A number of the criteria are adaptations from the eligibility criteria for securitisations that the ECB uses in its refinancing operations.”[6]
One may compare the EIOPA Type A securitisation criteria to the PCS HQS definition. Seniority and true legal sale requirements are similar. EIOPA adopts some of the rather specific criteria of the ECB including “no severe clawback”, servicing continuity, homogeneous cash flow and listing requirements. As already noted, these have been adopted in the June 2014 PCS rulebook.
Like PCS and unlike the central banks, EIOPA is prescriptive on asset classes, restricting acceptable securitisations to retail and SME-loan backed issues. Large corporate loan-backed transactions and CMBS are, therefore, excluded. Re-securitisations and synthetic deals are excluded by EIOPA as they are by PCS and the central banks.
EIOPA’s rating requirement is that tranches must be at least investment grade whereas PCS’ rating requirement is that there must be at least two rating agencies. PCS’ criteria is therefore not a credit assessment criteria but a due diliogence criteria. EIOPA’s no credit impairment, no non-performing loans, at least one payment, transparency and no self-certification requirements as well as the process for assessing creditworthiness are comparable to those of PCS.
Section 3 – data, classification and methodology
Data
In this section, we set out the approach we take in assessing the riskiness and liquidity of HQS and non-HQS categories. We first describe the data we use, second, explain the HQS categorisation we employ (which depends on the data available to us), and, third, we provide information on techniques employed.
Our focus in this paper is on the risk and liquidity performance of different sub-sectors of the European securitisation market. In this, we use two datasets.
The first, somewhat smaller dataset was provided to us by S&P. It includes daily bid and ask quotes and characteristic information for a large number of securitisations. The sample period runs from the 26th May 2009 to the 30th September 2013. In this paper, we employ observations for securitisation tranches rated ECAI1 (i.e., with ratings ranging from AAA to AA-). In an earlier paper, (see Perraudin (2014)), I compared the liquidity of securitisations and covered bonds, focussing on a subset of this S&P dataset, namely those observations with AAA ratings. The total number of ECAI1rated bid-ask spread observations available in the data is 1,797,646, of which 1,006,512 are RMBS observations.
Aspects of the distribution over time of the S&P securitisation tranche data are illustrated in Figure 1. We focus on ECAI1-rated tranches since the ECAI1 category is used in a variety of regulatory contexts (for example, in Basel eligibility definition of the Liquidity Coverage Ratio). Most of the observations in our sample consist of RMBS. In the middle part of the sample period, there was a marked decline in the number of observations, mostly reflecting downgrades and, in some cases, subsequent upgrades in ratings, and, to some extent, changes in the coverage of the S&P dataset. The breakdown of the non-RMBS data by asset class is shown in the right hand panel of the figure. As one may observe, there are considerable changes in the numbers of some asset classes within the sample, particularly CLOs and CMBS.
The S&P dataset just described has the advantage of containing bid and ask prices (which are generally very hard to come by for European securitisations). It covers a relatively short time span, however, and is concentrated on RMBS with some information about Auto-Loan ABS. There are very few data points for some other important asset classes such as Credit Card and Other Retail ABS.
For these reasons, we created a second, larger dataset for the analysis of price volatility performance, the second broad issue in which we are interested. This second data set is constructed both by extending the first dataset backwards in time and by adding data on additional securitisations from Bloomberg and Reuters.
The S&P ISINs from the first dataset are used to search for the same securities in the Eikon database, which extends further back than the S&P dataset: to 2005 instead of only to 2009. We add additional ISINs to our dataset by searching for all structured finance transactions on Bloomberg, filtering out all non-European transactions and only considering data after the start of 2005. We then apply a further filter to remove certain other asset types.[7]
Given the ISIN’s, we search for the relevant data fields using information from both Bloomberg and Reuters (the Eikon database). Where information differs across the two systems, we take the values supplied by Reuters. Finally, we combine the data downloaded from Bloomberg and Eikon with the original S&P data employed in the liquidity calculations. Aspects of the distribution of the second dataset over time are illustrated by Figure 2, below.
Finally, in Section 6, below, we employ data on European Covered Bonds to make a direct comparison of the risk and liquidity performance of HQS securitisations. The Covered Bond data we use is the same as that used in Perraudin (2014), a study of the relative liquidity of Covered Bonds and European securitisation tranches. That study did not attempt to identify and employ in the comparisons a narrower HQS subset of the universe of European securitisations and in that sense the comparison in this paper is an extension of the previous paper.
A description of the Covered Bond data is provided in Perraudin (2014). The securities we study are components of the Bank of America Merrill Lynch Euro Covered Bond Index (ECV0), in particular Euro-denominated investment grade covered bonds publicly traded in the Eurobond or Euro member domestic markets. We filter the bonds, requiring that there be at least one year remaining term to final maturity, a fixed coupon schedule, and a minimum amount outstanding of EUR 250 million. We obtain daily bid and ask quotes from Bloomberg covering the period 1st January 2005 to the 30th of September 2013.[8] Figure 3 provides the distribution of the data over time by sub-category of Covered Bond and by jurisdiction.
Classification
Given our two datasets, we classify the securities as either HQS or not. In so doing, we aim to use high level PCS-style criteria. The criteria we employ, described below, correspond to a broad, highlevel version of the much more detailed PCS label requirements.
Note that individual tranches in our dataset, that we designate HQS, may or may not have been labelled by PCS. This is because (i) our data extends back in time before the launch of the PCS label,
(ii) the issuer might have not requested PCS certification or (iii) an issue might be ineligible for PCS HQS status because it falls down on one of the more fine-grained criteria employed by PCS.
Most senior tranche Used code for seniority to select most senior. Bloomberg
Eligible currency Currency in which the security was issued is one Reuters and of the PCS eligible currencies. Bloomberg
The initial principal amount Original Issue Amount (>100 million in eligible Reuters and currency) Bloomberg
To categorise tranches as HQS or non-HQS, we follow a 2-stage process. First, we generated a list of securities satisfying ‘hard’ filters specified in the PCS rule-book that were directly observable to us based on the data sources available (characteristics from the S&P dataset or readable from Reuters or Bloomberg). The filters in question are presented in Table 3.
In addition to the above “hard” criteria, we enforce versions of the high level PCS principles discussed in Section 2 above. Recall that these consist of:
1. Excluding originate-to-distribute deals.
2. Excluding re-securitisations.
3. Ruling out maturity transformation.
4. Requiring transparency.
As Stage 2 of our filtering exercise, to apply the above judgmental criteria, we proceed as follows. By ruling out CMBS and only permitting the asset classes listed in Table 3, we effectively exclude maturity transformation. Similarly, our asset classes do not include re-securitisations. We do not attempt, for the moment, to reflect in our analysis the transparency criterion. (Obtaining data on the transparency of individual deals several years ago would be extremely difficult.) This leaves us with the originate-to-distribute criterion. For this, we assigned any security to the non-HQS category if, based on guidance from PCS staff, it was issued on an originate-to-distribute basis.
Methodology
Our objective is to present evidence on the liquidity and risk of HQS and non-HQS (as defined in the last section) for different segments of the structured product market. As a measure of liquidity, we employ the average bid-ask spread at different points in time and averaged over the sample period. The bid-ask spreads we use have been collected by Standard & Poor’s as part of their calibration of their securitisation valuation services using feeds from several banks.
As a measure of risk, we employ the average (over the securitisations in our sample) of the volatilities or standard deviations of changes in the log prices of individual securitisation tranches. Clearly, the price data we employ is not that of super liquid securities trading many times a day such as high quality government bonds or the equity prices of large corporations. Hence, volatility measures will be polluted by transitory market microstructure effects. It may also be the case that the price series will contain many missing observations. For these reasons, we think it inappropriate to focus on daily price volatilities and prefer instead to look at longer holding periods, in particular ten days. (This is the holding period that internationally active regulated banks are required to use under the Basel rules for their trading book risk.)
To estimate the log price volatility for individual tranches, we employ the square root of an overlapping observation estimator of the variance of log price changes. Below, we explain this overlapping observation estimator.
Suppose one is interested in the volatility of log securities prices over periods like a week or a month. A common procedure, if high frequency data (for example daily data) is available, is to calculate the standard deviation for daily log price changes and then to multiply by the square root of the number of days in the time period of interest. This approach is efficient (in that it uses all the information in the data) and is correct if the price data is generated by a Geometric Brownian motion. However, market microstructure distortions and high frequency dynamics in the data are often such that log price change volatility over longer time periods is not a simple scaling of the high frequency volatility.
One may estimate long holding period volatilities by using non-overlapping observations for the longer time periods, but this clearly involves discarding much of the information in the sample. Alternatively, one might try to use daily observations with overlapping periods. (So, the log price changes included in the volatility estimator correspond to periods: t to t+k, t+1 to t+k+1, t+2 to t+k+2 etc.) This approach does, apparently, use all the information in the sample but unfortunately the resulting estimator is biased.
Kiesel, Perraudin and Taylor (2001) developed an approach to dealing with this problem which consists of employing an overlapping observation estimator but then removing the bias by subtracting a theoretically derived bias adjustment. The technique uses the bias adjustment employed by Cochrane (1988) in a different context.
We describe the adjustment more formally in the next few paragraphs. We suppose that security prices are generated as the sum of a random walk and of a stationary component. Given daily data on securities’ prices, the basic over-lapping observation estimator of the k-period volatility of the log price, , is given by:
(1)
Here, is the length of the sample period. As mentioned above, this estimator is biased in small samples. To correct for this problem, consider the case in which the log price is a pure unit root process in that:
(2)
Where are independently and identically distributed with zero mean and volatility . This enables us to write the numerator of the estimator above, , as:
(3)
(4)
(5)
Then, by defining and using the fact that the are i.i.d., uncorrelated and of zero mean, we get:
(6)
(7)
and so, to obtain an unbiased estimator of , we multiply it by:
(8)
, where: Hence, the Cochrane-estimator of the volatility over k-periods is therefore given by
(9)
In the current context, as our holding period is ten days, . To estimate a volatility corresponding to a particular time period, , we use a window of 125 observations stretching up to . Hence, in the above notation,
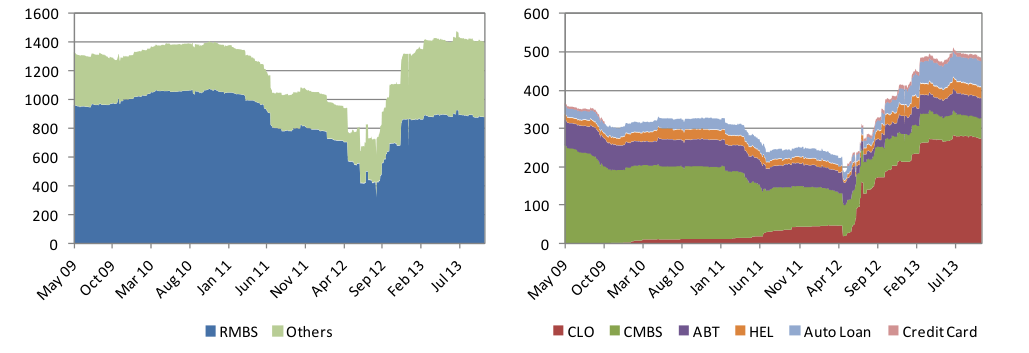
Notes: The two graphs present the evolution of the S&P Data over time. In the left hand graph, Securitisation tranches are grouped by whether they are Residential Mortgage Backed Securities (RMBS) or not. On the right hand graph, all non-RMBS tranches are grouped by the securitisation sub-class to which they belong. The y-axis measures the number of tranche daily bid-ask spread observations. These are plotted against time. The graphs are stacked so that, for instance, in May 2009 there were approximately 1300 tranche observations. Of these, over 900 were RMBS and over 300 were of other types. Of these other types approximately 250 were Collateralised Mortgage Backed Securities (CMBS).
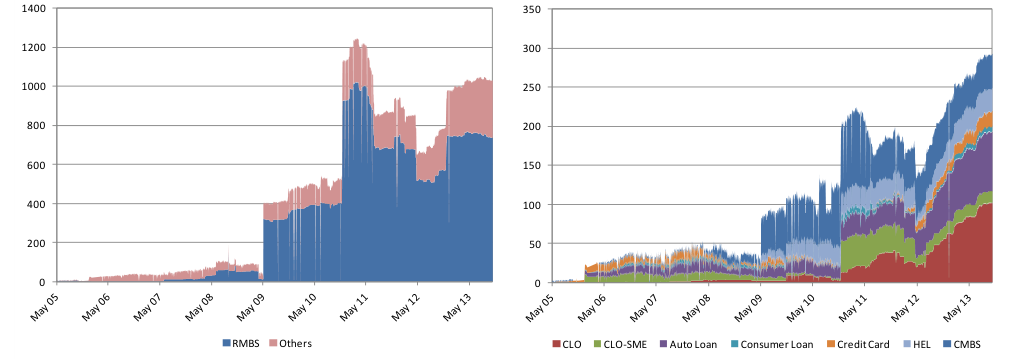
Notes: The two stacked plots in Figure 2 display results for all AAA-rated securities in the second dataset. As for Figure 1, the y-axis displays the number of observations, plotted against time (on the x-axis).
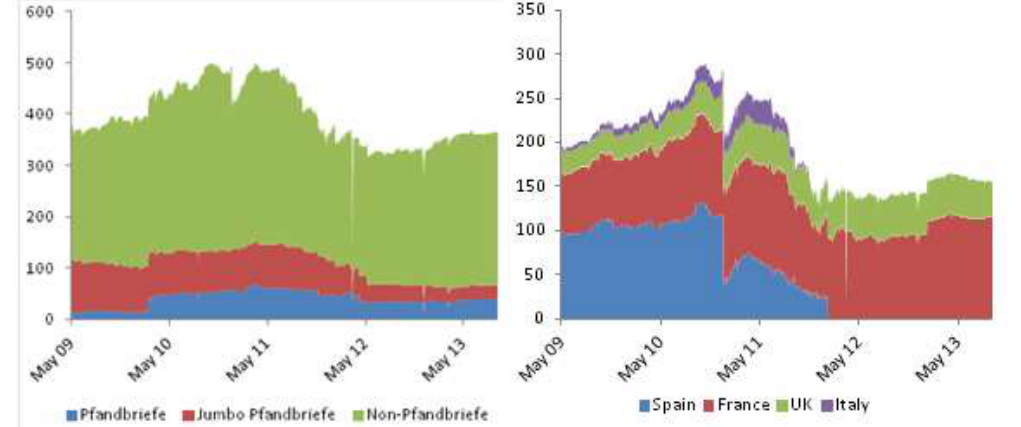
Notes: The two graphs present the evolution of the Covered Bonds sample over time. On the left hand graph, Covered Bonds are grouped by subclass, specifically, whether they are Pfandbriefe, Jumbo Pfandbriefe or Non- Pfandbriefe. On the right hand graph Covered Bonds are grouped by country of issuance. The y-axis measures the number of daily Covered Bond, bid-ask spread observations, which are plotted against time on the x-axis. As is true for both the above figures, both graphs are stacked.
| PCS rule-book | criteria | Filter employed | Source |
|---|---|---|---|
| Permitted asset | classes | ||
| (a) Auto Dealer | Floorplan Loans; | Data License Asset Classes from Reuters are used | Reuters and |
| (b) Auto-Loans | and Auto Leases; | for the S&P data. Asset Classes from Bloomberg | Bloomberg |
| (c) Consumer | Loans; | are used for the extension data. | |
| (d) Credit Card | Receivables; | ||
| (e) Non-Auto | Leases; | ||
| (f) Residential | Mortgage Loans; | ||
| (g) SME Loans. |
Section 4 – volatility results
Here, we present the volatility estimates of log price changes (i.e., returns) over ten day holding periods. Figure 4 shows rolling-window estimates of average volatilities for different dates in our sample period for all the asset classes we consider. The averages are across the volatilities of individual securitisation tranches.
Note that the results shown here for any given date are for securities rated AAA on date . (This means that, logically, a security could conceivably have been rated AA earlier in the window of 125 time periods stretching up to date and then have experienced an upgrade. Although we do not expect that this occurs often in our dataset.)
The reason why we focus in our comparisons on similarly rated tranches is that we wish to show that even when ratings are all the same, the HQS categorisation contains a lot of information about the riskiness of the securities involved. The key finding here is that, when we look at all assets and all countries, the spike of average volatility associated with the crisis evident in the non-HQS results is largely truncated in the HQS time plot. This suggests that the HQS category was distinctly more robust in its risk performance through the crisis period than the non-HQS category.
When we consider the individual country results, we see that that the average HQS volatility is most strikingly lower than the non-HQS average volatility for the non-periphery countries (Germany, Netherlands, Australia, France, Luxembourg, Belgium, Norway, Switzerland, Sweden, Austria) and the UK. In the case of periphery countries (Spain, Portugal, Italy and Ireland), the gap between HQS and non-HQS is less striking although in most time periods we see HQS volatilities as somewhat lower.
From Figure 4, there are some brief periods when, for periphery countries, HQS volatility exceeds that on non-HQS securities. We looked into the source of this finding in detail. First, the result turns out to be solely driven by Spanish RMBS. For Italian, Portuguese, Irish and Italian securities, the ranking of volatilities is intuitive with lower volatility for HQS. Upon detailed inspection, we found that for Spanish RMBS, all the HQS securities were originated by the Spanish savings banks or cajas that have been at the centre of the financial crisis. On the other hand, the non-HQS were originated by a broader set of banks many of which were less severely affected by the crisis.
Hence, we interpret the smaller gap between HQS and non-HQS volatilities for periphery countries in the earlier period of the crisis as reflecting Spanish-bank-specific selectivity effects. In this sense, it is uninformative about the ceteris paribus impact of the characteristics used in our definition of HQS. One should note that after the start of 2012, when a clear “Draghi effect”[9] appears in the periphery mean volatility time series, again a large gap opens up, with the HQS securitisations recovering sharply while the non-HQS volatilities come down only slowly.
Figure 5 shows results for RMBS tranches. As we showed in the data section above, RMBS represent most of the data in our sample so, unsurprisingly, the RMBS results echo in qualitative terms those for the sample as a whole. Again, the Spanish-bank selectivity effect is evident in the periphery country results and the comments above remain relevant that the higher volatility for periphery country HQS RMBS is uninformative about the ceteris paribus impact of the HQS definition characteristics. The effect of these characteristics may more dependably be judged from the non-periphery plot.
Figure 5: Volatility Time Series for All RMBS
All Countries - RMBS % Non-periphery - RMBS %
25 15
0 0
HQS Non-HQS HQS Non-HQS
Periphery - RMBS % UK - RMBS %
25 50
20 40
15 30
10 20
5 10
HQS Non-HQS HQS Non-HQS
Notes: The volatility results displayed in this figure are calculated in the same way as in Figure 4, above. However, the results given here are for RMBS only.
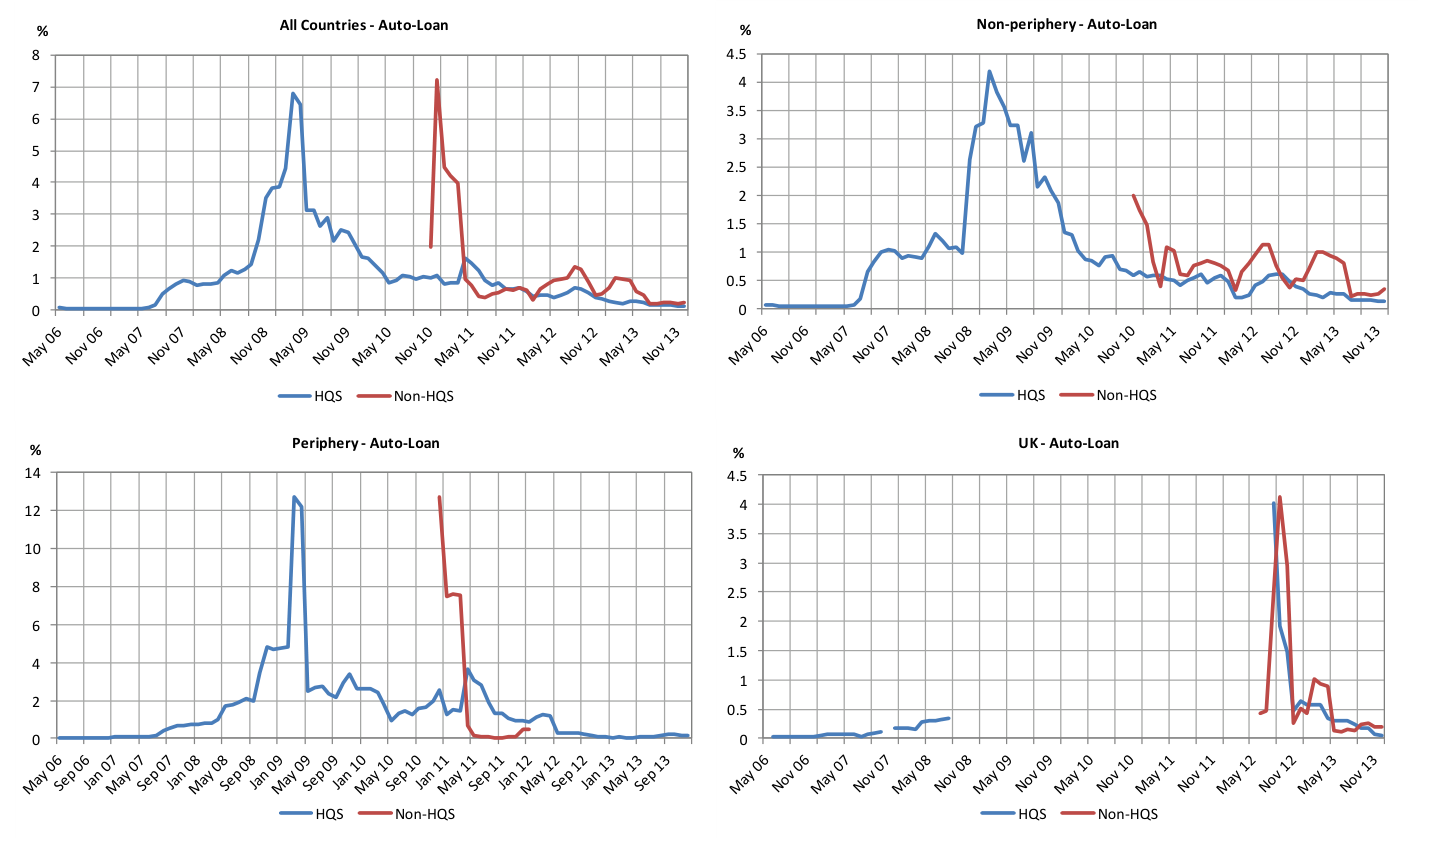
Figure 6 shows results for Auto-Loan ABS. In general, the volatilities are much lower than for RMBS and the All Asset results (when one compares the results for a particular country or for the group of all countries). We do not possess data on non-HQS Auto-Loan ABS before late 2010. After that date, the same qualitative results are evident in that HQS volatilities are lower than their non-HQS equivalents.
Table 4 summarises our volatility findings by presenting sample period averages of the mean volatilities shown in the figures. In the table we also show sample period averages of mean volatilities for asset classes other than RMBS and Auto-Loan ABS, namely Collateralised Loan Obligations (CLOs), CLOs of SME loans, Consumer Loan ABS, Credit Card ABS and Home Equity Loans (HEL) ABS.
The table also shows mean tranche prices (revealing the average level of discount (or premium) compared to a par of 100), the average price standard deviation (which shows how much, averaging over the sample period, the prices of individual tranches varied in the cross-section), and the average (over the sample period) sample size.
As one might expect, there is a strong positive relation between the average volatilities and the degree to which the mean tranche prices are less than the par value of 100. The standard deviation of prices show is also positively related to this discount.
On an average day in our sample, we had volatility estimates for 150 HQS securities and 370 non- HQS. The average volatility across all asset types and all time periods was 2.32% for HQS and 6.64% for non-HQS. A similar doubling of volatility between HQS and non-HQS is evident for RMBS in that average HQS and non-HQS volatilities for the sample period as a whole are 3.59% and 7.42%, respectively.
For the reasons discussed above, the RMBS result is reversed for periphery countries because of a Spanish bank selectivity effect, in that the Spanish HQS happen to be overwhelmingly issued by distressed cajas whereas the non-Spanish RMBS are issued by a broader and more financial stable set of banks.
Table 4 reinforces the conclusion that HQS securities are significantly lower in risk. As well as the periphery country RMBS, there are a few (four) cases in which, against intuition, HQS volatilities are higher, most notably in the cases of UK credit cards and non-periphery and UK CLO-SME. Upon inspection, we found that these results reflected the fact that, in these cases, the non-HQS data was available for the post crisis period while the HQS data was primarily available for the crisis period. Hence, these results reflect sample period selectivity rather than a dependable conclusion about the relative size of HQS and non-HQS volatilities. As one may observe from Table 4, the cases in which HQS volatility is higher than non-HQS correspond to sub-categories for which we have very few observations (except for the case of periphery RMBS which we have already discussed at length).
To investigate the relative contribution of the different HQS criteria, we performed a series of calculations, in which we successively dropped individual requirements in the HQS definition. The criteria we investigated in this way were the “Not Originate to Distribute”, “Senior Tranche”, “Not CMBS” and “Principal amount greater than 100 million”. The results of these calculations are shown in Table 5.
In inspecting Table 5, one may focus first on the relative size of the average volatilities under (i) the full criteria case and (ii) cases in which we have dropped a single criterion. For example, when we drop the “Most senior tranche” requirement, the average volatility rises from 2.32% to 2.80%. This factor has the largest impact on volatility. Dropping the “Not OTD”, “Not CMBS” and “Principal>100m” boost volatility from 2.32% in the base case to 2.58%, 2.76% and 2.37%, respectively.
In this sense, our results suggest that the order of our HQS criteria when ranked by their contribution to risk is “Senior tranche”, “Not CMBS”, “Not OTD” and “Principal > 100m”. When we drop all the HQS criteria together, the average volatility goes from 2.32% to 4.97%, a more than doubling of volatility. The effects of relaxing criteria are generally intuitive and, in many cases, sizeable in magnitude (with the exception of some of the periphery country RMBS results).
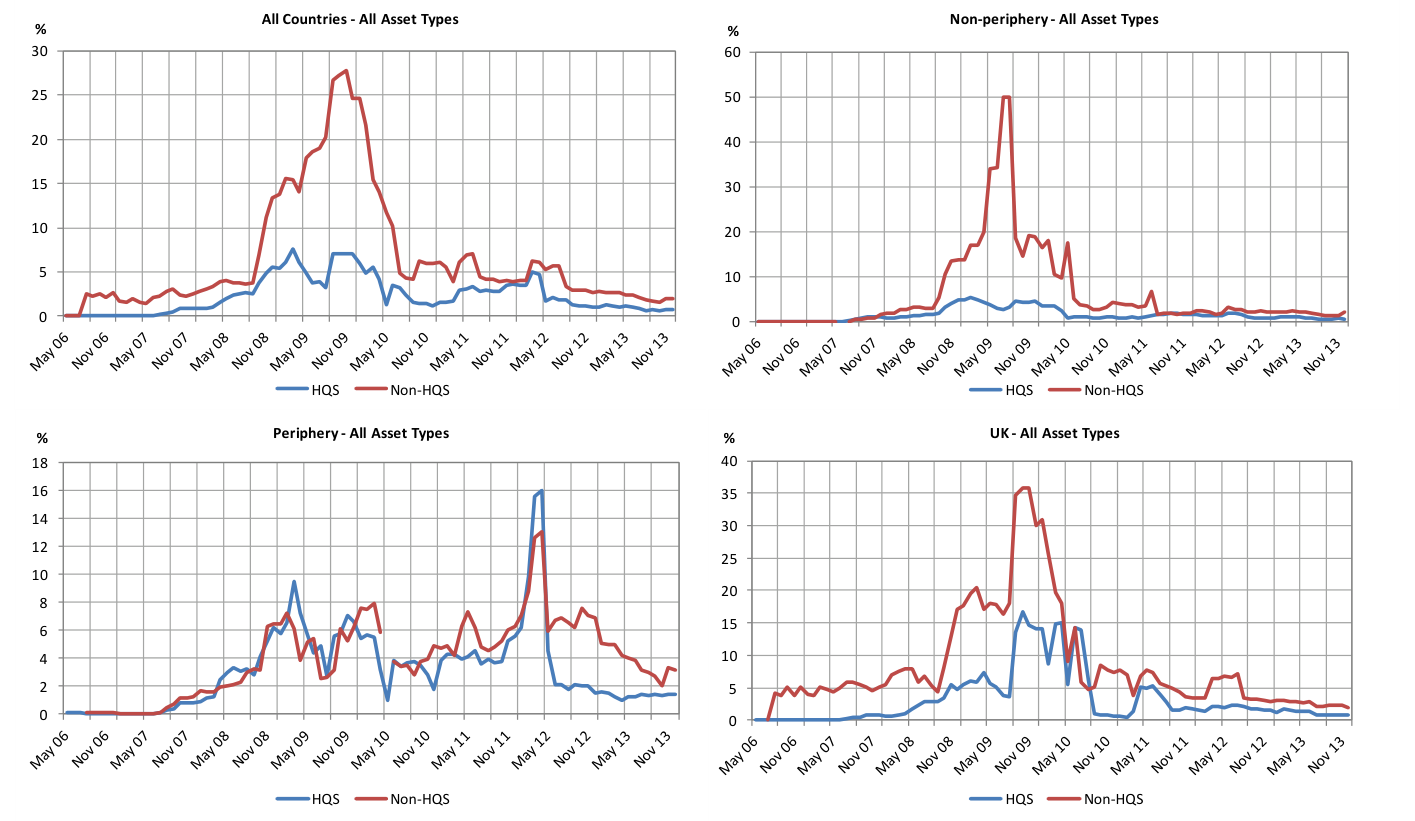
Notes: The figures above display the evolution of volatilities of both High Quality Securitisations and Non-High Quality Securitisations over time for all asset types in four different country-groupings: all countries, non-periphery countries, periphery countries and the UK. Average volatilities are calculated as annual percentages using the methodology described in the previous section. The estimated volatility in each period is measured on the y-axis and this is plotted against time on the x-axis. For instance, in February 2010, the estimated volatility for all HQS asset types in all countries was approximately 5%, compared to a volatility of approximately 15% for non-HQS assets.
Notes: The volatility results displayed in this figure are calculated in the same way as in Figure 4, above. However, the results given here are for RMBS only.
| Avg | Avg | ||||||||||
|---|---|---|---|---|---|---|---|---|---|---|---|
| Mean | Avg | Avg | Sample | Mean | Avg | Avg | Sample | ||||
| Price Price | SD | Volatility | Size | Price Price | SD | Volatility | Size | ||||
| All Asset Types | All | 97.41 | 3.96 | 2.32 | 150.05 | 96.82 | 7.77 | 6.64 | 372.36 | ||
| Non-periphery | 98.32 | 2.16 | 1.54 | 69.86 | 95.63 | 6.61 | 6.17 | 99.40 | |||
| Periphery | 96.19 | 4.42 | 3.14 | 44.18 | 94.61 | 5.66 | 4.10 | 43.09 | |||
| UK | 98.47 | 3.81 | 3.25 | 36.01 | 98.21 | 7.81 | 8.54 | 229.87 | |||
| RMBS | All | 96.79 | 4.33 | 3.59 | 98.91 | 98.05 | 6.51 | 7.42 | 266.70 | ||
| Non-periphery | 97.34 | 2.58 | 2.57 | 47.35 | 95.59 | 6.13 | 4.99 | 65.62 | |||
| Periphery | 94.65 | 4.50 | 5.97 | 26.78 | 93.12 | 5.27 | 4.60 | 17.79 | |||
| UK | 98.76 | 4.00 | 4.36 | 24.78 | 98.39 | 6.39 | 8.92 | 183.28 | |||
| CLO | All | 99.01 | 2.19 | 1.16 | 1.86 | 100.29 | 3.17 | 2.90 | 14.60 | ||
| Non-periphery | 100.01 | 0.00 | 0.62 | 0.14 | 101.33 | 2.71 | 2.46 | 9.29 | |||
| Periphery | 97.51 | 0.00 | 1.65 | 1.01 | 94.21 | 3.81 | 4.63 | 2.68 | |||
| UK | 100.75 | 0.69 | 0.57 | 0.71 | 95.30 | 4.70 | 2.74 | 2.62 | |||
| CLO-SME | All | 94.44 | 4.37 | 2.16 | 5.53 | 95.45 | 4.15 | 3.31 | 8.51 | ||
| Non-periphery | 96.82 | 0.96 | 0.39 | 1.92 | 97.55 | 0.75 | 0.25 | 1.08 | |||
| Periphery | 90.93 | 2.36 | 3.22 | 2.77 | 94.09 | 4.84 | 7.04 | 6.64 | |||
| UK | 99.44 | 0.74 | 0.98 | 0.84 | 97.44 | 2.50 | 0.70 | 0.79 | |||
| Auto Loan | All | 99.07 | 1.12 | 1.09 | 20.52 | 99.58 | 0.54 | 1.15 | 4.45 | ||
| Non-periphery | 99.33 | 0.69 | 0.89 | 15.67 | 99.68 | 0.52 | 0.77 | 2.82 | |||
| Periphery | 98.36 | 1.40 | 1.49 | 3.67 | 98.02 | 0.00 | 2.69 | 0.15 | |||
| UK | 100.09 | 0.09 | 0.36 | 1.17 | 100.15 | 0.22 | 0.84 | 1.48 | |||
| Consumer Loan | All | 97.45 | 1.47 | 1.73 | 2.99 | 84.55 | 6.71 | 23.27 | 0.28 | ||
| Non-periphery | 99.17 | 0.33 | 0.79 | 1.16 | 84.55 | 6.71 | 23.27 | 0.28 | |||
| Periphery | 96.00 | 1.44 | 2.26 | 1.71 | - | - | - | 0.00 | |||
| UK | 101.70 | 0.00 | 0.93 | 0.12 | - | - | - | 0.00 | |||
| Credit Card | All | 98.21 | 1.11 | 2.07 | 5.09 | 99.33 | 0.27 | 1.06 | 1.12 | ||
| Non-periphery | - | - | - | 0.00 | - | - | - | 0.00 | |||
| Periphery | - | - | - | 0.00 | - | - | - | 0.00 | |||
| UK | 98.21 | 1.11 | 2.07 | 5.09 | 99.33 | 0.27 | 1.06 | 1.12 | |||
| HEL | All | 99.42 | 1.74 | 1.06 | 4.16 | 98.49 | 3.47 | 3.03 | 8.99 | ||
| Non-periphery | 96.83 | 1.62 | 0.88 | 1.08 | 97.83 | 1.45 | 2.02 | 2.78 | |||
| Periphery | - | - | - | 0.00 | 84.69 | 0.00 | 7.09 | 0.29 | |||
| UK | 100.27 | 0.45 | 1.27 | 3.09 | 99.31 | 2.16 | 2.88 | 5.91 |
Notes: Table 4 above displays key summary statistics for time series of securitisations grouped by securitisation sub-class and by whether or not they qualify as HQS according to PCS’s criteria. Time series for each securitisation sub-class are further divided by whether they belong to the Non-periphery countries (Netherlands, Germany, Australia, France, Luxembourg, Belgium, Norway, Switzerland, Sweden, Austria), Periphery countries (Italy, Ireland, Spain, and Portugal), the United Kingdom, or all countries (Periphery, non-Periphery and UK). For each aggregation the mean price, average price standard deviation, average volatility (with a window of 125 days) and average sample size are displayed.
| Full | criteria | Relax not | OTD | Relax | most | Relax | not | Relax | principal | |||
|---|---|---|---|---|---|---|---|---|---|---|---|---|
| senior | tranche | CMBS | amount > | 100m | Relax all | |||||||
| Non- | Non- | Non- | Non- | Non- | criteria | |||||||
| HQS | HQS | HQS | HQS | HQS | HQS | HQS | HQS | HQS | HQS | |||
| All Asset | All | 2.32 | 6.64 | 2.58 | 6.54 | 2.80 | 9.72 | 2.76 | 6.50 | 2.37 | 6.66 | 4.97 |
| Types | Non- | |||||||||||
| periphery | 1.54 | 6.17 | 1.89 | 5.61 | 1.81 | 12.86 | 1.62 | 6.13 | 1.54 | 6.18 | 3.29 | |
| Periphery | 3.14 | 4.10 | 3.20 | 4.19 | 3.14 | 4.44 | 3.15 | 4.10 | 3.15 | 4.22 | 3.73 | |
| UK | 3.25 | 8.54 | 4.27 | 8.43 | 3.77 | 11.31 | 4.85 | 8.44 | 3.38 | 8.56 | 7.09 | |
| RMBS | All | 3.59 | 7.42 | 4.06 | 7.23 | 4.40 | 11.43 | 3.59 | 7.42 | 3.68 | 7.45 | 6.58 |
| Non- | ||||||||||||
| periphery | 2.57 | 4.99 | 3.17 | 3.92 | 2.76 | 6.69 | 2.57 | 4.96 | 2.56 | 4.97 | 3.77 | |
| Periphery | 5.97 | 4.60 | 5.85 | 4.56 | 5.73 | 4.22 | 5.97 | 4.60 | 5.66 | 4.78 | 5.50 | |
| UK | 4.36 | 8.92 | 6.79 | 8.71 | 5.08 | 15.37 | 4.36 | 8.92 | 4.39 | 8.96 | 8.58 |
Note: entries are annualised volatilities, expressed in percent, averaged across securities and time periods.
Section 5 – liquidity results
In this section, we present analysis of the relative liquidity of HQS and non-HQS securitisation tranches. The indicator of liquidity we employ is the average magnitude of bid-ask spreads as a percentage of par values. This appears to us the most obvious starting point for an analysis of liquidity although we fully recognise that there are several other dimensions of liquidity and hence possible indicators, for example, trading volume and measures of market resilience (i.e., how much do prices change when a (large) trade occurs?).[10]
As explained in the data section, bid-ask spread data for securitisations are difficult to obtain. We were assisted in obtaining suitable data by Standard & Poor’s who kindly made available to us daily quote data from banks that they employ to calibrate their valuation services for investors in securitisations. The Standard & Poor’s data is only available for the period from the 26th May 2009 to 4th of November 2013.
Figure 7 shows time series of average bid-ask spreads for securitisation tranches. Here, the averages are taken over the cross-sections of individual securitisation tranches that appear in our dataset on a given day. The tranches considered are all AAA or AA-rated on the day in question. Note that in the volatility analysis of the last section, we conditioned on AAA-rated tranches. Here, we condition on AAA and AA-rated securities because the number of data observations was somewhat smaller.
The results in the figure again suggest significant differences between HQS and non-HQS securitisation tranches. Early in the sample period, at the height of the crisis, there was little difference between bid-ask spreads. But since 2010, HQS tranches have exhibited noticeably narrower bid-ask spreads than non-HQS securities. This result appears most marked in the case of non-periphery securitisations although differences are still apparent with periphery country tranches. The nonperiphery data is affected by the same Spanish-bank sample selectivity issue discussed in the last section, namely that the HQS Spanish RMBS are all issued by distressed cajas whereas the non-HQS are issued by a wider set of less financially distressed banks.
The non-periphery all-asset-type HQS bid-ask spreads, (which are likely to be a better guide to the ceteris paribus impact of the HQS characteristics) were 30-40 basis points lower than those of the non-HQS securities for significant parts of the sample period considered. As one might expect, the pattern of results for RMBS (see Figure 8) is qualitatively similar to that for the All Asset Types (as shown in Figure 7).
In Figure 9, we show results for Auto Loan backed ABS. These securitisation tranches exhibit noticeably lower spreads than the other exposures we consider. The results suggest that HQS spreads are systematically lower including for the Eurozone periphery countries and for the UK. The level of spreads during much of the sample period is just 20 basis points. After 2010, this is even true for periphery countries.
Table 6 contains a summary of the liquidity results. For all asset types, the mean bid-ask spread is 0.916% for HQS compared to 1.211% for non-HQS. As one might expect, for non-periphery countries, the average spreads are significantly lower with 0.533% for HQS and 0.927 for non-HQS. The RMBS results are similar although the periphery RMBS show the issue discussed in earlier sections concerning Spanish bank selectivity effects. Auto Loan bid-ask spreads are extremely low with HQS spreads of 0.244% and 0.560% for non-HQS.
Table 6 also shows quantiles and standard deviations of the cross-sectional distribution of bid-ask spreads averaged over the sample period. These show that qualitative features of the means remain true of the distributions more generally. So, in particular, the 10% quantiles, which correspond to the most liquid securities, are much lower for HQS than for non-HQS, being 0.131% and 0.231% respectively. Similarly, the standard deviations of the cross sections of spreads (averaged over the sample period) are noticeably lower for HQS.
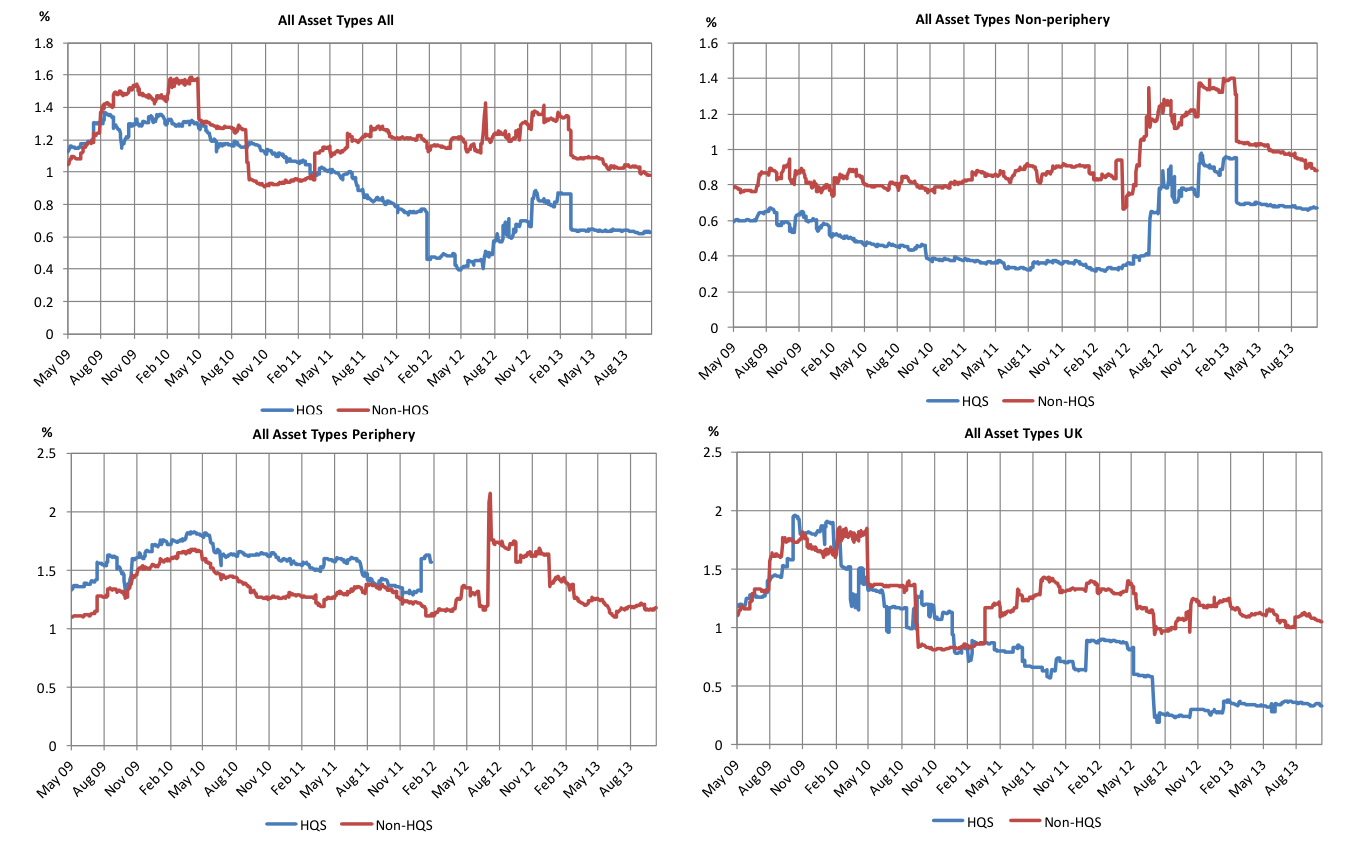
Notes: The plots display the evolution of average bid-ask spreads of both HQS and Non-HQS over time for all asset types in four different country-groupings: all countries, non-periphery countries, periphery countries and the UK. Individual security bid-ask spreads have been estimated by Standard & Poor’s. The y-axis shows the average bid- ask spreads measured on a given date as a percentage of the bond’s par value plotted against time (on the x-axis).
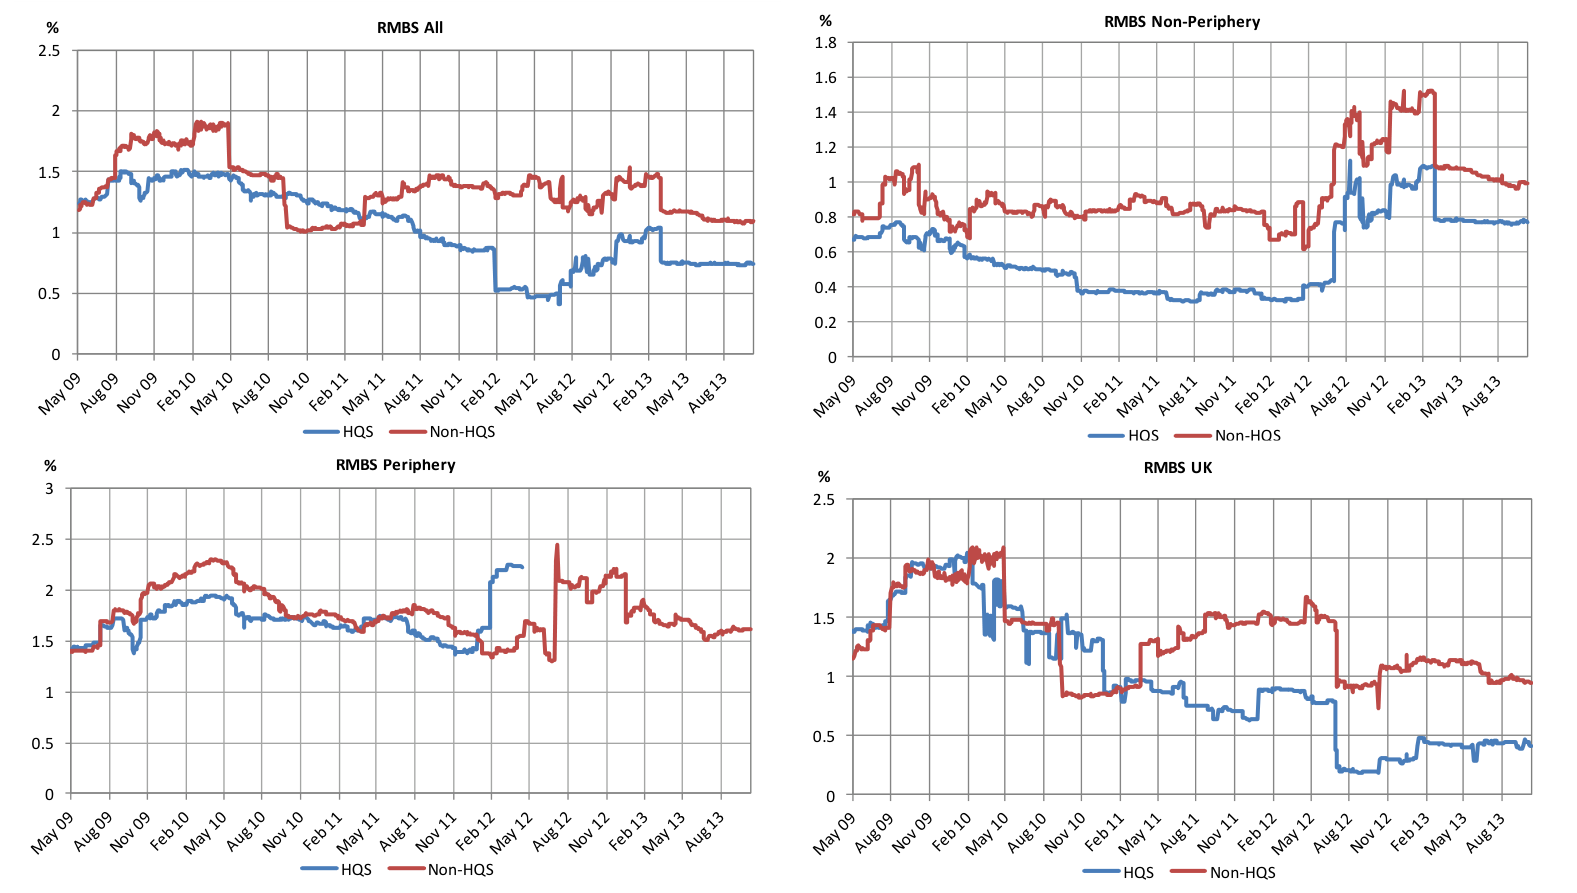
Notes: The volatility results displayed in this figure are calculated in the same way as in Figure 7, above. However, the results given here are for RMBS only.
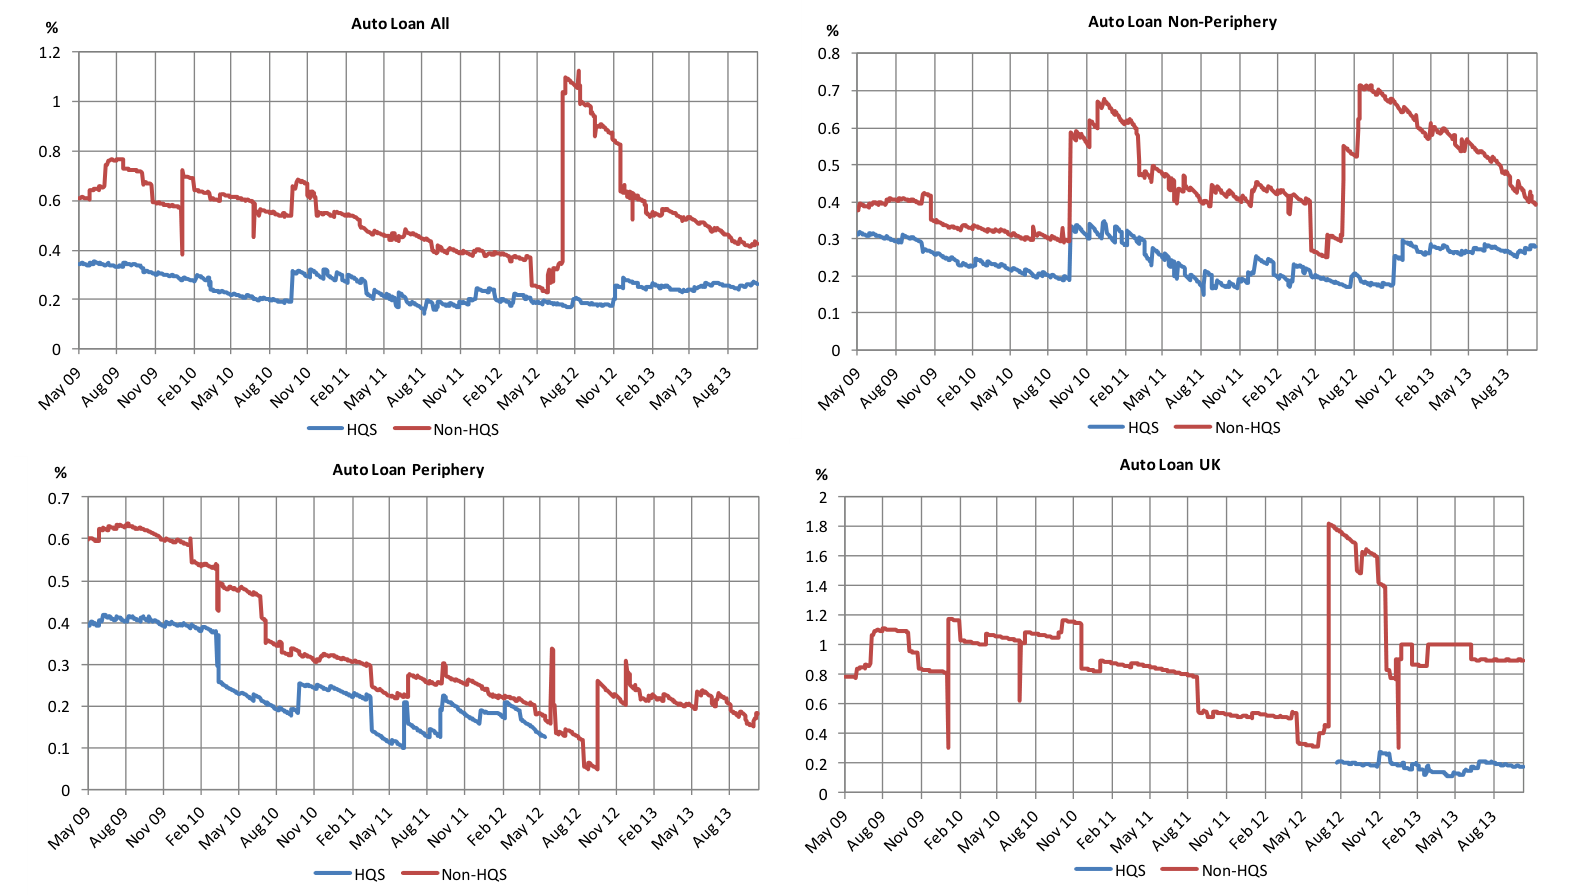
Notes: The volatility results displayed in this figure are calculated in the same way as in Figure 7, above. However, the results given here are for Auto-Loan ABS only.
| Avg 10% | Avg 90% | Avg 10% | Avg 90% | |||||
|---|---|---|---|---|---|---|---|---|
| Mean | Avg SD | quantile | quantile | Mean | Avg SD | quantile | quantile | |
| All | 0.916 | 0.839 | 0.131 | 2.013 | 1.211 | 1.186 | 0.231 | 2.66 |
| Non-periphery | 0.533 | 0.531 | 0.103 | 1.165 | 0.927 | 0.892 | 0.229 | 1.82 |
| Periphery | 1.518 | 0.816 | 0.352 | 2.342 | 1.352 | 1.068 | 0.314 | 2.76 |
| UK | 0.859 | 0.841 | 0.158 | 1.703 | 1.254 | 1.232 | 0.191 | 3.08 |
| All | 1.033 | 0.871 | 0.165 | 2.113 | 1.364 | 1.312 | 0.239 | 2.99 |
| Non-periphery | 0.584 | 0.561 | 0.116 | 1.234 | 0.945 | 1.041 | 0.197 | 1.88 |
| Periphery | 1.705 | 0.714 | 0.461 | 2.434 | 1.784 | 1.108 | 0.521 | 3.13 |
| UK | 0.965 | 0.889 | 0.082 | 1.096 | 1.321 | 1.217 | 0.203 | 3.19 |
| All | 0.244 | 0.131 | 0.070 | 0.317 | 0.560 | 0.347 | 0.130 | 0.95 |
| Non-periphery | 0.243 | 0.128 | 0.055 | 0.241 | 0.456 | 0.277 | 0.028 | 0.24 |
| Periphery | 0.251 | 0.115 | - | - | 0.321 | 0.116 | 0.006 | 0.04 |
| UK | 0.180 | 0.064 | - | - | 0.914 | 0.156 | - | - |
Notes: The table displays key summary statistics for time series of bid-ask spreads by sub-class and by whether or not they qualify as HQS according to PCS’s criteria. Time series for each sub-class are further divided by whether they belong to the non-periphery countries (Netherlands, Germany, Australia, France, Luxembourg, Belgium, Norway, Switzerland, Sweden, Austria), periphery countries (Italy, Ireland, Spain, and Portugal), the United Kingdom, or all countries (both periphery and non- periphery). For each aggregation, the mean bid-ask spread, average bid-ask spread standard deviation, and average 10% and 90% quantiles are displayed.
Section 6 – comparisons with covered bonds
It is interesting to compare the risk and liquidity properties of HQS exposures to those of Covered Bonds. Covered Bonds have been afforded favourable regulatory treatment by regulators, especially in Europe. The LCR eligibility rules proposed by the EBA (see European Banking Authority (2013)) suggest that some Covered Bonds are inferior in liquidity only to the most liquid sovereign issues and hence should be admitted to the 2a category for LCR purposes, while a wider set of covered bonds should be admitted to the 2b category. Among securitisations, according to the EBA’s recommendations, only certain RMBS should be admitted to the 2b category. Similarly, the capital treatment of securitisations is inferior to that of Covered Bonds under both proposed Basel and Solvency II rules.
In Figure 10, we present volatility calculations averaged over individual securities, using the techniques described above, for AAA-rated HQS and Covered Bonds. The figure shows comparisons for all types of securitisation and Covered Bonds for (i) all European countries in our sample, (ii) nonperiphery Eurozone countries (as defined above), (iii) periphery countries (Ireland, Spain, Portugal and Italy) and (iv) for the UK. Recall that by average volatility, we mean 10-day volatilities averaged over the individual securities in the category in question at a given date using a window of 125 daily data observations stretching up to that date.
When all countries are considered together, the HQS volatilities are lower than those of Covered Bonds for much of the sample period. The exception is the early 2008-2009 phase of the crisis when securitisation volatilities were particularly high and sovereign bailouts of banks were still reasonably credible. The result is even clearer for non-periphery HQS securitisations and covered bonds where the covered bonds clearly exhibit higher volatility with the exception of the period November 2008 to May 2010. Similar results may be observed for the UK. The results for the periphery countries are, once again, affected by the fact that the HQS category consists of issues by distressed cajas.
Panel a) of Table 7 summarises the results of Figure 10 by presenting averages, over the sample period, of the mean volatilities. It is striking that the average volatilities for each of the geographical regions are lower than the corresponding volatility averages for Covered Bonds. This finding is in stark contrast to the favourable regulatory treatment that Covered Bonds receive in Europe.
Figure 11 presents comparisons of bid-ask spreads, averaged across AAA and AA rated individual securities, at given points in time. In the first half of the sample period, bid-ask spreads for HQS securitisation tranches were consistently higher than those for Covered Bonds. In 2011, spreads for the two asset classes became more comparable across the two asset classes, with Covered Bond bidask spreads actually being higher in non-periphery countries and the UK. In the latest period, securitisation spreads for non-periphery countries rose again for HQS tranches although they remained low and comparable to Covered Bond spreads in the UK. This has made Covered Bonds relatively more liquid again.[11]
Panels b) and c) of Table 7 present summaries of the results in Figure 11, specifically, time series averages of the mean bid-ask spreads shown in the figure. The mean bid-ask spreads for HQS tranches in Panel b) were 0.903 compared to 0.425 for Covered Bonds. The cross-sectional standard deviations of bid-ask spreads averaged over the sample period were 0.829 for HQS and 0.374 for Covered Bonds.
The most liquid assets within each asset class had bid-ask spreads below 0.131 for HQS and 0.119 for Covered Bonds measured by the time series averages of the 10% quantile of the bid-ask spreads. For the other geographical regions considered, non-periphery, periphery and UK, the 10% quantile bidask spreads were actually lower for HQS than for Covered Bonds suggesting that the more liquid HQS are more liquid than the more liquid Covered Bonds throughout the countries we consider except for periphery Eurozone countries.
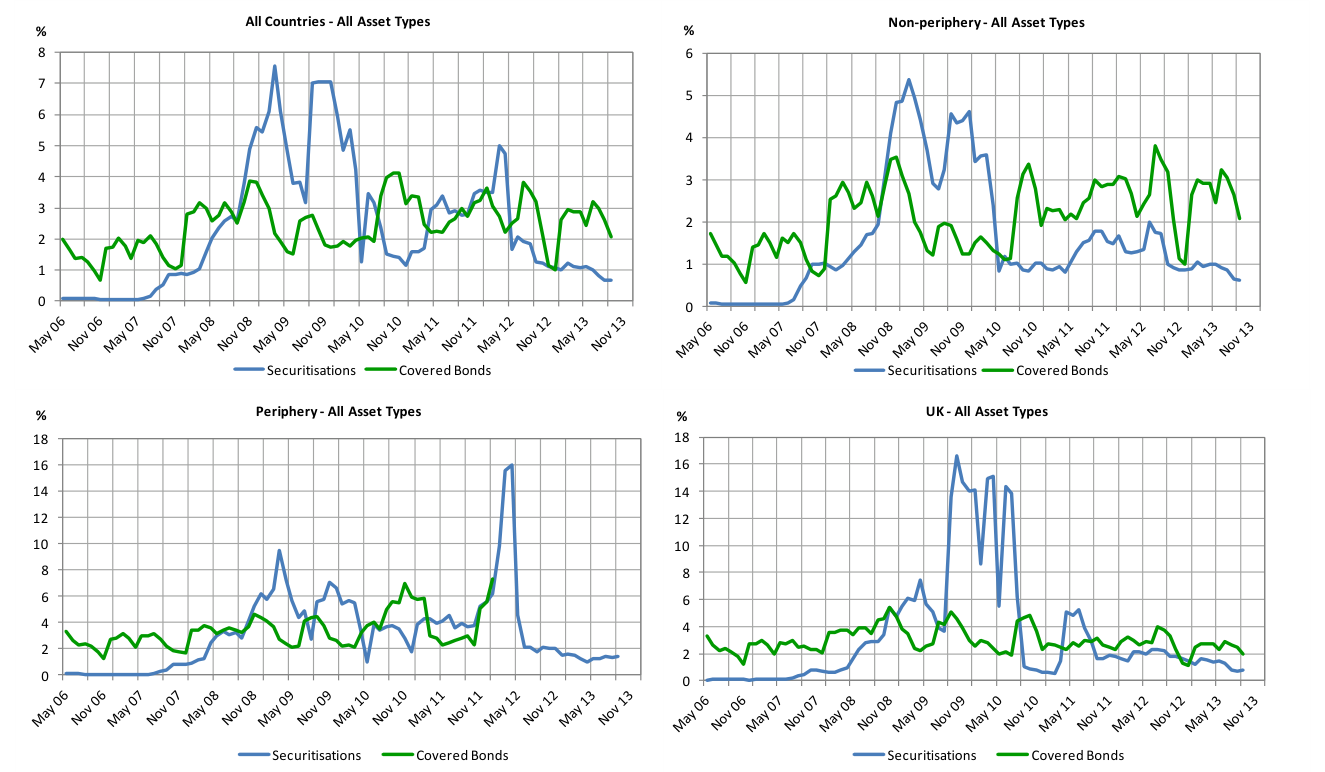
Notes: The plots display the evolution of volatilities of both High Quality Securitisations and Covered Bonds over time for all asset types in four different country-groupings: all countries, non-periphery countries, periphery countries and the UK. Average volatilities are calculated as annual percentages using the methodology described in the previous section. The estimated volatility in each period is measured on an annualised basis in percent on the y-axis and this is plotted against time on the x-axis.
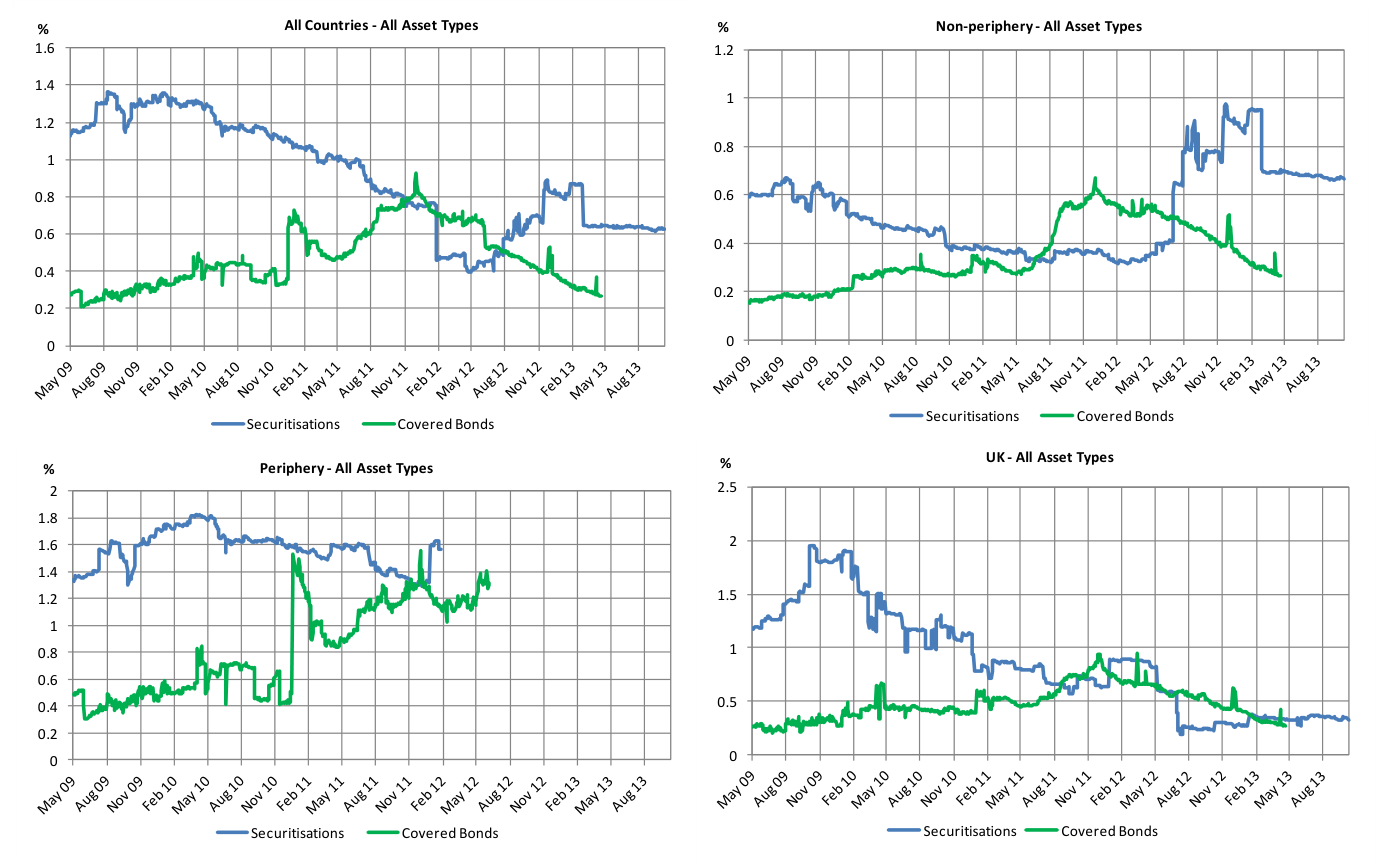
Notes: The figures above display the evolution of bid-ask spreads of both High Quality Securitisations and Covered Bonds over time for all asset types in four different country-groupings: all countries, non-periphery countries, periphery countries and the UK. Bid-ask spreads have been estimated by Standard & Poor’s. The y-axis shows the bid-ask spreads measured as a percentage of the bond’s par value plotted against time (on the x-axis).
| Avg | Avg | ||||||||||||
|---|---|---|---|---|---|---|---|---|---|---|---|---|---|
| Mean | Avg | Avg | Sample | Mean | Avg | Avg | Sample | ||||||
| Price | Price | SD | Volatility | Size | Price | Price | SD | Volatility | Size | ||||
| All Asset Types | All | 97.33 | 4.01 | 2.37 | 147.27 | 101.49 | 5.65 | 2.43 | 547.11 | ||||
| Non-periphery | 98.27 | 2.15 | 1.57 | 66.93 | 102.45 | 5.39 | 2.12 | 397.24 | |||||
| Periphery | 96.15 | 4.37 | 3.20 | 45.28 | 97.42 | 4.60 | 3.36 | 111.15 | |||||
| UK | 98.42 | 3.87 | 3.33 | 35.06 | 100.29 | 4.17 | 2.97 | 38.73 | |||||
| b) Bid-ask spread: | AAA only | ||||||||||||
| Securitisations | Covered | Bonds | |||||||||||
| Avg | 10% | Avg 90% | Avg 10% | Avg 90% | |||||||||
| Mean | Avg | SD | quantile | quantile | Mean | Avg SD | quantile | quantile | |||||
| All | 0.903 | 0.829 | 0.131 | 1.963 | 0.425 | 0.374 | 0.119 | 0.76 | |||||
| Non-periphery | 0.533 | 0.531 | 0.103 | 1.165 | 0.336 | 0.227 | 0.110 | 0.60 | |||||
| Periphery | 1.518 | 0.816 | 0.352 | 2.342 | 0.691 | 0.584 | 0.278 | 1.33 | |||||
| UK | 0.859 | 0.841 | 0.158 | 1.703 | 0.458 | 0.316 | 0.213 | 0.67 | |||||
| c) Bid-ask spread: | AA’s and | AAA | |||||||||||
| Securitisations | Covered | Bonds | |||||||||||
| Avg | 10% | Avg 90% | Avg 10% | Avg 90% | |||||||||
| Mean | Avg | SD | quantile | quantile | Mean | Avg SD | quantile | quantile | |||||
| All | 0.916 | 0.839 | 0.131 | 2.013 | 0.454 | 0.417 | 0.119 | 0.84 | |||||
| Non-periphery | 0.533 | 0.531 | 0.103 | 1.165 | 0.331 | 0.230 | 0.110 | 0.60 | |||||
| Periphery | 1.518 | 0.816 | 0.352 | 2.342 | 0.784 | 0.608 | 0.325 | 1.48 | |||||
| UK | 0.859 | 0.841 | 0.158 | 1.703 | 0.459 | 0.312 | 0.213 | 0.67 |
Notes: Panel a), above displays volatility results for both Securitisations and Covered Bonds in four country groups: All countries, non-periphery countries, periphery countries and the UK. For each asset type and each country we display the mean price, average price standard deviation, average volatility, and average sample size are displayed. Panels b) and c) display similar results for, respectively, the liquidities of both AAA only and both AA and AAA Securitisations and Covered Bonds in, again: all countries, non-periphery countries, periphery countries and the UK. For each asset type and each country we display the mean, average standard deviation, average volatility and average sample size.
Conclusions
What is the significance of the HQS results reported in this paper? European policy-makers face difficult problems of managing the economy while bank funding remains weak. They are therefore interested in ways of reviving secured funding markets if this can be done in a prudent manner, for example, by providing differentiated regulatory treatment of high quality securitisations.
The Basel proposals on securitisation capital (see BCBS (2012b) and (2013)) represent a very conservative tightening of capital standards, raising regulatory capital for securitised assets much above what would constitute neutrality with underlying pool capital[12] or indeed capital for comparable exposures like Covered Bonds or senior loans to Special Purpose Vehicles. At the same time, Basel proposals on the Liquidity Coverage Ratio eligibility (see BCBS (2012a)) are conservative on securitisations while surprisingly favourable to Covered Bonds.
The policy stance implicit in the Basel proposals may make sense in a US context where securitisations as an asset class have proved so risky and illiquid and where bank investors play a limited role as investors in securitisations[13]. However, such an approach makes less sense in Europe where much of the securitisation market performed well in the crisis (reflecting its different structure and practices), and where bank access to funding remains weak and banks have provided a major part of the buy side. Greater reliance on Covered Bonds by European banks is not a full solution as their use erodes the recovery value of a bank’s un-secured liabilities including the implicit liability to the deposit insurance system.[14]
If one could show that, conditioning on rating, high quality securitisations, defined in an unambiguous way, possess markedly lower risk and better liquidity than other securitisation tranches, policy-makers could justify, within a prudent regulatory framework, less conservative capital and more accommodating LCR eligibility treatment for a segment of the market.
This paper aims to set out statistical evidence on the relative risk and liquidity of securitisation tranches distinguished on the basis of a High Quality Securitisation (HQS) definition. We show that, holding rating constant, an HQS definition based on asset class, seniority, size and a no-originate-todistribute flag, adds substantial information in identifying less risky and more liquid securitisations. Our HQS definition is a simplified version of the more detailed and elaborate categorisation of high quality securitisation tranches employed in the industry-sponsored Prime Collateralised Securities label.
References
Ashcraft, Adam and Til Schuermann, (2008a) “Understanding the securitization of subprime mortgage credit,” Staff Note, Federal Reserve Bank of New York, No. 318, http://www.econstor.eu/bitstream/10419/60823/1/587537833.pdf.
Ashcraft, Adam and Til Schuermann, (2008b) “The Seven Deadly Frictions of Subprime Mortgage Credit Securitization,” The Investment Professional, Fall, 2-11, http://www.ebooksmagz.com/pdf/theseven-deadly-frictions-of-subprime-mortgage-credit-289986.pdf.
Bank of England (2010) “Bank of England Market Notice: Information Transparency for ABS”, Bank of England Market Notice, July, http://www.bankofengland.co.uk/markets/Documents/m arketnotice100719a.pdf.
Bank of England (2012) “The Bank of England’s Sterling Monetary Framework”, Bank of England, January, http://www.bankofengland.co.uk/markets/Documents/money/publications/redbook. pdf.
Bank of England (2013a) “Sterling Monetary Framework: Summary of collateral eligible for the Bank’s operations”, Bank of England Summary Table, October, http://www.bankofengland.co.uk/ markets/Documents/money/publications/summary_collateral.pdf.
Bank of England (2013b) “Sterling Monetary Framework: Level B Collateral Set”, Bank of England Note, October, http://www.bankofengland.co.uk/markets/Documents/money/publications/lev elbcollateral.pdf.
Bank of England (2013c) “Sterling Monetary Framework: Level C Collateral Set”, Bank of England Note, October, http://www.bankofengland.co.uk/markets/Documents/money/publications/lev elccollateralsecurities.pdf
Bank of England (2013d) “Sterling Monetary Framework: Summary of haircuts for securities eligible for the Bank's lending operations”, Bank of England Summary Table, October, http://www.bankofengland.co.uk/markets/Documents/money/publications/summary_haircuts.pdf.
Brunnermeier, Markus (2009) “Deciphering the Liquidity and Credit Crunch 2007-08,” Journal of Economic Perspectives, 23(1), Winter, pp. 77-100, https://www.princeton.edu/~markus/research/papers/liquidity_credit_crunch.pdf.
Caprio, Gerard, Aslı Demirgüç-Kunt and Edward J. Kane (2010) “The 2007 Meltdown in Structured Securitization: Searching for Lessons, not Scapegoats,” World Bank Research Observer, 25(1), pp. 125-55.
Cochrane, John H., 1988, “How Big Is the Random Walk in GNP?”, Journal of Political Economy, 893-920.
Draghi, Mario (2011) “Introductory Statement to the Press Conference (with Q&A),” European Central Bank Speech, 8th December, http://www.ecb.europa.eu/press/pressconf/2011/html/is111208.e n.html.
Duponcheele, Georges, William Perraudin and Daniel Totouom-Tangho (2013a) “A Principles-Based Approach to Regulatory Capital for Securitisations,” BNP-Paribas mimeo, April. http://www.riskcontrollimited.com/public/Regulatory_capital_for_securitisations.pdf.
Duponcheele, Georges, William Perraudin and Daniel Totouom-Tangho (2013a) “A Principles-Based Approach to Regulatory Capital for Securitisations,” BNP-Paribas mimeo, April. http://www.riskcontrollimited.com/public/Regulatory_capital_for_securitisations.pdf.
Duponcheele, Georges, William Perraudin and Daniel Totouom-Tangho (2013c) “Maturity Effects in Securitisation Capital: Total Capital Levels and Dispersion Across Tranches,” BNP-Paribas mimeo, September.http://www.riskcontrollimited.com/public/Maturity_Effects_in_Securitisation_Capital.pdf.
Duponcheele, Georges, William Perraudin, Alastair Pickett and Daniel Totouom-Tangho (2013d) “Granularity, Heterogeneity and Securitisation Capital,” BNP-Paribas mimeo, September. http://www.riskcontrollimited.com/public/Granularity_Heterogeneity_and_Securitisation_Capital.pdf.
Duponcheele, Georges, William Perraudin and Daniel Totouom-Tangho (2014a) “Reducing the Reliance of Securitisation Capital on Agency Ratings,” BNP-Paribas mimeo, February. http://www.riskcontrollimited.com/public/Reducing_the_Reliance.pdf.
Duponcheele, Georges, William Perraudin and Daniel Totouom-Tangho (2014b) “Calibration of the Simplified Supervisory Formula Approach,” BNP-Paribas mimeo, March. http://www.riskcontrollimited.com/public/Calibration_of_SSFA.pdf.
Duponcheele, Georges, William Perraudin, Alexandre Linden and Daniel Totouom-Tangho (2014) “Calibration of the CMA and Regulatory Capital for Securitisations,” BNP-Paribas mimeo, April. http://www.riskcontrollimited.com/public/Calibration_of_CMA.pdf.
Elul, Ronel, (2011) “Securitization and Mortgage Default,” Working Paper 09-21R, Federal Reserve Bank of Philadelphia, May.
European Banking Authority (2013) “Report on appropriate uniform definitions of extremely high quality liquid assets (extremely HQLA) and high quality liquid assets (HQLA) and on operational requirements for liquid assets under Article 509(3) and (5) CRR”, December, https://www.eba.europa.eu/documents/10180/16145/EBA+BS+2013+413+Report+on+definition+of+ HQLA.pdf.
European Central Bank, (2011) “Guideline of the ECB of 20 September 2011 on monetary policy instruments and procedures of the Eurosystem (recast)”, European Central Bank Guideline, (14), September, https://www.ecb.europa.eu/ecb/legal/pdf/l_33120111214en000100951.pdf.
European Central Bank, (2012) “Guideline of the ECB of 26 November 2012 amending Guideline ECB/2011/14 on monetary policy instruments and procedures of the Eurosystem” European Central Bank Guideline, (25), November, https://www.ecb.europa.eu/ecb/legal/pdf/l_34820121218en 00300041.pdf.
European Central Bank (2013a) “Collateral Eligibility Requirements: A Comparative Study across Specific Frameworks”, European Central Bank Study, July, http://www.ecb.europa.eu/pub/pdf/ other/collateralframeworksen.pdf.
European Central Bank, (2013b) “Decision of the ECB of 26 September 2013 on additional temporary measures relating to Eurosystem refinancing operations and eligibility of collateral, European Central Bank Decision, (36), September, https://www.ecb.europa.eu/ecb/legal/pdf/l_30120131112en00130014_.pdf.
European Central Bank, (2013c) “Guideline of the ECB of 20 March 2013 on additional temporary measures relating to Eurosystem refinancing operations and eligibility of collateral and amending Guideline ECB/2007/9 (recast), European Central Bank Guideline, (4), March, https://www.ecb.europa.eu/ecb/legal/pdf/l_09520130405en00230030.pdf.
European Central Bank (2014) “Marketable Assets” [web page], https://www.ecb.europa.eu/mopo/ass ets/standards/marketable/html/index.en.html, [24/04/2014].
European Insurance and Occupational Pensions Authority (2013a) “Discussion Paper on Standard Formula Design and Calibration for Certain Long Term Investments”, EIOPA Discussion Paper (163), April, available at: https://eiopa.europa.eu/consultations/consultation-papers/2013-closed-consultations/april-2013/discus sion-paper-on-standard-formula-design-and-calibration-for-certain-long-term-investments/index.html ?no_cache=1&cid=5670&did=30663&sechash=728402e0.
European Insurance and Occupational Pensions Authority (2013b) “Technical Report on Standard Formula Design and Calibration for Certain Long-Term Investments”, EIOPA Technical Re port (513, December, available at: http://eiopa.europa.eu/fileadmin/tx_dam/files/publications/reports/ EIOPA_Technical_Report_on_Standard_Formula_Design_and_Calibration_for_certain_Long-Term_ Investments__2_.pdf.
Federal Reserve (2014a) “Federal Reserve Collateral Guidelines”, Federal Reserve Guideline, http://www.frbdiscountwindow.org/frcollguidelines.pdf.
Federal Reserve (2014b) “Federal Reserve Discount Window & Payment System Risk Collateral Margins Table“, Federal Reserve Summary Table, January, http://www.frbdiscountwindow .org/frcollguidelines.pdf, [24/04/2014].
Kaufman, George (1994) “Bank Contagion: A Review of the Theory and Evidence,” Journal of Financial Services Research, April, pp. 123–50.
Keys, Benjamin, T. Mukherjee, A. Seru and V. Vig, (2010) “Did Securitization Lead to Lax Screening? Evidence from Subprime Loans,” The Quarterly Journal of Economics, February.
Kiesel, Rüdiger, William Perraudin, and Alex Taylor (2003) “The Structure of Credit Risk,” Journal of Risk..
Kiesel, Rüdiger, William Perraudin, and Alex Taylor (2001) “Estimating Volatility for Long Holding Periods,” in Measuring Risk in Complex Stochastic Systems edited by Jurgen Franke, Wolfgang Hardle and Gerhard Stahl, Springer Lecture Notes in Statistics 147, Springer Verlag, New York.
Mian, Atif and Amir Sufi (2009) “The Consequences of Mortgage Credit Expansion: Evidence from the U.S. Mortgage Default Crisis,” Quarterly Journal of Economics, 124(4), pp. 1449-1496.
Perraudin, William (2014) “Covered Bond versus ABS Liquidity: A Comment on the EBA’s Proposed HQLA Definition,” Risk Control Limited Research Paper, 17, January, http://www.afme.eu/WorkArea/DownloadAsset.aspx?id=10360.
Prime Collateralised Securities, info@pcsmarket.org (2013) “EIOPA/13/163: Discussion Paper on Standard Formula Design and Calibration for Certain Long-Term Investments” [email] Message to European Insurance and Occupational Pensions Authority (LTI@eiopa.europa.eu). Sent 28th May
2013. Available at: http://pcsmarket.org/wp-content/uploads/2013/05/PCS-Response-to-EIOPAconsultation.pdf. Accessed on: 4th April 2014.
Prime Collateralised Securities (2014a) “Prime Collateralised Securities: Rulebook”, 6th Edition, January.
Prime Collateralised Securities (2014b) “Prime Collateralised Securities: Rulebook”, 7th Edition, June.
Standard & Poor’s (2013) “Transition Study: Six Years On, Only 1.5% of European Structured Finance Has Defaulted”, S&P Capital IQ, December, https://www.globalcreditportal.com/ratingsdirec t/renderArticle.do?articleId=1224833&SctArtId=218785&from=CM&nsl_code=LIME.
Standard & Poor’s (2014) “EIOPA's Revised Solvency II Calibration Still Risks Turning European Insurers Away From Securitizations”, Standard and Poor’s Structured Finance Research, March.
Wang, Yihui and Han Xia (2014) “Do Lenders Still Monitor When They Can Securitize Loans?” Review of Financial Studies, 27(4).
Appendix
Table A1: Summary of PCS Label Criteria
1. Common Eligibility Criteria To obtain a PCS label the following criteria need be met by all securitisations:
a) Alignment of The Originator undertakes to retain a material net economic interest sufficient to meet the Interests requirements of Article 405 of the CRR (whether or not the Originator or investor is Standards subject to the CRR).
b) No iterative The securities are not part of a Re-Securitisation credit tranching
c) No embedded i. Each of the Underlying Assets was underwritten with full recourse to an Obligor maturity that was an individual or a corporate that is not a special purpose entity where transformation repayment was expected, in whole or in part, to be reliant on the refinancing or re-sale value of the security for that financial obligation.
d) Transparency i. The Issuer or the Originator undertakes, from the Issue Date to the date the last standards Security is redeemed in full, to make available a cash flow model to investors, either directly or indirectly. ii. The Issuer or the Originator undertakes that: A. Prior to the Issue Date (or, for Existing Securities, from the date the PCS Label is awarded), it will make available (i) for Underlying Assets which are not Granular Assets loan-level data to enable investors or third party contractors to build a cash flow model setting out the transaction cash flows or, (ii) in relation to Underlying Assets which are Granular Assets, detailed summary statistics on the Underlying Assets; and B. On or about the Issue Date (or, for Existing Securities, from the date the PCS Label is awarded) to the date the last Security is redeemed in full, it will make available loan level data in a Recognised Data Repository; iii. The Prospectus discloses (or, in respect of Existing Securities only, either the Prospectus discloses or the Issuer or the Originator undertake in the Originator Certificate that all subsequent Investor Reports will disclose) those entities which will have an Ongoing Involvement and in respect of each such entity, either: A. discloses the ratings which will trigger a requirement for (i) the provision of collateral; (ii) the provision of a third party guarantee; or (iii) the provision of a replacement; or B. confirms that no such rating triggers exist. iv. The Prospectus discloses (or, for Existing Securities only, either the Prospectus discloses or the Issuer or the Originator undertake in the Originator Certificate that all subsequent Investor Reports will disclose) the payment frequency of the Underlying Assets. v. The Originator undertakes that it will, in the case of new Securities only, prior to the Issue Date, publicly disclose the amount of the Securities it intends will be: A. pre-placed privately with investors which are not in the Originator Group; B. retained by a member of the Originator Group unless the Securities were acquired by such member on arm's length market terms and/or on the same terms as were publicly offered to investors which are not in the Originator Group; and C. publicly offered to investors which are not in the Originator Group. vi. The Prospectus discloses (or, for (a) Existing Securities or (b) Securities backed by a Multi-Issuance Pool prior to a Prospectus update only, the Originator undertakes in the Originator Certificate that all subsequent Investor Reports will disclose): A. what information relating to the Securities and the Underlying Assets (such as investor reports, transaction documents, loan level data and so on) will be made available whilst the Securities are outstanding; (ii) when such information will be made available; and (iii)where such information will be made available and how investors will be able to access it; and B. that, once made available, such information will remain available until the date the last Security is redeemed in full.
vii. Either: (A) the Prospectus discloses whether the Issuer intends to comply with any applicable Domestic Market Guidelines; or (B) no Domestic Market Guidelines apply. viii. All material Originator and Issuer undertakings, representations and warranties have been disclosed in the Prospectus. ix. The Prospectus describes underwriting criteria, processes and standards used in originating the Underlying Assets. x. The Prospectus contains a description of processes and standards applied in servicing the Underlying Assets. xi. The Issuer or the Originator undertakes that each investor report for the transaction will contain a glossary xii. The Issuer or the Originator undertakes that from the Issue Date to the date the last Security is redeemed in full Investor Reports will be made available to investors, potential investors and firms that generally provide services to investors and will be updated on a periodic basis. xiii. The Prospectus contains a description of the cash-flow waterfalls and how these operate in all circumstances.
e) Additional i. The Securities form part of the most senior tranche of the issuance. Transaction ii. The Securities are expected to be rated as at the date of the Prospectus by at least Quality two credit rating agencies. The Issuer is incorporated in an Eligible Jurisdiction.[15] Standards iii. The Underlying Assets will, prior to the Issue Date, be subject to a third-party review according to agreed procedures of a random sample as follows: A. where the Securities are backed by a Single-Issuance Pool: (I) a review of the Underlying Assets undertaken on or about the Issue Date; or (II) a general review undertaken in relation to the Originator's general portfolio from which the Underlying Assets were selected within the last 12 months prior to the Issue Date; or B. where the Securities are backed by a Multi-Issuance Pool: (I) a review of the Underlying Assets undertaken on or about the Issue Date; or (II) a general review undertaken in relation to that Multi-Issuance Pool within the last 12 months prior to the Issue Date. iv. Continuity provisions: The documents for the transaction contain provisions designed to ensure that: A. the default, insolvency or disappearance of the current servicer does not lead to a termination of the servicing on the Underlying Assets or the Securities; and B. any derivative contracts entered into by the Issuer contains provisions for the replacement of the derivative counterparty upon default and specified events; and C. any liquidity facility or account bank agreement entered into for the benefit of the Issuer contains provisions for the replacement of the facility provider or bank upon default and specified events. v. The Prospectus confirms that the issuer is incorporated in an Eligible Jurisdiction.
Originator Group; and B. in relation to any amount initially retained by a member of the Originator Group, but subsequently placed with investors which are not in the Originator Group, it will disclose such placement in the next investor report. iii. The Securities will be admitted to trading on a regulated market in the Eligible Jurisdictions. iv. Securities which are intended to be publicly distributed, in part or in full, have at least one lead-manager and one other syndicate member of at least co-manager status. v. The Prospectus confirms that the Securities are denominated in one or more Eligible Currencies.
g) True Sale In order for Securities to be eligible for the PCS label, the Underlying Assets must meet Standards the following criteria.[17] (excluding i. The Prospectus contains a description of the method of sale or transfer of the Netherlands and Underlying Assets. UK Residential ii. The Prospectus’ description of the method of sale indicates that the Securities are Mortgage not a Synthetic Securitisation. Loans) iii. Immediately prior to the sale of the Underlying Assets by the Originator, title to the Underlying Assets was owned solely by the Originator free from any security interest. iv. The Originator may freely transfer its interest in the Underlying Assets and their Related Security without breaching any term or condition of the Underlying Asset Agreement. v. No Underlying Asset Agreement contains confidentiality provisions which restrict the purchaser’s exercise of its rights as owner of the Underlying Assets. vi. Each Underlying Asset and its Related Security: (A) has been transferred; and (B) each transfer is enforceable against creditors of the Originator, and is neither prohibited nor invalid save only for applicable laws affecting the rights of creditors generally. vii. The Prospectus indicates that the Originator selling the Underlying Assets is located for solvency purposes in a Jurisdiction Without Severe Clawback.
Security and no steps have been taken by the Originator to enforce any Related Security as a result of such breach. (B) With respect to monthly payments, as at the Specified Date (and except for consumer loans and credit cards, which are covered by criteria 2(c)(iii) and 2(d)(ii) respectively): (i) no Underlying Asset has more than one scheduled payment outstanding due and unpaid; or (ii) no Underlying Asset is more than 30 days in arrears. ix. (A) The Underlying Assets are not subject to any withholding tax in the jurisdiction of the Underlying Asset; or (B) Some or all Underlying Assets are subject to withholding tax in the jurisdiction of the Underlying Asset, this tax has been disclosed in the Prospectus and the transaction is structured and the cashflows calculated in such a way as to fully account for such tax. x. As at the Specified Date, each Underlying Asset Agreement has been concluded in compliance with either (a) all applicable consumer protection legislation or (b) specific named consumer protection legislation which has the same scope as the blanket reference to “applicable consumer protection” in (a) above, in both cases to the extent that failure to comply would have a material adverse effect on its enforceability or collectability. xi. As at the Specified Date, in relation to each Underlying Asset being transferred, no Underlying Asset Agreement has been subject to any variation, amendment, modification, waiver or exclusion of time of any kind which in any material way adversely affects the enforceability or collectability of all or a material portion of the Underlying Assets being transferred. xii. No Underlying Asset Agreement has been entered into as a consequence of any conduct constituting fraud of the relevant seller and, to the best of the relevant seller’s knowledge, no Underlying Asset Agreement has been entered into fraudulently by the relevant Borrower. xiii. As at the Specified Date, no Obligor which is not an individual is subject to an insolvency event.
breach or default of any obligations under any loan agreements (other than with respect to monthly payments) to the extent it would have a material adverse effect on the Underlying Assets. H. No Untrue Information: There is no untrue information on the particulars of the receivables and collateral contained in the sale agreement. ii. The Originator confirms that representations, warranties and undertakings in respect of the Underlying Assets will be given by the Originator, on or prior to the Issue Date, to substantially the same effect as set out in paragraph 3(f)(i) above.
2. Asset Specific There are also asset specific eligibility criteria for: Auto Dealer Floorplan Loans, Auto Eligibility Loans and Auto Leases, Consumer Loans, Credit Card Receivables, Non-Auto Leases, Criteria Residential Mortgage Loans, Dutch Residential Mortgage Loans, Dutch Residential Mortgage Loan Representations, Warranties and Undertakings, Spanish Residential Mortgage Loans, Spanish Residential Mortgage Loan Representations, Warranties and Undertakings, UK Residential Mortgage Loans (excluding Buy-to-Let Residential Mortgage Loans), UK Buy-to-Let Residential Mortgage Loans, UK Residential Mortgage Loans (Buy-to-Let and non-Buy-to-Let), UK Residential Mortgage Loan Representations, Warranties and Undertakings, and SME Loans.
3. Jurisdiction There are jurisdiction specific criteria for: German securitisations, Dutch securitisations Specific and for Dutch Representations, Warranties and Undertakings. Eligibility Criteria
Table A2: Additional Requirements of Central Bank Collateral Frameworks Securitisations eligible as collateral Haircuts/ Margins Currency Issuance/Geographic Requirements denoted: Marketable 10% (although may EUR. If asset Place of issue: EEA; Type of Assets be subject to fulfils the issuer/debtor/guarantor: central banks, Eligible for additional haircuts). BBB criteria, public sector, private sector, and use as If asset is rated then GBP, international and supernational institutions; collateral in BBB, and fulfils all JPY, and USD Place of establishment of: issuer - EEA (or Eurosystem other criteria, then a are also non-EEA G10) countries, debtor - EEA, Credit 22% haircut is permissible. guarantor - EEA. Acceptable Markets: Operations applicable instead. regulated markets (or non-regulated markets Eurosystem Standard Collateral Framework accepted by the ECB), Place of Settlement: Euro Area. Level A N/A N/A N/A Collateral Level B Yes: Haircuts GBP, EUR, Place of issue: EEA, UK, US (some Collateral depend on asset USD, AUD, restrictions may apply). (previously class and maturity. CAD, SEK Participant originated assets not allowed. denoted and CHF. Bank of England 'Wider collateral'). Level C Yes: Haircuts GBP, EUR, Place of issue: EEA, UK, US (some Collateral depend on asset USD, AUD, restrictions may apply) class and maturity. CAD, SEK and CHF. Discount Margins, based on USD, JPY, Window asset class and EUR, AUD, Eligible duration, are CAD, GBP, Federal Reserve Collateral. applied to the DKK, CHF FRB’s internal fair and SEK. market.[1] Sources: Bank of England Collateral Framework Sources: Bank of England (2010, 2013a, 2013b, and 2013c); Eurosystem Standard Collateral Framework Sources: European Central Bank, (2011, 2012, 2013a, 2013b, 2014); and Federal Reserve Discount Window Sources: Federal Reserve (2014a).
1. The Federal Reserve seeks to value all pledged collateral at internal fair market value estimate (IFMVE). Margins are applied to Feds IFMVE based on risk characteristics of pledged asset and anticipated volatility of IFMVE over estimated liquidation period. Securities typically valued using external vendors' prices. Eligible securities for which a vendor price cannot readily be obtained will be assigned an internally modelled price. Margins for securities are estimated using a Value-at-Risk analysis which develops margins from historical price volatility of asses within each collateral category. Securities margins are assigned based on asset type and duration. Any security not assigned a price by an external vendor receives the lowest margin for that asset type.
Table A3: Federal Reserve Discount Window & Payment System Risk Collateral Margins Margins for Securities (% of market value or internal fair market value Collateral Category[1] estimate)[2]
Duration Buckets Rating/Type 0-5 >5-10 >10
AAA 98% 95% 83% Asset Backed Securities BBB-AA 89% 86% 82%
Collateralised Debt Obligations AAA 92% 91% 90%
Commercial Mortgage Backed Securities AAA 97% 93% 92%
Agency Backed Mortgages[3] - Pass Throughs 98% 96% 95%
Agency Backed Mortgages[3] - CMOs 98% 96% 90%
Private Label CMOs - AAA rated AAA 90% 84% 83%
Term Deposit Facility - Term Deposits 100% Certificates of Deposit, Bankers' Acceptances, Commercial Paper, 97% ABCP Notes: Sources: Federal Reserve (2014b)
1. Obligations of the pledging depository institution are not eligible collateral
2. Eligible securities for which a third party price is not available are assigned an internally modelled value. The margin for the >10 duration bucket is applied to such securities.
3. Includes structured Guaranteed Notes issued by the FDIC or NCUA which may be backed by loans, RMBS, CMBS, or ABS.
Table A4: Eligible Collateral High Level Summary Table Intraday Operational Short- Indexed Discount Contingent Liquidity Standing Term Repo Long-Term Window Term repo Facilities Repo Facility Facility
Haircuts: Fixed Table A5: Summary of Securitisations Eligible as collateral for the Bank of England’s Operations Collateral Level Haircuts <1 1-3 3-5 5-10 10-20 20-30 >30 Level B Level C A Floating yr yrs yrs yrs yrs yrs yrs UK and EEA RMBS Yes (only the most senior tranches of Yes (the most senior tranches, No prime UK ad Dutch of the highest credit of credit quality broadly 12 12 14 15 17 19 22 24 quality broadly equivalent to AAA). equivalent to A3/A- or above) UK, US ad EEA ABS backed by credit cards Yes (the most senior tranches of the Yes (the most senior tranches, No highest credit quality, broadly equivalent of credit quality broadly 15 15 17 18 20 22 25 27 to AAA and must be prime). equivalent to A3/A- or above) UK, US and EEA ABS backed by Auto-Loans Yes (the most senior tranches of the Yes (the most senior tranches, and certain equipment leases No highest credit quality, broadly equivalent of credit quality broadly 15 15 17 18 20 22 25 27 to AAA and must be prime). equivalent to A3/A- or above) US ABS backed by student loans and consumer Yes (the most senior tranches of the Yes (the most senior tranches, loans No highest credit quality, broadly equivalent of credit quality broadly 15 15 17 18 20 22 25 27 to AAA and must be prime). equivalent to A3/A- or above) UK and EEA ABS backed by student loans and Yes (the most senior tranches, consumer loans No No of credit quality broadly 15 15 17 18 20 22 25 27 equivalent to A3/A- or above) UK, US and EEA CMBS. Securities containing Yes (the most senior tranches, construction loans will not be eligible. The pool No No of credit quality broadly 25 25 27 28 30 32 35 37 must be diversified. equivalent to A3/A- or above) UK, US and EEA covered bonds or ABS backed Yes (the most senior tranches, by certain export credit agency guarantee loans. of credit quality broadly No No 3 3 5 6 8 10 13 15 These will be subject to individual review. equivalent to A3/A- or above)
UK, US and EEA securitised portfolios of senior Yes (the most senior tranches, secured or on balance sheet corporate loans or of credit quality broadly No 20 20 22 23 25 27 30 32 SME loans. Leveraged loans are not permitted. equivalent to A3/A- or above and must be a diversified pool). UK, US and EEA securitised portfolios of Yes (the most senior tranches, corporate bonds. Portfolios containing high-yield of credit quality broadly No No 20 20 22 23 25 27 30 32 bonds are not permitted. equivalent to A3/A- or above and must be a diversified pool). Some types off UK, US and EEA ABCP of From 12-30 percentage points depending on the underlying asset credit quality broadly equivalent to a short term classes and the diversification of the pool. rating of A-1+/P1/F1+. Only the most senior paper will be accepted and the eligibility of No No Yes individual programmes must be agreed with the bank. Underlying assets must be of a type that is eligible for the operation. Notes: Sources: Bank of England (2012 and 2013d). Additional notes: 6pp is added to haircuts to allow for currency volatility when securities are non-sterling denominated. An additional 2ppt is added to JPY, AUD and NZD denominated securities to allow for higher exchange rate volatility. 5pp is added to eligible collateral for which no market price is observable. For the discount window facility a haircut add-on of 5 percentage points is applied to own-name eligible RMBS, CMBS, ABS and portfolios of corporate bonds. A haircut add-on may be applied to portfolios of corporate bonds that are not well diversified where the largest single bond concentration by market value exceeds 2% of the total market value of corporate bonds delivered. Note on calculation: adjusted collateral value (post-haircut) = collateral value * (100 – haircut)
Notes
[1] William Perraudin is a Director of RCL and Adjunct Professor of Imperial College. I thank Huaidong Wang and Thomas Wickstead for their comments and assistance with different aspects of the calculations. This paper was commissioned by Prime Collateralised Securities (PCS). I thank Ian Bell, Mark Lewis, Georges Duponcheele, Richard Hopkin and Alexander Batchvarov for their comments and insights. The views expressed in this paper are my own and not necessarily those of any of the individuals or organisations mentioned above. Any errors remain my own responsibility. Correspondence should be addressed to the author at william.perraudin@riskcontrollimited.com.
[2] The first version of this paper was prepared based on PCS’s January 2014 rule book. In June 2014, PCS revised this rule book and these changes are reflected in the current revised version of this paper. The changes do not affect the empirical results reported.
[3] GDP peak to trough declines for all the countries discussed in this paragraph are calculated using quarterly data on Real GDP with constant prices from Reuters Ecowin. In all cases, peak GDP occurred between Q3 2007 and Q1 2008 and trough GDP between Q2 and Q4 2009.
[4] The credit performance of European markets benefited from the fact that securitisation in Europe is typically performed in a vertically integrated fashion by regulated banks that originate, service and retain most of the risk in their securitised loans. In contrast, in the US market, especially in the past, originate-to-distribute business models have been more prevalent. The operation of this approach to lending is described in Ashcraft and Schuermann (2008a). By splitting the origination, servicing and risk bearing functions of bank lending between different organisations, the originate-to-distribute approach diluted incentives and produced conflicts of interest, leading to both moral hazard and adverse selection. A literature exists on the effect of securitisation on incentives in loan markets. Ashcraft and Schuermann (2008a, 2008b) describe the securitisation process as it operated in the US sub-prime market with a focus on incentive effects. Empirical studies of the impact on incentives may be found in Elul (2011), Keys, Mukherjee, Seru and Vig (2010), Mian and Sufi (2009), and Wang and Xia (2014). This literature is entirely based on US data and hence reflects the US approach to securitisation. The European securitisation market is somewhat different. First, asset pools behave differently because of the presence of recourse in lending. Second, an originate-to-distribute business model was never very common. Third, a higher fraction of origination was by regulated banking institutions.
[55] These were introduced in Europe through Article 122a of the Capital Requirements Directive effective from December 2010 and were then modified in the Capital Requirements Regulation (or CRR) which came into force in January 2014.
[6] EIOPA say “This source has several advantages: First, the criteria have been in place for many years and have gone through extensive operational and legal due diligence. Second, they represent for a part of the EU a kind of market standard. This should make it easier for originators to comply with them. Third, the criteria for banking and insurance sector should in principle be similar. […] Some of the ECB criteria provided a useful starting point but had to be adapted. Others impose restrictions on eligible jurisdictions that reflect the role of the ECB as central bank for the Euro area (e.g. US securitisations are not eligible). […] Additional sources were criteria developed by rating agencies and market participants.”
[7] After this filter is applied the securitisations remaining consist of the following types: CDO, CLO, CFO, Home Equity, Res B/C, Credit Card, Auto, Equipment Lease, Manufactured Housing, Student Loan, Airplane, Small Business and Other. Notes: Eligible currencies are listed in Footnote 18 to Table A1. Source: PCS (2014)
[8] A description of the proprietary algorithm used by Bloomberg to calculate bid-ask spreads is given in Appendix 1 of Perraudin (2014).
[9] ECB President, Mario Draghi, announced a Longer Term Refinancing Operations (LTROs) programme on December 8th, 2011 (see Draghi (2011)).
[10] In analysing asset class-specific liquidity based on MiFID transactions data (for making recommendations on LCR eligibility), EBA (2013) employs multiple indicators of liquidity but relies on imperfect proxies for the bid-ask spread. See Perraudin (2014) for comments on this approach.
[11] It is worth noting that the increasingly favourable treatment provided by regulators to Covered Bonds compared to securitisations is likely to have affected their respective levels of liquidity.
[12] In response the industry has developed a parallel set of proposals for regulatory capital. This approach, built on a number of principles including capital neutrality (before prudent add-ons) is set out in a comprehensive series of papers: Duponcheele et al (2013a), (2013b), (2013c), (2013d), (2014a), (2014b), and (2014c).
[13] Non-bank investors are much more significant fraction of the buy side in the US market and the bulk of residential securitisation activity is channelled through government agencies.
[14] To place this comment in context, note that in the case of a much studied major bank failure, namely Continental Illinois, the recovery rate on total liabilities has been estimated at 95% (see Kaufman, 1994). One may wonder what would be the fractional recovery value on unsecured liabilities for major European banks with extensive Covered Bond programs. f) Liquidity i. The initial principal amount outstanding of each tranche of the Securities is at Standards least: €100,000,000; £100,000,000; or US$100,000,000 or the Currency Equivalent amount of €100,000,000, where the tranche is denominated in Euros, pounds sterling, US dollars, or another Eligible currency[16], respectively. The Securities are denominated in one or more Eligible Currencies. ii. Except for Existing Securities which were issued more than 6 months prior to the award of the PCS label, the Issuer or the Originator undertakes that: A. it will disclose in the first investor report that follows the award of the PCS label the amount of the Securities: (i) privately-placed with investors which are not in the Originator Group; (ii) retained by a member of the Originator Group; and (iii) publicly-placed with investors which are not in the
[15] Eligible Jurisdictions are defined as: any jurisdiction in the European Economic Area and Switzerland.
[16] Eligible Currencies are defined as: (i) a currency of the European Economic Area; (ii) the US dollar; (iii) the Canadian dollar; (iv) the Japanese yen; (v) the Australian dollar; and (vi) the Swiss franc. h) General In order for Securities (other than certain specified cases) to be eligible for the PCS label, Underlying the Underlying Assets must meet the following criteria: Asset Standards i. The Underlying Assets belong to a single Eligible Asset[18] Class. (excluding the ii. The Underlying Assets are denominated in an Eligible Currency. Netherlands and iii. No broker intermediary or similar party (excluding multi-brand auto dealers) was UK Residential involved in the credit or underwriting decisions relating to the Underlying Assets. Mortgage iv. The Underlying Assets were originated in, and are governed by the laws of, an Loans) Eligible Jurisdiction. v. As at the Specified Date, each of the Underlying Assets (other than Overpaid Assets) has a positive net present value or outstanding principal balance. vi. The Underlying Assets have been originated, or originated and acquired, in an Eligible Jurisdiction in the ordinary course of the Originator’s business and in accordance with the underwriting procedures at the time of origination. vii. Each Underlying Asset and its Related Security is valid, binding and enforceable in accordance with its terms and non-cancellable. viii. (A) As at the Specified Date, and other than with respect to monthly payments falling within the scope of (B) below, no Obligor is, or has been, since the date of the relevant Underlying Asset, in material breach of any obligation owed in respect of the relevant Underlying Asset or under the Related
[17] The only exceptions are Dutch securities for which alternative rules are provided among jurisdiction specific rules and UK Residential Mortgage Loans for which alternative rules are included among the asset specific criteria.
[18] Eligible Asset Classes are defined as: (i) Auto Dealer Floorplan Loans; (ii) Auto Loans and Auto Leases; (iii) Consumer Loans; (iv) Credit Card Receivables; (v) Non-Auto Leases; (vi) Residential Mortgage Loans; and (vii) SME Loans. i) General For securities to be eligible for the PCS label, the transaction from which they arise must Representations, have documents which contain the following representations, warranties and undertakings Warranties and (other than certain specified cases). For Existing Securities, such representations, Undertakings warranties and undertakings may be explicit or implicitly contained in other, wider, (excluding the representations, warranties and undertakings. Netherlands and i. The Prospectus discloses (or, for Existing Securities only, either the Prospectus UK Residential discloses or the Issuer or the Originator undertakes in the Originator Certificate Mortgage that all subsequent Investor Reports will disclose) representations, warranties and Loans) undertakings given by the Originator in respect of the Underlying Assets on the following matters as at the Specified Date: A. Title and Ownership: The Originator has full right, good and valid title to the Underlying Assets and their associated ancillary rights, if applicable. B. Valid Asset Transfer: The Originator's interest in the Underlying Assets and the Related Security may be freely transferred without breaching any term or condition of the Underlying Asset Agreement. C. No Other Pledge: The receivables and their associated ancillary rights are not subject, either totally or partially, to any lien, assignment, charge, or pledge to any third parties. D. Compliance with Eligibility Criteria Set Out in the Transaction Documents: Collateral meets the eligibility criteria, representations and warranties or other conditions for sale. E. Financing Agreements’ Validity and Enforceability: Each Underlying Asset Agreement contains a legal, valid and binding obligation of the Obligor, enforceable in accordance with its terms, to pay the sums of money specified in it (other than an obligation to pay interest on overdue amounts). F. Origination: The Underlying Assets meet the standard origination and underwriting criteria of the Originator (subject only to such exceptions as would be acceptable to a reasonable, prudent mortgage lender). G. No Borrower Default: The Originator is not aware of any obligors in material Level A (e.g. highly liquid high- ✓ ✓ ✓ ✓ ✓ ✓ quality sovereign debt) Level B (e.g. liquid high quality sovereign × × × ✓ ✓ ✓ supranational, mortgage and corporate bonds) Level C (e.g., less liquid securitisations, × × × ✓ ✓ ✓ own-name securities and portfolios of loans) Notes: Sources: Bank of England (2013d)