

The European Banking Authority (EBA)has published proposals for a ‘rescaling’ or reduction in regulatory capital risk weights for securitisations that may be categorised as Simple, Standard and Transparent (SST)and that satisfy certain pool credit risk requirements (see EBA (2015)). The proposals suggest (a) adjustments in parameters of the formulae-based approaches contained in BCBS 303, (b) changes in the look-up table for the BCBS 303 ratings based approach and (c) lowered risk-weight floors for senior tranches. The EBA’s proposed re-calibration is reasonably effective in the case of the formula-based approaches. As we explain in this note, however, a combination of BCBS 303 rules, supervisory practices and ratings agencies’ views of European deals mean that the positive effect on securitisation activity in Europe is likely to be slight. Obvious and simple changes (spelt out in our conclusion) that involve reducing the reliance of the securitisation capital framework on agency ratings would transform the situation. But, unless European authorities take some action over and above what is currently proposed by EBA (2015) (specifically by reducing reliance on ratings or drastically modifying the current ratings based rules), volumes of placed deals will remain small, securitisation issuance will be the preserve of small to medium-sized banks with relatively little access to alternative funding, and the market will have to rely on US institutions as the main investors.
1. Introduction
The European Banking Authority (EBA) recently published a report to the European Commission (EC) on how so-called qualifying securitisations should be (a) defined and (b) treated in regulatory capital rules (see EBA (2015)). The EBA defines qualifying securitisations as those classable as Simple, Standard and Transparent (SST) and satisfying certain pool credit risk criteria. One may expect investing in them will be less risky.
The appropriate capital treatment of securitisations is an important area of financial regulation, especially for Europe. Securitisations played a significant role in funding the lending of European banks prior to the crisis. Since the crisis issuance of European securitisations placed with investors has been negligible. This is in contrast to the recovery in securitisation activity in some other jurisdictions, most notably the US.
Sluggish corporate investment and a scarcity of bank lending in some European countries have led policymakers in Europe to consider measures to revive the securitisation market. In March and May 2014, Bank of England and ECB (2014a) and (2014b) proposed that a category of High Quality Securitisations (HQS) be identified. The implicit suggestion was that these be treated preferentially in regulatory rules.
1 This note was prepared by William Perraudin, Director of Risk Control.
In October 2014, the EBA issued a discussion paper examining how an HQS category might be defined. The mission letter addressed to the incoming commissioner Jonathan Hill made it clear that, for the Commission, finding measures to revive the securitisation market was a priority (see Juncker (2014)). Following a public consultation, EBA (2015) set out the authority’s thinking on how to define qualifying securitisations and suggested an adjusted calibration of the BCBS 303 rules.
In this note, we comment on the EBA (2015) proposals. Our main point is that the EBA’s approach risks leaving the European securitisation market moribund since it fails to rectify key flaws in the BCBS rules. These flaws will “price” European banks out of the market by requiring overly conservative capital. Meanwhile, large US banks will face distinctly lighter capital requirements.
To understand the above argument requires that one grasp two facts.
1. Under the current BCBS 303 proposals, banks from Europe and the US will employ wholly different risk calculation approaches for their securitisation investments. Regulatory practice in Europe means that when the BCBS 303 rules come into effect, European banks will be obliged to employ the External Ratings Based Approach (ERBA) for almost all their securitisation capital calculations.[2] In contrast, following Dodd-Frank, US banks will instead employ the formula based approaches with large banks making extensive use of the Securitisation Internal Ratings Based Approach (SEC-IRBA) and smaller banks using the Securitisation Standardised Approach (SEC-SA).
2. The current BCBS 303 calibration and the adjusted version of it proposed by the EBA are much more conservative for European deals than the formula-based approaches. This feature of the calibration means that for much of the European market (including such subsectors as SME-backed deals and prime RMBS), only US banks will be able to invest with European banks remaining “priced out”. This situation will not be changed by the EBA proposals.
There are several possible solutions to the problems just described (which we discuss in the conclusion); but if the current EBA proposals are implemented without further adjustment, then one should be pessimistic that the European securitisation market will revive.
More generally, it is important to understand quite how broken is the intended regulatory framework set out in BCBS 303 even when it is modified as proposed in EBA (2015). The so-called Non-Neutrality Ratio (NNR),is defined as the ratio of (a) total capital for a bank holding all the tranches of a securitisation to (b) the capital for a bank holding all the underlying assets; The NNR is between 5 and 7 for many Italian and Spanish securitisations if a bank employs the BCBS 303 approach based on ratings. Securitisation, when it is prudently implemented, amounts to a repackaging of risk. In vertically integrated securitisation activities like those of large, well-regulated European banks, the additional risk attributable to agency effects (which may dilute incentives to manage and mitigate underlying assets appropriately) are minor.
So the starting point for the EBA’s recalibration should have been capital neutrality plus a reasonable capital premium, not the BCBS rules minus a capital discount. The problems are most acute in the capital calculations based on agency ratings. In this case, for many European deals, capital levels are prohibitive. While the EBA’s calibration moves the capital implied by the formula-based approaches to more reasonable levels, it leaves the capital based on ratings outside any range that could be viewed as sensible.
This note is organised as follows. Section 2 describes the nature of the EBA’s proposals and explains that continued reliance on agency ratings in securitisation capital is a major drawback of both BCBS 303 and the EBA’s suggested variant. Section 3 summarises aspects of the EBA’s quantitative impact analysis and Section 4 presents our own quantitative impact analysis, calculating risk weights implied by BCBS 303 and EBA (2015) for a large dataset of European securitisation tranches. Section 5 concludes.
2. The EBA Proposals
The context for EBA (2015) is the securitisation capital framework published by the Basel Committee in December 2014 (see BCBS 303). The Basel capital framework consists of a hierarchy of calculation approaches including two formula-based approaches (an Internal Ratings Based Approach (SEC-IRBA) and a
2 BCBS 303 suggests that a purchased receivables calculation of pool capital might facilitate wider use of the formula-based approach known as the SEC-IRBA. The general view of industry specialists is that, under current CRR rules and supervisory practices, it would be impossible for a bank to apply the purchased receivables approach to an asset class for which it is not an originator or sponsor.
Standardised Approach (SEC-SA)) and an approach based on agency ratings (the External Ratings Based Approach (SEC-ERBA)).
EBA (2015) proposes reductions in risk weights compared with those implied by the BCBS 303 rules for qualifying securitisations. The reductions are implemented in different ways depending on the capital approach in question. For the SEC-IRBA and the SEC-SA, a parameter, p, (which determines how conservative the approach is) would be halved (subject to a floor value for p of 0.3 in the case of the SEC-IRBA). The risk weight floors contained in BCBS 303 would also be adjusted down in the formula-based approaches. For the SEC-ERBA, the risk weight entries in the relevant look-up table would be reduced.
On the face of it, these changes would seem to imply substantial reductions in risk weight levels. One may define the Non-Neutrality Ratio (NNR) as the ratio of total capital for a bank that holds all the tranches to the capital for a bank that holds all the loans in the pool. The NNR is a natural measure of how conservative is a given set of capital rules. In the formulae-based BCBS 303 capital rules, the NNR equals the p parameter plus one. Halving the parameter p, therefore, amounts to halving the capital premium associated with securitisation (leaving aside the influence of risk weight floors).
The picture is more complicated, however, and one must interpret carefully the likely impact for the European market of the EBA proposals. Importantly, current European regulatory practice prevents banks in Europe from employing the SEC-IRBA, except for securitisations that they have originated or sponsored. The reason is that European regulators require banks to calculate the main input to the SEC-IRBA, pool capital (KIRB), subject to strict informational standards. In most cases, these standards can only be met by originators or sponsors. (In contrast, US regulators permit banks to estimate KIRB using proxy information.)
If a bank is unable to use the SEC-IRBA, the BCBS 303 rules require that it use the SEC-ERBA as long as this is permitted by the authorities in their jurisdiction and the exposure is rated. If the SEC-ERBA is not feasible, then the SEC-SA must be employed. This hierarchy of approaches means that, for European banks, the SEC- ERBA will be the predominant approach, while US banks will mainly use the SEC-IRBA if they are sophisticated and can obtain suitable proxy data to calculate KIRB, and will otherwise employ the SEC-SA.
We have argued elsewhere (see Duponcheele, Perraudin and Totouom-Tangho (2014)) that agency ratings are a poor basis for securitisation capital calculations. Ratings agency methodologies for securitisations have at times fluctuated wildly since the crisis leading to great volatility and pro-cyclicality in bank capital. Since the crisis, ratings agencies have generally increased the conservatism of their methodologies. European securitisations have been treated particularly conservatively because of (i) mechanical ceilings on securitisation ratings based on sovereign ratings and (ii) the particularly conservative treatment that the ratings agencies apply to some sub-sectors, for example to the key subsector of SME-loan-backed deals. This is despite the fact that cumulative delinquency rates in the European market since the crisis have been negligible except for CMBS and CDOs exposed to US-related exposures.
In principle, one might aim to calibrate rules like those in BCBS 303 and EBA (2015) so that the capital implied by ratings and formula-based approaches are similar. However, there is a fundamental difficulty: the inputs to formulae-based and ratings based calculations reflect very different views of risk, namely those of regulators and agencies, respectively. This means that the different approaches lead to quite different relative capital levels across jurisdictions and market sectors. Even if an initial calibration generated equivalent capital from ratings and formula-based approaches to start with, over time they will move apart (as they have since the crisis) as ratings agencies methodologies have change.
While instituting capital rules based on inconsistent alternative calculation approaches is never likely to be ideal, it mattered less in Basel II because capital for the large majority of the market was worked out using the ratings based approach. The BCBS 303 rules combined with Dodd-Frank have the implication that half the world’s major banks use a totally different approach to capital calculation for securitisations than the other half. From a public policy perspective, this is a disastrous feature of the BCBS 303 rules.
A true picture of how the EBA’s proposals will affect the European market may only be obtained by looking at their implications for actual securitisations. The EBA itself has performed a quantitative impact analysis using securitisation deals included by banks in the European Data Warehouse (EDW). The majority of these deals are not actual securitisations issued by banks seeking investment from the market. Instead they are deals that banks intend to retain, created solely to generate collateral that can be pledged in order to secure central bank funding. Such retained securitisations differ in structure from typical placed deals that are actually sold to investors in that they generally have a larger first loss piece and no mezzanine tranches. In the next section, we summarise the EBA’s own quantitative impact analysis of their proposals and then, in the following section, present a quantitative impact analysis based on a large data set of actual European securitisations placed with investors.
3. EBA Analysis of EDW Securitisations
EBA (2015) examines the effects of the EBA’s rescaling of the BCBS 303 risk weight rules for European securitisations that are likely to qualify as Simple, Standard and Transparent (SST). Specifically, the EBA calculates the capital implied by rescaled versions of the three different BCBS 303 approaches for a dataset of securitisations contained in the European Data Warehouse (EDW).
Figure 1 (reproduced from EBA (2015)) summarises the EBA’s findings. The figure shows ‘whisker plots’ of Non-Neutrality Ratios for over 2,000 securitisation tranches. In such whisker plots, the bottom and top of the bars show, respectively, the 25% and 75% quantiles of the distribution of non-neutrality ratios, while the extreme points on the lines correspond to the 10% and 90% quantiles. The vertical level corresponding to the mid-point of each bar shows the NNR for the median tranche in the data set for the capital calculation approach in question.
The figure leads to two conclusions.
1. The SEC-ERBA for European securitisations is on average much more conservative than the SEC-SA or the SEC-IRBA, either before or after the EBA’s rescaling. From the figure, the reduction in risk weights implied by the EBA’s rescaling is much smaller for SEC-ERBA-based risk weights than for those implied by the SEC-IRBA or the SEC-SA. EBA (2015) provides some summary figures on this. The average reduction in risk weights implied by the EBA’s proposed rescaling are 29%, 7% and 28% for the SEC-IRBA, SEC-ERBA and SEC-SA respectively. In a footnote, the EBA suggests that its findings are biased by the fact that the exercise uses EDW tranches lacking in mezzanines and with larger first loss tranches. If one restricts the calculation to tranches issued prior to 2008 (which would be destined for placement rather than retention), the average reduction in SEC-ERBA risk weights is 14%.
2. The variation of the NNR across securitisations is much greater for the SEC-ERBA than for the formula-based approaches. This is because the SEC-ERBA reflects ratings agency judgments on relative risk whereas the formulae-based approaches reflect regulatory views of risk. Since pool capital is obviously based on regulators’ views of risk, agency ratings inject considerable noise in the NNR. In some areas of the market, ratings agencies are not at all conservative (for example, they rate German auto loan backed deals very favourably), whereas, in other areas, they are highly conservative. (For example, European SME-loan-backed deals are rated using criteria similar to those employed for leveraged loans.)
In view of the considerable effort exerted by European regulators in identifying a qualifying securitisation category and then recalibrating capital charges for this category, a 7% or even a 14% reduction in risk weights for the SEC-ERBA (the approach that will be mainly used by European banks to calculate capital) appears very small. One may doubt it would significantly boost the securitisation market in Europe.
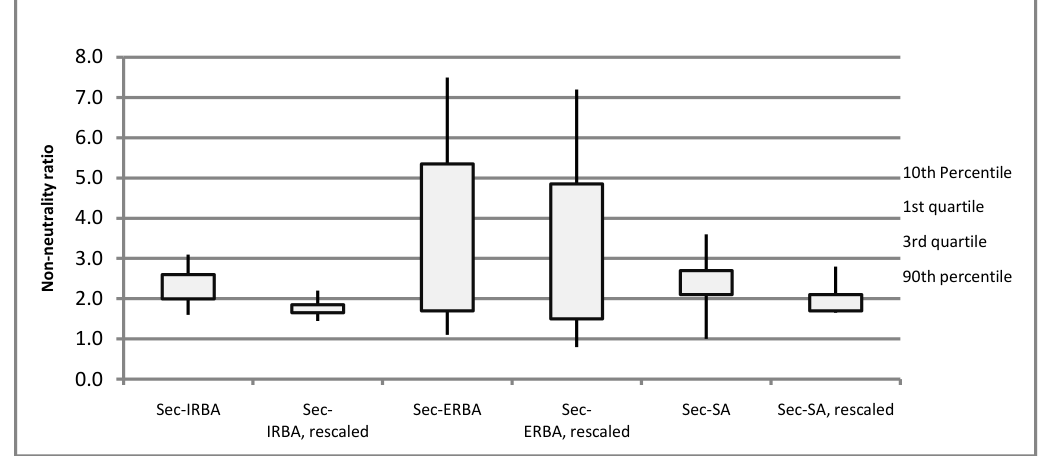
Note: Source EBA (2015). The figure displays statistics of the distribution of non-neutrality ratios for over 2,000 securitisation deals contained in the European Data Warehouse (EDW). The non-neutrality ratio for a given securitisation under a particular capital treatment equals the ratio of (i) the capital requirement a bank must meet if it holds all the tranches in a securitisation to (ii) the capital it must maintain if it owns the assets in the securitisation pool. The plots show the 25% and 75% quantiles (the bottom and top level of the bars) and the 10% and 90% quantiles (the extreme points on the lines). The quantiles are shown for cases before and after the EBA ‘re-scaling’ of capital charges is performed and for the three approaches contained in BCBS 303, namely the SEC-IRBA, SEC-ERBA and the SEC-SA.
4. Quantitative Impact Analysis of Placed Securitisations
4.1 The data
This section presents calculations of risk weights under the BCBS 303 rules and under the EBA (2015) variants. The sample of securitisation tranches employed in the calculations is described in Duponcheele, Linden and Perraudin (2014). The dataset consist of 1,771 European securitisation tranches drawn from three subsectors of the market: (i) prime RMBS, (ii) SME loan-backed securitisations, and (iii) Other Retail loanbacked securitisations (mainly comprising credit card receivables and auto loan backed deals). Of the 1,771 tranches, 550 are the most senior in the securitisation in question, 943 are mezzanine tranches, and 278 are junior tranches.[3]
3Note that most senior category is based on being at the highest point in the seniority structure whereas the mezzanine and junior classifications are based on the Intex flags ‘MEZ’ and ‘JUN’.
Table 1 shows average and par-weighted-average risk weights for the 1,771 tranches separated into the three subsectors. The tranches considered in Table 1 are, in all cases, the most senior in the securitisation in question.
The risk weights employed in the averages are calculated using multiple approaches. These include the SEC- IRBA, SEC-ERBA and SEC-SA in the BCBS 303 and EBA (2015) variants. Also shown in Table 1 are risk weight averages based on the existing, Basel II approaches: the Ratings Based Approach (RBA), the Basel II Standardised Approach (which employs agency ratings) and the Supervisory Formula Approach (SFA). Finally, Table 1 shows averages based on the Conservative Monotone Approach (CMA) in versions with IRBA and SA pool capital inputs. The CMA is a rigorous, closed form capital model described in Duponcheele, Linden and Perraudin (2014) and used in that study to evaluate or benchmark the ad hoc approaches employed in different proposed capital rules.
Tables 2 and 3 show results comparable to those in Table 1 except for mezzanine and junior tranches.
The main conclusions suggested by the results in Tables 1 and 2 are as follows.
1. For senior tranches, risk weights under the SEC-IRBA and SEC-SA are less than a quarter of those implied by the SEC-ERBA. This ratio appears slightly largely even after the EBA’s rescaling. This means that, if the banks are not originators or sponsors, a large US bank investing in an Italian mortgage deal (and having permission to use the SEC-IRBA) will be required to hold one quarter of the capital of an Italian or French bank that makes the same investment. For non-senior tranches, the discrepancy between SEC-IRBA and SEC-ERBA average risk weights is slightly less but still substantial especially when par-weighted-averages are used.
2. The proportional impact on risk weights of the EBA’s rescaling is a little over a third for most senior tranche SEC-IRBA risk weight averages shown in Table 1 and between a quarter and a third for the SEC-ERBA risk weight averages in the same table. The impact on EBA rescaling for non-senior tranches (shown in Table 2) is more variable.
3. Comparing the existing Basel II rules with those in BCBS 303, the SEC-ERBA is much more conservative than the RBA for senior SME and Other Retail tranches but not for RMBS. The differences are varied for non-senior tranches in that the RBA is more conservative in some cases and less in others. The SFA (which is currently used on a wide scale by US IRBA banks) is much less conservative than any other approach.
4. The CMA results are in line with the rescaled SEC-IRBA and SEC-SA when applied to senior tranches. This is as one might expect since the CMA is here implemented using the re-scaled floors suggested by the EBA and these floors mostly bind for senior tranches. For non-senior tranches for which the floor does not bind, it is interesting to note that the CMA yields risk weights somewhat similar to the rescaled SEC-IRBA and SEC-SA when IRBA and SA inputs are respectively employed except that the CMA is a bit more conservative for mezzanine tranches and less conservative for junior tranches.
Figures 2, 3, and 4 show the distribution of risk weights for individual tranches based on different approaches using plots and histograms. Each figure presents a comparison of two different approaches. Figure 2 shows comparisons of the SEC-ERBA and SEC-IRBA after rescaling consistent with EBA (2015). Figure 3 compares the rescaled SEC-SA with the rescaled SEC-IRBA. Figure 4 presents comparisons between the rescaled SEC- SA and the rescaled SEC-ERBA.
In each of the three figures, the risk weights by tranche based on two different approaches are compared. For example, in Figure 2, the rescaled SEC-ERBA and SEC-IRBA risk weights are measured in the vertical and horizontal dimensions, respectively. The lower panels in each of the three figures show histograms of the differences in risk weights for individual tranches calculated using the two approaches being examined.
For both the scatter plots and histograms, the left hand panel contains results for all tranches and the right hand panel shows results for those tranches that have risk weights less than 200% as measured by both of the approaches in question.
Figure 2 shows the disjointed nature of the SEC-ERBA and the SEC-IRBA. While there is some overall positive association between the points plotted when all the tranches are considered (see the upper left hand panel), the two approaches yield very different patterns of risk weights. Plenty of examples appear in which risk weights are very low under one approach while the other approach suggests risk weights close to deduction (i.e., risk weights of 1,250%). When one focuses on higher quality tranches (with risk weights less than 200% for both approaches), it is clear that the SEC-ERBA is very substantially more conservative than the SEC- IRBA. Almost all the points in the upper right hand panel lie above the diagonal and in the lower right hand panel, almost all the observations shown in the histogram lie to the right of zero.
Figure 3 presents comparisons of the SEC-SA and the SEC-IRBA. These approaches seem reasonably coherent. This is borne out by the large spikes that appear around zero in the lower panels. The upper panels suggest positive associations between the two approaches. (Note that, in the upper panels, a single point may represent multiple observations so it is better to base assessments on the histograms in the lower panels.)
Figure 4 compares the SEC-SA and the SEC-ERBA. Again, the approaches yield risk weights that bear little relation one to another and, again, the ratings based approach appears much more conservative than the formula-based approaches for the European securitisation market.
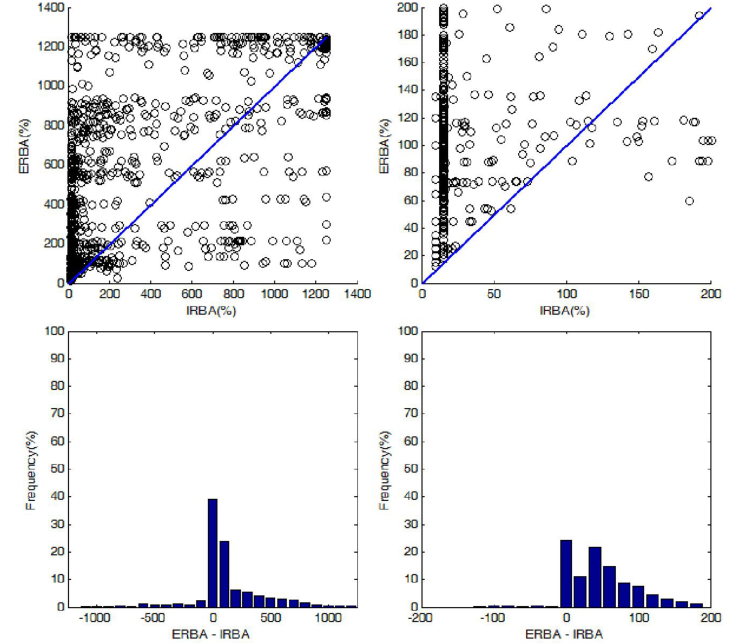
Note: The above figure displays plots and histograms comparing the risk weights implied by the rescaled SEC-ERBA and the rescaled SEC-IRBA for 1,771 European tranches. The upper panels show scatter plots in which the vertical and horizontal coordinates of points represent the risk weights implied by the SEC-ERBA and SEC-IRBA approaches respectively. The lower panels contain histograms of differences for each tranche between the SEC-ERBA and SEC- IRBA risk weights. The left hand panels display data for all tranches in the sample. The right hand panels show results for tranches for which both approaches imply risk weights less than 200%.

Note: The figure displays comparisons between the SEC-SA and the SEC- IRBA. In other respects the figure resembles Figure 3 so information in the note to that figure applies.
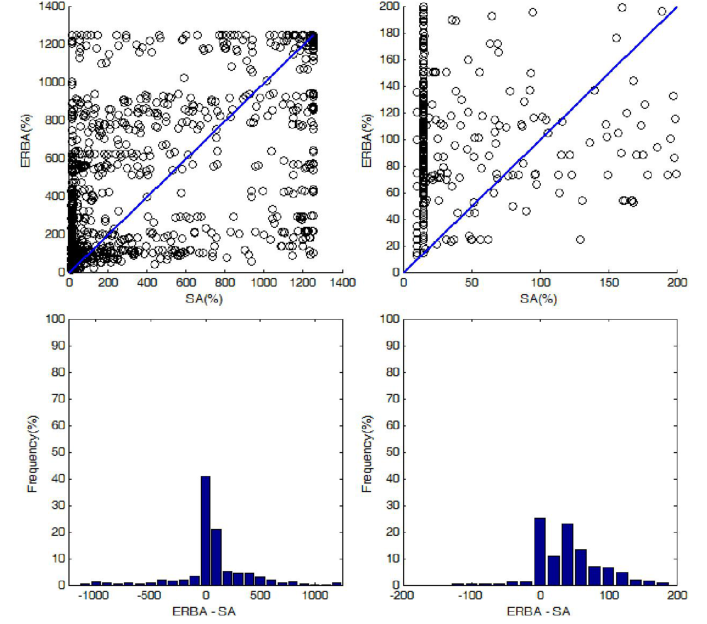
Note: The figure displays comparisons between the SEC-SA and the SEC- ERBA. In other respects the figure resembles Figure 3 so information in the note to that figure applies.
| Mean | IRBA | ERBA | SA | IRBA | ERBA | SA | RBA | SA | SFA | CMA | CMA |
|---|---|---|---|---|---|---|---|---|---|---|---|
| (BCBS | (BCBS | (BCBS | (EBA) | (EBA) | (EBA) | (RB) | (IRB) | (SA) | |||
| 303) | 303) | 303) | |||||||||
| RMBS | 16% | 65% | 16% | 10% | 47% | 10% | 67% | 90% | 7% | 10% | 10% |
| SME | 15% | 67% | 16% | 10% | 45% | 10% | 21% | 51% | 7% | 10% | 10% |
| Other Retail | 15% | 30% | 20% | 10% | 21% | 11% | 10% | 26% | 7% | 10% | 10% |
| Weighted | IRBA | ERBA | SA | IRBA | ERBA | SA | RBA | SA | SFA | CMA | CMA |
| Average | (BCBS | (BCBS | (BCBS | (EBA) | (EBA) | (EBA) | (RB) | (IRB) | (SA) | ||
| 303) | 303) | 303) | |||||||||
| RMBS | 16% | 59% | 16% | 10% | 43% | 10% | 67% | 88% | 7% | 10% | 10% |
| SME | 15% | 66% | 16% | 10% | 44% | 10% | 22% | 50% | 7% | 10% | 10% |
| Other Retail | 15% | 27% | 18% | 10% | 19% | 10% | 8% | 22% | 7% | 10% | 10% |
Note: This table displays means and weighted averages for the Most Senior tranches of three asset classes under a number of proposed regulatory approaches. Weighted averages are based on par values. Results are given for three securitisation sub-sectors: RMBS, SME Loan-backed and Other Retail loan backed securitisations. Results are provided for the three BCBS 303 approaches: SEC-IRBA, SEC-ERBA and SEC-SA and for their variants following EBA (2015) rescaling. Also, results are provided for the three Basel II approaches: RBA, SA(RB) and SFA and for versions of the Conservative Monotone Approach described by Duponcheele, Linden and Perraudin (2014) using both IRBA and SA pool capital inputs.
| Mean | IRBA | ERBA | SA | IRBA | ERBA | SA | RBA | SA | SFA | CMA | CMA |
|---|---|---|---|---|---|---|---|---|---|---|---|
| (BCBS | (BCBS | (BCBS | (EBA) | (EBA) | (EBA) | (RB) | (IRB) | (SA) | |||
| 303) | 303) | 303) | |||||||||
| RMBS | |||||||||||
| 309% | 492% | 404% | 203% | 414% | 300% | 432% | 430% | 102% | 247% | 260% | |
| SME | |||||||||||
| 170% | 429% | 325% | 145% | 366% | 219% | 407% | 418% | 105% | 177% | 143% | |
| Other Retail | |||||||||||
| 144% | 236% | 328% | 94% | 195% | 245% | 174% | 186% | 49% | 118% | 182% | |
| Weighted | IRBA | ERBA | SA | IRBA | ERBA | SA | RBA | SA | SFA | CMA | CMA |
| Average | (BCBS | (BCBS | (BCBS | (EBA) | (EBA) | (EBA) | (RB) | (IRB) | (SA) | ||
| 303) | 303) | 303) | |||||||||
| RMBS | |||||||||||
| 94% | 267% | 153% | 59% | 213% | 101% | 247% | 251% | 27% | 81% | 82% | |
| SME | |||||||||||
| 85% | 289% | 187% | 68% | 238% | 113% | 267% | 276% | 43% | 88% | 72% | |
| Other Retail | |||||||||||
| 44% | 112% | 102% | 27% | 87% | 65% | 102% | 113% | 14% | 33% | 54% |
Note: This table displays means and weighted averages for mezzanine tranches for three asset classes under a number of proposed regulatory approaches. In other respects, the results in the table are comparable to those in Table 1.
| Mean | IRBA | ERBA | SA | IRBA | ERBA | SA | RBA | SA | SFA | CMA | CMA |
|---|---|---|---|---|---|---|---|---|---|---|---|
| (BCBS | (BCBS | (BCBS | (EBA) | (EBA) | (EBA) | (RB) | (IRB) | (SA) | |||
| 303) | 303) | 303) | |||||||||
| RMBS | |||||||||||
| 774% | 791% | 828% | 654% | 710% | 736% | 747% | 743% | 465% | 627% | 643% | |
| SME | |||||||||||
| 590% | 816% | 757% | 544% | 756% | 660% | 948% | 922% | 474% | 592% | 539% | |
| Other Retail | |||||||||||
| 426% | 355% | 635% | 324% | 314% | 534% | 276% | 297% | 234% | 305% | 428% | |
| Weighted | IRBA | ERBA | SA | IRBA | ERBA | SA | RBA | SA | SFA | CMA | CMA |
| Average | (BCBS | (BCBS | (BCBS | (EBA) | (EBA) | (EBA) | (RB) | (IRB) | (SA) | ||
| 303) | 303) | 303) | |||||||||
| RMBS | |||||||||||
| 390% | 528% | 419% | 311% | 483% | 352% | 548% | 554% | 202% | 299% | 310% | |
| SME | |||||||||||
| 376% | 631% | 537% | 329% | 561% | 431% | 777% | 742% | 267% | 356% | 328% | |
| Other Retail | |||||||||||
| 309% | 344% | 489% | 236% | 301% | 402% | 267% | 295% | 165% | 232% | 304% |
Note: This table displays means and weighted averages for junior tranches for three asset classes under a number of proposed regulatory approaches. In other respects, the results in the table are comparable to those in Table 1.
5. Conclusion
The results in Section 4 show that while the EBA re-calibration does lower risk weights, ratings based capital remains excessively conservative. European banks will continue to be priced out of investing in European securitisations. The main beneficiary of the EBA’s proposals, if they were to be adopted by Basel, may be US banks which will alone be in a position to invest in European securitisations.
There are three possible solutions to this problem.
1. Regulatory practice in Europe could be altered, permitting advanced banks to employ the SEC-IRBA with inputs based on proxy data, as is permitted for US banks.
2. European authorities could follow the example of the US in ruling out the use of ratings based approaches to securitisation capital.
3. Europe could implement a version of the BCBS 303 rules in which the hierarchy of approaches is changed so that the SEC-IRBA and SEC-SA come above the SEC-ERBA. All three approaches could be implemented in versions that (a) apply only to qualifying securitisations or (b) apply to the whole market.
The different solutions all have pros and cons. Solution 1 would be consistent with Basel but would involve a major alteration in the mind set of European regulators. This solution would still leave SA banks in Europe priced out of much of the European securitisation market.
Solution 2 would permit both IRBA and SA banks in Europe to compete on an equal playing field with US banks and would be consistent with Basel. It would require European regulators to follow their own declared policy of reducing regulatory reliance on agency ratings which, so far, they have been very slow to do.
Solution 3 would be similar to Solution 2 in effect but would be inconsistent with Basel as set out in BCBS 303. It would have the advantage over 2 that it would leave the ratings based approach as a fall back. This is potentially useful as there will always be some securitisations for which pool capital is less obvious to calculate and for which a formula-based approach (whether SA or IRBA in nature) is not obvious.
Logically, regulators could address the weaknesses of the ERBA directly by a wholesale redesign and recalibration. This might include requiring the ratings agencies to strip out the effects of sovereign ratings ceilings on securitisations and reassessing the look-up table. In the current environment, we see this as impractical and, hence, have not included it as a ‘fourth solution’ in the above list.
Note that we do not address in this note the definition of ‘qualifying securitisations.’ The EBA (2015) proposals contain some questionable exclusions from this category, perhaps the most notable being synthetic securitisations. This is baffling to many who work in the field as, in many cases, synthetic deals are the most transparent and straightforward structures of all.
To conclude, the European authorities would be ill-advised to implement the EBA (2015) proposals in their current form. Without the adoption of one of the three approaches listed above, their efforts to revive the European market are unlikely to be successful. Securitisation volumes will remain low, only small and medium-sized banks will issue and the main investors will be US institutions. This is surely not what the Commission, EBA and European central banks desire.
6. References
Bank of England and European Central Bank (2014a) “The Impaired EU Securitisation Market: Causes, Roadblocks and How to Deal With Them,” Bank of England and European Central Bank Joint Statement, March.
Bank of England and European Central Bank (2014b) “The Case for a Better Functioning Securitisation Market in the European Union: A Discussion Paper,” May.
Duponcheele, G., A. Linden and W. Perraudin (2014) “How to Revive the European Securitisation Market: a Proposal for a European SSFA,” BNPParibas mime, November, available at: http://www.riskcontrollimited.com/wp-content/uploads/2015/02/How_to_Revive_the_European_Securitis ation_Market.pdf.
Duponcheele, Georges, William Perraudin and Daniel Totouom-Tangho (2014) “Reducing the Reliance of Securitisation Capital on Agency Ratings,” BNP Paribas mimeo, February, available at: http://www.riskcontrollimited.com/public/Reducing_the_Reliance.pdf.
European Banking Authority (2015) “EBA Report on Qualifying Securitisation – Response to the Commission’s Call for Advice of January 2014 on Long-term Financing,” July.
Juncker, Jean-Claude (2014) “Mission Letter, Jonathan Hill, Commissioner for Financial Stability, Financial Services and Capital Markets Union,” Letter to Jonathan Hill, 10th September.
Basel Committee on Banking Supervision (2014) “Revisions to the Securitisation Framework,” Basel III Document, 303, December.
7. Appendix
Tables A1, A2, and A3 present rank order correlations between the risk weights implied by the different approaches when applied to: the most senior tranches, Table A1; the other (i.e., non-senior) tranches, Table A2; and all tranches with risk weights less than 200% for the two risk weight calculation approaches employed, Table A3.[4]
Table A1 shows the dramatically disjointed nature of risk weights based on regulatory and rating agency views of risk. High rank order correlations may be observed between the ratings based approaches. Similarly, the formula based approaches have reasonably high rank order correlations. But, the formula and ratings-based approaches have close to zero rank order correlations. It is interesting to note that the CMA and formulabased approaches have reasonably high rank order correlations, especially after the EBA rescaling.
Table A1: Most Senior Tranche Correlations IRBA ERBA SA IRBA ERBA SA RBA SA SFA CMA CMA (BCBS (BCBS (BCBS (EBA) (EBA) (EBA) (RB) (IRB) (SA) 303) 303) 303) IRBA (BCBS 303) 1.00 0.20 0.32 0.45 0.20 0.40 0.20 0.20 0.06 0.32 0.45 ERBA (BCBS 303) 0.20 1.00 0.15 0.05 0.99 0.02 1.00 0.95 0.01 0.03 -0.01 SA (BCBS 303) 0.32 0.15 1.00 0.31 0.15 0.35 0.16 0.14 0.09 0.22 0.32 IRBA (EBA) 0.45 0.05 0.31 1.00 0.06 0.67 0.05 0.04 0.15 0.71 0.75 ERBA (EBA) 0.20 0.99 0.15 0.06 1.00 0.02 0.99 0.96 0.00 0.04 0.00 SA (EBA) 0.40 0.02 0.35 0.67 0.02 1.00 0.02 0.01 0.06 0.63 0.89 RBA 0.20 1.00 0.16 0.05 0.99 0.02 1.00 0.95 0.01 0.03 -0.01 SA (RB) 0.20 0.95 0.14 0.04 0.96 0.01 0.95 1.00 0.00 0.04 -0.02 SFA 0.06 0.01 0.09 0.15 0.00 0.06 0.01 0.00 1.00 0.11 0.09 CMA (IRB) 0.32 0.03 0.22 0.71 0.04 0.63 0.03 0.04 0.11 1.00 0.71 CMA (SA) 0.45 -0.01 0.32 0.75 0.00 0.89 -0.01 -0.02 0.09 0.71 1.00
Comparable patterns are apparent in Tables A2 and A3 in the relative magnitudes of rank order correlations although the average levels of the rank order correlations are much higher in Table A2 which shows nonsenior tranches. The levels in Table A3 (which shows results for tranches with risk weights less than 200% based on both the calculation approaches under consideration) are intermediate in magnitude.
Table A2: Mezzanine Tranche Correlations IRBA ERBA SA IRBA ERBA SA RBA SA SFA CMA CMA (BCBS (BCBS (BCBS (EBA) (EBA) (EBA) (RB) (IRB) (SA) 303) 303) 303) IRBA (BCBS 303) 1.00 0.70 0.83 0.94 0.69 0.82 0.58 0.58 0.48 0.85 0.86 ERBA (BCBS 303) 0.70 1.00 0.61 0.65 1.00 0.58 0.95 0.94 0.36 0.65 0.55 SA (BCBS 303) 0.83 0.61 1.00 0.81 0.61 0.96 0.51 0.52 0.46 0.86 0.90 IRBA (EBA) 0.94 0.65 0.81 1.00 0.64 0.82 0.55 0.56 0.54 0.89 0.86 ERBA (EBA) 0.69 1.00 0.61 0.64 1.00 0.58 0.96 0.95 0.36 0.65 0.54 SA (EBA) 0.82 0.58 0.96 0.82 0.58 1.00 0.49 0.49 0.47 0.89 0.93 RBA 0.58 0.95 0.51 0.55 0.96 0.49 1.00 0.99 0.33 0.58 0.44 SA (RB) 0.58 0.94 0.52 0.56 0.95 0.49 0.99 1.00 0.33 0.59 0.45 SFA 0.48 0.36 0.46 0.54 0.36 0.47 0.33 0.33 1.00 0.50 0.47 CMA (IRB) 0.85 0.65 0.86 0.89 0.65 0.89 0.58 0.59 0.50 1.00 0.89 CMA (SA) 0.86 0.55 0.90 0.86 0.54 0.93 0.44 0.45 0.47 0.89 1.00 Note: This table displays rank order correlations similar to those reported in Table A1 except based on mezzanine tranches other than the Most Senior in their respective transactions.
Table A3: Junior Tranche Correlations IRBA ERBA SA IRBA ERBA SA RBA SA SFA CMA CMA (BCBS (BCBS (BCBS (EBA) (EBA) (EBA) (RB) (IRB) (SA) 303) 303) 303) IRBA (BCBS 303) 1.00 0.65 0.86 1.00 0.63 0.86 0.49 0.49 0.93 0.85 0.80 ERBA (BCBS 303) 0.65 1.00 0.52 0.65 1.00 0.50 0.91 0.91 0.60 0.68 0.51 SA (BCBS 303) 0.86 0.52 1.00 0.86 0.50 1.00 0.39 0.39 0.80 0.84 0.91 IRBA (EBA) 1.00 0.65 0.86 1.00 0.64 0.86 0.51 0.51 0.94 0.86 0.80 ERBA (EBA) 0.63 1.00 0.50 0.64 1.00 0.49 0.92 0.92 0.60 0.67 0.50 SA (EBA) 0.86 0.50 1.00 0.86 0.49 1.00 0.38 0.38 0.80 0.84 0.91 RBA 0.49 0.91 0.39 0.51 0.92 0.38 1.00 0.99 0.46 0.56 0.38 SA (RB) 0.49 0.91 0.39 0.51 0.92 0.38 0.99 1.00 0.47 0.56 0.38 SFA 0.93 0.60 0.80 0.94 0.60 0.80 0.46 0.47 1.00 0.81 0.75 CMA (IRB) 0.85 0.68 0.84 0.86 0.67 0.84 0.56 0.56 0.81 1.00 0.92 CMA (SA) 0.80 0.51 0.91 0.80 0.50 0.91 0.38 0.38 0.75 0.92 1.00 Note: This table displays rank order correlations similar to those reported in Table A1 except based on junior tranches other than the Most Senior in their respective transactions.
Table A4: Tranche Correlations where Risk Weights are less than 200% IRBA ERBA SA IRBA ERBA SA RBA SA SFA CMA CMA (BCBS (BCBS (BCBS (EBA) (EBA) (EBA) (RB) (IRB) (SA) 303) 303) 303) IRBA (BCBS 303) 1.00 0.30 0.52 0.53 0.30 0.55 0.21 0.12 -0.05 0.41 0.60 ERBA (BCBS 303) 0.30 1.00 0.42 0.11 0.99 0.25 0.89 0.71 -0.06 0.10 0.13 SA (BCBS 303) 0.52 0.42 1.00 0.29 0.41 0.67 0.35 0.20 0.05 0.34 0.49 IRBA (EBA) 0.53 0.11 0.29 1.00 0.11 0.42 0.08 0.03 -0.03 0.49 0.45 ERBA (EBA) 0.30 0.99 0.41 0.11 1.00 0.25 0.89 0.74 -0.07 0.10 0.13 SA (EBA) 0.55 0.25 0.67 0.42 0.25 1.00 0.20 0.08 -0.02 0.50 0.68 RBA 0.21 0.89 0.35 0.08 0.89 0.20 1.00 0.86 -0.03 0.11 0.06 SA (RB) 0.12 0.71 0.20 0.03 0.74 0.08 0.86 1.00 -0.05 0.09 -0.03 SFA -0.05 -0.06 0.05 -0.03 -0.07 -0.02 -0.03 -0.05 1.00 -0.01 -0.01 CMA (IRB) 0.41 0.10 0.34 0.49 0.10 0.50 0.11 0.09 -0.01 1.00 0.44 CMA (SA) 0.60 0.13 0.49 0.45 0.13 0.68 0.06 -0.03 -0.01 0.44 1.00
Notes
Note: This table displays the rank order correlations between the capital implied by pairs of approaches for the Most Senior tranches in the dataset. The approaches used in calculating capital are listed in the note to Table 1.
[4] Rank order correlations are calculated by attributing to each tranche an integer-valued order based on a given pair of risk weight calculation approaches and then calculating the linear correlation of these order-variables for the individual tranches. This gives a measure of correlation that is unaffected by non-linear, monotonic transformations of the underlying variables. Note: This table displays rank order correlations similar to those reported in Table A1 but for tranches that have risk weights less than 200% for each of the two approaches being considered for a given comparison of approaches. Risk Control Limited 13-14 Dean Street London, W1D 3RS, +44 (0)203 307 0730www.riskcontrollimited.com