

This study examines the relative liquidity of Asset Backed Securities (ABS), Covered Bonds (CBs) and Corporate Bonds (Corps). The measure of liquidity that we employ is half the bid-ask spread divided by the mid-price. This equals half the round-trip cost of buying and selling the security per unit of value of the position as reflected in current market quotes. We focus on Investment Grade (IG), GBP-denominated securities and senior ABS. We compare the liquidity of different categories of ABS, namely Simple Transparent and Standardised (STS) versus non-STS ABS. To compare the liquidity of any two categories of security, we compute the cost of an average transaction for all individual securities. For this, we utilise all the observations available on Bloomberg for the period March 2012 to June 2021. Transactions costs are defined as half the bidask spread, divided by the mid-price.
Executive summary
This study examines the relative liquidity of Asset Backed Securities (ABS), Covered Bonds (CBs) and Corporate Bonds (Corps). The measure of liquidity that we employ is half the bid-ask spread divided by the mid-price. This equals half the round-trip cost of buying and selling the security per unit of value of the position as reflected in current market quotes. We focus on Investment Grade (IG), GBP-denominated securities and senior ABS. We compare the liquidity of different categories of ABS, namely Simple Transparent and Standardised (STS) versus non-STS ABS. To compare the liquidity of any two categories of security, we compute the cost of an average transaction for all individual securities. For this, we utilise all the observations available on Bloomberg for the period March 2012 to June 2021. Transactions costs are defined as half the bidask spread, divided by the mid-price.
Key findings are as follows.
• Mean transactions costs are very similar for AAA and AA-rated ABS and CB. Mean transaction costs for Corps with equivalent ratings to those of ABS or CBs are somewhat higher.
• Looking at detailed comparisons based on quantile plots, up to 2016, AAA-rated CBs appear more liquid than ABS. From this point in time, however, ABS are more liquid. When all IG ABS are considered, ABS again appear more liquid than CBs post-2016. Although they do
• appear equivalent in liquidity around the time of the onset of the pandemic.
• Corps are clearly less liquid than CBs over the whole sample period of March 2012 to June 2021. Corps are more liquid than ABS in 2013 but, thereafter, ABS are more liquid.
• Comparisons of the liquidity of STS and non-STS are only possible from the end of 2019 when the required data became available. Differences are relatively small. The data suggest that the most liquid non-STS are more liquid than the most liquid STS ABS.
Introduction
1.
This note compares the liquidity of GBP-denominated senior Asset Backed Securities (ABS), Covered Bonds (CBs) and Corporate Bonds (Corps) in European countries as well as in the United Kingdom. The measure of liquidity we employ is half the bid-ask spread (as reflected by market quotes), divided by the contemporaneous mid-price. This measure may be regarded as one half of the round-trip cost of buying and selling the security. We analyse the evolution of this measure over time, using historical bid and ask price data, and controlling for ratings and seniority.
The purpose of the study is to provide information to regulators and market participants seeking to understand relative liquidity and its evolution over time. The United Kingdom authorities and the European Commission have recently launched a consultation on the regulatory treatment of securitisations. How ABS are treated in the framework of rules for bank’s liquidity holdings is an important component of that regulatory treatment.
As well as comparing transactions costs for CBs, ABS and Corps, this study also analyses liquidity for Simple, Transparent and Standardised (STS) ABS and their non-STS counterparts. The specific comparisons presented are:
1. AAA-rated CBs versus AAA-rated ABS versus AAA-rated Corps,
2. IG CBs versus IG ABS versus IG Corps,
3. AAA-rated STS ABS versus AAA-rated non-STS ABS,
4. IG STS ABS versus IG non-STS ABS,
The findings are that AAA-rated ABS were less liquid than similarly rated CBs before 2016, while the reverse was true following that year.
• The same switch in relative liquidity is evident for IG ABS and CBs, although there have been brief periods in 2020 when CB liquidity increased in relative terms.
• IG STS ABS are more liquid than non-STS IG ABS, but the degree of difference is not substantial.
The note is organised as follows. Section 2 and 3 describe the measure and present the results. Section 4 concludes.
Comparison of CBs, ABS and Corps
2.
For a given security and date, we define a liquidity measure as equal to half the bid-ask spread, divided by the mid-price. This measure reflects the disposal cost of the security in that it equals half the round-trip cost of buying and then selling the security as a percentage of the mid-price (the average of the bid and the ask). The liquidity measure we employ may be expressed formally as:
(aaaaaa−bbbbbb)/2 aaaaaa−bbbbbb llllllllllllllllll mmmmmmmmmmmmmm= aaaaaa+bbbbbb (3.1) (aaaaaa+bbbbbb)/2 =
For each calendar month, we compute the liquidity measure for each security on each working day for which it is available. We do this for given rating values or seniorities (to be explained more precisely below) and then calculate either, means for the securities available at a given date, or quantiles of the distribution of spreads. In the case of ABS, we limit our attention to senior tranches.
In this section, the comparison of liquidity measure among three GBP-denominated asset classes, CBs, ABS and Corps, are provided. We are also interested in the impact of STS status on liquidity. To measure this, we compare STS ABS and non-STS ABS transactions costs. The description of data can be found in the appendix.
Table 3.1 shows time series averages of the liquidity measure expressed in equation (3.1) of the cross-sectional mean, median, 10% quantile, as well as the 90% quantile for CBs, ABS and Corps. The calculations are performed for securities in different rating categories including AAA, (AAA & AA), (AAA, AA & A) and IG using data from March 2012 to June 2o21.
With the exceptions of the average of mean and the 10% quantile for AAA rating, Corps have the highest transactions costs (lowest liquidity measure) among the three asset types considered. For most of the rating categories considered, including AAA & AA, AAA, AA & A and IG, CBs seem to be more liquid than ABS in that they exhibit lower mean transaction costs (where the means are averaged over the full sample period). But the 10% quantiles for ABS are lower (averaged over the sample period) for all rating groups. This suggests that the most liquid ABS are more liquid than the most liquid securities in other asset types.
Figure 3.1 shows times series of the mean liquidity measure for the three asset types. The time series displayed are for the period March 2012 to June 2021. For simplicity, only AAA and IG rating groups are shown in the figures with the time series for AAA-rated assets exhibited in Panel A and their counterparts in IG in Panel B.
Except for the time period late 2013 to early 2014, for AAA-rated securities, Corps had the highest mean transaction cost in all months. Before 2016, AAA-rated ABS were, generally, less liquid than AAA-rated CBs, but this was reversed after 2016. According to Panel B, among IG securities, except at the start of the sample period, Corps exhibited the highest mean transaction costs (lowest liquidity measure) in all months. IG ABS exhibit liquidity measures broadly the same as IG CBs from 2014 onwards. Note that the extreme volatility of ABS liquidity in 2012 reflects partly the significant market fluctuations in that period but also the fact that there were very few ABS securities at the start of the sample period.
One may also compare the relative liquidity of different security types by contrasting quantiles of the distribution of transactions-cost liquidity measures at any given date. To do this, we produce quantile plots, presenting zero-one indicators, for each calendar month, of the relative magnitude of deciles (ranging from 10% to 90% quantiles) of the distributions across individual securities for security types.
These indicators of relative liquidity for different quantiles may be depicted in ‘quantile plots’, as illustrated in
Figure 3.2. Panel a) of that figure shows results for AAA-rated ABS and CBs, whereas Panel b) presents results for IG securities. The figure may be understood as an array of cells corresponding to 9 quantiles and monthly observations from March 2012 to the June 2021. For a given row and month, the cell is coloured blue if that quantile of the CB transactions cost distribution is higher (i.e., the liquidity is lower) than the same quantile of the ABS transactions cost distribution. Otherwise, the cell in question is coloured red. Thus, for blue cells, CBs are less liquid and for red cells ABS are less liquid. For, AAA-rated securities, for most of 2012 and 2013, ABS were less liquid than CB (although not for all the period). From 2014 to 2016, relatively liquid AAA-rated (i.e., high quantiles) were more liquid than relatively liquid CB. But relatively illiquid ABS were less liquid than relatively illiquid CB. From 2016 onwards, apart from in isolated cases of periods and quantiles, AAA-rated ABS were more liquid than AAA-rated CB of equivalent relative liquidity (i.e., equivalent quantiles).
Panel b) of Figure 3.2 shows equivalent results for IG ABS and CB. Similar conclusions emerge from Panel a), although the comparisons are slightly less clear. For example, it remains true that the relative liquidity of ABS is generally higher than that of CB post 2016 but there are some periods, such as the onset of the Covid 19 pandemic, when ABS liquidity was lower or similar to CB liquidity.
Figures 3.3 and 3.4 present similar quantile plots for the security type pairs CBs versus Corps and ABS versus Corps, respectively. Panel A of Figure 3.3 shows that AAA-rated Corps had lower transaction costs than AAArated CBs in most of the quantiles before 2014 and after 2019, but otherwise were less liquid than CBs. Panel b) of Figure 3.3 suggests that IG corporate bonds were systematically less liquid than CBs throughout the whole sample period.
Panel a) of Figure 3.4 shows that AAA-rated Corps were more liquid than AAA-rated ABS pre 2014 and for some of the 2020 pandemic period, but otherwise AAA-rated ABS were more liquid. Panel b) Figure 3.4 shows that IG Corps were less liquid than ABS throughout the sample period, except for 2012 and 2013.
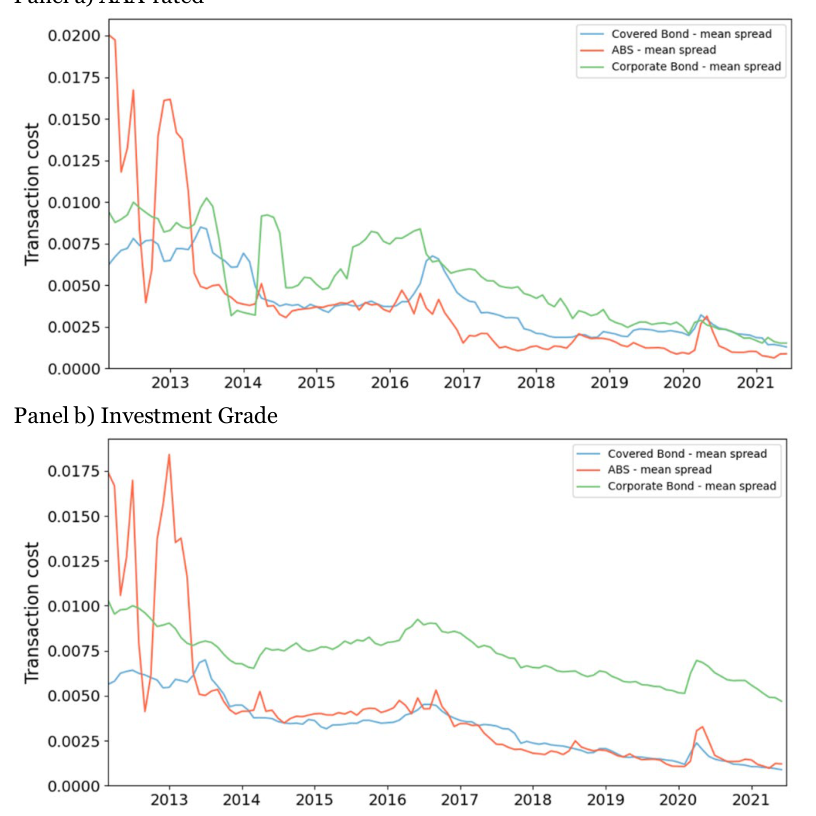
Note: Mean transactions costs are shown for Covered Bonds (in blue), Asset- Backed Securities (in red) and Corporate Bonds (in green) from March 2012 to June 2021.
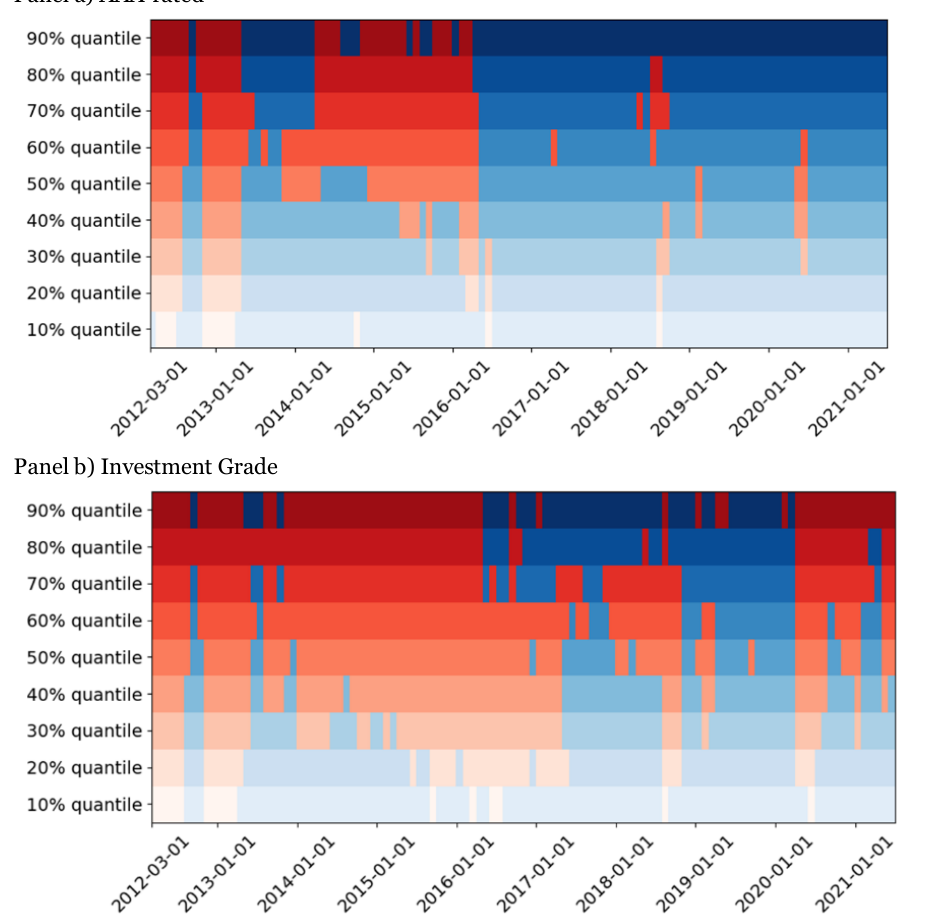
Note: The colour for a given quantile and date indicates the less liquid type, i.e., for which the transaction cost is higher. Covered Bonds are indicated in blue and Asset-Backed Securities (in red). The sample period included is March 2012 to June 2021.
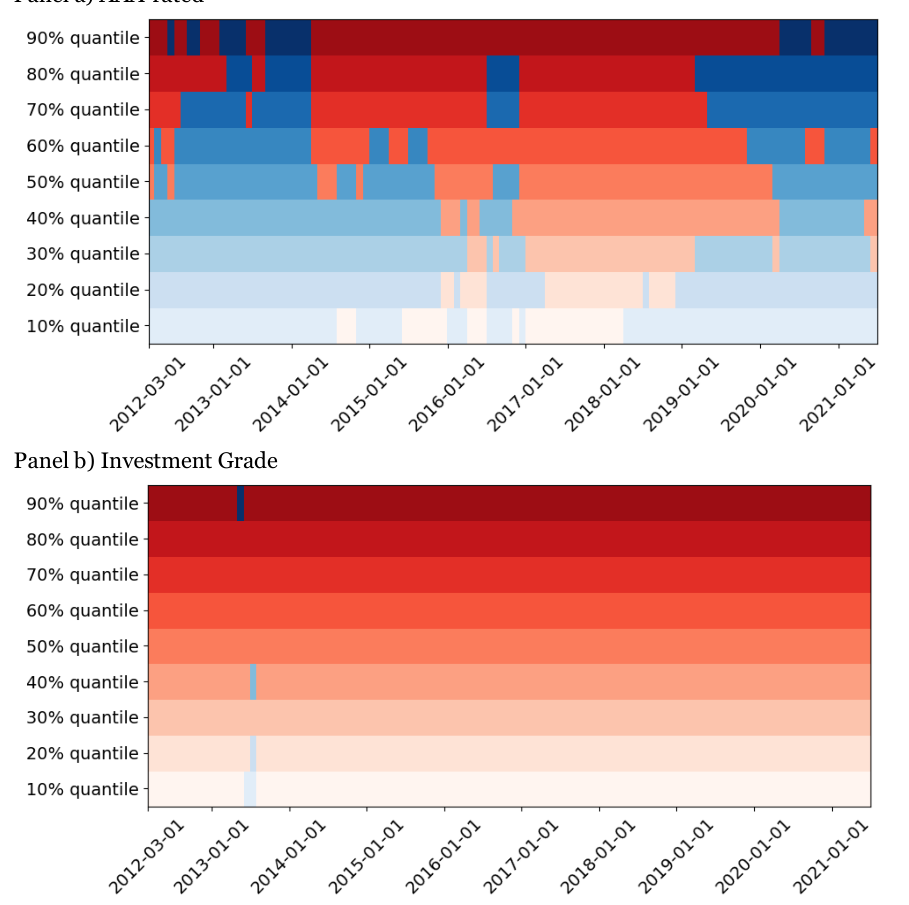
Note: The colour for a given quantile and date indicates the less liquid type, i.e., for which the transaction cost is higher. Covered Bonds are indicated in blue and Corporate Bonds (in red). The sample period included is March 2012 to June 2021.
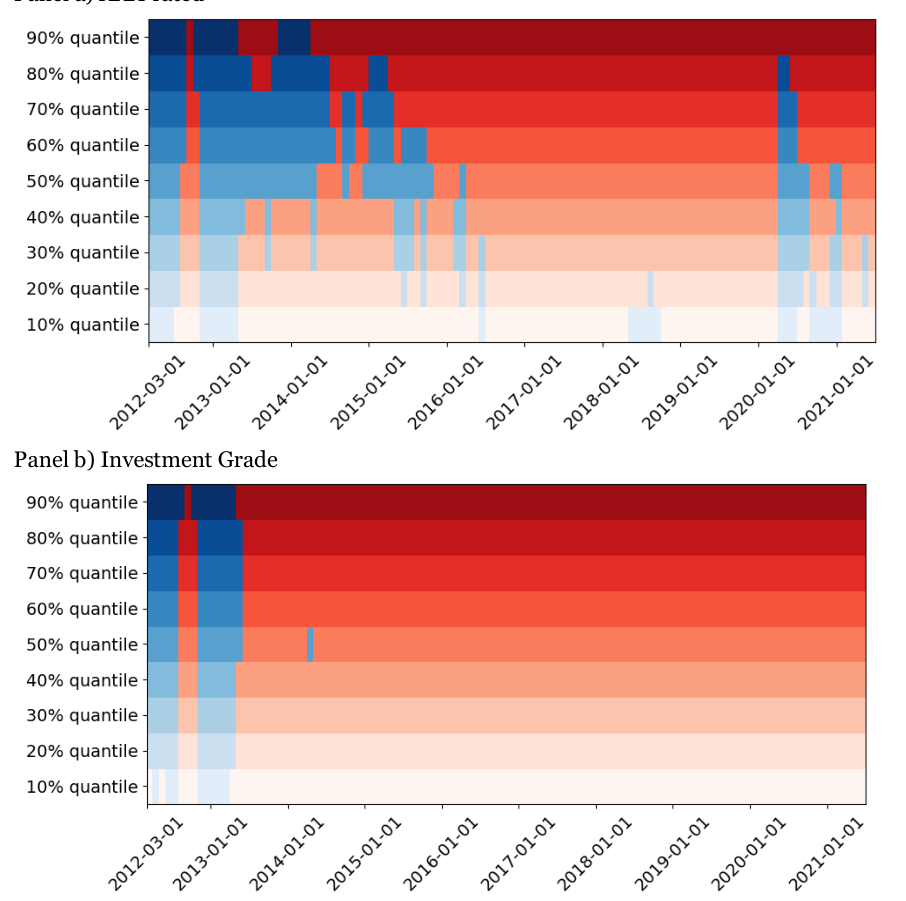
Note: The colour for a given quantile and date indicates the less liquid type, i.e., for which the transaction cost is higher. Asset Backed Securities are indicated in blue and Asset-Backed Securities (in red). The sample period included is March 2012 to June 2021.
| 10% | 90% | 10% | 90% | |||||
|---|---|---|---|---|---|---|---|---|
| Mean | Median | quantile | quantile | Mean | Median | quantile | quantile | |
| AAA | 0.39% | 0.34% | 0.16% | 0.72% | 0.38% | 0.36% | 0.12% | 0.68% |
| AAA+AA | 0.37% | 0.31% | 0.16% | 0.69% | 0.40% | 0.37% | 0.12% | 0.69% |
| AAA+AA+A | 0.36% | 0.30% | 0.16% | 0.64% | 0.42% | 0.39% | 0.13% | 0.74% |
| IG | 0.33% | 0.28% | 0.17% | 0.54% | 0.42% | 0.39% | 0.13% | 0.74% |
| Corporate | Bonds | |||||||
| 10% | 90% | |||||||
| Mean | Median | quantile | quantile | |||||
| AAA | 0.53% | 0.34% | 0.13% | 0.93% | ||||
| AAA+AA | 0.57% | 0.40% | 0.16% | 0.99% | ||||
| AAA+AA+A | 0.74% | 0.57% | 0.25% | 1.34% | ||||
| IG | 0.73% | 0.54% | 0.27% | 1.28% |
Comparison of STS ABS and non-STS ABS
3.
Having compared the liquidity of the three security types (ABS, CB and Corps), we now turn to comparisons of the liquidity of subsets of the ABS. Specifically, we are interested in the relative liquidity of STS ABS and Non- STS ABS.
Data identifying whether an ABS is STS is only available for GBP denominated ABS starting from July 2019. Table 3.2 presents averages of the cross-sectional mean, median, 10% and 90% quantiles of the transaction cost liquidity measure. Note that the results for STS ABS are identical for different ratings categories (AAA, AAA+AA etc.) because the dataset only contains AAA-rated STS ABS.
For almost all rating groups considered (AAA, (AAA & AA), (AAA, AA & A), IG), the median and 90% quantiles are, as one might expect, higher for non-STS compared to STS. However, the most liquid non-STS (i.e., the 10% quantile) show lower transactions costs than the most liquid STS ABS. Furthermore, for the AAA-rated non- STS, the mean transactions cost is slightly lower than that of the AAA-rated STS category. These findings suggest that STS has relatively little to do with liquidity (although there is some sensitivity to this characteristic).
Times series of the liquidity measure means for STS ABS and non-STS ABS are shown in Figure 3.5. The two panels suggest that IG and AAA-rated non-STS ABS had higher transaction costs than their STS counterparts before February 2020. In the period of the onset of the pandemic in March to June 2020, however, STS ABS in these two rating groups were less liquid. STS ABS in IG returned to being in the more liquid category at the end of 2020 in the case of AAA-rated securities and in July of 2020 for IG securities.
Figure 3.6 shows quantile plots for STS and non-STS ABS in both AAA and IG rating groups. STS ABS, in both AAA-rated and IG cases, were more liquid than non-STS ones in most of the quantiles before December 2019. In contrast, in the latter part of the sample period, relatively illiquid non-STS are less liquid than relatively illiquid STS, but more liquid non-STS are more liquid than relatively liquid STS.
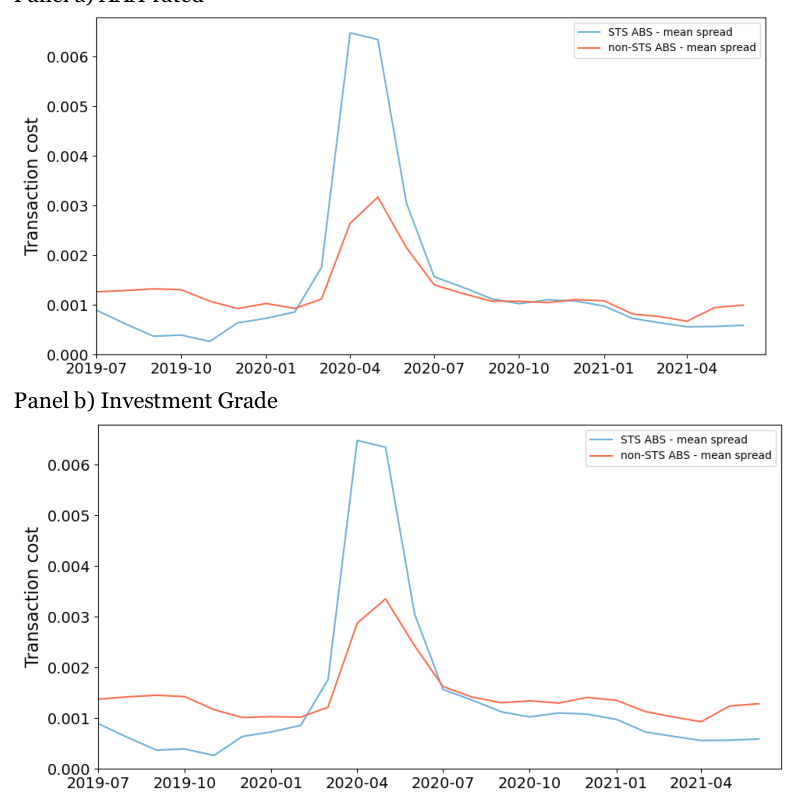
Note: Mean transactions costs are shown for STS ABS (in blue) and non-STS ABS (in red) from March 2012 to June 2021.
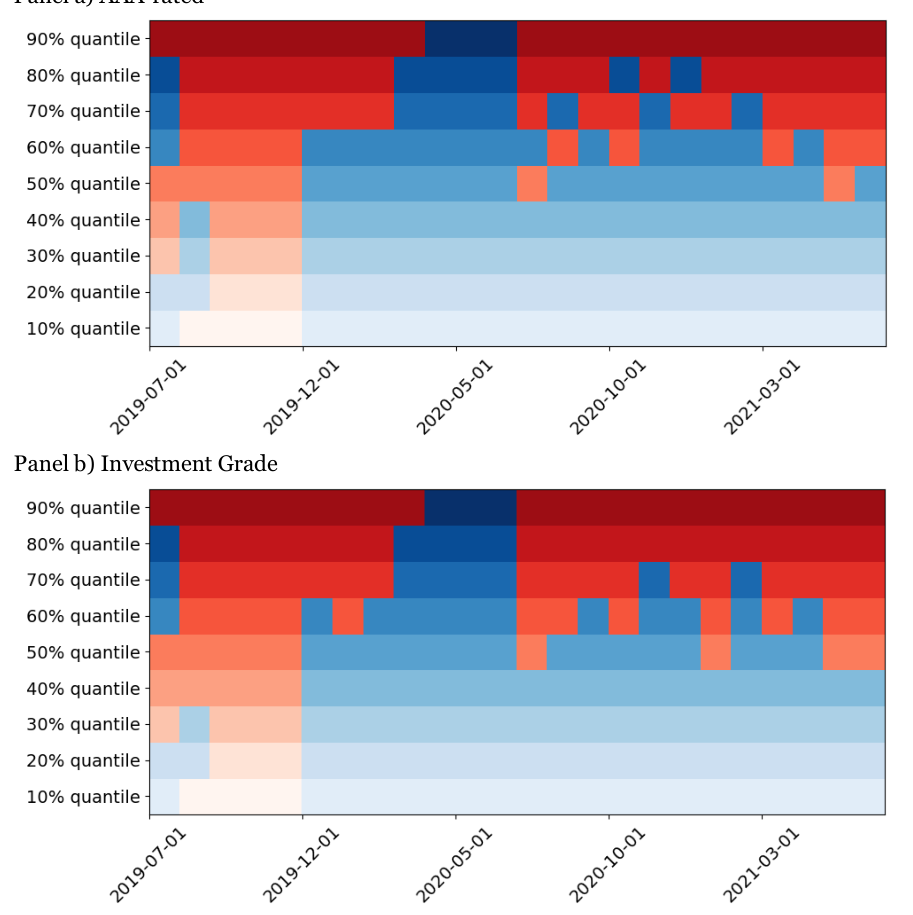
Note: The colour for a given quantile and date indicates the less liquid type, i.e., for which the transaction cost is higher. STS are indicated in blue and Non-STS in red. The sample period included is July 2019 to June 2021.
| 10% | 90% | 10% | 90% | |||||
|---|---|---|---|---|---|---|---|---|
| Mean | Median | quantile | quantile | Mean | Median | quantile | quantile | |
| AAA | 0.14% | 0.13% | 0.09% | 0.21% | 0.13% | 0.09% | 0.03% | 0.25% |
| AAA+AA | 0.14% | 0.13% | 0.09% | 0.21% | 0.14% | 0.09% | 0.03% | 0.29% |
| AAA+AA+A | 0.14% | 0.13% | 0.09% | 0.21% | 0.15% | 0.09% | 0.03% | 0.29% |
| IG | 0.14% | 0.13% | 0.09% | 0.21% | 0.15% | 0.09% | 0.03% | 0.29% |
Conclusion
4.
This note has presented simple measures of liquidity based on the disposal cost of assets (half the bid-ask spread) for GBP-denominated senior Asset Backed Securities (ABS), Covered Bonds (CBs) and Corporate Bonds (Corps). The samples are constructed using all the securities for which data are available on Bloomberg from 2012 to 2021.
When all IG securities are considered, we find that CBs were more liquid than ABS in the first half of the sample period, but that ABS became relatively more liquid than CB for most months after 2016 up to the onset of the pandemic. AAA-rated ABS are generally more liquid than similarly rated CBs post 2016 and before that ABS and CB have relative liquidities that varies across dates and for high and low relative liquidity levels.
Comparing IG Corps with IG ABS and CBs, we find, liquidity levels are generally lower, with the only exception being ABS in 2012 and 2013. STS ABS show liquidity levels slightly higher than non-STS, but the differences are not great and for some categories, such as AAA-rated, and for some time periods, the comparison works in the unexpected direction.
Appendix
Our analysis is conducted using all GBP denominated European CBs, European ABS and European Corps listed on the Bloomberg platform. The dataset includes observations from 1/3/2012 to 25/6/2021.
We collected ask and bid prices from the Bloomberg platform. We retrieved Moody’s and Fitch historical rating data from Refinitiv. Combining price and rating data, we constructed a dataset of observations for CBs, ABS and Corps for which both prices and ratings were available. The numbers of observations are shown in Figure A.1.
CBs had 294 observations in March 2012, rising to 1,311 in June 2021. For ABS, 103 observations were available in the first month of the sample period, but equalled 1,039 at the end. The volume of data for Corps was greater with 3,212 observations available in March 2012 and 21,685 in June 2021. We also compared the liquidity of STS versus non-STS ABS. Information of the numbers of observations available for these categories of security may be found in Figure A.2.
Figure A.1: Number of Observations for Three Asset Types from March 2012 to June 2021. Panel a) Covered Bonds Panel b) Asset Backed Securities
Panel c) Corporate Bonds
Figure A.2: Numbers of Observations for Two Types of ABS from July 2019 to June 2021. Panel a) STS ABS Panel b) non-STS ABS
Risk Control Limited Risk Control Limited 13-14 Dean Street London W1D 3RS +44 (0)203 307 0730 13-14 Dean Street London W1D 3RS +44 (0)203 307 0730 www.riskcontrollimited.com www.riskcontrollimited.com