

This study examines the relative liquidity of senior Asset Backed Securities (ABS) and Covered Bonds (CBs). The analysis is based on bid-ask spread data on all securities in the two asset classes for which information is available on Bloomberg for the period 2010 to 2021.
Executive summary
This study examines the relative liquidity of senior Asset Backed Securities (ABS) and Covered Bonds (CBs). The analysis is based on bid-ask spread data on all securities in the two asset classes for which information is available on Bloomberg for the period 2010 to 2021.
Key findings are that while CB were generally more liquid in the early 2010s, since 2016, senior ABS have been consistently and generally more liquid even in the 2020 Covid-19 crisis.
The study builds on an earlier Risk Control analysis of ABS and CB liquidity, Perraudin (2014). Like that earlier analysis, we find that even in the European sovereign debt crisis period of 2011-14, the more liquid ABS were comparable in liquidity to the more liquid CB.
The significance of these findings is that ABS and CB are treated very differently in the current regulatory rules on bank liquidity, specifically the eligibility criteria for inclusion in bank Liquidity Coverage Ratios. The evidence provided here suggests that senior ABS should be included within higher LCR categories than is currently the case.
Introduction
1.
This research study[1] compares the liquidity of European Asset-Backed Securities (ABS) to that of European Covered Bonds (CB).[2] Our approach is based on empirical analysis of historical bid and ask price data, controlling for ratings and seniority. The purpose of the analysis is to inform decision-making about liquidity regulation within Europe. The European Commission has recently launched a consultation on the regulatory treatment of securitisations. How ABS are treated within the framework of bank liquidity rules is an important component of that regulatory treatment.
CB occupy a privileged position in European banking rules on liquidity in that (subject to issue size, rating and pool cover conditions) they are admitted into the highest quality asset category in the Liquidity Coverage Ratio regime (see Table 1). CB that do not satisfy the most stringent conditions may be eligible under Categories 2A and 2B. In contrast, ABS are recognised as eligible for LCR calculations only in the lowest eligible category, 2B, and only if they meet criteria on rating (AAA or AA), seniority (the exposure must be the most senior tranche), Weighted Average Life (WAL no higher than 5 years) and underlying asset classes.[3]
This study will show that, based on a transaction cost measure, the liquidity of European CBs and senior ABS is, in fact, comparable. To document this, we present comparisons between CBs and ABS for three cases:
1. AAA-rated ABS versus AAA-rated CB,
2. Investment Grade (IG) ABS versus IG CB and
3. Senior ABS versus CB. To achieve this, we study information on all the ABS tranches and CB for which data are available on the Bloomberg screen system. In the Appendix, we divide senior ABS into a long-WAL bucket and a short-WAL bucket, and compare the transaction costs of each category to those of CB.
Eligibility Maximum share Minimum haircut
EU Covered bonds CQS 1 Level 1 70% 7%
EU Covered bonds CQS 2 (and Level 2A 40% 15% non EU covered bonds CQS 1)
Unrated covered bonds Level 2B 15% 30%
Level 2B (CQS 1, most STS securitisations senior tranche, WAL 15% 25%-35% less than 5 years, etc.) Non-STS securitisations Not eligible. No grandfathering for existing LCR-compliant deals Note: The source is Commission Delegated Regulation (EU) 2018/1620 and Commission Delegated Regulation (EU) 2015/61.
Our most important finding is that, in the sample period that we study which begins in 2012, CBs were more liquid for the first half of the period (during which the sovereign debt crisis occurred in southern Europe and the European Central Bank provided support to the CB market in the form of a substantial purchase program (see Smith (2020)). But senior ABS have been more liquid than CBs during most of the second half of the period (which includes the Covid 19 crisis).
The measure of liquidity that we use is the disposal cost of a security, i.e., half the difference between the bid and ask prices of the security (as a fraction of the mid-price). For each trading day, we compute these liquidity measures for the different securities available on that day. Having pooled the daily observations within a month, we calculate the monthly means. For each month, we also rank the individual-security ABS and CB disposal costs from low to high and take the representative observations at 10%, 50% and 90% positions in the sequence of observations. The spreads that occur 10%, 50% and 90% of the way through the ranked spreads are called the 10%, 50% and 90% quantiles, respectively.
What do these measures amount to intuitively? For example, for ABS, the 50% quantile reflects the disposal cost for a representative security in that half the ABS have a higher disposal cost and half have a lower cost. The 10% quantile corresponds to a particularly liquid example of an ABS in that only 10% of the securities have a lower disposal cost and 90% have a higher cost. The 90% quantile shows the disposal cost for an illiquid ABS in that 90% of ABS have a lower cost and just 10% have a higher disposal cost.
We plot the means and the 10%, 50% and 90% quantiles for ABS and CB over time to show how these liquidity measures for the two asset classes have evolved. We also present figures in which one may observe, which asset class of the two asset classes is more illiquid and how this evolves through the sample period.
The measure of liquidity that we employ is one among many. Liquidity has such dimensions as market depth i.e., measures of how sizeable a trade has to be before transactions costs increase, and the time that it takes to dispose of a block without disturbing the price. These may be measures by turnover and the ratio of absolute price change to trading within a period (commonly used as measure of market depth). Ultimately, liquidity comes down to an issue of trading costs and the measure we employ is highly likely to figure, therefore, in a list of measures that one may wish to monitor to track liquidity.
This comparison of CB and ABS liquidity may be compared with an earlier study prepared by Risk Control for AFME, Perraudin (2014).[4] That study compared different data from those employed in this study in that it used a dataset of bid and ask quotes for ABS tranches provided by Standard & Poor’s (which in turn obtained quotes from banks). The sample period covered by the study ran from May 2009 to August 2013.
The study concluded: “On average, Covered Bond bid-ask spreads are narrower than those of ABS. But, for much of the sample period, spreads for the more liquid ABS are narrower than those of Covered Bonds, especially in the period of 2011-2012 when significant fears about sovereign solvency (and hence the prospects for Covered Bond bailouts) gripped the market.” The finding that, in the early years of the 2010s, the more liquid ABS (the most liquid 10% of the market) are more liquid than the more liquid CB, is echoed by the current study. The finding that in recent years ABS liquidity has exceeded that of CB is new to the present study.
The remainder of the note is organised as follows. Section 2 describes the data. Section 3 presents the results. Section 4 concludes.
Data Description
2.
Our analysis is conducted using all European CB and European ABS listed on the Bloomberg platform. The data set runs from 1/1/2010 to 25/6/2021. In the case of CB, we select all active European bonds that are covered by a pool of assets. On ABS, Bloomberg maintains ABS data in two universes: a set of older tranches in the Corporate bond database and newer tranches in the Mortgage database. Our ABS dataset is a combination of active tranches in both databases. We obtain characteristics for both sets from Bloomberg. Table 1 shows the distribution of these securities according to country.
Covered bond ABS Price data Rating data Both Price data Rating data Both Country available available available available available available 27 EU countries 5188 5587 4766 920 2380 808 27 EU countries and UK 5320 5722 4897 1576 4001 1432 France, Germany, Netherlands, Ireland 2700 2749 2569 829 1629 718 and Spain Note: Countries with asterisks are not EU countries.
The countries for which there are the largest numbers of CBs are mostly Northern European countries, namely: Germany, Denmark, France, Austria, and Norway. In contrast, the countries with the most ABS are United Kingdom, Spain, Netherlands, Germany and Italy. To avoid biasing the results through shocks that affect different national markets (or their sovereigns), we perform the comparisons for a set of countries for which both products are present in reasonable numbers: France, Germany, Netherlands, Ireland, Spain. [5] The Appendix provides comparison analysis results of the UK.
The majority of ABS are Residential Mortgage Backed Securities (RMBS), followed by Auto Loan Backed Securities, which predominate in the market. We exclude Commercial Mortgage Backed Securities from our analysis since they are not eligible for the STS category and tend to exhibit higher risks and lower liquidity than other categories.
Historical bid and ask price data are downloaded from Bloomberg. Bloomberg adopted a new fixed-income pricing source, namely “BVAL”, from March 2013. This pricing source generates market price estimates based on real-time market observations through algorithms bespoke to countries and asset classes. It largely enriched the ABS price availability and caused a hike in its daily price observations.
We obtain Moody’s and Fitch historical rating transition data from Refinitiv[6], and map the ratings to dates where price data is available. The credit status of Covered Bonds is represented by the issuer-level ratings, while that of ABS is represented by issuance-level ratings.
Analysis
3.
For a given security and date, we define a liquidity measure equal to half the bid-ask spread. This may be viewed as the disposal cost of the security as it is the spread between the mid-price, which one might regard as the true value and the bid price. The measure is scaled by the current mid-price. It may be expressed formally as:
aaaaaa−bbbbbb llllllllllllllllll mmmmmmmmmmmm = aaaaaa+bbbbbb (1)
Within each calendar month[7], we gather the liquidity measure for each security on each working day for which it is available. We do this for particular ratings or seniorities (to be explained more precisely below) and then calculate the quantiles of the observations. We restrict attention, in the case of ABS, to senior tranches.
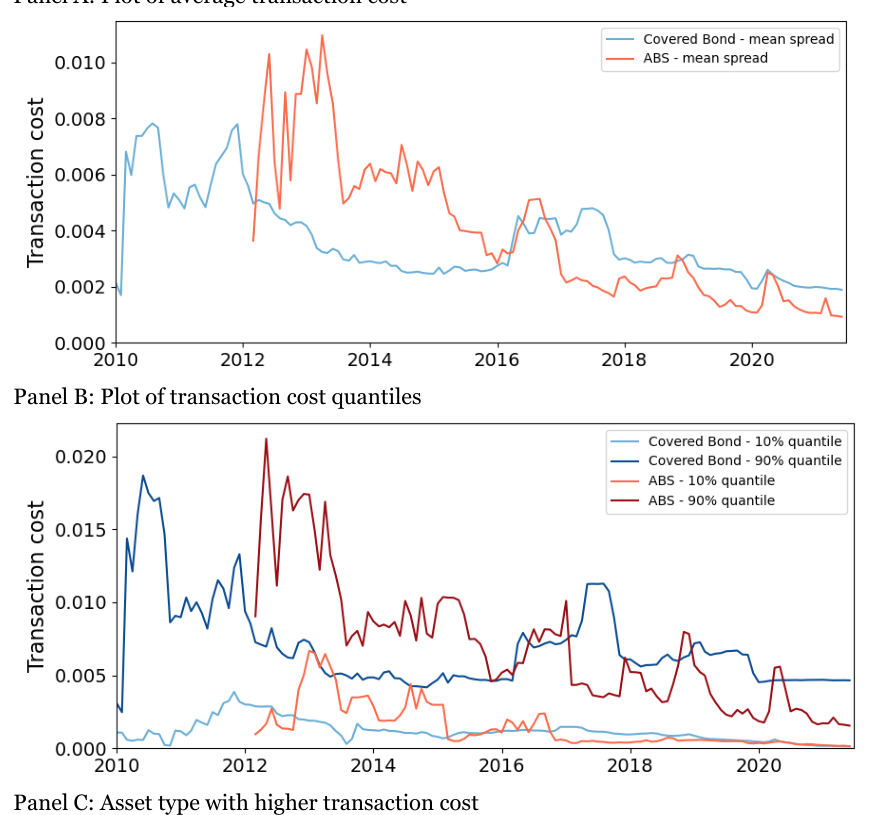
Figure 1 Panel A shows the mean transaction cost for AAA-rated Senior ABS and CBs. The picture reveals the basic finding of this study that will be further examined subsequently, namely that following a period in which ABS exhibited higher transactions costs (and, hence, in this sense lower liquidity) from 2012 to 2016, in recent years, from 2016 to the present, the ABS for which we have data have mostly exhibited lower transactions costs than CBs.
Panels B of Figure 1 shows quantiles of the liquidity measure for Covered Bonds (in blue) and ABS (in red). What is a quantile? In any given period, one may reorder the data on individual security transactions costs from smallest to largest. The 50% quantile or median would then be the security transaction cost that is half way through the ordered data. Similarly, the 10% (and 90%) quantile correspond to the costs for which 10% of cases are smaller and 90% larger (90% are smaller and 10% larger). Thus, the 10% quantile shows the level of costs for an unusually liquid security (within its asset class) while the 90% quantile shows the level for an illiquid security (within its class).
By comparing the ABS and CB 10% quantiles, one may see how relatively liquid securities within each asset class compare. Even early on in the same period, there were times when AAA-rated senior ABS had lower transactions costs than CBs. For most of the first half of the period covered, CB transactions costs were lower. From the middle of the period covered, ABS transactions costs were lower with few exceptions. The figure shows high spikes in the 90% quantiles (corresponding to the less liquid securities) in 2010 and 2011 for CBs and for 2012 and 2013 for ABS.
While the corresponding quantiles for the two asset classes are broadly similar in average level. There are some periods in which the quantiles move apart. For example, in 2017, liquidity tightens for less liquid securities in the CB market without a comparable effect being apparent in the ABS market. Overall, however, the direction of medium and long-term trends effects appears to be comparable.
In Panel C, we represent, for each calendar month, the asset type that is less liquid, by marking as blue months in which CBs are less liquid and as red months in which ABS are less liquid. Different horizontal rows in Panel C correspond to the quantiles of the distributions of CB and ABS. Hence, for example, the top row shows the relative degree of liquidity, month by month, of the 90% quantiles of the CB and ABS distributions.
Note that there are many fewer observations of ABS securities than there are of CBs and, hence, the ABS results tend to fluctuate more. To take examples, one may focus on Investment Grade Senior ABS that have both bidask spread data and rating data in March 2012 and November 2012,when average transaction costs are high. In March 2012, there are 353 transaction cost observations from 35 tranches. Among the 35 tranches, 20 are Spanish and 15 are Dutch. In November 2012, there are 901 transaction cost observations from 43 tranches. Of the 43 tranches, 27 are Spanish and 16 Dutch. In both months, there are at least 12 different issuers. Tranches with high bid-ask spreads are not all from the same issuer. On the other hand, if one focusses on Aaa rated tranches only, there are 7 out of 10 in March 2012 (or 7 out of 9 in November 2021) tranches issued by the same Dutch issuer. In this case, the transaction costs of Aaa tranches do not appear very high (only one tranche is above 1%).
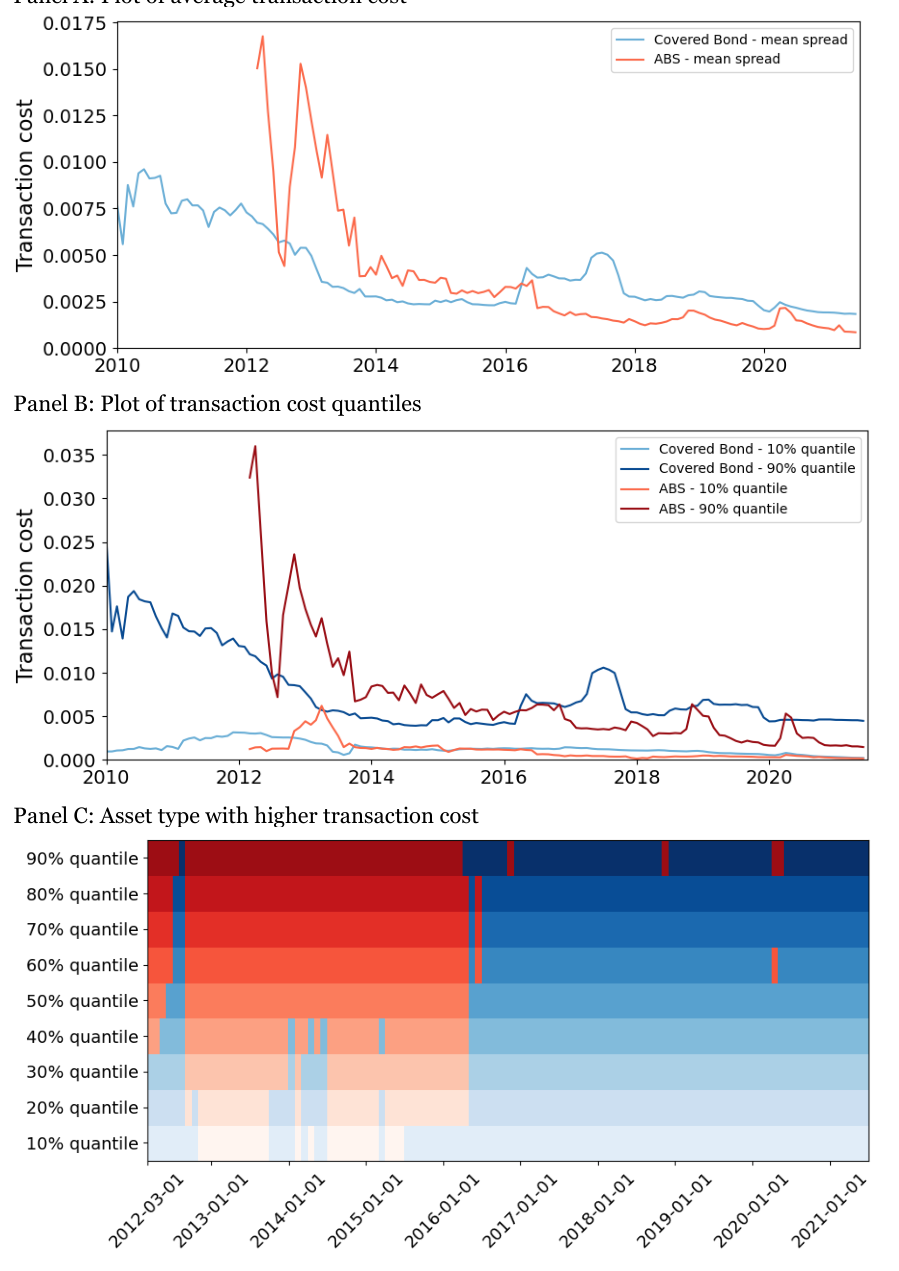
Figure 2 shows results comparable to Figure 1 except for Investment Grade CB and ABS. Again, the time series averages appearing in Panel A show ABS transaction costs exceeding those of CB in the early part of the sample period (particularly in 2012 and 2013) but then falling consistently below CB transaction costs in the later part of the sample period. Only at the time of the March 2020 crisis did the average transactions for ABS rise to just less than the CB average transaction costs.
The erratic nature of the ABS spreads in 2012 (in which there was a major fall from one month to the next followed by a rise of equal magnitude) is likely to reflect the fact that there are relatively few ABS observations especially early on in the sample period, and, hence, events affecting individual issuers may play a role.
Panel B of Figure 2 shows the 90% and 10% quantiles for the two asset classes. One may note that the major decline in 2012 in ABS transactions costs followed by an immediate rise appears in the 90% quantile data series but not in the 10% quantile, suggesting it is caused by a relatively few ABS securities and does not affect the more liquid part of the market.
Panel C of Figure 2 shows the colour-coded summary of the relative liquidity of the two asset classes (as in the same panel of Figure 1). The overall pattern of relative liquidity is the same as in Figure 1 Panel C. ABS are more liquid from 2016 onwards and CB are the more liquid in most cases prior to that date. The pattern of greater senior ABS liquidity post 2016 is even clearer for IG (in Figure 2) than for AAA (in Figure 1) in that there are scarcely any patches of red post 2016 in Figure 2.
Noticeable also is the fact that pre-2016 there are periods (in 2012, 2014 and 2015) when the most liquid part of the ABS market is more liquid than the most liquid section of CB. This is revealed by the fact that there are blue patches for the very lowest transaction cost quantiles shown in Figure 2 Panel C. Similar patches of blue were present for low quantiles in Figure 1 Panel C but they were shorter in duration and higher liquidity quantiles.
Altogether, one could conclude from Panels C of Figures 1 and 2 that the most liquid ABS securities tend to be more liquid than the most liquid CBs in the sense that the lower quantiles are coloured blue for a much larger fraction of the sample period.
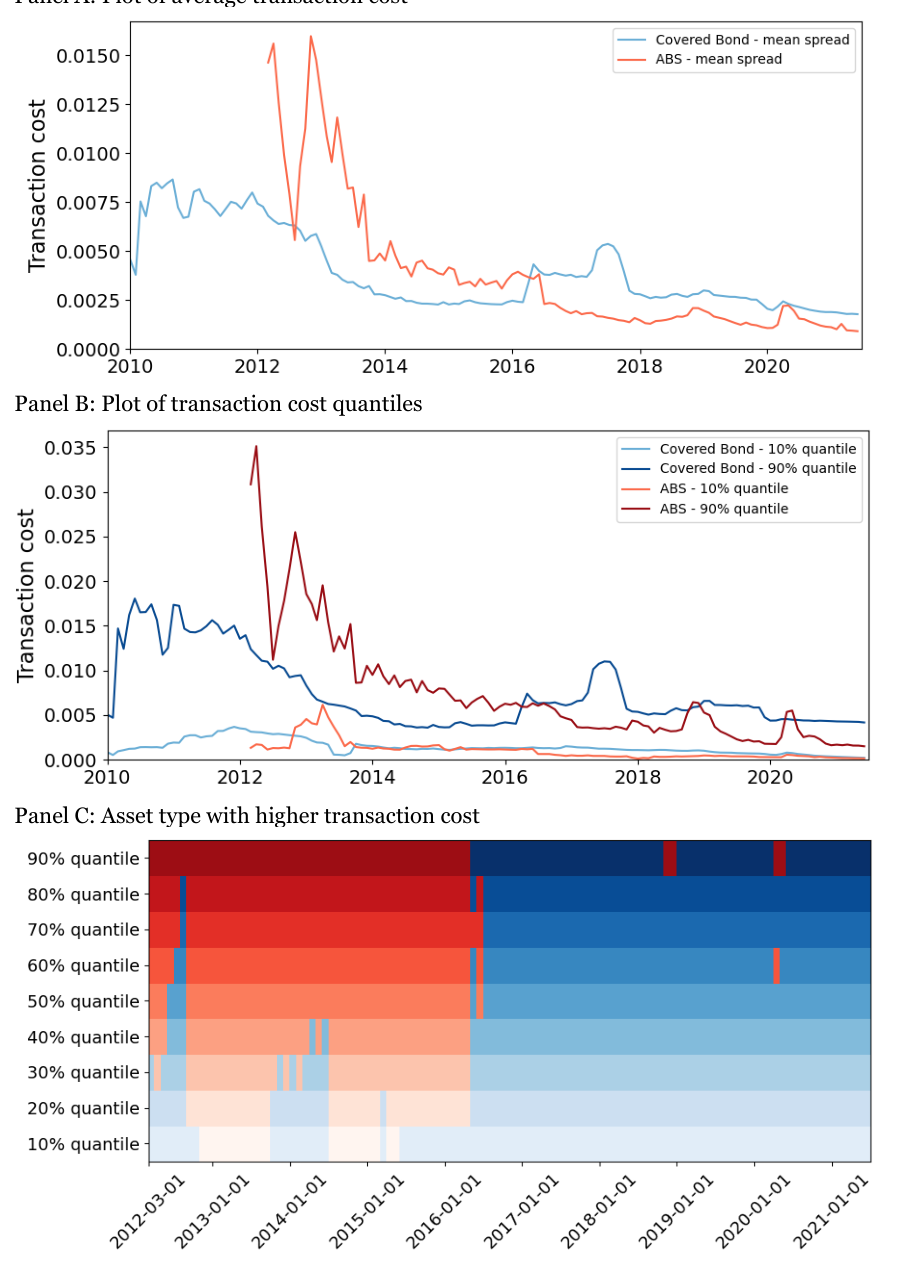
Finally, Figure 3 presents comparisons of liquidity indicators for CB and senior ABS tranches for all ratings. Panel A again presents time series averages. Like the IG results in Figure 2, the contrast between the first and second half of the sample period is very clear with ABS being more liquid in the second half and less liquid for much of the first (except for the most liquid ABS). The negative spike immediately reversed that was evident in 2012 for less liquid ABS appears again but again does not affect the 10% quantile, suggesting it affects a few, relatively low liquidity securities. When all ratings are included as in Figure 3, transactions costs very briefly exceed those for CBs in the March 2020 crisis period but only by a small magnitude.
Conclusion
4.
This note has presented simple measures of liquidity based on the disposal cost of assets (half the bid-ask spread) for European Asset Backed Securities (ABS) and Covered Bonds (CB). The samples are constructed using all the securities for which data are available on Bloomberg from 2010 to 2021.
CB are treated preferentially within European bank liquidity regulation in that CB rated AA- or higher and subject to an issue volume floor are counted within the highest category of liquid assets, category 1. CB that do not satisfy all the conditions may still be included by banks within Category 2A and 2B. ABS securities on the other hand, must satisfy demanding requirements if they are to be counted for the 2B category.
Is this radically different regulatory treatment justified by the evidence of the relative liquidity of the two asset classes? The evidence presented in this paper suggests not. In the first half of the sample period (which includes the European sovereign debt crisis), CB were more liquid than senior ABS (although in some periods, the most liquid ABS appear more liquid than the equivalent CB for some sub-periods even in the first half of the sample period). In the second half of the sample period (which includes the Covid-19 crisis), senior ABS appear to be consistently more liquid than CB by our measures.
The results could reflect the fact that the regulatory regime for European ABS has tightened considerably in the last few years with the introduction of the Simple, Transparent and Standardised (STS) category and with stricter reporting and capital requirements. The relatively greater liquidity of ABS in the second part of the sample period could reflect this new reality.
Alternatively, it may be that the asset classes behaved differently in the two crisis periods in our sample (European sovereign debt crisis and Covid-19 crisis) because of their different exposure to key underlying risks. If this is the case, it may be seen as sensible to construct liquidity buffers that - through diversification – provide a more robust defence to weaknesses in these different types of secured financing.
This study builds on an earlier Risk Control research paper, Perraudin (2014), which compared the liquidity of CBB and ABS using spread data. Based on data from 2009 to 2013 and from a different source, the earlier study reaches similar findings for the early 2010s in that CB appear more liquid but the most liquid part of the ABS market has lower transactions costs than the most liquid part of the CB market. The finding here that since 2016 and even in the 2020 Covid 19 crisis, ABS have been more liquid than CB in the sense of having lower transactions costs is new to this study.
The implication of our findings is that senior ABS securities have for some years provided equal or superior level of liquidity compared to CB. The current bank regulatory rules which, in the case of the Liquidity Coverage Ratio eligibility conditions, strongly favour CB over ABS should be reconsidered.
References
European Union (2014) “Commission Delegated Regulation (EU) 2015/61 of 10th October 2014 to supplement Regulation (EU) No. 575/2013,” available at: https://op.europa.eu/en/publication-detail/- /publication/d70dbd16-9e0e-11e4-872e-01aa75ed71a1 .
European Union (2017) “Commission Delegated Regulation (EU) 2017/2402 of 12h December 2017 laying down a general framework for securitisation and creating a specific framework for simple, transparent and standardised securitisation, and amending Directives 2009/65/EC, 2009/138/EC and 2011/61/EU and Regulations (EC) No 1060/2009 and (EU) No 648/2012,” available at: https://eur-lex.europa.eu/legalcontent/EN/TXT/HTML/?uri=CELEX:32017R2402&from=EN .
European Union (2018) “Commision Delegated Regulation (EU) 2018/1620 of 13.7.2018 amending Delegated Regulation (EU) 2015/61 to supplement Regulation (EU) No 575/2013 of the European Parliament and the Council with regard to liquidity coverage requirement for Credit Institutions lists substantive amendments to the LCR regulation,” available at: https://eur-lex.europa.eu/legalcontent/EN/TXT/PDF/?uri=CELEX:32018R1620&from=EN.
Perraudin (2014) “Covered Bond Versus ABS Liquidity: A Comment on the EBA’s Proposed HQLA Definition,” Risk Control Limited Research Paper, available at: https://www.riskcontrollimited.com/insights/covered-bond-versus-abs-liquidity/.
Smith, Ariel (2020) “The European Central Bank' al Bank's Covered Bond Purchase Programs I and II (ECB GFC),” Journal of Financial Crises, Volume 2, Issue 3, pp. 382-404, available at: : https://elischolar.library.yale.edu/journal-of-financial-crises/vol2/iss3/16 .
Appendix
In this appendix, we divide senior ABS into long-WAL and short-WAL categories, and compare the transaction costs of each category to those of CB. We split the two WAL categories at 5 years. This is consistent with LCR rules that require securitisation positions qualifying for 2B status to have WALs no greater than 5 years.
It is worth mentioning that a short WAL is likely to be related to higher seniority and a higher tranche rating. Junior tranches are usually repaid after more senior tranches and, thus, on average may have higher WALs. In this analysis, we include all rating categories to ensure enough observations for each category.
As in the analysis reported in the main text of the study, we plot the transaction cost measure of ABS against CB, with Figure A1 exhibiting findings for senior ABS with short WALs, and Figure A2 displaying results for senior ABS with long WALs.
Both figures indicate that the transaction cost of ABS is higher than CB before 2016. Since early-2016, however, Figure A1 shows that the average transaction cost of short-WAL ABS is lower than that of CB. This result also holds when we examine results based on transaction cost quantiles. In Figure A2, the mean and quantiles of the transaction cost for long-WAL senior ABS is comparable to those of CB from 2016 onwards.
Figure A1: Comparing CB and Senior ABS with WAL Less Than 5 Years
Panel B: Plot of transaction cost quantiles
Note: CB and ABS issued by France, Germany, Netherlands, Ireland and Spain are included.
Figure A2: Comparing CB and Senior ABS with WAL Greater Than 5 Years
Panel B: Plot of transaction cost quantiles
Panel C: Asset type with higher transaction cost
Note: CB and ABS issued by France, Germany, Netherlands, Ireland and Spain are included.
Risk Control Limited 13-14 Dean Street London W1D 3RS +44 (0)203 307 0730 www.riskcontrollimited.com
Notes
[1] The study was prepared by William Perraudin and Yixin Qiu. Queries should be addressed to william.perraudin@riskcontrollimited.com.
[2] The study has been commissioned by the Association of Financial Markets in Europe (AFME).
[3] See European Union (2014) and European Union (2018).
[4] This study, Perraudin (2014) “Covered Bond Versus ABS Liquidity,” is available at: https://www.riskcontrollimited.com/insights/covered-bond-versus-abs-liquidity/
[5] From Table 2, there appear to be a reasonable number of observations for Italy. However, there are data quality issues in that the bid and ask prices are the same for all Italian senior ABS tranches for any date. We, therefore, do not include Italian data.
[6] Standard & Poor’s rating data for periods after the start of 2021 are unavailable on Refinitiv.
[7] We have conducted similar exercise in weekly frequency. The results are consistent with monthly frequency, but the plot is harder to read. We choose to present results on a monthly frequency to facilitate interpretation.