

Date: 4.8.2020 Number: 20-114a
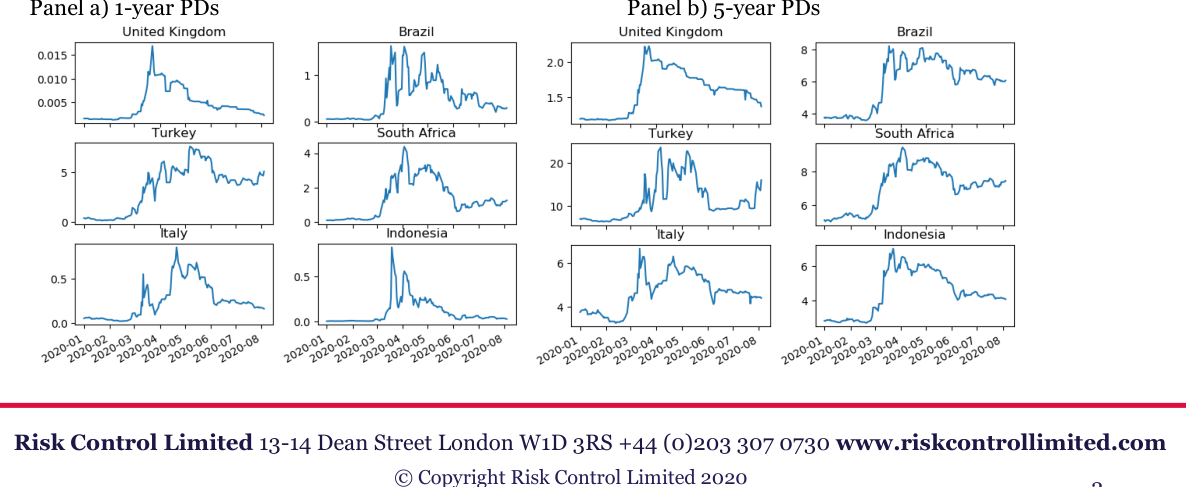
This note presents an update of Risk Control’s analysis of the sovereign ratings and PDs implied by CDS spreads. Risk Control’s earlier analysis was contained in the note: “Real Time Sovereign Ratings in the Covid-19 Crisis,” 20-65a.[1] We focus on the question: What happened to Sovereign Credit Quality in July?
The key points of the update are: A. Overall, sovereign credit quality improved. B. There is no change in the 1-year PD implied ratings for 71% of the countries and 5-year PD implied ratings for 76% of the countries in our sample in July. C. The rest of the countries have higher ratings. D. Ratings for only 3 countries based on 1-year PDs (Greece, Slovakia, Uruguay) have deteriorated in July. Based on 5-yeard PDs, ratings of Greece and Hong Kong have deteriorated in July. Table 1 shows the rating changes in July 2020. Key findings are:
• Based on the 1-year implied historical PDs, the ratings of 47 countries remained unchanged in July, 16 countries increased and 3 countries decreased.
• Rating increase by 1 notch is for Brazil, Chile, China, Indonesia, Kazakhstan, Malaysia, Portugal, Saudi Arabia, South Korea, Spain, UK and Vietnam. . Rating increase by 2 notches is for Australia, Panama and Philippines. Rating increase by 3 notches is for Qatar.
• Countries for which ratings dropped are Greece, Slovakia and Uruguay.
• Based on the 5-year implied historical PDs, the ratings of 50 countries increased in July, 14 countries increased and 2 countries decreased. . Rating increase by 1-notch is for Australia, Colombia, Indonesia, Ireland, Japan, Malaysia, Panama, Peru, Portugal, Qatar, Saudi Arabia, Thailand, U.K. and Vietnam. Rating decrease by 1 notch is for Greece and Hong Kong.
1 This is available at: https://www.riskcontrollimited.com/wp-content/uploads/2020/05/Real-Time-Sovereign-Ratings-inthe-Covid-19-Crisis-20-65a-15-5-20-FINAL.pdf.
© Copyright Risk Control Limited
Table 2 shows the comparison of regional average ratings as of 1/07/2020 and 31/07/2020. Based on 1-year PDs, the average rating has improved for Asia & Pacific and Middle East. Based on 5-year PDs, the average rating has improved for Asia & Pacific.
| 1st | 31st | 1st | 31st | 1st | 31st | 1st | 31st | ||||||||
|---|---|---|---|---|---|---|---|---|---|---|---|---|---|---|---|
| Country | July | July | Change | Country | July | July | Change | Country | July | July | Change | Country | July | July | Change |
| Australia | AA | AAA | 2 | Jamaica | B- | B- | 0 | Australia | AA+ | AAA | 1 | Jamaica | B | B | 0 |
| Austria | AAA | AAA | 0 | Japan | AAA | AAA | 0 | Austria | AAA | AAA | 0 | Japan | AA+ | AAA | 1 |
| Bahrain | B | B | 0 | Jordan | B- | B- | 0 | Bahrain | B | B | 0 | Jordan | B | B | 0 |
| Belgium | AAA | AAA | 0 | Kazakhstan | BB+ | BBB- | 1 | Belgium | AAA | AAA | 0 | Kazakhstan | BBB- | BBB- | 0 |
| Brazil | BB | BB+ | 1 | Latvia | A- | A- | 0 | Brazil | BB- | BB- | 0 | Latvia | A- | A- | 0 |
| Chile | A- | A | 1 | Lithuania | A- | A- | 0 | Chile | BBB+ | BBB+ | 0 | Lithuania | A- | A- | 0 |
| China | A+ | AA- | 1 | Malaysia | A+ | AA- | 1 | China | A | A | 0 | Malaysia | BBB+ | A- | 1 |
| Colombia | BBB | BBB | 0 | Mexico | BBB | BBB | 0 | Colombia | BB | BBB- | 2 | Mexico | BB+ | BB+ | 0 |
| Costa Rica | B- | B- | 0 | Netherlands | AAA | AAA | 0 | Costa Rica | B- | B- | 0 | Netherlands | AAA | AAA | 0 |
| Côte d'Ivoire | B+ | B+ | 0 | Norway | AAA | AAA | 0 | Côte d'Ivoire | B- | B- | 0 | Norway | AAA | AAA | 0 |
| Croatia | A- | A- | 0 | Panama | BBB | A- | 2 | Croatia | BBB+ | BBB+ | 0 | Panama | BBB- | BBB | 1 |
| Cyprus | BBB- | BBB- | 0 | Peru | A- | A- | 0 | Cyprus | BBB | BBB | 0 | Peru | BBB | BBB+ | 1 |
| Czech Republic | AA- | AA- | 0 | Philippines | A | AA- | 2 | Czech Republic | A+ | A+ | 0 | Philippines | A- | A- | 0 |
| Denmark | AAA | AAA | 0 | Poland | A+ | A+ | 0 | Denmark | AAA | AAA | 0 | Poland | A- | A- | 0 |
| Dominican Republic | B+ | B+ | 0 | Portugal | A | A+ | 1 | Dominican Republic | B+ | B+ | 0 | Portugal | A- | A | 1 |
| Egypt | B | B | 0 | Qatar | BBB+ | A+ | 3 | Egypt | B- | B- | 0 | Qatar | BBB+ | A- | 1 |
| El Salvador | B- | B- | 0 | Romania | BB | BB | 0 | El Salvador | B | B | 0 | Romania | BB+ | BB+ | 0 |
| Estonia | A- | A- | 0 | Russia | BBB- | BBB- | 0 | Estonia | A- | A- | 0 | Russia | BBB- | BBB- | 0 |
| Finland | AAA | AAA | 0 | Saudi Arabia | BBB- | BBB | 1 | Finland | AAA | AAA | 0 | Saudi Arabia | BBB- | BBB | 1 |
| France | AAA | AAA | 0 | Slovakia | A+ | A | -1 | France | AAA | AAA | 0 | Slovakia | A | A | 0 |
| Germany | AAA | AAA | 0 | Slovenia | BBB+ | BBB+ | 0 | Germany | AAA | AAA | 0 | Slovenia | BBB+ | BBB+ | 0 |
| Ghana | CCC | CCC | 0 | South Africa | B+ | B+ | 0 | Ghana | CCC | CCC | 0 | South Africa | B+ | B+ | 0 |
| Greece | BBB | BBB- | -1 | South Korea | A+ | AA- | 1 | Greece | BBB- | BB+ | -1 | South Korea | AA | AA | 0 |
| Guatemala | B- | B- | 0 | Spain | A- | A | 1 | Guatemala | B | B | 0 | Spain | A- | A- | 0 |
| Hong Kong | A+ | A+ | 0 | Sweden | AAA | AAA | 0 | Hong Kong | A+ | A | -1 | Sweden | AAA | AAA | 0 |
| Hungary | BBB | BBB | 0 | Thailand | AA- | AA- | 0 | Hungary | BBB+ | BBB+ | 0 | Thailand | A | A+ | 1 |
| Iceland | BBB | BBB | 0 | Trinidad | BB | BB | 0 | Iceland | BBB+ | BBB+ | 0 | Trinidad | BB+ | BB+ | 0 |
| India | A | A | 0 | Turkey | B- | B- | 0 | India | BBB+ | BBB+ | 0 | Turkey | B- | B- | 0 |
| Indonesia | BBB | BBB+ | 1 | U.K. | AA- | AA | 1 | Indonesia | BB+ | BBB- | 1 | U.K. | AA | AA+ | 1 |
| Iraq | B- | B- | 0 | Ukraine | B- | B- | 0 | Iraq | CCC | CCC | 0 | Ukraine | B- | B- | 0 |
| Ireland | AA | AA | 0 | United States | AAA | AAA | 0 | Ireland | AA | AA+ | 1 | United States | AAA | AAA | 0 |
| Israel | A | A | 0 | Uruguay | BB | BB- | -1 | Israel | A- | A- | 0 | Uruguay | BB- | BB- | 0 |
| Italy | BB+ | BB+ | 0 | Viet Nam | BBB- | BBB | 1 | Italy | BB+ | BB+ | 0 | Viet Nam | BB | BB+ | 1 |
| Africa | BB- | BB- | B | B |
|---|---|---|---|---|
| Asia & Pacific | AA- | AA | A | A+ |
| Europe | AA- | AA- | A+ | A+ |
| Middle East | BB+ | BBB- | BB | BB |
| North America | AA | AA | AA+ | AA+ |
| South/Latin America | BBB- | BBB- | BB+ | BB+ |