

In the Covid-19 crisis, the credit standing of sovereign borrowers has suddenly worsened as governments, facing difficult trade-offs between saving lives and the economy, have allowed their deficits to balloon.
Executive Summary
In the Covid-19 crisis, the credit standing of sovereign borrowers has suddenly worsened as governments, facing difficult trade-offs between saving lives and the economy, have allowed their deficits to balloon.
The sovereign ratings published by ratings agencies and developed internally by financial institutions provide slow-moving perspectives on country credit quality. First, they are through-the-cycle rather than point-in-time in methodology and, second, they are determined through elaborate bureaucratic procedures that make the resulting credit evaluations far from timely in the middle of a rapidly evolving crisis. For investors and lenders, making the right decision in the crisis requires timely information about the fast-changing situation.
For these reasons, it is highly advisable to look at the information on credit quality implicit in market prices. Credit Default Swap (CDS) spreads provide a distillation of market views on the credit quality of issuers. However, these views are expressed in basis swap spreads rather than in an intuitive way related to standard credit quality grades.
Using a transparent methodology, this research report derives point-in-time or ‘real-time’ ratings and 1 and 5year default probabilities from Credit Default Swap (CDS) spreads. From the ratings implied by 1-year probabilities, the average rating decline for Europe is 1.1 notches, for Middle East 3.1, for Asia & Pacific 2.2, for South & Latin America 2.8, for Africa 4.5 and for North America 0.0.
The crisis naturally affects credit quality over short periods more than long (as, ultimately, solutions to the medical emergency will surely be found). Hence, when ratings are benchmarked off 5-year CDS-spread implied Probabilities of Default (PDs), the average notch declines are smaller. Based on 5-year probabilities, the average rating drop for Europe is 0.8 notches, Middle East is 1.8, Asia & Pacific is 2.0, South & Latin America is 2.5, Africa is 2.7 and North America is 0.0.
Within Europe, the highest rating drops are seen in Romania, Portugal, Russia and Spain. In the Middle East, the largest drops are in Qatar and Bahrain. In Asia & Pacific, Kazakhstan, Indonesia and Philippines suffer the biggest drops. In South and Latin America, Panama, and Brazil have the largest rating drops. Globally, the largest declines have been in Kazakhstan, Panama, Romania, Qatar, Russia, Peru, Trinidad, Saudi Arabia, Indonesia Bahrain and Ivory Coast. These countries have experienced implied ratings declines ranging from 7 notches in the case of Kazakhstan, Panama and Romania to 5 notches for Bahrain, Ivory Coast, Indonesia, Peru, Saudi Arabia and Trinidad.
The crisis is fast moving, noticeable improvements in PDs have been observed in the last three weeks. Risk Control is regularly updating its real-time ratings estimates and will make these available through updates of this note and a dedicated web application for coming months.
1. Introduction
Financial firms exposed to sovereign borrowers currently face significant challenges in responding to the fastevolving Covid-19 crisis with timely risk assessments. Most firms employ slow-moving, broadly ‘through-thecycle’ internal rating systems (including for sovereigns). These in turn are the foundation of capital adequacy assessments.
Using a transparent methodology, this research report derives ‘real-time’, point-in-time 1- and 5-year sovereign Probabilities of Default (PDs) using Credit Default Swap (CDS) spread data. The PDs are then used to infer realtime ratings for a large number of sovereigns. The methodology employed may be summarised as follows.
1. Obtain sovereign PDs by rating from S&P’s 1-year and 5-year sovereign transition matrices and combine it with the corporate PDs curve for higher ratings (BBB- and higher for 1-year PDs and AAand higher for 5-year PDs). Enforce monotonicity on the sovereign PDs by fitting a line on log of PDs.
2. Obtain risk neutral PDs from the sovereign CDS spread data and enforce monotonicity on the estimated PDs.
3. Calculate scaling factors to be the ratio of the rating agency PDs and the risk neutral PDs. The rating agency PDs are based on data up to 2017 and the risk neutral PDs are average in 2019.
4. Create master scales from the rating agency historical 1- and 5-year default data and infer real-time, letter-grade ratings for each sovereign. For this, given any risk-neutral PDs, the scaling factor is obtained from the linear interpolation of the scaling factor curve obtained in step 3. Risk-neutral PDs lying outside the boundary points are assumed to have the scaling factor at the boundary.
We use the framework to examine how sovereign credit quality has deteriorated since the start of 2020. The average real-time rating decline since the start of 2020 is 1.1 notches for Europe, 3.1 for the Middle East, 2.2 for Asia & Pacific, 2.8 for South & Latin America, 4.5 for Africa and 0.0 for North America, when ratings are inferred from 1-year CDS spreads.
Globally, the largest declines have been in Kazakhstan, Panama, Romania, Qatar, Russia, Peru, Trinidad, Saudi Arabia, Indonesia Bahrain and Ivory Coast. These countries have experienced implied ratings declines ranging from 7 notches in the case of Kazakhstan, Panama and Romania to 5 notches for Bahrain, Ivory Coast, Indonesia, Peru, Saudi Arabia and Trinidad.
The note is organised as follows. Section 2 describes the data and methodology. Section 3 presents results. Section 4 concludes. The Appendix explains some technical aspects of the methodology employed.
2. Data and Methodology
2.1 Data
Using Refinitiv’s Eikon database, we download the list of 1-year CDS tickers based on the following criteria- i) term is 1 year, ii) currency is ‘USD’, iii) issue seniority is ‘Senior Unsecured’ and iv) industry sub sector is ‘Sovereign’. For each ticker, we download characteristics data and daily historical par mid spread data. We, similarly, download the list of 5-year CDS tickers using the same criteria as above except that the term is 5 years.
We also download the historical ratings data for sovereigns. For our analysis we only consider the ‘S&P Longterm Issuer Rating’. If this is unavailable for any country, we use the Moody's Long-term Issuer Rating equivalent of the S&P grade. If neither S&P nor Moody’s rating is available, we use the Fitch Long-term Issuer Rating if it exists.[2] We also collect the 1-year and 5-year sovereign transition matrices and corporate PDs by rating from S&P’s 2017 annual sovereign and corporate default studies respectively.
In what follows, we employ the following regional definitions. Clearly, these definitions reflect the availability of CDS data. Europe includes Austria, Belgium, Croatia, Cyprus, Czech Republic, Denmark, Estonia, Finland, France, Germany, Greece, Hungary, Iceland, Ireland, Italy, Latvia, Lithuania, Netherlands, Norway, Poland, Portugal, Romania, Russia, Serbia, Slovakia, Slovenia, Spain, Sweden, U.K., Ukraine. South & Latin America consists of Argentina, Brazil, Chile, Colombia, Costa Rica, Dominican Republic, Ecuador, El Salvador, Guatemala, Jamaica, Mexico, Panama, Peru, Trinidad, Uruguay. Asia & Pacific includes Australia, China, Hong
Kong, India, Indonesia, Japan, Kazakhstan, Malaysia, New Zealand, Pakistan, Philippines, South Korea, Thailand, Viet Nam. Middle East consists of Bahrain, Egypt, Iraq, Israel, Jordan, Lebanon, Qatar, Saudi Arabia, Turkey. Africa consists of Côte d'Ivoire, Morocco, South Africa, Ghana. North America consists of the United States.
2.2 Step 1: Obtaining Rating Agency Sovereign PDS
As Step 1 of the analysis, we obtain the rating agency 1-year and 5-year PDs for data up to 2017 directly from the default columns of the 1-year and 5-year S&P sovereign transition matrices (average of 1975 to 2017) published by S&P.[3] In so doing, we aggregate the CCCs into one category ‘CCC’. We also do not consider CC category in any of the subsequent analyses. As, the 1-year PDs for ratings BBB- and higher and 5-year PDs for AA- and higher are all zero, we infer the ratings from the shape of curve of the log corporate PDs for these ratings.
Figures 2.1 and 2.2 show as blue lines the sovereign 1-year and 5-year PDs obtained directly from the rating agency transition matrices and the fitted sovereign PDs. In each figure, Panel a) shows the log transformed PDs which are approximately linear except for the CCC PDs, while Panel b) displays the untransformed PDs.
As the estimated PDs are non-monotonic (presumably reflecting lack of data), we regularise the sovereign PDs by taking the fitted values from a regression of the log PDs on a variable taking integer values from 1 to 16 corresponding to the letter grades AAA to B. More details are provided in the Appendix. We do not include the CCC PD in this regression because, from inspection of the data, it is clear that the approximate linearity of PDs in letter grades does not apply for the case of CCC. This completes Step 1 of the approach.
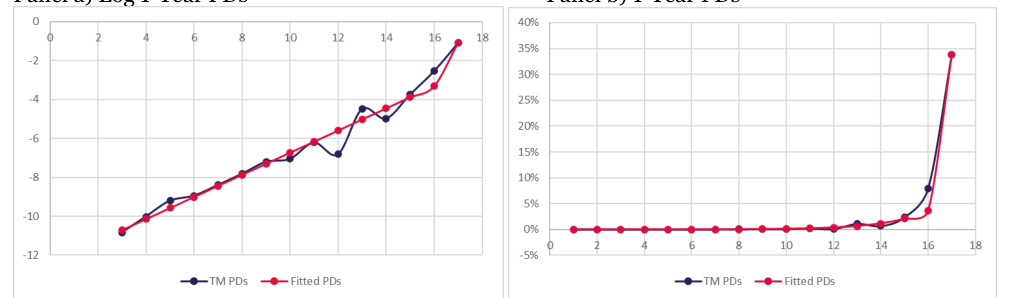
Note: This figure shows the PDs obtained directly from the rating agency transition matrices (denoted by ‘TM PDs’) and fitted PDs based on equation (1) (denoted by ‘Fitted PDs’). The vertical axis in Panel a) shows the PD expressed in natural logarithms. In Panel b), the vertical scale is PD measured in percent. In both cases, the horizontal scale is an integer variable from 1 to 17. Here, the values 1, 2, 3, …, 17 represent AAA, AA+ AA etc through to CCC. The ‘CCC’ PD value is taken to be the original observed value and not the fitted value.
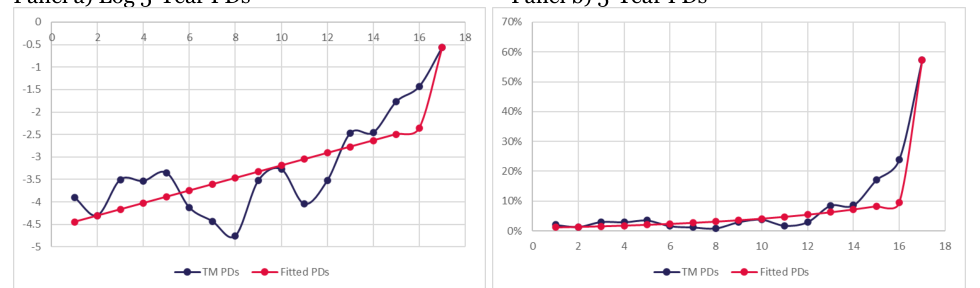
Note: See the note to Figure 2.1 for definitions of axis labels.
2.3 Step 2: Obtaining CDS-Spread-Implied Risk Neutral PDs
As Step 2 of the analysis, we calculate the risk neutral PDs from CDS spread data. From the daily historical spread data, we filter out ‘Not-a-Number’ and non-positive values. For each observation, we calculate the riskneutral PDs. We then combine this with the historical ratings data. Then we calculate the average mid-spread and risk-neutral PDs by rating and year.
As the implied PD values are not necessarily strictly monotone, we obtain fitted implied PDs following the approach described in equation (A1). The methodology for deriving the PDs from CDS spread is explained in the Appendix.
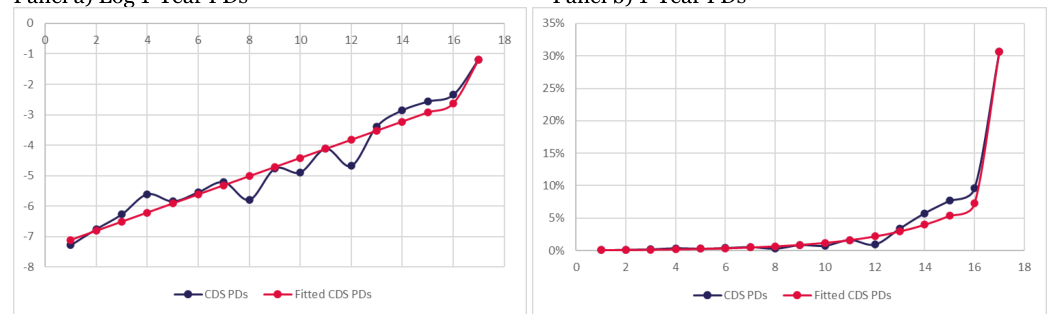
Note: The figure shows risk neutral PDs extracted from CDS spreads. To enforce monotonicity and smoothness, the logarithms of PDs for B- ratings and above are regressed on an integer-valued variable representing ordered rating categories. The vertical axis in Panel a) shows the PD expressed in natural logarithms. In Panel b), the vertical scale is PD measured in percent. In both cases, the horizontal scale is an integer variable from 1 to 17. Here, the values 1, 2, 3, …, 17 represent AAA, AA+ AA etc through to CCC. The ‘CCC’ PD value is taken to be the original observed value and not the fitted value.
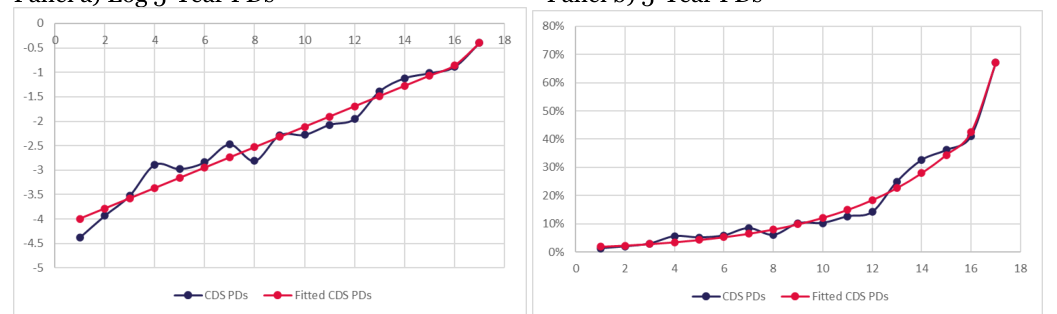
Note: See the information provided in the note to Figure 2.3.
2.4 Step 3: Inferring a Risk Adjustment from Risk-Neutral to Actual Implied PDs
The two previous steps have generated (a) regularised rating agency sovereign PDs and (b) risk-neutral, sovereign, CDS-implied PDs. Step 3 of the methodology consists of inferring a mapping from risk-neutral to actual CDS-spread-implied PDs.
The rating agency PDs are based on values up to 2017. The sovereign-CDS implied risk neutral PDs are based on the average of 2019 values. We make the assumption that both are representative of unconditional values and, hence, that one can use the relation between them to infer the risk adjustment that explain the mapping from (a) to (b). (An alternative way of benchmarking the risk adjustment might be to calculate the CDS-spread inferred PDs from a different period and we experiment with use of 2017 CDS spreads as the basis for benchmarking as we report below.)
To infer the historical PDs from any given value of risk-neutral PD, we perform an adjustment based on a scaling factor that depends on the value of the risk-neutral PD. The scaling factor is obtained from the rating agency PDs that are based on values up to 2017 and the sovereign-CDS implied risk neutral PDs are based on Q is given by, the average of 2019 values. The scaling factor βi for a risk-neutral PD, PDi
P PDi Q (2.2) βi = PDi
Q is the market implied PD Here, PDiPdenotes the actual default probability (without risk adjustment) while PDi which includes a risk premium. Financial economists often call such probabilities ‘P’ and ‘Q’ measure PDs which is why we adopt this notation.
Thus, we obtain a set of scaling factors corresponding to a set of risk-neutral PDs corresponding to different ratings. Tables 2.1 and 2.2 show the scaling factors obtained for 1-year and 5-year risk neutral PDs. Then for any other risk-neutral PDs, we infer the scaling factor from a linear interpolation of the scaling factors obtained above. Risk neutral PDs lying outside the boundary points are assumed to have the scaling factor at the Q, the corresponding historical PD is obtained as: boundary points. Thus, for any PDk Q (2.3) PDkP = βkPDk
Here, βk has been obtained from linear interpolation.
| Risk | Risk | ||||||
|---|---|---|---|---|---|---|---|
| Rating | Neutral | Scaling | Rating | Neutral | Scaling | ||
| Rating | Ind | 1Y PD | Factor | Rating | Ind | 1Y PD | Factor |
| AAA | 1 | 0.08 | 0.00 | BBB- | 10 | 1.21 | 0.10 |
| AA+ | 2 | 0.11 | 0.00 | BB+ | 11 | 1.63 | 0.13 |
| AA | 3 | 0.15 | 0.01 | BB | 12 | 2.19 | 0.17 |
| AA- | 4 | 0.20 | 0.02 | BB- | 13 | 2.96 | 0.22 |
| A+ | 5 | 0.27 | 0.03 | B+ | 14 | 3.99 | 0.29 |
| A | 6 | 0.37 | 0.03 | B | 15 | 5.37 | 0.38 |
| A- | 7 | 0.49 | 0.04 | B- | 16 | 7.24 | 0.50 |
| BBB+ | 8 | 0.66 | 0.06 | CCC | 17 | 30.66 | 1.10 |
| BBB | 9 | 0.89 | 0.08 |
Note: This table shows the scaling factors obtained for different 1-year risk- neutral PDs corresponding to different rating notches. Scaling factor for any given risk-neutral PD is then obtained by linear interpolation.
| Risk | Risk | ||||||
|---|---|---|---|---|---|---|---|
| Rating | Neutral | Scaling | Rating | Neutral | Scaling | ||
| Rating | Ind | 5Y PD | Factor | Rating | Ind | 5Y PD | Factor |
| AAA | 1 | 1.84 | 0.64 | BBB- | 10 | 12.09 | 0.34 |
| AA+ | 2 | 2.27 | 0.60 | BB+ | 11 | 14.91 | 0.32 |
| AA | 3 | 2.79 | 0.56 | BB | 12 | 18.38 | 0.30 |
| AA- | 4 | 3.44 | 0.52 | BB- | 13 | 22.66 | 0.28 |
| A+ | 5 | 4.25 | 0.48 | B+ | 14 | 27.93 | 0.26 |
| A | 6 | 5.23 | 0.45 | B | 15 | 34.43 | 0.24 |
| A- | 7 | 6.45 | 0.42 | B- | 16 | 42.45 | 0.22 |
| BBB+ | 8 | 7.96 | 0.39 | CCC | 17 | 67.06 | 0.85 |
| BBB | 9 | 9.81 | 0.37 |
Note: The information in the note to Table 2.1 pertains here except that the data is for 5-year rather than 1-year default probabilities.
2.5 Step 4: Inferring Real-Time Ratings from Real-Time Actual PDs
The fourth and last step in our derivation is to infer ratings from the real-time, actual PDs. This we accomplish by calculating PD ranges associated with each rating. We do this by taking the natural logs of the regularised historical S&P PDs, assume that the cut off level between any two ratings equals the middle of the interval defined by any two adjacent log PDs, and then assign ratings based on the interval into which a real-time implied actual PD falls. This approach represents a methodological choice and a financial institution could substitute a different rule for combining ratings.
3. Results
3.1 Probabilities of Default by Rating Category
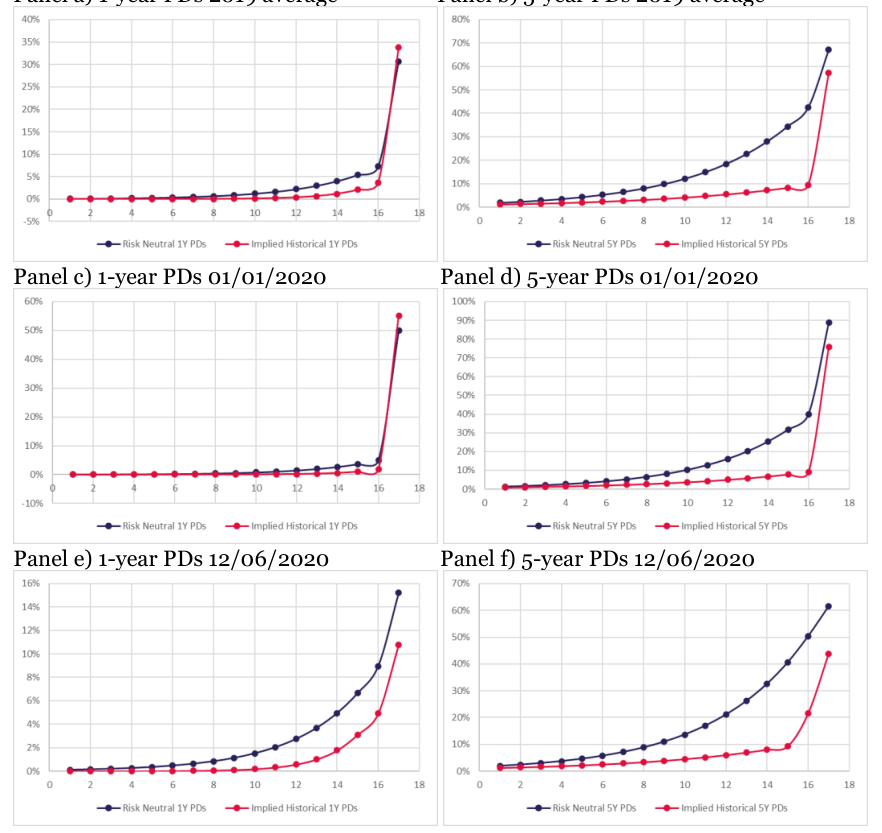
Tables 3.1 and 3.2 show the estimated 1-year and 5-year PDs by rating. The values shown correspond to (i) a 2019 average, (ii) those observed on 01/01/2020 and (iii) those observed on 12/06/2020. The tables also show the corresponding S&P PDs and their cut-offs. The PD-cut offs are then used to infer ratings which are shown in Table 3.5.
Note: See the note to Table 3.1. Definitions are the same except that this table contains results for 5-year instead of 1-year CDS spreads and PDs.
The second column in Tables 3.1 and 3.2 consist of 1 and 5-year PDs extracted from the right-hand column of S&P sovereign rating transition matrices, smoothed to remove non-monotonicities and extended for higher ratings using the shape of corporate PDs to resolve the issue that too few observations of sovereign borrower defaults are available to estimate values for the higher rating categories. The PDs shown in these tables smoothly increase in an exponential manner from very low levels for the higher rating categories to 3.65 and 9.51 for B- over 1- and 5-year horizons. The CCC default probabilities represent a sharp step up compared to Bshowing that for sovereign ratings, progressing from B- to CCC grades represents a very substantial step towards default status.
As explained in the previous sections, the S&P PDs up to 2017, and the risk-neutral PDs in 2019 have been used to determine the scaling factors which leads to the implied historical PDs in 2019 being the same as S&P PDs. Table 3.1 shows that the 1-year historical PDs have increased since the beginning of the year, except for CCC.[4] Table 3.2 shows similar results with the historical 5-year PDs being greater for all rating grades except CCC since the beginning of the year. The largest changes in 5-year PDs are observed for B- from 9.15% to 21.52%.
| S&P 2017 | 2019 | 01/01/2020 | 12/06/2020 | |||||
|---|---|---|---|---|---|---|---|---|
| Risk | Implied | Risk | Implied | Risk | Implied | |||
| 1Y PD | Neutral | Historical | Neutral | Historical | Neutral | Historical | ||
| Rating | 1Y PDs | Cutoffs | 1Y PDs | 1Y PDs | 1Y PDs | 1Y PDs | 1Y PDs | 1Y PDs |
| AAA | 0.00 | 0.00 | 0.08 | 0.00 | 0.05 | 0.00 | 0.11 | 0.00 |
| AA+ | 0.00 | 0.00 | 0.11 | 0.00 | 0.07 | 0.00 | 0.14 | 0.00 |
| AA | 0.00 | 0.00 | 0.15 | 0.00 | 0.09 | 0.00 | 0.19 | 0.00 |
| AA- | 0.00 | 0.01 | 0.20 | 0.00 | 0.13 | 0.00 | 0.26 | 0.01 |
| A+ | 0.01 | 0.01 | 0.27 | 0.01 | 0.17 | 0.00 | 0.34 | 0.01 |
| A | 0.01 | 0.02 | 0.37 | 0.01 | 0.23 | 0.01 | 0.46 | 0.02 |
| A- | 0.02 | 0.03 | 0.49 | 0.02 | 0.32 | 0.01 | 0.62 | 0.03 |
| BBB+ | 0.04 | 0.05 | 0.66 | 0.04 | 0.43 | 0.02 | 0.84 | 0.06 |
| BBB | 0.07 | 0.09 | 0.89 | 0.07 | 0.59 | 0.03 | 1.13 | 0.10 |
| BBB- | 0.12 | 0.16 | 1.21 | 0.12 | 0.80 | 0.05 | 1.51 | 0.18 |
| BB+ | 0.21 | 0.28 | 1.63 | 0.21 | 1.08 | 0.10 | 2.04 | 0.32 |
| BB | 0.37 | 0.50 | 2.19 | 0.37 | 1.47 | 0.17 | 2.74 | 0.57 |
| BB- | 0.66 | 0.88 | 2.96 | 0.66 | 1.99 | 0.31 | 3.68 | 1.00 |
| B+ | 1.17 | 1.55 | 3.99 | 1.17 | 2.71 | 0.56 | 4.95 | 1.77 |
| B | 2.07 | 2.75 | 5.37 | 2.07 | 3.68 | 1.00 | 6.66 | 3.11 |
| B- | 3.65 | 11.12 | 7.24 | 3.65 | 4.99 | 1.79 | 8.96 | 4.91 |
| CCC | 33.85 | 30.66 | 33.85 | 49.94 | 55.13 | 15.22 | 10.78 |
Note: The second column shows the S&P 1-year PDs used in obtaining the scaling factors for the risk-neutral PDs. The third column shows the PD cut-offs for the PDs in the second column. The rest of the columns show the estimated 1-year risk-neutral PDs and the historical PDs. Values shown are average in 2019 and on 01/01/2020 and 12/06/2020.
| S&P 2017 | 2019 | 01/01/2020 | 12/06/2020 | |||||
|---|---|---|---|---|---|---|---|---|
| Risk | Implied | Risk | Implied | Risk | Implied | |||
| 5Y PD | Neutral | Historical | Neutral | Historical | Neutral | Historical | ||
| Rating | 5Y PDs | Cutoffs | 5Y PDs | 5Y PDs | 5Y PDs | 5Y PDs | 5Y PDs | 5Y PDs |
| AAA | 1.17 | 1.26 | 1.84 | 1.17 | 1.32 | 0.84 | 1.92 | 1.21 |
| AA+ | 1.35 | 1.45 | 2.27 | 1.35 | 1.66 | 1.06 | 2.39 | 1.40 |
| AA | 1.55 | 1.66 | 2.79 | 1.55 | 2.08 | 1.28 | 2.97 | 1.62 |
| AA- | 1.78 | 1.91 | 3.44 | 1.78 | 2.61 | 1.49 | 3.69 | 1.87 |
| A+ | 2.05 | 2.20 | 4.25 | 2.05 | 3.28 | 1.73 | 4.59 | 2.16 |
| A | 2.36 | 2.53 | 5.23 | 2.36 | 4.12 | 2.01 | 5.71 | 2.50 |
| A- | 2.71 | 2.91 | 6.45 | 2.71 | 5.17 | 2.34 | 7.09 | 2.89 |
| BBB+ | 3.12 | 3.34 | 7.96 | 3.12 | 6.49 | 2.72 | 8.82 | 3.34 |
| BBB | 3.58 | 3.84 | 9.81 | 3.58 | 8.14 | 3.17 | 10.97 | 3.87 |
| BBB- | 4.12 | 4.41 | 12.09 | 4.12 | 10.22 | 3.69 | 13.64 | 4.47 |
| BB+ | 4.73 | 5.08 | 14.91 | 4.73 | 12.83 | 4.29 | 16.95 | 5.17 |
| BB | 5.44 | 5.84 | 18.38 | 5.44 | 16.10 | 4.99 | 21.08 | 5.98 |
| BB- | 6.26 | 6.71 | 22.66 | 6.26 | 20.20 | 5.81 | 26.21 | 6.91 |
| B+ | 7.19 | 7.71 | 27.93 | 7.19 | 25.36 | 6.76 | 32.59 | 7.99 |
| B | 8.27 | 8.87 | 34.43 | 8.27 | 31.82 | 7.87 | 40.52 | 9.24 |
| B- | 9.51 | 23.33 | 42.45 | 9.51 | 39.94 | 9.15 | 50.39 | 21.52 |
| CCC | 57.24 | 67.06 | 57.24 | 88.65 | 75.68 | 61.54 | 43.86 |
3.2 Probabilities of Default by Country
Tables 3.3 and 3.4 compare the estimated risk-neutral and historical 1-year and 5-year PDs respectively at the beginning of the year and in recent times for different countries. The historical 1-year PDs have fallen for 1 country-Ukraine. On the other hand, the largest percentage increases in the 1-year PDs are observed for Panama, Kazakhstan, Romania, Russia, Malaysia, Indonesia, Bahrain, Thailand, Peru and Ivory Coast.
For the historical 5-year PDs, we observe that, the historical PD estimate has fallen only for Cyprus, Japan, Ukraine and United States and not changed for Estonia and Jordan. For the rest, the PDs have increased since the beginning of the year. The largest changes are observed for Ghana, Ivory Coast, Germany, Panama, Brazil, Egypt, Qatar, Finland, Colombia, Kazakhstan, Peru, Chile and Malaysia.
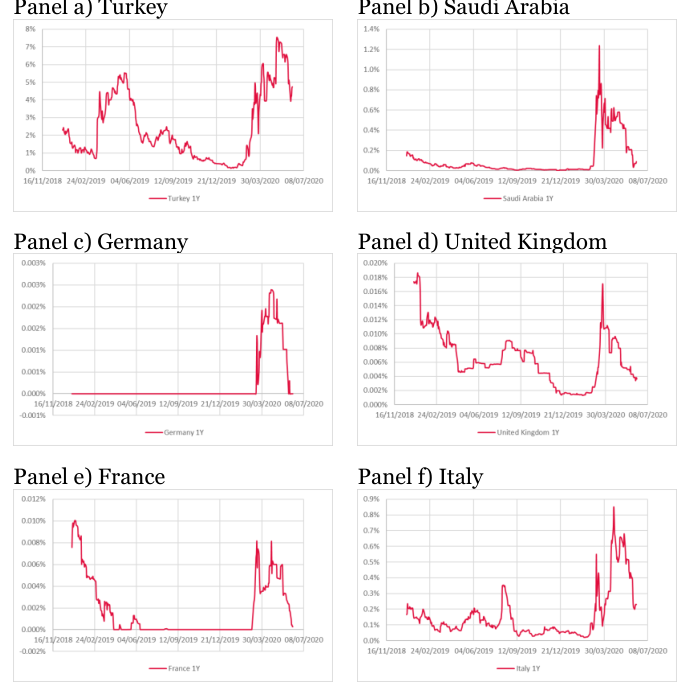
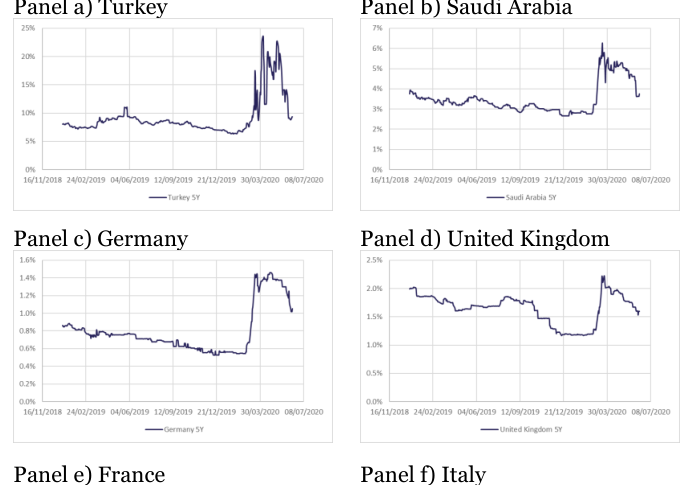
Figures 3.2 and 3.3 show the 1-year and 5-year historical PD estimates for some of the countries. From Figure 3.2, for Turkey and Saudi Arabia, the PDs based on 1-year CDS spreads have fallen in the very recent period. For the higher credit quality borrowers, the PDs have increased but remain at low levels. The PD for the UK is actually lower than it was in early 2019 when Brexit-related worries were affecting market perceptions. The 5year PDs shown in Figure 3.3 suggest a slightly different dynamic in that PDs for high credit quality borrowers have remained fairly stable since increasing in March. PDs for Turkey and Saudi Arabia have slightly declined in the most recent period but not as much as the shorter term 1-year PDs.
The improvement in emerging market PDs that has occurred over the last three weeks and deterioration in the PDs of high credit quality issuers is shown in Figure 3.4.
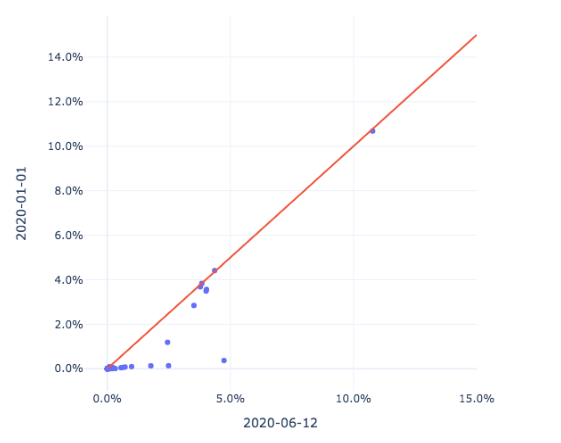
Note: The figure shows a scatter plot of country implied 1- year PDs calculated for 1st Jan 2020 (vertical axis) and 12th Jun 2020 (horizontal axis). A 45-degree line is shown in red to facilitate comparisons between the PDs at the two dates.
| 1Y CDS | Risk | Neutral | Historical | 1Y | 1Y CDS | Risk Neutral | Historical | 1Y | |||||
|---|---|---|---|---|---|---|---|---|---|---|---|---|---|
| Country | Spread | 1Y | PDs | PDs | Country | Spread | 1Y PDs | PDs | |||||
| 1st | 12th | 1st | 12th | 1st | 12th | 1st | 12th | 1st | 12th | 1st | 12th | ||
| Jan | Jun | Jan | Jun | Jan | Jun | Jan | Jun | Jan | Jun | Jan | Jun | ||
| Australia | 0.0 | 0.06 | 0.07 | 0.13 | 0.0 | 0.0 | Jamaica | 3.40 | 3.47 | 7.29 | 7.43 | 3.68 | 3.78 |
| Austria | 0.02 | 0.04 | 0.05 | 0.10 | 0.00 | 0.00 | Japan | 0.05 | 0.05 | 0.11 | 0.10 | 0.00 | 0.00 |
| Bahrain | 0.58 | 2.75 | 1.28 | 5.92 | 0.13 | 2.49 | Jordan | 3.51 | 3.51 | 7.51 | 7.51 | 3.83 | 3.84 |
| Belgium | 0.04 | 0.05 | 0.09 | 0.11 | 0.00 | 0.00 | Kazakhstan | 0.08 | 0.69 | 0.18 | 1.53 | 0.00 | 0.19 |
| Brazil | 0.36 | 1.30 | 0.80 | 2.84 | 0.05 | 0.61 | Latvia | 0.17 | 0.23 | 0.38 | 0.50 | 0.01 | 0.02 |
| Chile | 0.12 | 0.31 | 0.27 | 0.69 | 0.01 | 0.04 | Lithuania | 0.17 | 0.23 | 0.38 | 0.52 | 0.01 | 0.02 |
| China | 0.03 | 0.12 | 0.08 | 0.28 | 0.00 | 0.01 | Malaysia | 0.05 | 0.16 | 0.12 | 0.36 | 0.00 | 0.01 |
| Colombia | 0.16 | 0.60 | 0.36 | 1.33 | 0.01 | 0.14 | Mexico | 0.20 | 0.65 | 0.43 | 1.44 | 0.02 | 0.17 |
| Costa Rica | 3.34 | 3.64 | 7.16 | 7.78 | 3.57 | 4.03 | Netherlands | 0.03 | 0.05 | 0.06 | 0.11 | 0.00 | 0.00 |
| Côte d'Ivoire | 0.57 | 2.29 | 1.26 | 4.96 | 0.13 | 1.77 | Norway | 0.03 | 0.04 | 0.06 | 0.09 | 0.00 | 0.00 |
| Croatia | 0.15 | 0.17 | 0.34 | 0.38 | 0.01 | 0.01 | Panama | 0.06 | 0.49 | 0.14 | 1.08 | 0.00 | 0.10 |
| Cyprus | 0.48 | 0.48 | 1.06 | 1.05 | 0.09 | 0.09 | Peru | 0.07 | 0.30 | 0.16 | 0.66 | 0.00 | 0.04 |
| Czech Republic | 0.06 | 0.09 | 0.14 | 0.20 | 0.00 | 0.00 | Philippines | 0.05 | 0.15 | 0.11 | 0.34 | 0.00 | 0.01 |
| Denmark | 0.01 | 0.01 | 0.03 | 0.03 | 0.00 | 0.00 | Poland | 0.16 | 0.15 | 0.35 | 0.32 | 0.01 | 0.01 |
| Dominican Republic | 1.35 | 1.99 | 2.96 | 4.32 | 0.66 | 1.36 | Portugal | 0.11 | 0.18 | 0.24 | 0.40 | 0.01 | 0.01 |
| Egypt | 1.85 | 2.72 | 4.02 | 5.87 | 1.19 | 2.45 | Qatar | 0.05 | 0.37 | 0.10 | 0.82 | 0.00 | 0.06 |
| El Salvador | 3.30 | 3.63 | 7.08 | 7.76 | 3.49 | 4.01 | Romania | 0.12 | 0.92 | 0.27 | 2.03 | 0.01 | 0.32 |
| Estonia | 0.23 | 0.23 | 0.50 | 0.52 | 0.02 | 0.02 | Russia | 0.06 | 0.41 | 0.14 | 0.90 | 0.00 | 0.07 |
| Finland | 0.02 | 0.04 | 0.05 | 0.09 | 0.00 | 0.00 | Saudi Arabia | 0.12 | 0.47 | 0.27 | 1.04 | 0.01 | 0.09 |
| France | 0.04 | 0.05 | 0.08 | 0.12 | 0.00 | 0.00 | Slovakia | 0.09 | 0.14 | 0.20 | 0.30 | 0.00 | 0.01 |
| Germany | 0.02 | 0.04 | 0.04 | 0.10 | 0.00 | 0.00 | Slovenia | 0.16 | 0.30 | 0.36 | 0.67 | 0.01 | 0.04 |
| Ghana | n.a. | n.a | n.a. | n.a. | n.a. | n.a | South Africa | 0.49 | 1.67 | 1.07 | 3.65 | 0.10 | 0.99 |
| Greece | 0.27 | 0.47 | 0.61 | 1.05 | 0.03 | 0.09 | South Korea | 0.09 | 0.14 | 0.19 | 0.31 | 0.00 | 0.01 |
| Guatemala | 2.95 | 3.32 | 6.36 | 7.11 | 2.84 | 3.52 | Spain | 0.09 | 0.22 | 0.20 | 0.49 | 0.00 | 0.02 |
| Hong Kong | 0.12 | 0.14 | 0.26 | 0.31 | 0.01 | 0.01 | Sweden | 0.03 | 0.04 | 0.06 | 0.10 | 0.00 | 0.00 |
| Hungary | 0.12 | 0.37 | 0.27 | 0.82 | 0.01 | 0.06 | Thailand | 0.05 | 0.08 | 0.11 | 0.18 | 0.00 | 0.00 |
| Iceland | 0.38 | 0.44 | 0.84 | 0.98 | 0.06 | 0.08 | Trinidad | 0.33 | 1.23 | 0.74 | 2.70 | 0.05 | 0.56 |
| India | 0.14 | 0.16 | 0.32 | 0.35 | 0.01 | 0.01 | Turkey | 0.99 | 4.12 | 2.18 | 8.74 | 0.37 | 4.74 |
| Indonesia | 0.08 | 0.39 | 0.18 | 0.87 | 0.00 | 0.06 | U.K. | 0.06 | 0.09 | 0.14 | 0.19 | 0.00 | 0.00 |
| Iraq | 7.38 | 7.43 | 15.13 | 15.22 | 10.68 | 10.78 | Ukraine | 3.90 | 3.87 | 8.30 | 8.24 | 4.41 | 4.36 |
| Ireland | 0.06 | 0.06 | 0.13 | 0.13 | 0.00 | 0.00 | United States | 0.07 | 0.05 | 0.16 | 0.10 | 0.00 | 0.00 |
| Israel | 0.05 | 0.21 | 0.11 | 0.47 | 0.00 | 0.02 | Uruguay | 0.44 | 1.41 | 0.96 | 3.09 | 0.08 | 0.72 |
| Italy | 0.35 | 0.77 | 0.77 | 1.70 | 0.05 | 0.23 | Viet Nam | 0.19 | 0.54 | 0.41 | 1.20 | 0.02 | 0.12 |
Note: This table compares the estimated 1-year risk-neutral and historical PDs for different countries on 01/01/2020 and 12/06/2020.
| Country | Spread | 5Y | PDs | PDs | Country | Spread | 5Y | PDs | PDs | ||||
|---|---|---|---|---|---|---|---|---|---|---|---|---|---|
| 1st | 12th | 1st | 12th | 1st | 12th | 1st | 12th | 1st | 12th | 1st | 12th | ||
| Jan | Jun | Jan | Jun | Jan | Jun | Jan | Jun | Jan | Jun | Jan | Jun | ||
| Australia | 0.16 | 0.22 | 1.78 | 2.37 | 1.14 | 1.39 | Jamaica | 3.80 | 3.82 | 34.43 | 34.61 | 8.27 | 8.30 |
| Austria | 0.09 | 0.14 | 0.94 | 1.52 | 0.60 | 0.97 | Japan | 0.20 | 0.20 | 2.24 | 2.18 | 1.34 | 1.31 |
| Bahrain | 1.59 | 3.61 | 16.15 | 33.05 | 5.00 | 8.06 | Jordan | 3.50 | 3.50 | 32.20 | 32.20 | 7.93 | 7.93 |
| Belgium | 0.13 | 0.21 | 1.45 | 2.28 | 0.93 | 1.36 | Kazakhstan | 0.58 | 1.28 | 6.24 | 13.27 | 2.65 | 4.39 |
| Brazil | 0.99 | 2.61 | 10.43 | 25.17 | 3.74 | 6.73 | Latvia | 0.62 | 0.63 | 6.67 | 6.79 | 2.77 | 2.81 |
| Chile | 0.42 | 0.91 | 4.58 | 9.63 | 2.16 | 3.54 | Lithuania | 0.59 | 0.66 | 6.39 | 7.03 | 2.69 | 2.88 |
| China | 0.32 | 0.52 | 3.54 | 5.60 | 1.82 | 2.47 | Malaysia | 0.36 | 0.77 | 3.91 | 8.21 | 1.95 | 3.19 |
| Colombia | 0.73 | 1.64 | 7.76 | 16.65 | 3.07 | 5.11 | Mexico | 0.78 | 1.64 | 8.35 | 16.62 | 3.22 | 5.10 |
| Costa Rica | 3.91 | 4.52 | 35.24 | 39.51 | 8.41 | 9.09 | Netherlands | 0.10 | 0.13 | 1.08 | 1.46 | 0.69 | 0.93 |
| Côte d'Ivoire | 2.36 | 5.51 | 23.03 | 45.79 | 6.33 | 14.17 | Norway | 0.09 | 0.13 | 1.01 | 1.46 | 0.64 | 0.93 |
| Croatia | 0.58 | 0.75 | 6.25 | 8.03 | 2.66 | 3.14 | Panama | 0.43 | 1.14 | 4.66 | 11.90 | 2.19 | 4.08 |
| Cyprus | 0.95 | 0.94 | 9.98 | 9.92 | 3.63 | 3.61 | Peru | 0.42 | 0.92 | 4.56 | 9.71 | 2.15 | 3.56 |
| Czech Republic | 0.37 | 0.39 | 4.06 | 4.26 | 1.99 | 2.05 | Philippines | 0.35 | 0.68 | 3.76 | 7.26 | 1.90 | 2.94 |
| Denmark | 0.08 | 0.10 | 0.84 | 1.12 | 0.54 | 0.71 | Poland | 0.57 | 0.58 | 6.19 | 6.24 | 2.64 | 2.65 |
| Dominican Republic | 2.81 | 3.44 | 26.83 | 31.76 | 7.01 | 7.86 | Portugal | 0.33 | 0.58 | 3.62 | 6.20 | 1.84 | 2.64 |
| Egypt | 3.00 | 5.34 | 28.34 | 44.77 | 7.27 | 12.69 | Qatar | 0.37 | 0.82 | 4.00 | 8.74 | 1.97 | 3.32 |
| El Salvador | 3.69 | 3.92 | 33.61 | 35.34 | 8.15 | 8.42 | Romania | 0.76 | 1.46 | 8.10 | 14.96 | 3.15 | 4.75 |
| Estonia | 0.55 | 0.55 | 5.94 | 5.95 | 2.57 | 2.57 | Russia | 0.56 | 0.93 | 5.99 | 9.78 | 2.58 | 3.57 |
| Finland | 0.09 | 0.16 | 1.02 | 1.72 | 0.65 | 1.10 | Saudi Arabia | 0.59 | 1.00 | 6.30 | 10.52 | 2.67 | 3.76 |
| France | 0.14 | 0.20 | 1.58 | 2.23 | 1.01 | 1.33 | Slovakia | 0.39 | 0.53 | 4.21 | 5.76 | 2.04 | 2.52 |
| Germany | 0.08 | 0.15 | 0.88 | 1.65 | 0.56 | 1.05 | Slovenia | 0.60 | 0.75 | 6.41 | 8.03 | 2.70 | 3.14 |
| Ghana | 3.61 | 6.69 | 33.04 | 52.43 | 8.06 | 25.13 | South Africa | 1.62 | 2.91 | 16.49 | 27.59 | 5.08 | 7.14 |
| Greece | 0.98 | 1.29 | 10.36 | 13.39 | 3.72 | 4.42 | South Korea | 0.23 | 0.28 | 2.48 | 3.08 | 1.44 | 1.66 |
| Guatemala | 3.34 | 3.63 | 30.96 | 33.20 | 7.72 | 8.08 | Spain | 0.35 | 0.65 | 3.79 | 6.94 | 1.91 | 2.85 |
| Hong Kong | 0.40 | 0.43 | 4.35 | 4.66 | 2.08 | 2.19 | Sweden | 0.09 | 0.12 | 1.02 | 1.31 | 0.65 | 0.84 |
| Hungary | 0.74 | 0.78 | 7.91 | 8.26 | 3.10 | 3.20 | Thailand | 0.24 | 0.45 | 2.65 | 4.89 | 1.50 | 2.26 |
| Iceland | 0.78 | 0.80 | 8.29 | 8.53 | 3.21 | 3.27 | Turkey | 2.77 | 4.77 | 26.51 | 41.16 | 6.96 | 9.33 |
| Indonesia | 0.63 | 1.33 | 6.80 | 13.75 | 2.81 | 4.50 | U.K. | 0.17 | 0.27 | 1.89 | 2.91 | 1.20 | 1.60 |
| Iraq | 8.51 | 8.60 | 61.17 | 61.54 | 43.01 | 43.86 | United States | 0.12 | 0.10 | 1.30 | 1.13 | 0.83 | 0.72 |
| Ireland | 0.21 | 0.27 | 2.27 | 2.92 | 1.35 | 1.60 | Ukraine | 4.94 | 4.75 | 42.21 | 41.04 | 9.48 | 9.31 |
| Israel | 0.50 | 0.59 | 5.39 | 6.30 | 2.40 | 2.67 | Uruguay | 1.11 | 2.24 | 11.63 | 22.07 | 4.02 | 6.16 |
| Italy | 1.00 | 1.42 | 10.56 | 14.56 | 3.77 | 4.67 | Viet Nam | 0.89 | 1.79 | 9.37 | 18.06 | 3.48 | 5.38 |
Note: This table compares the estimated 5-year risk-neutral and historical PDs for different countries on 01/01/2020 and 12/06/2020.
3.3 Real-Time Ratings by Country
Table 3.5 shows the real-time ratings inferred from the implied historical 5-year and 1-year PDs at the beginning of the year and recent times. The corresponding PD cut-offs are shown in Tables 3.1 and 3.2 respectively.
Based on the ratings inferred from the 1-year historical PDs the real-time ratings of 27 countries remain the same. The largest drop in the real-time rating is seen for Kazakhstan, Panama and Romania with a drop of 7 notches, followed by Qatar and Russia (drop of 6 notches) and Bahrain, Ivory Coast, Indonesia, Peru, Saudi Arabia and Trinidad (drop of 5 notches).
Based on the real-time ratings inferred from the 5-year historical PDs, 25 out of 66 countries have no change in the implied ratings compared to the beginning of the year. Rest of the countries have worse implied real-time ratings ranging from 1 to 5 notches. Bahrain and Panama have the largest drop in the ratings (5 notches) followed by Bahrain, Chile, Colombia, Indonesia, Mexico, Peru and Philippines (4 notches).
From the real-time ratings implied by 1-year probabilities, the average rating declines for Europe is 1.1 notches, for Middle East is 3.1, for Asia & Pacific is 2.2, for South & Latin America is 2.8, for Africa is 4.5 and for North America is 0.0. The region definitions are listed in Section 2.1.
From real-time ratings implied by 5-year probabilities, the average rating drop for Europe is 0.8 notches, Middle East is 1.8, Asia & Pacific is 2.0, South & Latin America is 2.5, Africa is 2.7 and North America is 0.0. The average rating change is highest in Africa based on both 1-year and 5-year PDs.
Within Europe, the highest real-time rating drops are seen in Romania, and Portugal, Romania and Spain based on 1-year and 5-year PDs respectively. In the Middle East, the largest drops are in Qatar and Bahrain. In Asia & Pacific, Kazakhstan and Philippines and Indonesia suffer the biggest drops. In South and Latin America, Panama and Brazil have the largest real-time rating drops.
| Table 3.5: | Ratings | Implied | by the | Implied | Historical | PDs | ||||||||||
|---|---|---|---|---|---|---|---|---|---|---|---|---|---|---|---|---|
| Panel a) Ratings | inferred | from | 1-year CDS | Panel b) Ratings | inferred | from | 5-year CDS | |||||||||
| 1st | 12th | Notch | 1st | 12th | Notch | 1st | 12th | Notch | 1st | 12th | Notch | |||||
| Country | Jan | Jun | drop | Country | Jan | Jun | drop | Country | Jan | Jun | drop | Country | Jan | Jun | drop | |
| Australia | AA | AA | 0 | Jamaica | B- | B- | 0 | Australia | AAA | AA+ | 1 | Jamaica | B | B | 0 | |
| Austria | AA | AA | 0 | Japan | AA | AA | 0 | Austria | AAA | AAA | 0 | Japan | AA+ | AA+ | 0 | |
| Bahrain | BBB- | B | 5 | Jordan | B- | B- | 0 | Bahrain | BB+ | B | 4 | Jordan | B | B | 0 | |
| Belgium | AA | AA | 0 | Kazakhstan | AA- | BB+ | 7 | Belgium | AAA | AA+ | 1 | Kazakhstan | A- | BBB- | 3 | |
| Brazil | BBB | BB- | 4 | Latvia | A | A- | 1 | Brazil | BBB | B+ | 5 | Latvia | A- | A- | 0 | |
| Chile | A+ | BBB+ | 3 | Lithuania | A | A- | 1 | Chile | A+ | BBB | 4 | Lithuania | A- | A- | 0 | |
| China | AA | A+ | 2 | Malaysia | AA | A | 3 | China | AA- | A | 2 | Malaysia | A+ | BBB+ | 3 | |
| Colombia | A | BBB- | 4 | Mexico | A- | BB+ | 4 | Colombia | BBB+ | BB | 4 | Mexico | BBB+ | BB | 4 | |
| Costa Rica | B- | B- | 0 | Netherlands | AA | AA | 0 | Costa Rica | B | B- | 1 | Netherlands | AAA | AAA | 0 | |
| Côte d'Ivoire | BBB- | B | 5 | Norway | AA | AA | 0 | Côte d'Ivoire | BB- | B- | 3 | Norway | AAA | AAA | 0 | |
| Croatia | A | A | 0 | Panama | AA | BBB- | 7 | Croatia | A- | BBB+ | 1 | Panama | A+ | BBB- | 5 | |
| Cyprus | BBB- | BBB- | 0 | Peru | AA | BBB+ | 5 | Cyprus | BBB | BBB | 0 | Peru | A+ | BBB | 4 | |
| Czech Republic | AA | AA- | 1 | Philippines | AA | A | 3 | Czech Republic | A+ | A+ | 0 | Philippines | AA- | BBB+ | 4 | |
| Denmark | AA | AA | 0 | Poland | A | A | 0 | Denmark | AAA | AAA | 0 | Poland | A- | A- | 0 | |
| Dominican Republic | BB- | B+ | 1 | Portugal | A+ | A | 1 | Dominican Republic | B+ | B | 1 | Portugal | AA- | A- | 3 | |
| Egypt | B+ | B | 1 | Qatar | AA | BBB | 6 | Egypt | B+ | B- | 2 | Qatar | A+ | BBB+ | 3 | |
| El Salvador | B- | B- | 0 | Romania | A+ | BB | 7 | El Salvador | B | B | 0 | Romania | BBB+ | BB+ | 3 | |
| Estonia | A- | A- | 0 | Russia | AA | BBB | 6 | Estonia | A- | A- | 0 | Russia | A- | BBB | 2 | |
| Finland | AA | AA | 0 | Saudi Arabia | A+ | BBB- | 5 | Finland | AAA | AAA | 0 | Saudi Arabia | A- | BBB | 2 | |
| France | AA | AA | 0 | Slovakia | AA- | A+ | 1 | France | AAA | AA+ | 1 | Slovakia | A+ | A | 1 | |
| Germany | AA | AA | 0 | Slovenia | A | BBB+ | 2 | Germany | AAA | AAA | 0 | Slovenia | A- | BBB+ | 1 | |
| Ghana | n.a | n.a. | n.a | South Africa | BBB- | B+ | 4 | Ghana | B | CCC | 2 | South Africa | BB+ | B+ | 3 | |
| Greece | BBB+ | BBB- | 2 | South Korea | AA- | A+ | 1 | Greece | BBB | BB+ | 2 | South Korea | AA+ | AA | 1 | |
| Guatemala | B- | B- | 0 | Spain | AA- | A- | 3 | Guatemala | B | B | 0 | Spain | AA- | A- | 3 | |
| Hong Kong | A+ | A+ | 0 | Sweden | AA | AA | 0 | Hong Kong | A+ | A+ | 0 | Sweden | AAA | AAA | 0 | |
| Hungary | A+ | BBB | 4 | Thailand | AA | AA- | 1 | Hungary | BBB+ | BBB+ | 0 | Thailand | AA | A | 3 | |
| Iceland | BBB | BBB | 0 | Trinidad | BBB+ | BB- | 5 | Iceland | BBB+ | BBB+ | 0 | Trinidad | BBB | BB+ | 2 | |
| India | A | A | 0 | Turkey | BB | B- | 4 | India | BBB+ | BBB+ | 0 | Turkey | B+ | B- | 2 | |
| Indonesia | AA- | BBB | 5 | U.K. | AA | AA- | 1 | Indonesia | A- | BB+ | 4 | U.K. | AAA | AA | 2 | |
| Iraq | B- | B- | 0 | Ukraine | B- | B- | 0 | Iraq | CCC | CCC | 0 | Ukraine | B- | B- | 0 | |
| Ireland | AA | AA | 0 | United States | AA | AA | 0 | Ireland | AA+ | AA | 1 | United States | AAA | AAA | 0 | |
| Israel | AA | A- | 4 | Uruguay | BBB | BB- | 4 | Israel | A | A- | 1 | Uruguay | BBB- | BB- | 3 | |
| Italy | BBB | BB+ | 2 | Viet Nam | A | BBB- | 4 | Italy | BBB | BB+ | 2 | Viet Nam | BBB | BB | 3 |
4. Conclusion
This note presents simple techniques for inferring real-time, point-in-time ratings on an extremely timely basis from market data on Credit Default Swap (CDS) spreads. We implement this approach for 66 countries and use it to examine how implied sovereign real-time ratings have declined since the start of 2020 reflecting the incidence on different governments of the Covid-19 crisis.
An alternative to this approach is to employ equity index data. This approach can be used for a larger set of countries but has the drawback that sovereign and corporate credit quality in countries may diverge. (In practice, we do not expect this to be a major drawback in a crisis period since both public and private sectors of the economy are likely to move closely together in crisis periods.) Using the equity-index-based approach, we have implemented country-level default probabilities in a related research note.
The results provide important perspectives on the incidence of the crisis on government finances and sovereign solvency round the world. Some particularly vulnerable countries in which the government response to the crisis has been weak fare poorly. Examples include Russia, Brazil and Indonesia. Other countries that have handled medical aspects of the crisis well nevertheless suffer substantial deterioration in sovereign credit standing because of their nature as open economies reliant on tourism, for example Greece.
In the last few weeks, some improvement in the real-time ratings of lower credit quality emerging market countries has been evident, particularly when these ratings are inferred from 1-year PDs. The real-time ratings of some higher rated borrowers have deteriorated or remained stable depending on the horizon of PDs employed in the benchmarking.
References
Standard & Poor’s (2018a) “2017 Annual Global Sovereign Default Study and Rating Transitions,” May, New York, United States: Standard & Poor’s.
Standard & Poor’s (2018b) “2017 Annual Global Corporate Default Study and Rating Transitions,” April, New York, United States: Standard & Poor’s.
Appendix
A1 Making the Sovereign PDs Monotone As the PDs directly obtained from the transition matrices or the CDS spread data may be non-monotonic, we obtain fitted sovereign PDs by running an OLS regression on the log of PDs as shown below. The following approach is also used to regularize PDs implied by the CDS spread data.
log(PDi) = a+ bi (A1)
where i ranges from 1 to 17 corresponding to rating notches ‘AAA’ to ‘B-’. Note that the PD for ‘CCC’ is not included in this regression and the value of the ‘CCC’ PD is taken to be the original observed value.
A2 Obtaining CDS Spread-implied Risk-neutral PDs The following shows the calculation of PDs from CDS spread under the risk-neutral measure, Q. For CDS spread, the current value of floating leg is
T N× ∫t=0 D(t) × S× (1 −PDtQ)dt (A2)
The current value of fixed leg is T Q N× ∫t=0 D(t) × (PDt+dt −PDtQ) × LGDdt (A3)
Q is the risk-neutral default Here N is the notional of CDS contract, D(t) is discount factor, S is CDS spread, PDt probability at time t, T is the maturity of CDS contract and LGD is loss given default.
Assuming flat risk-free rate term structure and continuous interest rate compounding,
D(t) = e−rt (A4)
Here, r is instantaneous interest rate.
Q follows Suppose that PDt t Qds Q = 1 −e−∫λs (A5) PDt
Q is the hazard rate at time s. Here, λs
Q constant, we derive Holding λs Q = 1 −e−λQt (A6) PDt
Q in equation (A2.2) and (A2.3) by equation (A2.4) and (A2.5), and set (A2.2) equals Substituting D(t) and PDt (A2.3), we derive λQ = S/LGD (A7)
Substituting (A2.7) into (A2.6), we obtain for time t= T
Q = 1 −e−S×T/LGD (A8) PDT
Here we assume LGD= 0.45 and T= 1 and 5.
Risk Control Limited 13-14 Dean Street London W1D 3RS +44 (0)203 307 0730 www.riskcontrollimited.com
Notes
[1] This note is an update using more recent data of an earlier Risk Control study with the same title. The earlier study was issued on 22-5-2020 and has document number 20-65a. Some PDs and ratings in that study were slightly different reflecting changes in the way we filter individual CDS contracts before performing calculations.
[2] This ‘hierarchy’ represents a methodological choice that is adopted here for illustration purposes only. A given financial institution wishing to use the approach could adopt its own hierarchy or some alternative way of generating a combination of ratings based on notions of ‘equal weight’ or a conservative rule based on ‘lower of’.
[3] The data for historical sovereign and corporate default probabilities employed in this study come from S&P (2018a) and S&P (2018b).
[4] The PDs for the higher ratings categories have also increased but are too small for this to show in the table.