

Key findings
- On ratings, although all three agencies would initially judge the stylised bank to be AAA, the methodologies lead to very different results. This is demonstrated with expansion of DRAs rapidly leading to a downgrade in the Moody’s rating but not in that of Standard & Poor’s. (Note that the greater headroom that our stylised MDB enjoys under the S&P methodology reflects the allowance that S&P makes for callable capital.)
- The relationship between rating downgrades and DRA expansion is highly non-linear in its impact on the number of notches. So, the scope for one or other rating to experience severe downgrades as DRAs expand is great.
- For the notional MDB, substantial growth of the portfolio would appear to be possible if an AA rating is deemed acceptable. The calculations do not allow for the long-run impact on the MDB of a deterioration in the spreads it would face in the bond market or any re-evaluation by the rating agencies of the MDB’s governance or credit risk controls. Some MDBs already have relatively high leverage ratios which are currently offset by other aspects of the rating methodologies.
- On Economic-Capital-based assessments of capital adequacy, the confidence level of the stylised MDB is very high, i.e., the probability of failure is vanishingly small before the portfolio is boosted. Based on the calculations reported here, the MDB could expand its DRAs by 300% before its probability of exhausting capital over a 3-year horizon exceeds 1 basis point. (Here, we do not allow for the capital demands of market or operational risks which tend to be minor for MDBs but we do not allow either for callable capital.)
- Our calculations suggest that the rating agencies would downgrade the notional MDB after DRA expansions of 197%, 11% and 34% in the cases of S&P, Moody’s, and Fitch, respectively. The relatively large headroom under S&P reflects the allowance that agency makes for callable capital. If, in its qualitative choices, S&P a took less favourable view of the reliability of the MDB’s callable capital than we assume in our central-case assumptions, the headroom would shrink to 43% (see the Appendix and Table A1, in particular). This result is consistent with the conclusion that the rating agency evaluation of AAA status for MDBs is too conservative and suggests that the allowance they make for preferred Credit Treatment (PCT) is insufficient.
1. Introduction
This note presents analysis of how the agency ratings of a Multilateral Development Bank (MDB) are affected by a proportionate expansion in its Development Related Assets (DRAs) and liabilities while capital resources are kept constant. We identify the ratios that the rating agencies employ in rating MDBs and compute, for a stylised example MDB, how much this MDB can expand its lending before different ratios trigger ratings downgrades.
The modeling of ratings impact is based on a detailed analysis of CRA methodologies, building on Risk Control’s experience in working on the application of these methodologies to actual MDBs. The calculations are performed using Risk Control’s Rating Scenario System. This software replicates the full scorecard of MDB ratings for the three major rating agencies, Fitch, Moody’s and Standard & Poor’s. The analysis demonstrates the considerable variation among the MDB rating methodologies of the three major agencies and how their criteria bind in very different ways as a particular MDB changes its strategy.
The calculations are performed using asset, liability and other financial data for a stylised MDB. Development Related Asset (DRA) data for this MDB have been created using publicly available information from other existing MDBs. The liability non-DRA asset and other financial data employed are comparable to data that we have encountered in earlier assignments with MDBs.
The rating exercise reported here is a conceptual experiment designed to improve understanding of how MDB ratings are affected by increases in lending. The “stylized” MDB employed is designed to be realistic and representative but the actual impact of expansion on ratings can vary substantially across MDBs, depending on other aspects of their activities and business model. The numbers we present should, therefore, not be interpreted as the actual lending headroom of other MDBs.
To examine whether rating agency views of MDBs are conservative, we also compute credit risk Economic Capital estimates for the stylised MDB. The Economic Capital estimates (using credit Value-at-Risk (VaR) and Expected Shortfall (ES) measures) are calculated using Risk Control’s RC-Capital Model, an industry standard, rating-based credit portfolio model. This approach closely resembles those followed by MDBs. RC-Capital Model is used for this purpose by several MDBs, and others employ comparable methodologies.
The note is organised as follows. Section 2 describes the data used in the calculation including the balance sheet of the stylised MDB and summaries the VaR and ES calculation methodology. Section 3 presents the results and Section 4 concludes.
2. Data and methodology
2.1 Ratings calculations
This section provides a description of the assets and liabilities data for the stylised MDB the note considers. These data were compiled using public information on the balance sheets of several prominent and familiar MDBs. A summary balance sheet is shown in Table 1.
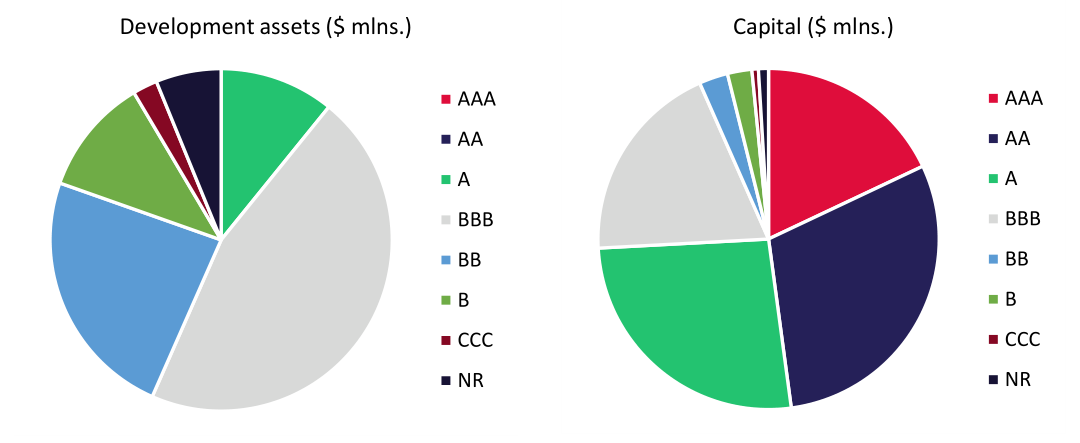
Figure 1 shows the rating distribution of Development Related Assets (loans and equity investments) in the first panel and the distribution of capital provided the member states in the second panel. The stylised MDB’s callable capital is equal to four times its total equity which may be regarded as representative, although the ratio varies substantially across such banks.
The parameter data used to perform the rating calculations are specified by the rating agencies in the MDB rating criteria documents, with some exceptions. The geographic concentration matrix used by S&P to calculate the geographic concentration RAC ratio adjustment is recalculated based on the methodology described in the S&P methodology document. The factor weights used in the Fitch rating calculation are approximately inferred based on the replication of MDB ratings. Sovereign ratings are taken as of November 2021. BICRA and ERG scores are taken from Standard & Poor’s (2021).
| Assets | |
|---|---|
| Development assets (sovereign) | 45,000,000 |
| Development assets (non-sovereign) | 5,000,000 |
| Equity investments | 3,000,000 |
| Treasury assets | 16,500,000 |
| Cash | 500,000 |
| Total assets | 70,000,000 |
| Liabilities | |
| Debt securities | 48,000,000 |
| Total liabilities | 48,000,000 |
| Equity | |
| Paid-in capital | 15,000,000 |
| Other reserves | 7,000,000 |
| Total equity | 22,000,000 |
2.2 Economic Capital calculations
The VaR and ES calculations mentioned in the introduction are performed using a Monte Carlo that approximates the distribution of portfolio value at a given risk horizon. The distribution is computed based on the simulated evolution of credit ratings according to a Markov chain model, with transitions driven by a region-based factor model. The parameters employed in this model consist of sovereign and corporate transition matrices, which are taken from S&P’s 2021 global default and rating transitions studies, and a region correlation matrix, for which we use the same S&P equity index correlation matrix that is used in the S&P rating analysis. Exposures are repriced at the horizon using USD swap rates and credit spreads generated (with additional risk premia) from the rating transition matrices.
Conservative assumptions are adopted for the VaR and ES calculations. The idiosyncratic risk weight is taken to be 0% for sovereign loans and 53% for corporate loans and equity investments, based on prior calibration analyses. The recovery rate for sovereign loans is taken to be 90%, which may be regarded as a conservative ‘best-guess’ estimate. The recovery rate for corporate loans is taken to be 55%, in line with the Basel foundation approach. The annualised volatility of equity investment returns is taken to be 25%. 1,000,000 simulations were used for all VaR and ES calculations.
The covariance matrix of country risk factors employed in the VaR and ES calculations is estimated using equity returns. The estimation approach employed mimics, as far as we are able to discern, in data inputs and methodology, the approach followed by Standard & Poor’s in its calibration of a country-equity-index correlation matrix for use in that agency’s Risk Adjusted Capital Framework (RACF) approach to evaluating the credit quality of MDBs.
3. Results
3.1 Rating results
Table 2 shows a set of ratios that crucially affect rating calculations for the major regional MDBs. (Some other ratios may be important for specific MDBs, for example those that specialise in private sector lending or equity investments.) We do not here evaluate the usefulness of the ratios appearing in Table 2 as indicators of risk.
CC/equity is the ratio of callable capital to paid in equity and reserves. This varies widely across MDBs, as may be seen from the table. It should be noted that some MDBs have no callable capital at all. The Risk Adjusted Capital (RAC) ratio is S&P’s measure of capital adequacy and is loosely based on Basel capital ratios in that the ratio equals capital resources divided by a complex computation of Risk Weighted Assets (RWAs). The Moody’s ratios identified here are Assets to Equity and Callable Capital to Debt. The Fitch ratios are Equity to Assets and a Capital to RWAs ratio that, like S&P’s RAC ratio, is a complex agency-specific computation broadly comparable to a Basel capital ratio.
For each ratio, we provide the value for particular MDBs and then compare these values with that implied by the stylised MDB data we have constructed for our analysis. The stylised MDB has a comparatively high RAC ratio and a comparatively low leverage ratio, which means to say that its portfolio is evaluated unfavourably when a risk-insensitive approach (the leverage ratio) is employed, but favourably by a more risk sensitive approach.
Table 3 shows the results of rating calculations for the stylised MDB. For each rating agency, the leftmost column shows the percentage increases in the sizes of Development Related Assets (DRAs), including equity investments that result in downgrades to the ratings shown on the left. The increases are applied proportionately across all exposures and are balanced by increases in liabilities. The subsequent columns show the impact of the increase in DRAs on key ratios that are used to determine the rating. A ratio is highlighted in red if the downgrade is driven by the change in that ratio. For example, increasing development assets by more than 182% results in a downgrade of the Moody's rating to AA- (or Aa3). This downgrade is driven by the decrease of the contractual support ratio to 60.9%.
The S&P rating downgrades are driven by a decline in the RAC ratio, which has an initial value of 32.3%. The RAC ratio is first calculated excluding callable capital and guarantees and then calculated again (in the assessment of the enhanced Financial Risk Profile (FRP)) taking in account callable capital and guarantees. Only callable capital from shareholders with ratings not lower than the Stand-Alone Credit Profile (SACP) of the MLI is included in the enhanced RAC ratio calculation. Both RAC ratio calculations may impact the final rating. The uplift in rating from callable capital is capped at 3 notches or less depending on the bank’s Policy Importance. This is determined by the answers to three questions about the likelihood that callable capital could indeed be successfully called. Here, we assume that S&P is confident in the reliability of the callable capital and that Policy Importance of the institution is judged to be high.
The Moody’s and Fitch rating downgrades are driven by changes in leverage ratios (assets/equity for Moody’s and equity/assets for Fitch). The Moody’s rating is also affected by the contractual support ratio (callable capital/total debt) while the Fitch rating is affected by the MDB’s usable capital/risk-weighted assets ratio and liquidity buffer (liquidity assets/short-term debt).
The results show that the bank is close to the threshold for a rating downgrade from Moody’s before the expansion in DRAs commences. They also highlight the non-linear nature of the impact of balance sheet expansion on the integer number of notch downgrades and the limited headroom that MDBs face when they are rated by multiple agencies. Indeed, an important finding of our study is that variation across rating agency methodologies means that an MDB considering a change in its strategy (for example, an expansion its DRAs), faces multiple inconsistent constraints from the different agencies that rate it.
Note that several other factors play a role in determining the agency ratings, both quantitative and qualitative. For example, Moody’s assess capital adequacy by taking a weighted average of the leverage ratio assessment, a development assets credit quality assessment and an asset performance assessment. An MDB with higher credit quality development assets or a record of strong asset performance might be able to expand its balance sheet further without being downgraded.
Inspecting Table 3, one may note that, on the face of it, the notional AAA-rated MDB could increase its DRA assets by 425%, 182% and 170% before the ratings of S&P, Moody’s and Fitch, respectively, fall to AA-. However, this calculation does not allow for the long-run effects of the deterioration in funding costs that the MDB would experience if it adopted policies that involved such portfolio expansion.
Furthermore, the rating agencies might alter judgmental aspects of their credit assessments if they thought that governance and sound credit disciplines had been relaxed. Finally, some MDBs have high leverage ratios that are offset, in agency evaluations, by other aspects of the rating calculation. Whether it is realistic to expect that these MDBs could expand their balance sheets substantially without suffering downgrades might be questioned.
| Development | Assets/Equity | CC/Debt | ratio Equity/Assets | Capital/RWA | |||
|---|---|---|---|---|---|---|---|
| assets | CC/Equity ($, 000) | RAC ratio (%) | ratio | (%) (%) | ratio (%) | (%) | |
| IBRD | 211,129 | 6.7 | 24 | 513.8 | 111.0 | 15.1 | 44.2 |
| ADB | 132,818 | 2.8 | 35 | 223.9 | 132.9 | 28.0 | |
| IADB | 105,549 | 4.9 | 21 | 314.6 | 150.0 | 22.1 | 49.3 |
| AfDB | 34,079 | 12.0 | 19 | 298.6 | 230.3 | 22.0 | 37.0 |
| Stylised | 53,000 | 4.0 | 32 | 227.3 | 183.3 | 31.4 | 94.4 |
Note: The ratios shown for each MDB are as of 2020 and were obtained from rating agency reports. The IBRD coverage of net debt by callable capital and ADB capital/RWA ratio were not included in the most recent Fitch reports. Development assets are as measured by S&P.
| DRA | Enhanced | RAC DRA | Assets/Equity | CC/Debt | ratio DRA | Equity/Assets | Capital/RWA | ||
|---|---|---|---|---|---|---|---|---|---|
| growth | RAC ratio (%) | (%) ratio (%) | growth | (%) ratio | (%) (%) | growth | (%) ratio (%) | (%) | |
| Base | 0 | 32.3 | 56.5 | 0 | 227.3 | 183.3 | 0 | 31.4 | 94.4 |
| AA+ | 197 | 10.0 | 55.4 | 11 | 252.3 | 163.5 | 34 | 25.0 | 70.4 |
| AA | 281 | 7.0 | 26.7 | 77 | 402.3 | 99.1 | 34 | 25.0 | 70.4 |
| AA- | 425 | 5.0 | 20.3 | 182 | 640.9 | 60.9 | 170 | 13.7 | 35.0 |
| A+ | 425 | 5.0 | 20.3 | 282 | 868.2 | 44.6 | 170 | 13.7 | 35.0 |
| A | 780 | 3.0 | 13.1 | 170 | 13.7 | 35.0 | |||
| A- | 296 | 9.7 | 23.8 |
Note: For each rating agency, the percentages shown in the leftmost column equal the percentage increases in Development Related Assets (DRAs) that generate a decline in the rating from an initial AAA level to the level shown in the first column. The remaining columns show the financial ratios corresponding to the increases in DRAs. The financial ratios that imply rating downgrades are highlighted in red. ‘CC’ denotes callable capital.
3.2 Value at Risk and Expected Shortfall
To provide some perspective of how conservative is the rating agency evaluation of MDBs, in this section we calculate credit risk Economic Capital for the stylised MDB. Note that here we only consider capital required to cover credit risk, omitting the capital demands of Market and Operational risks. In our experience, these are minor in MDBs. Interest and FX risks are systematically hedged or swapped out when funding instruments are issued, and historical experience suggests that operational risk appears is very limited.
Table 4 shows the credit value at risk and expected shortfall of the stylised MDB at confidence levels ranging from 99% to 99.99%. Results are shown for horizons of 1 year and 3 years. The 1 basis point confidence level 3year VaR is just over $5 billion. One might regard capital equal to a 1 bps confidence level, 3-year horizon VaR as consistent with a AAA rating. From Table 1, one may observe that the paid in equity plus reserves of the stylised MDBs used in this note is $22 billion. (Here, we make no allowance whatsoever for callable capital, only counting as capital paid in equity and accumulated reserves.) Even if one allows for the fact that we have omitted market and operational risk from consideration, this suggests that the stylised MDB is very substantially over-capitalised if the objective were to meet a AAA solvency standard.
An important aspect of the calculations here reported is that the calibration has been adjusted for Preferred Creditor Treatment (PCT). Most notably this means that while loans to Non-Sovereign Obligors (NSOs) are assumed to have Loss Given Default (LGD) rates of 45%, Sovereign Obligor (SO) exposures are assumed to have LGDs of 10%. Historical experience shows that such low LGDs (or even lower) are characteristic of MDB SO loans. In the companion notes to this document, we calibrate LGDs for MDBs.
Table 5 shows the VaRs that the stylised MDB would obtain if it expanded its DRAs to the degree associated with rating downgrades (inferring these latter expansions from Table 3). The figures shown in the second and third column of each rating-specific block of results in Table 5 equal the probabilities that the MDB’s losses will be less than the institution’s capital of $22 billion. Hence, if one were to employ a 3-year VaR as a basis for required capital, for all three agencies, it could expand its portfolio by 300% without its probability of exhausting its capital exceeding 1 basis point.
This is consistent with the implication of Table 4 that its capital requirement (at a 1 basis point, 3-year horizon level) is about a quarter of its capital resources. This may be compared to the DRA expansions that would trigger loss of AAA status for the stylised MDBs according to S&P, Moody’s and Fitch of 197%, 11% and 34%, respectively.
The implication has is that some agencies’ methodologies, when applied to an MDB similar to the one we study here, are much too conservative. In this case, the methodologies of Moody’s and Fitch are the most out of line with risk as measured by the industry standard VaR model. Note that, with our stylised MDB, the headroom for DRA expansion under the S&P rating methodology would be distinctly less if a more conservative assumption were made about how S&P evaluates the reliability of the MDB’s callable capital. (For more details, see the discussion in the Appendix.) In fact, the relatively large headroom apparent for S&P is attributable to the allowance the agency makes for callable capital. Without this, the headroom before a downgrade from AAA is just 43% increase in DRA assets (see Table A1 in the Appendix). Note that the VaR analysis makes no allowance for callable capital. Overall, the agencies might consider re-evaluating PCT as it affects MDB risk.
| level (%) | 1-year | 3-year | 1-year | 3-year |
|---|---|---|---|---|
| 99.00 | 2,023 | 2,617 | 2,613 | 3,128 |
| 99.50 | 2,476 | 2,954 | 2,999 | 3,491 |
| 99.90 | 3,319 | 3,796 | 3,792 | 4,425 |
| 99.95 | 3,673 | 4,246 | 4,109 | 4,858 |
| 99.99 | 4,450 | 5,284 | 4,734 | 5,782 |
Note: The VaR and ES are shown at varying confidence levels and at horizons of 1 year and 3 years.
| Base | 0 | 100.00 | 100.00 | 0 | 100.00 | 100.00 | 0 | 100.00 | 100.00 |
|---|---|---|---|---|---|---|---|---|---|
| AA+ | 197 | 100.00 | 100.00 | 11 | 100.00 | 100.00 | 34 | 100.00 | 100.00 |
| AA | 281 | 100.00 | 100.00 | 77 | 100.00 | 100.00 | 34 | 100.00 | 100.00 |
| AA- | 425 | 99.98 | 99.94 | 182 | 100.00 | 100.00 | 170 | 100.00 | 100.00 |
| A+ | 425 | 99.98 | 99.94 | 282 | 100.00 | 100.00 | 170 | 100.00 | 100.00 |
| A | 780 | 99.51 | 98.40 | 170 | 100.00 | 100.00 | |||
| A- | 296 | 100.00 | 100.00 |
Note: This table shows implied VaR confidence levels corresponding to the levels of DRA growth that would trigger a rating downgrade for each rating agency, Confidence levels are shown for VaRs with horizons of 1 year and 3 years.
4. Conclusion
This note analyses the effect on the agency rating of a stylised Multilateral Development Bank (MDB) of a proportionate increase in its Development Related Asset (DRA) portfolio. In it, the ratings of all three major agencies, Fitch, Moody’s, and Standard & Poor’s, are considered. We illustrate the conservative nature of rating agency evaluations of MDBs by calculating Economic Capital requirements for our stylised MDB using an industry-standard, ratings-based Credit Portfolio Model (CPM) of the kind employed by most MDBs.
Our key findings are that:
• On ratings, although all three agencies would initially judge the stylised bank to be AAA, the methodologies lead to very different results. This is demonstrated with expansion of DRAs rapidly leading to a downgrade in the Moody’s rating but not in that of Standard & Poor’s. (Note that the greater headroom that our stylised MDB enjoys under the S&P methodology reflects the allowance that S&P makes for callable capital.)
• The relationship between rating downgrades and DRA expansion is highly non-linear in its impact on the number of notches. So, the scope for one or other rating to experience severe downgrades as DRAs expand is great.
• For the notional MDB, substantial growth of the portfolio would appear to be possible if an AA rating is deemed acceptable. The calculations do not allow for the long-run impact on the MDB of a deterioration in the spreads it would face in the bond market or any re-evaluation by the rating agencies of the MDB’s governance or credit risk controls. Some MDBs already have relatively high leverage ratios which are currently offset by other aspects of the rating methodologies.
• On Economic-Capital-based assessments of capital adequacy, the confidence level of the stylised MDB is very high, i.e., the probability of failure is vanishingly small before the portfolio is boosted. Based on the calculations reported here, the MDB could expand its DRAs by 300% before its probability of exhausting capital over a 3-year horizon exceeds 1 basis point. (Here, we do not allow for the capital demands of market or operational risks which tend to be minor for MDBs but we do not allow either for callable capital.)
• Our calculations suggest that the rating agencies would downgrade the notional MDB after DRA expansions of 197%, 11% and 34% in the cases of S&P, Moody’s, and Fitch, respectively. The relatively large headroom under S&P reflects the allowance that agency makes for callable capital. If, in its qualitative choices, S&P a took less favourable view of the reliability of the MDB’s callable capital than we assume in our central-case assumptions, the headroom would shrink to 43% (see the Appendix and Table A1, in particular). This result is consistent with the conclusion that the rating agency evaluation of AAA status for MDBs is too conservative and suggests that the allowance they make for preferred Credit Treatment (PCT) is insufficient.
Appendix: Callable Capital in the Standard & Poor’s Methodology
The calculations presented in Table 3 allow for the fact that the MDB is presumed to have callable capital from highly rated equity holders. Callable capital can, in principle, create significant headroom for DRA lending particularly under the Standard & Poor’s (S&P) methodology. The approach taken by S&P is described in the agency’s methodology document in the section entitled “Assessing the Likelihood Of Extraordinary Shareholder Support”.
Text from S&P:
93. Once we have assessed an MLI's SACP under our criteria, we incorporate the likelihood that an institution would receive extraordinary shareholder support in order to service its debt obligations. In the case of MLIs, extraordinary shareholder support usually comes in the form of an injection of callable capital and less often in the form of guarantees or other types of support.
94. Callable capital is a characteristic of most MLIs. It corresponds to a commitment by each shareholder to make additional capital available, but, generally, is only to prevent a default on an MLI's debt or a call of a guarantee. The size of capital subscriptions generally varies among members, in proportion to their ownership shares. However, the ratio of paid-in to callable capital is generally the same for each shareholder. An MLI's callable capital is typically a multiple of its paid-in capital and often exceeds not only paid-in capital, but also shareholders' equity. If an MLI were to make a capital call, each shareholder would be responsible for providing the percentage of the capital called to which it has subscribed. Moreover, a shareholder's responsibility for meeting a call on capital, up the amount to which it has subscribed, does not depend on whether other shareholders have paid up.
95. In some cases, a joint shareholder guarantee on nonperforming outstanding loans may exist. Exercising this guarantee may be subject to certain defined conditions. Analytically, we treat these guarantees as callable capital because we would expect the process and the financial impact of calling on the guarantee to be broadly comparable with that of making use of callable capital.
96. To show the extent to which callable capital and guarantees would support the MLI's creditworthiness, we recalculate the RAC ratios to include in the numerator the callable capital from all shareholders that have foreign currency ratings equal to or higher than MLI's SACP. The denominator of the RAC ratio is unchanged. We then reapply our adjustments to include this additional capital and update our assessment as described in Table 10. Assuming there is no change in the liquidity and funding profile, if capital were called, it may improve the MLI's capital adequacy. This enables us to quantify the potential financial benefit of callable capital.
97. We determine the indicative ICR on the MLI (see chart 4) by combining the enhanced FRP (including the benefit of the eligible callable capital) and the ERP as per table 2.
98. We only include the callable capital from the shareholders rated at or above the SACP of the MLI. We make this distinction in the level of support, because in the sort of market conditions that would lead to an MLI being on the verge of default, and thus resorting to a capital call, we anticipate that its own shareholders may be under similar stress. Their capacity to provide support would therefore be diminished, which might be reflected in our ratings on the shareholders.
99. In our view, calling capital is an uncertain process. We therefore anticipate limiting the maximum support it can provide above the SACP. The maximum uplift due to callable capital is limited to three notches above the SACP. This notching depends on the shareholders' willingness and ability to make a payment on callable capital, as informed by the following considerations:
- The adequacy of the legal and administrative process in place to ensure that a capital call will be made if management believes that a call is necessary to avoid a default;
- The shareholders' ability to pay in the additional capital when called. Our view is informed by the legal and administrative processes required for the shareholders to make the payment shortly after the capital call;
- The shareholders' willingness to make the payment of capital when called. This view is informed by the shareholders' record in increasing the MLI's capital when needed to support its public policy role or its growing activity, and their record of paying on schedule the paid-in capital for general capital increases. We do not limit our assessment to the shareholders' record with regard to this specific MLI--it could extend to the shareholders' record of promptly paying capital subscriptions to other MLIs they have subscribed to. Where shareholders' have failed to pay capital subscriptions, or have repeatedly been in arrears on capital subscriptions, we may consider them to have low willingness to pay callable capital. Conversely, recent increases in paid-in capital by shareholders would affect positively our assessment of shareholder's willingness to support the MLI; and
- An MLI's policy importance (see tables 6 or 7 as applicable). If we assess policy importance as very strong or strong, the uplift due to callable capital may be up to three notches, whereas if the assessment is adequate, the uplift is capped at one notch. MLIs with moderate or weak policy importance cannot receive any uplift for callable capital.
This approach means that callable capital may or may not create additional headroom for MLI lending depending on the MLI’s Policy Importance (as assessed by the agency) and the answers that the agency determines for the three other qualitative questions listed in paragraph 99 above.
Table A1 below presents results that are the equivalent of those for S&P contained in Table 3, Section 3 but assuming that all three qualitative issues in the above S&P text are assessed negatively but that the MDB’s Policy Importance is still regarded as high.
In performing the calculations, we frame the three issues as three questions taking values Yes or No. If three Yes’s or three No’s are received, we add or subtract a notch, respectively and otherwise add zero notches to the Enhanced SACP. We cap the gap between the Enhanced SACP and the SACP at 3 notches. Since we assume that the three questions receive negative answers, the immediate uplift from callable capital is reduced by one notch before it is capped.
Table A1: DRA Thresholds for S&P Downgrades with Negative Qualitative Question Responses S&P
DRA Enhanced RAC RAC ratio (%) growth (%) ratio (%)
Base 0 32.3 56.5
AA+ 43 22.9 55.4
AA 281 7.0 26.7
AA- 425 5.0 20.3
A+ 425 5.0 20.3
A 780 3.0 13.1
A-
One may observe that the DRA multipliers, consistent with different degrees of S&P downgrade, are much reduced under these assumptions. These calculations illustrate the fact that the rating agency methodologies contain judgmental assessments that substantially affect the rating and which are hard to second guess from outside the agency.
Risk Control Limited 13-14 Dean Street London W1D 3RS +44 (0)203 307 0730 www.riskcontrollimited.com