

Development Finance Institutions (DFIs) value mobilisation as a way of increasing the development impact of their activities by drawing on the risk capacity of the private sector. As conventionally defined, mobilisation refers to financing contributed by private sector investors to transactions in which DFIs have participated.
Executive Summary
Development Finance Institutions (DFIs) value mobilisation as a way of increasing the development impact of their activities by drawing on the risk capacity of the private sector. As conventionally defined, mobilisation refers to financing contributed by private sector investors to transactions in which DFIs have participated.
Such direct mobilisation is only part of the story, however. One may hypothesise that the scale of development financing would be considerably greater if DFIs focused on deals that remove or mitigate informational or other barriers for other financial market participants. Transactions that reduce informational barriers in this way, eliciting follow-on transactions in which the original DFI is not involved, may be described as having ‘demonstration effects.’
Researchers have analysed demonstration effects in many different economic contexts. They are also frequently cited by DFIs to explain how their activities generate development. So far, however, most DFIs have not viewed demonstration effects as a key objective, and they are not commonly represented in internal DFI control frameworks such as pricing, limit setting, or corporate planning systems.
This report aims to lay the groundwork for ex-ante assessment of demonstration effects in DFI transactions. To achieve this, we examine a set of innovative transactions to identify what factors contributed to their success or otherwise in eliciting follow-on deals. Among the case studies, as well as DFI activities, we also include some private sector, developed-market transactions that did not involve DFIs to reveal key aspects of ‘market opening’ deals.
The deals we examine are shown in Figure ES1. The figure serves to emphasise how the deals are distributed over the three categories: (i) those for which demonstration effects are fully complete, (ii) those for which these effects are partially complete and (iii) those for which demonstration effects are in process.
Figure ES1: Transaction Timeline
DE Completed DE Partially Complete DE in Initial Phase
HBOS Climate Bayfront Structured Awareness Trade Infrastructure Covered Bonds Bonds MAPS Room2Run Capital IV 2003 2007 2013 2018 2023
2006 2013 2016 2022 BRAC IFC’s Seychelles Guaranteed Microfinance MCPP Debt Green Certified Securitisation Conversion Bonds in Nigeria
Note: Here, DE denotes Demonstration Effects.
For each deal in the sample, we examine the success factors that contribute to demonstration effects. Among these is the information the transactions generate about the risks they cover. Information effects are boosted if the transaction is listed but may still be significant for private deals if the DFI widely engages in road shows and ex post dissemination. Another set of quasi-informational effects is generated if the transaction overcomes obstacles by, for example, leading to the generation of a new rating methodology or if it results in new approaches to financial structuring or an innovative legal approach.
Transactions are also more likely to result in demonstration effects if they are large in scale and simple and straightforward to replicate. Finally, if profitability and impact are high, participants of different types are more likely to be keen to replicate the transaction.
To organise thinking around these success factors, we devise a structured scorecard for the ex-ante evaluation of the potential for a transaction to generate demonstration effects. Our scorecard (reproduced in Figure ES2) resembles the type of structured, judgmentally-based decision rules that rating agencies apply to assess credit quality. A DFI could use a scoring approach of the type we develop to prioritise deals that could have significant demonstration effects (for example, by integrating it with a Risk-Adjusted Return on Capital (RAROC) pricing approach), thereby precipitating ‘second round’ mobilisation.
Note that thinking about impact and mobilisation often emphasises simple, quantitative measures. We believe this partly reflects an emphasis on reporting rather than ex ante decision-making to select one type of development finance transaction over another. For the latter type of internal decision-making, we see what some DFIs refer to as a ‘portfolio approach’ in which different aspects of a transaction are combined through a structured scorecard to be a reasonable basis for decision-making.
Figure ES2: Framework to Evaluate Demonstration Effect Score
Information Factors
Information Generation:
(i) Private Transactions
(ii) Public Transactions
Combined Score of the Information Obstacles Overcome: Factors.
(i) Rating
(ii) Legal
(iii) Technical Finance
(iv) Accounting
Stand-alone Cumulative Demonstration Demonstration Effect Score Impact and Feasibility Effect Score Factors
Profitability and Impact:
(i) Profitability
(ii) Development Impact Adjustment Combined
(iii) ESG Characteristics applied to Score of the
(iv) Alignment of Interest account for Impact and the presence Feasibility of previous Deal Feasibility: Factors. transaction
(i) Simplicity (of similar
(ii) Reproducibility type).
(iii) Size
Table ES1: Scoring Outcomes HBOS Strcutured Covered Bonds BRAC Microfinance Securitisation Climate Awareness Bonds IFC's MCPP Trade MAPS Seychelles Debt Conversion Room2Run Green Certified Local Currency Debt Issue Bayfront Infrastructure Capital - IV Categories
Information Generation 7 2.5 6.5 1.5 6 2.5 4 1.5 6
Obstacles Overcome 5 4 2 3 7 4 4 2 6
Profitability and Impact 5 3 7 5 2 5 7 4 6
Deal Feasibility 5 3 5 5 2 2 5 2 3
TOTAL SCORES 4 3 4 3 3 3 4 2 4
The scoring approach reflects the authors’ judgments, conditioned by interviews we conducted with a set of DFI and private sector deal participants and other experts. The evaluation is ex ante and emphasises information generated within the constraints of impact and feasibility.
1. Introduction
Recent reports, including G20 (2023a) (2023b) and Falduto, Jachnik and Noels (2024), have argued that the financing Emerging Market and Developing Economies (EMDEs) need to meet development and clean energy goals substantially exceeds what can be provided from public sources alone.[1] Thus, private sector contributions to development finance will be essential to progress in coming years.
Development Finance Institutions (DFIs), both bilateral and multilateral, have identified their ‘mobilisation’ of private sector finance as a key part of their impact. Since the publication of MDB (2017), prominent DFIs have collected data and issued reports quantifying the volume of their mobilisation, the latest such report being MDB (2023). The Organisation of Economic Cooperation and Development (OECD) has also been a leading institution in quantifying and analysing mobilisation volumes, its most recent report being OECD (2023).[2] The definitions and methodologies employed to compile the mobilisation data presented in these reports are contained in World Bank (2018) (often termed ‘the MDB approach’) and OECD (2020). In brief, both approaches focus on mobilisation that is narrowly defined, namely as private sector contributions to the financing of projects in which MDBs have been involved.
Despite the priority afforded to mobilisation by DFIs, success in achieving it has been mixed. In 2021, of the $63.3 billion in DFI mobilisation (including MDBs) reported in MDBs (2023), only $5.2 billion was in lowincome countries. The basic challenge is that low-income countries frequently represent opaque investment environments in which private sector institutions find it hard to commit funds. Classic forms of mobilisation practised by MDBs, such as syndicated lending, require that private sector investors share losses on a pari passu basis with the DFIs involved. For this to work, the private sector participants must develop substantial expertise in evaluating the risks.
More complex approaches to investment may permit private sector participants to take senior positions, allowing them to provide financing without putting in place costly research teams. The challenge is to create claims that match the risk appetite and information profiles of different investors. With the advent of investing based on Environmental, Social and Governance (ESG) considerations (as well as risk and return), a further objective in creating claims to boost mobilisation is to meet the ESG appetite of potential investors.
For DFIs to substantially boost the supply of private sector risk capacity to EMDEs, fresh thinking is required, including the use of more complex ways to structure and share risk. Motivating DFIs to do this is challenging as these institutions, protective of their high credit status, may prefer conservative approaches. DFIs may also wish to focus on mobilisation which is defined more broadly than in World Bank (2018) and OECD (2020). Various studies have examined the multiple channels, in addition to direct commitments, through which DFI activity can foster development. Many of these operate through complex causal chains and are hard to quantify or build into internal DFI decision-making frameworks (such as pricing, limit setting and corporate planning).
One such indirect channel that is important to allow for and which, in our view, could potentially be built into decision-making frameworks is demonstration effects. The demonstration effect of a DFI transaction or project is the follow-on transactions that replicate the approach followed by the DFI in question without the latter being directly involved. Demonstration effects have been widely investigated in different areas of economic activity following the classic contribution of Shackle and Duesenberry (1951). DFIs have long referred to demonstration effects in explanations of the impact for which they aim (including in MDBs (2017)). Some studies have attempted to investigate demonstration effects in assessing DFI projects (see IFC (2011), Spratt and Collins (2012), and Heatherington et al. (2019)). Recent contributions that have emphasised a more central role for demonstration effects in DFI impact include Carter (2021) and MOBILIST (2023). Both emphasise the informational obstacles to financing development in lower-income countries. MOBILIST (2023) introduces the notion of “originate to demonstrate”, on which the present study builds.
This paper has been written as part of Risk Control’s project on demonstration effects in development finance for the MOBILIST platform of the UK’s Foreign, Commonwealth and Development Office (FCDO). It aims to answer the following questions:
1. To what extent and how have demonstration effects been conceptualised, measured, monitored, and evaluated by market participants and development finance investors?
2. What data and information generated by pioneering transactions is most salient to market participants, including both issuers and investors? How is this information transmitted to and used by different types of investors, and which investor categories are likely to be the most responsive? What determines the relevance of a given transaction to different groups of issuers and investors? Are ‘positive’ and ‘negative’ demonstration effects equally influential over behaviour?
3. Where it is present, to what extent does the visibility of development finance affect behaviour change among market participants and other development finance actors? How do different structures and strategies used by development finance actors compare to one another in transmitting risk and return information, with a particular focus on:
• Public and private markets
• Concessional and non-concessional financing
• How can exits from pioneering assets be best managed to strengthen and, at a minimum, avoid undermining demonstration effects?
4. Who are the actors that capture such demonstration effects in public and private markets? How have market participants and development finance actors conceptualised and captured additionality through demonstration, including when investing on pari passu terms? What metrics and methods should be used in the future to capture additionality in terms of:
• Direct mobilisation through co-investment,
• Mobilisation through demonstration of follow-on transactions that otherwise would not have happened, and mobilisation through triggering broader, positive market dynamics?
To shed light on these questions, we study a set of innovative transactions (including both successes and failures). We are particularly concerned with:
• How these transactions were innovative
• The effect that they had in stimulating follow-on transactions
• The factors that contributed to their success or otherwise
Note that innovation, in the sense that we refer to it here, includes not only new ways of structuring deals but also introducing asset classes to the market which are novel to the counterparties involved. This aspect of novelty requires educating potential counterparties on the nature of the risks and returns that the assets can provide and, indeed, to the extent that counterparties are motivated by this, the development and sustainability content of the assets in question.
To root our discussion in practical considerations, we formulate a judgmental scoring approach to demonstration effects of the sort that DFIs could consider instituting for their transactions. This includes ex ante and ex post assessments that would permit DFIs to allow for demonstration effects in their internal control and planning frameworks, namely pricing, limit setting, and corporate planning.
Of particular interest are innovative transactions that involve listings in public markets, transactions in Emerging Market and Developing Economies (EMDEs), and transactions involving DFIs. However, important lessons may be learnt from private sector innovations in developed markets and that do not involve DFIs.
The document is organised as follows: Section 2 discusses how demonstration effects have been conceptualised in past studies. Section 3 presents the case studies. Section 4 develops and applies our demonstration effect scoring framework. Section 5 sets out to answer the questions posed in light of the case studies. Section 6 concludes. Appendix 1 explains how sub-category scores are combined. Appendix 2 justifies the scores we assign to the deals in our sample.
2. Conceptualising Demonstration Effects
2.1 What are demonstration effects?
Demonstration effects have been extensively studied by economists. Starting with the early contribution of Shackle and Duesenberry (1951), the notion has been used extensively among Development Finance Institutions (DFIs) as a way of thinking about a category of indirect effects that their Non-Sovereign Obligor (NSO) lending or other activities may have on development outcomes. 3,[4]
For example, Multilateral Development Banks (MDBs) (2017) state: “We recognize that we also catalyse private investment on a much broader scale through advice, support for policy reform, capacity building, demonstration effects, and other activities which trigger an investment response from private investors, or which open new opportunities for private investment”. In the Billions to Trillions report prepared by MDBs (see World Bank (2015)), the focus on demonstration effects is very limited, but it is stated that: “When MDBs invest in new areas or in high-risk environments there is an important demonstration effect that can lead to additional projects and new investors.”
While MDBs (2017) states, “We will continue to explore ways to measure and report on this broader private investment catalysation.” The report makes no attempt to quantify such catalysation. Indeed, only a few carefully elaborated studies of demonstration effects which make associated efforts to quantify the impacts have been completed either by MDBs or academics. The exceptions are:
(a) International Finance Corporation (IFC) (2011) which focuses directly on evaluating the demonstration effect of IFC’s involvement in African infrastructure. This study identifies transmission mechanisms through which demonstrations may operate:
• “A successful project in which the IFC was involved may improve the perception of Private Participation in Infrastructure (PPI) among government officials, as well as the capacity of those officials to implement future projects.”
• “IFC activities often help develop sector legal and regulatory frameworks that are conducive to more PPI.”
• “Finally, observing successful outcomes in projects in which the IFC was involved may build confidence and interest among investors in the region.” Note that IFC (2011) also quantifies demonstration effects for a subset of transactions.
(b) Spratt and Collins (2012) examine “the hypotheses that DFIs create additional impacts by performing the following functions: i. Leveraging additional finance; ii. Influencing project design and the policy context so that development impacts are greater than they would otherwise have been; iii. Creating a positive demonstration effect so that private investors undertake similar projects without the need for DFI participation.” After examining a large volume of DFI project appraisals, Spratt and Collins conclude that “Despite the priority given to the importance of creating demonstration effects, there is little evidence to support it in practice. In part, this is because DFIs have only begun to focus on measurement relatively recently. More fundamentally, perhaps, it reflects the difficulty of proving causality in this area.” They suggest there are hard limits to demonstration effects since DFIs can raise funds at lower rates than private sector actors and enjoy privileges because of the de facto seniority and importance that they are granted by virtue of being borrower-country public bodies. Finally, they argue that unsuccessful projects may create negative demonstration effects.
(c) Heatherington et al. (2019) examine how demonstration effects can be used to mobilise private climate-related finance. They “focus on a sample of 20 International Climate Finance (ICF) programmes, 10 of which were investigated in depth, which intended to mobilise private finance through demonstration effects into follow-on projects, outside the ICF programme.” They find that: “From four of the 10 programmes in our in-depth investigation, we identified US$430 million (£350 million) of private finance that has been mobilised into 21 LCCR projects through demonstration effects. We found five other cases of mobilisation where the amount of the investment was unavailable. […] In the other six programmes in the in-depth review, we found interim outcomes such as raised ambition and replication with the same level of concessionality.” They conclude that: “these interim outcomes can be seen as an indication that private finance may be mobilised in the future or that some progress towards that goal has taken place”.
Several studies examine demonstration effects in the context of studying how MDBs evaluate projects. For example, Massa (2011), while investigating the effect of MDB financing on country and sector levels, summarises the approaches to project evaluation employed by several DFIs. It is notable that, of these, only the European Investment Bank (EIB) explicitly mentions demonstration effects as one of seven sub-categories of Economic Performance.[5] Arvanitis, Stampini and Vencatachellum (2015) examine how an MDB may combine credit risk and development impact in assessing projects. The African Development Bank (AfDB) employs the ‘Additionality and Development Outcomes Assessment’ (ADOA) framework to assess its projects. Arvanitis et al. (2015) investigate 121 non-sovereign guaranteed projects judged using the framework between 2008 and
2013. The framework focuses on development impact and additionality. The authors review how the framework has operated and whether it has led to a greater emphasis on these two project outcomes. In these limited investigations of MDB approaches to projects, it is unclear how systematic and quantitative the arrangements for investigating demonstration effects are.
Carter (2021) provides broad perspectives on demonstration effects, suggesting that: “Investments can […] have a large economy-wide impact by raising the productivity of many other firms when they create knowledge that can be adopted by others, resulting in further investments. DFIs often refer to this as having a ‘demonstration effect’. Development finance’s role in standards setting, through high business integrity and environmental, social and governance (ESG) standards, is important here.”
Novel perspectives on demonstration effects and development finance are provided by MOBILIST (2023). Combining the notion of demonstration effects with the informational gains to be achieved when securities are publicly listed, MOBILIST (2023) argues that “development finance transactions in listed markets can create perpetual public information streams relating to risks and returns in EMDEs, helping to correct investor misperceptions and information asymmetries. In doing so, such ‘demonstration transactions’ can trigger follow-on commercial investments in EMDEs that need not tie up any official sector capital.”
2.2 Demonstration effects and mobilisation
The topic of demonstration effects fits within the broader subject of DFIs’ mobilisation of private-sector financing. DFIs are very concerned with the extent to which their activities generate private sector development financing, which they term ‘mobilisation’. Mobilisation is important to DFIs because it boosts the development impact of their operations.
More broadly, mobilisation is important because, as is widely recognised, the scale of financing necessary to achieve key development goals, such as the United Nations 2030 Sustainable Development Goals (SDGs) (see United Nations (2015b)) or the financing requirements of Emerging Market and Developing Economies (EMDE) in combating climate change (see Falduto, Jachnik and Noels (2024)), are far greater than could be realistically addressed by bilateral or multilateral development finance providers alone.
OECD (2024) estimates that the climate change related financing needs of EMDEs will range from USD 550 to 2500 billion annually by 2030 and comments on “the critical importance of scaling up private finance to bridge the climate financing gap”. The Triple Agenda report recently issued by the G20 (see G20 (2023)) argues that MDBs should aim to mobilise financing from private sector sources. A common view of these reports is that if there is to be any realistic chance of achieving development objectives, it must rely on the private sector as the primary source of financing. Gregory (2023) observes that the current challenge for MDBs and DFIs is less to create more financial innovations and “more about the ability to replicate and deploy at scale the instruments and approaches which have been created and road-tested, particularly those that align with the investment appetites of institutional investors.”[6]
Two prominent methodologies have been devised to measure and monitor the mobilisation achieved by DFIs. The first, proposed by the OECD, is described in OECD (2020). The second, commonly referred to as ‘the MDB approach’, has been produced collaboratively by a group of leading MDBs and European DFIs (see World Bank (2018)). The two methodologies can be used to categorise the types of private investment mobilised by an MDB. They are broadly similar, although the MDB approach distinguishes between direct mobilisation in which a DFI has played an active and direct role (for example, by operating a syndication desk) and indirect mobilisation in which no DFI played an active and direct role.[7]
Recently, a not-for-profit organisation, Publish What You Fund, has proposed (see PWYF (2024)) that approaches for measuring mobilisation should:
• Include new elements: First, balance sheet optimisation (meaning purchases by private sector investors of DFI liabilities) and second, private capital mobilisation (meaning DFI disposals of existing assets to private sector investors) as additional ways DFI’s activities stimulate private sector financing.
• Disaggregate mobilisation statistics much more, specifically “by investment instrument, country, sector, amounts mobilised and the typology of the mobilised party” (see PWYF (2024)).
All these ways of measuring mobilisation are narrow in the sense that they only include contributions by private sector entities to project financing in which the MDB has itself made a commitment. We may term them ‘first round’ mobilisation. Several authors describe broader channels through which MDBs can boost the supply of private-sector financing. As one example, Giulia Lotti and Andrea Presbitero identify the following channels:
1. An MDB’s presence in a particular country or sector can attract private financing by virtue of its presence signalling potential investment prospects.
2. The long-term engagement in a country or sector of MDBs can help foster macroeconomic stability, economic growth and an environment welcoming to investors, enticing private entities to lend in that region/sector.
3. MDBs can mobilise private resources by providing mitigation of political and credit risks.
In the area of climate finance, OECD (2024) (see Section 3.3.2 and following) distinguishes between (i) private climate finance mobilised by public finance interventions and (ii) private climate finance catalysed by other types of interventions. The complexity of these channels somewhat defy quantification, and it is daunting to consider how they might be monitored or reflected, except in very general terms in the evaluation of alternative actions that DFIs could take to generate private sector financing that complements or extends their own direct commitments.
Spratt and Collins (2012), in their evaluation of projects by multiple DFIs, “set out to test the hypotheses that DFIs create additional impacts”. They conclude that: “DFIs can potentially create four different forms of impact ‘additionality’:
a) Financial (where they leverage additional private finance into infrastructure),
b) Design (where they influence project design so that growth and/or poverty impacts are enhanced),
c) Policy (where they influence the policy context in which the project occurs to enhance growth/poverty impacts), and
d) Demonstration (where the success of a DFI-supported project provides a stimulus for subsequent private sector projects that do not involve DFIs).”
In this study, we focus on the demonstration effects that innovative transactions by DFIs may have. Our emphasis is on second-round mobilisation rather than how DFI projects encourage local industries to adopt different technologies and spread the message to other local market participants and those who finance them. We believe that demonstration effects are then sufficiently circumscribed and well-defined that they may potentially become subsumed within the mobilisation monitoring approaches described above and, hence, reflected in the ex ante and ex post project evaluations that DFIs perform. In this, they differ from other second-round mobilisation effects that are harder to measure. For demonstration effects to be reflected in ex ante project evaluations, it must be possible to identify ‘success factors’ that will be predictive of demonstration effects. We shall return to this issue below.
3. Innovative Transaction Case Studies
3.1 The approach
To shed light on demonstration effects, we examine the nature and consequences of nine innovative financing transactions, as shown in Table 3.1 and illustrated in Figure 3.1. We have selected transactions which could all be expected, ex ante, to produce positive demonstration effects in their respective markets.
The transactions include some purely private-sector deals, notably the introduction of structured Covered Bonds by HBOS in 2003. This transaction not only created a new market for Covered Bonds in the UK (with follow-on transactions by other UK banks appearing rapidly) but also strongly influenced other markets, which devised their own structured Covered Bonds soon after. Also included is the fully private-sector deal of Trade Maps by Citigroup and Santander. In contrast to the HBOS transaction, this deal was a relative failure in that it did not lead to the emergence of a substantial new market in securitised trade receivables, as many market participants anticipated at the time.
The other seven transactions listed in Table 3.1 all involve participation by a DFI. The deals included range from a microfinance securitisation, a climate-awareness bond issue, a DFI’s broad co-lending program, a debt conversion linked to environmental objectives, an equity investment in a securitised pool of infrastructure loans, a securitisation of a portion of an MDB’s Non-Sovereign Obligor (NSO) portfolio, and issues of green local currency debt.
Common features in these different transactions are innovative deal structures with focused asset selection aimed at meeting investors’ specific non-financial objectives (such as climate change mitigation). The transactions all faced and resolved obstacles, created new information, and differed in prominence and the inferences that the market drew.
In subsequent sub-sections, we describe the transactions in detail and comment on the demonstration effects that each deal generated. Figure 3.1 shows the timeline of our sample. As may be observed, two transactions have occurred so recently that their demonstration effects are still largely to be observed. For two more transactions, it is reasonable to believe that demonstration effects remain incomplete. For the five earliest transactions in the sample, the demonstration effects, if any, are fully observable.
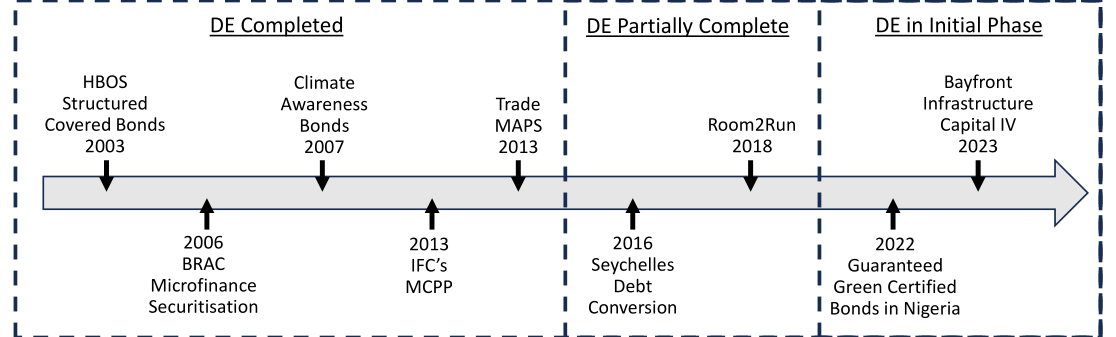
Note: Here, DE denotes Demonstration Effects.
| Start | ||||||||||
|---|---|---|---|---|---|---|---|---|---|---|
| No | Transaction | Year | Size | Originator / Issuer | ||||||
| 1 | HBOS Structured | Covered Bonds | 2003 €3bn | & | €2bn in 2003 | HBOS Treasury | Services Plc | (guaranteed by | HBOS | Covered Bonds |
| LLP) | ||||||||||
| 2 | BRAC Micro | Credit Securitization, Series 1 | 2006 | $180mn | equivalent | Originator: | BRAC ('Bangladesh | Rural | Advancement | Committee'. |
| Issuer: BRAC | Micro Credit | Securitization Trust | ||||||||
| 3 | Climate Awareness | Bonds (EIB case) | 2007 | €600mn | in 2007 | European | Investment Bank | (EIB) | ||
| (for the very | 1st issuance). | |||||||||
| 4 | IFC's Managed | Co-Lending Portfolio | 2013 | $3bn | in 2013 | Originator: IFC, | ||||
| Program | $16bn | up to 2023 | Issuer: IFC | (when fronting all | with its BS | (balance | sheet)). | |||
| 5 | Trade MAPS 1, | multi-bank trade finance | 2013 | $1bn | end 2013 | Originators: | Citigroup and | Santander. | ||
| securitisation | platform | Issuer: Trade | MAPS 1 Ltd (SPV | in Ireland). | ||||||
| Issuer: Seychelles | Conservation | and Climate | Adaptation Trust | |||||||
| 6 | Blue Bond Debt | Conversion (Seychelles | 2016 $21.6 | mn | (Seychelles) | (SeyCCAT), | then Seychelles | Government | (2018 Blue | Bonds). |
| case) | Transactions | co-designed by | the government | of | Seychelles and | |||||
| The Nature | Conservancy. | |||||||||
| 7 | Room2Run | 2018 | $1 bn | African | Development Bank | |||||
| 8 | Guaranteed | Green Certified Local | 2022 | $3.8 | mn (2022) | InfraFunding | SPV Ltd guaranteed | by InfraCredit, | in | Nigeria |
| Currency Bond | in Nigeria | |||||||||
| 9 | Bayfront | Infrastructure Capital (BIC) IV | 2023 | $401 | ~ 458mn | Sponsor: | Bayfront Infrastructure | Management | Pte | Ltd |
| Issuer: Bayfront | Infrastructure | Capital IV Pte | Ltd |
3.2 HBOS Structured Covered Bonds – 2003
3.2.1 Inaugural transaction
In July 2003, HBOS Treasury Services plc issued the first-ever covered bonds in the United Kingdom (UK) in the first-ever covered bond issuance without a covered bond law.[8]
HBOS’s first covered bond issuance amounted to €3 billion, maturing in 2010 (7-year bonds). It was followed in October 2003 with an additional €2 billion issuance maturing in 2013 (10-year bonds). Both series were issued out of the new €14 billion HBOS structured covered bond programme created in July 2003.[9]
The bonds from HBOS’s 2003 programme were called ‘structured covered bonds’ as there was no covered bond legislative framework in the UK, unlike in several Continental European countries such as Germany, Spain and France, where regulated covered bonds provided relatively cheap funding to eligible mortgage lenders.[10] HBOS’s covered bonds achieved an equivalent level of backing by HBOS residential mortgages (the bonds’ ‘covered’ status) by employing contractual provisions in English law and securitisation legal techniques. As a result, HBOS’s structured covered bonds were rated AAA/Aaa/AAA by Fitch, Moody’s and S&P – like other covered bonds from Continental Europe – compared with HBOS’s AA/Aa2 ratings in 2003.
HBOS’s structured covered bonds were listed on the London Stock Exchange (LSE), and the programme was described in a public offering circular dated 18 July 2003 (see HBOS Treasury Services (2003)). The issuances were well received by investors, specifically by traditional covered bond investors in Continental Europe. They provided comparatively cheap funding to HBOS and achieved its objectives of funding diversification.
3.2.2 How was the transaction innovative?
HBOS’s first structured covered bond issuance and programme was a very innovative transaction in the international bond markets in 2003: ● It kick-started covered bond issuances in the UK.
● It demonstrated the ability to create structured covered bond programmes using legal securitisation techniques in jurisdictions where a specific covered bond legal framework did not exist.
Figure 3.2 illustrates the legal structure of HBOS’s 2003 structured covered bond programme. ● The bond issuer was HBOS Treasury Services plc (HBOS TS), as is the case for typical HBOS bonds. ● However, HBS TS did not own any of the group’s mortgages. Therefore, it on-lent the bond proceeds to HBOS Covered Bonds LLP (HBOS CB), a special-purpose partnership within the HBOS group for the structured covered bond programme. ● With the loan proceeds, HBOS CB purchased mortgages from Halifax and other HBOS Group mortgage originators via an equitable assignment (i.e. using a common law securitisation technique). ● HBOS CB then guaranteed the covered bonds issued by HBOS TS and pledged its mortgages as security for the benefit of covered bondholders, their trustee and security trustee.
This legal structure recreated the backing of covered bonds by mortgages (the ‘covered’ status), using contractual common law techniques, as opposed to benefitting from a specific covered bond legal framework. It achieved AAA ratings from the three major rating agencies: Fitch, Moody’s and S&P (like typical Continental European covered bonds), fully notching up the HBOS group’s AA ratings.
Table 3.2 provides a summarised comparison of the key features of UK structured covered bonds and UK residential mortgage-backed securities (RMBS), as it could be made in 2003 and the following years. At the time, UK mortgage lenders were already able to raise AAA-rated funding by securitising their prime mortgages and issuing residential mortgage-backed securities (RMBS). Mortgage lenders, such as the Bank of Scotland, Abbey National, Northern Rock and Halifax, had already set up RMBS master trusts to securitise their UK mortgages (see Fitch Ratings (2005)). However, covered bonds from Continental Europe, particularly German pfandbriefe, benefitted from cheaper funding conditions thanks to their status as AAA-rated financial institution (FI) bonds and their appeal to treasury investors seeking highly rated and liquid Euro investments which are alternatives to government bonds.
Table 3.2 shows that HBOS’s structured covered bonds benefitted from mostly the same status of AAA-rated covered FI bonds (backed by prime residential mortgages) as Continental European covered bonds,[11] unlike UK RMBS issuances. For example, as FI bonds, HBOS’s 2003 structured covered bonds benefitted from a 20% Basel 1 risk-weighting for bank investors instead of a 50% risk-weighting for senior RMBS notes. Being recognised as covered bonds by rating agencies and investors (albeit not regulated covered bonds), they appealed to traditional Continental European covered bond investors and achieved funding diversification for HBOS and comparatively cheaper financing conditions than UK RMBS issuances.
HBOS’s 2003 structured covered bond programme and inaugural issuance constituted a major innovation in the European covered bond markets and the international bond market more generally.
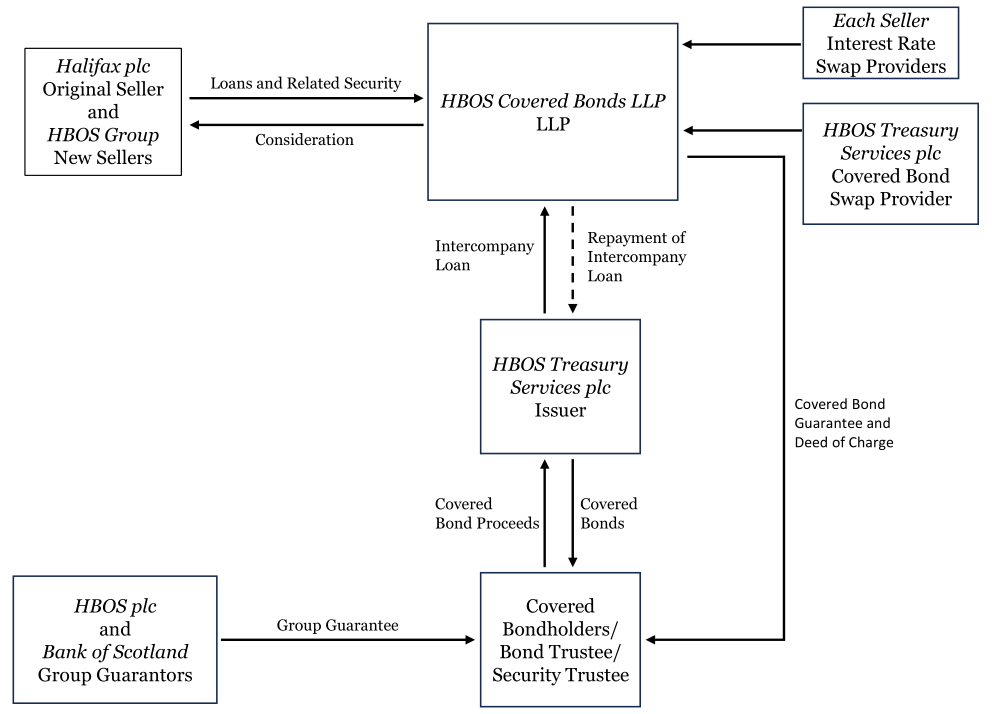
Note: The source is HBOS Treasury Services (2003).
| Key Comparative Factor | UK Structured | Covered | Bonds | UK RMBS | |||
|---|---|---|---|---|---|---|---|
| Nature of issuer | Financial | institution | Securitisation SPV | ||||
| Collateral provided | Single | cross-collateralised | pool | of | Segregated pools | of mortgages for | separate |
| mortgages | RMBS SPVs. | ||||||
| Single cross-collateralised | mortgage | pool for | |||||
| UK RMBS | master-trusts. | ||||||
| Investors' recourse | Full recourse to | the | mortgage | lender | Limited recourse | to the mortgage | pools and |
| (originator) and | the | mortgage | pools | cash flows | |||
| Ratings of notes issued | Covered bonds | are | senior covered | (i.e | Senior tranches | of notes generally | rated AAA. |
| secured) notes | and | reached AAA | ratings | Mezzanine and | junior tranches rated | lower | |
| Risk sharing between issuers | Issuers keep all | risks. | Investors | have | Some mortgage | credit risk transferred | to |
| and investors | double recourse | to | lenders and | investors via the | lower-rated | mezzanine and | |
| mortgages. | junior notes | ||||||
| Bonds/notes amortisation | "Bullet" in one | go at | maturity | Can be bullet, | scheduled or controlled | ||
| amortisation over | time, or | "pass-through" | |||||
| pace of amortisation | of the mortgage | pool) | |||||
| Issuance spreads | More competitve | / | lower (thanks | to | Less competitive | / higher (no FI | bond appeal |
| AAA FI bond | nature | & appeal) | & more embedded | optionalities) |
Note: RMBS means residential mortgage-backed securities (i.e. mortgage securitisation issuances). FI designates financial institutions. SPV means special purpose vehicle.
3.2.3 What demonstration effects did the transaction achieve?
HBOS’s 2003 inaugural structured covered issuance and the programme had a profound demonstration effect on the UK covered bond market, as well as in other countries such as the Netherlands, the United States (USA), France and Canada.
HBOS furthered its inaugural July 2003 issuance with an additional €2 billion 10-year issuance from the same programme in October 2023. The following year, HBOS also set up a second £3 billion social housing covered bond programme following the same structuring principles, but this time backed by secured loans to providers of social housing (‘social housing loans’), with a first issuance in December 2004.[12]
In March 2004, the Miles review of the UK mortgage market highlighted the 2003 HBOS covered programme and drew major policy recommendations from it. Miles (2004) noted: “Currently, covered bonds in the UK do not qualify for favourable treatment under the UCITS Directive. Article 22(4) of UCITS allows European investment funds to invest up to 25 per cent of their funds in covered bonds that meet the UCITS criteria. Without UCITS recognition, the maximum is 5 per cent.”[13] Miles (2004) concluded this aspect with the following “Recommendation: that the FSA should provide a definitive view on whether or not current UK insolvency law is sufficient to allow for the recognition of covered bonds under the UCITS Directive.”
Between 2004 and 2006, the UK saw the creation of structured covered bond programmes, backed by residential mortgages, by four additional mortgage lenders: Northern Rock, Bradford and Bingley, Abbey National Treasury Services and Nationwide Building Society (the first issue by a building society) (see Clist
(2006) and Benteux et al. (2009)).
The ability to create structured covered bond programmes without a dedicated legislative framework inspired major mortgage lenders to follow suit in other countries in Europe and Northern America:
• In the Netherlands, ABN Amro created in 2005 the first bond issuance explicitly called a ‘covered bond programme’ based on a similar structure as UK structured covered bonds.[14]
• In the USA, Washington Mutual (WaMu) issued its first structured covered bonds in 2006, placing them in Europe. They were the first covered bonds issued by an American bank. Bank of America followed suit with its first covered bond issuance in 2007.[15]
• In Canada, Royal Bank of Canada (RBC) created the first Canadian covered bond programme in 2007 as structured covered bonds.[16]
• In France, BNP Paribas created the first covered bond programme by a French commercial bank at the end of 2006, adapting the UK’s structured approach to the French legal environment. Before that, the 1999 French covered bond law had only been employed by specialised lenders, linked to the French state and its financial arms.[17]
Despite the three additional lenders joining HBOS in creating covered bond programmes, issuance progressed relatively slowly in the UK until 2006. In 2007, following Miles (2004) and mortgage industry feedback, the UK Treasury introduced proposals for a UK-recognised covered bonds legislative framework.[18]
This framework entered into force in 2008 and put UK covered bond issuers on a level playing field with their Continental European counterparts. Since then, 12 regulated covered bond programmes have been created by the major UK banks and building societies.[19]
Figure 3.3 illustrates the evolution of outstanding UK covered bonds from 2003 to the end of 2022. It shows how structured covered bonds developed in the UK until 2008, when legislation was passed to create UK regulated covered bonds. Since 2008, regulated covered bond programme creations and issuances have progressively taken over structured covered bonds in the UK. The UK covered bond market remains a major source of funding for UK mortgages, financing more than £80 billion at the end of 2022.
The most significant demonstration effects of HBOS’s inaugural covered bonds have been to kick start the UK’s covered bond asset class which is now an established market employed by UK mortgage lenders on a regular basis. We have focused our analysis on these main demonstration effects in this case study. However, HBOS’s structured covered bond programme also had demonstration effects abroad, inspiring replications in a number of other countries. In this sense, it contributed to the international development of covered bond markets.
Such development has reached EMDE countries where covered bond issuances have started, or legal frameworks have been implemented in countries such as Armenia since 2008, Chile since 2010, Turkey since 2014, Brazil since 2015 and Georgia since 2022. In Panama, the structured covered bond approach was replicated in 2012 and again in 2018 and 2019 in the absence of a legal framework. So far, covered bond issuances have been occasional in EMDE countries, with the significant exception of Brazil, where covered bonds have been issued regularly since 2018, and outstanding covered bonds exceeded US$16 billion at the end of 2022 (see ECBC (2023)).
What were the positive success factors?
• The transaction showed UK banks how they could tap into the low-cost funding that had been accessible to banks in other jurisdictions, such as Germany, which already had a legal framework for Covered Bonds.
• The approach was accepted by the rating agencies, which gave the transaction the maximum possible rating uplift.
• The approach did not require a change in the law since it exploited securitisation techniques to ringfence assets, replicating what was available in certain jurisdictions via Covered Bond law.
What were the negative success factors?
• UK supervisors initially limited the scope for HBOS to do repeat transactions by limiting the fraction of its assets that it could encumber by issuing Covered Bonds. This limit was subsequently relaxed as supervisors became more comfortable with the approach.
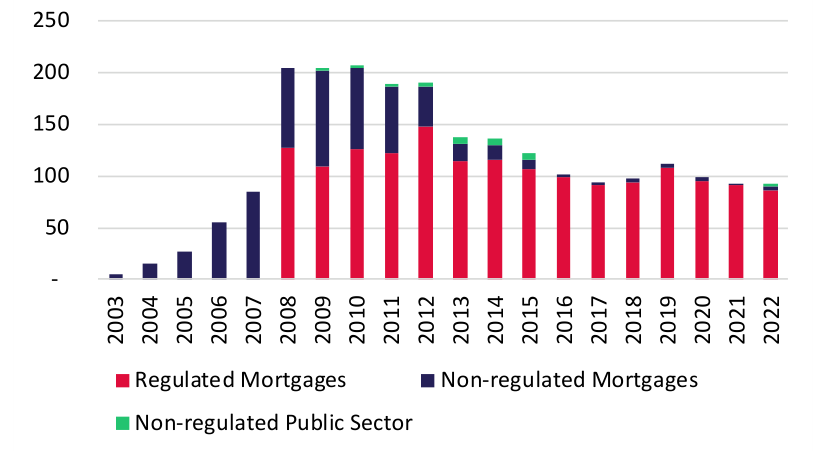
Note: The source is ECBC (2023) page 496, using EMF-ECBC data. Please note that this data includes private placements, floating-rate covered bonds and self-retained issuances that may have been used to access central bank liquidity.
3.3 BRAC microfinance securitisation – 2006
3.3.1 Initial transaction
In 2006, the Bangladesh Rural Advancement Committee (BRAC) closed the first rated securitisation of microfinance loans (or ‘micro credits’) for 12.6 billion Bangladeshi Taka (BDT) (equivalent to US$180 million) over six years.
BRAC was to receive BDT 1 billion (US$15 million) every six months when transferring new micro credits to the SPV BRAC Micro Credit Securitization Trust (BRAC MCST), which would issue a new series of 1-year notes for the same amount.
BRAC is a non-governmental development institution created in 1972. It is one of the largest microfinance institutions (MFIs) in Bangladesh. The securitised receivables consisted of BRAC’s micro-credit receivables selected randomly within its eligible loan book to reflect its general distribution by microfinance programmes, the area offices in Bangladesh and the activity or purpose of the loan. In January 2007, BRAC’s microfinance loans had an average disbursement amount of US$166 and an average principal outstanding of US$100.
The transaction was placed to investors involving Citigroup and two local banks in Bangladesh. The Netherlands development finance company FMO and the German federal government KfW Entwicklungsbank (KfW development bank) provided guarantees. Figure 3.4 summarises the structure and key parties in the BRAC Micro Credit Securitization Series I, issued in the summer of 2006.
Each series of notes issued every 6 months was divided into three ‘sub-tranches’:
• Sub-Tranche A, equivalent to US$5 million, placed to FMO
• Sub-Tranche B, equivalent to US$5 million, placed to Citigroup, guaranteed by FMO and counterguaranteed by KfW
• Sub-Tranche C, equivalent to US$5 million, split between Citigroup and the other local investors
The transaction was structured in BDT, the local currency, to avoid any exchange rate risk for BRAC. It was rated by the Credit Rating Agency of Bangladesh (CRAB), the local ECAI, which is a part-subsidiary of Moody’s. The three tranches placed to investors, Sub-Tranches A to C, were rated AAA in local currency BDT by CRAB. Credit enhancement was provided to the tranches via over-collateralisation by BRAC transferring more microcredits to the SPV than the BDT 1 billion issued twice yearly to investors.[20]
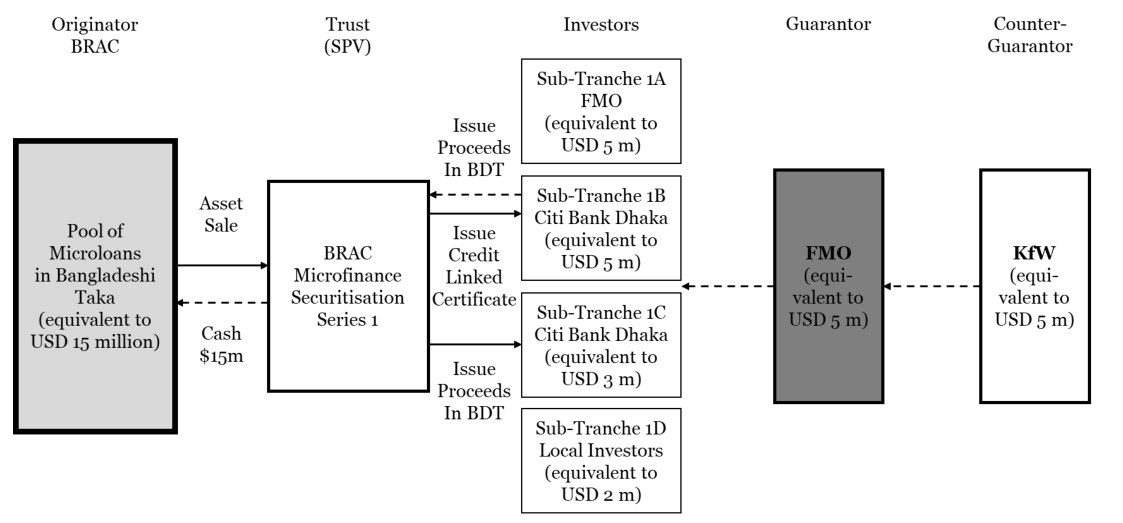
Note: The source is Hossain (2018).
3.3.2 How was the transaction innovative?
There had been securitisations linked to microfinance and micro-credits before BRAC’s transaction but of a different nature:
• BlueOrchard Finance is a Swiss company specialising in the management of microfinance investment funds. From 2004, BlueOrchard created collateral loan obligations (CLOs) of loans to MFIs. However, the loans were larger and to microfinance intermediaries, not directly to microfinance borrowers.
• In April 2006, ProCredit Bank (PCB) Bulgaria securitised a €48 million portfolio of loans to microentrepreneurs. The transaction was placed in an asset-backed commercial paper (ABCP) conduit sponsored by Deutsche Bank and benefitted from credit enhancement from KfW and the European Investment Fund (EIF). As such, the ABCP placed to capital market investors were typical short-term money market instruments bearing very little exposure to the micro-loans securitised by PCB.[21]
BRAC’s 2006 transaction was the first direct securitisation of micro-credits to be publicly rated. Given the volume of micro-credits originated in Bangladesh, it aimed to diversify the funding sources of the country’s MFIs and was opening a new securitisation asset class that could attract new investors. It was hoped that it would support the development of Bangladesh’s local capital markets.
3.3.3 What demonstration effects did the transaction have?
Initial demonstration effects obtained BRAC’s 2006 micro-credit securitisation was noticed rapidly and widely in Bangladesh and Asia, among microfinance professionals, and globally.
At the end of 2006, alongside other recognitions, BRAC’s securitisation won ‘Deal of the Year’ awards (in relevant categories) from the International Financing Review (IFR) Asia and the CFO magazine. CFO magazine wrote: “In a year when the Nobel Foundation recognized the role of micro-finance in promoting peace in impoverished nations, the securitisation of US$180m in BRAC (Bangladesh Rural Advancement Committee) loans in Bangladesh becomes a more meaningful endeavor for the non-profit organisation. Completed in September, the deal brought innovation to funding for the poor, introducing a commercial transaction that may be replicated in countries where micro-credit exists.”[22]
In April 2007, the Asian Development Bank (ADB) published an Asia Bond Monitor Report (see ADB (2007)) containing a section entitled “Securitization – Concepts and Development in East Asia.” In the report, ADB highlights “Specific new initiatives to encourage the use of securitization include (i) supporting refunding through microfinance, (ii) providing credit support and refunding for long-term bank student loans and human resource development, and (iii) securitization of infrastructural risk.”[23]
In ADB (2007), BRAC’s 2006 transaction is featured as a prominent example of microfinance securitisation in Asia. ADB opines that “Securitization provides a means for credit enhancement and resources for planning and implementation to assist national student funding schemes.” Comparing the BlueOrchard and BRAC transactions, ADB also notes that “unlike the BRAC program, investors in [the BlueOrchard] transaction obtain claims against intermediaries, rather than any ultimate borrowers.”[24]
In addition to awards in the regional and global financial press, BRAC’s 2006 securitisation was also noticed quickly by microfinance professionals and academics, including in the United States. As early as July 2006, the transaction became a case study at New York University (NYU) Stern Business School. In April 2007, BRAC’s securitisation was featured among other capital market developments at the Microfinance Symposium of Columbia Business School (which later led to the publication of Sundaresan (2008)). In the same month, the transaction was mentioned as a prominent example in Stieber (2007) and published in a review from MIT Press which asked “Is Securitization Right for Microfinance?”.
Absence of follow-on transactions in Bangladesh and developments in India After BRAC’s 2006 transaction, there has been no further micro-credit securitisation in Bangladesh. However, micro-credit asset-backed securities (ABS) picked up in India from 2009-2010 and have become a significant part of India’s securitisation market.
CGAP (2013) provides insights into what may have happened in Bangladesh’s micro-credit market. The report identified a period of ‘infectious’ and ‘aggressive’ growth of Bangladeshi MFIs from 2002 to 2007, in particular by BRAC. However, in 2008, most MFIs “began to sense the negative consequences of market saturation of the core microcredit market” and “became more aware of the management problems created by the rapid growth from 2002 to 2007.” Consequently, they slowed their growth from 2008, even before the global financial crisis started to have an impact towards the end of the year.[25]
In addition, Bangladesh MFIs increased deposit mobilisation and savings products from their members and clients. This created additional buffers for their clients in the form of future financial constraints and strengthened the MFIs’ funding position. MFIs’ slowed-down growth from 2008 and their increased deposittaking may have played a role in why micro-credit securitisation did not develop in Bangladesh after 2006.
On the other hand, from 2009 microfinance securitisation started in earnest in India’s capital market. That year, Equitas Micro Finance (MFI based in Tamil Nadu) closed the first rated securitisation of micro-loans in India, for 480 million Indian Rupees (INR) (US$10.4 million). As was the case for BRAC, the transaction was issued in local currency and rated by a local rating agency, CRISIL, a subsidiary of S&P. Then, INR 8.7 billion (US$188 million) of micro-loan securitisations were issued in India in the fiscal year 2009-2010 (year ending March 2010).[26]
Since the initial launch of rated micro-credit ABS issuance in India in 2009, the asset class has grown to represent a significant part of the Indian securitisation market. Vinod Kothari (2024) comments that microfinance securitisations represented 16% of the INR 1.9 trillion ABS market (US$23 billion) in the fiscal year 2023-2024 (year ending March 2024).[27]
International coverage and recognition of BRAC’s 2006 transaction, including in India, show that Indian microfinance and securitisation professionals were aware of the transaction before launching the first Indian micro-credit securitisation in 2009.[28] However, even though BRAC’s 2006 transaction may have provided a previous example of micro-credit securitisation, rated microfinance securitisations in India only began three years later. They developed and then took off in 2009-2010 following a separate process from the initial 2006 transaction in Bangladesh. In India, demonstration effects from BRAC’s transaction then appear limited to constituting a relatively recent precedent from a neighbouring country, which may have participated in prompting the idea of attempting a similar approach in India’s different context.
What were the positive success factors?
• BRAC was a leading provider of microfinance lending, and Citigroup's involvement raised the profile of the transaction.
What were the negative success factors?
• The deal was small in total face value and involved multiple small tranches.
• The Bangladesh micro-credit market began to be relatively saturated in 2007-2008, leading MFIs to slow down loan origination and develop more savings products.
• BRAC did not follow up with any repeat transactions, reflecting in part its ability to raise funding through other means.
3.4 Climate Awareness Bonds (EIB case) – 2007
3.4.1 Inaugural transaction
On 22 May 2007, the European Investment Bank (EIB) announced the first worldwide ‘green bond’ issuance (see EIB (2007)). The issue was EIB’s second issuance of its European Public Offering of Securities (“EPOS II”), employing the passporting ability across EU countries permitted by the EU Prospectus Directive. EIB’s first CAB issuance was also the “first bond ever to be sold via public offering simultaneously in all 27 EU Member States.” The bond was offered simultaneously to retail investors in all 27 EU countries.29 30 ,,, The CAB issue had several green features. First, proceeds were ‘earmarked’ by the Bank for ‘future projects in the fields of renewable energy and energy protection’ (see EIB (2007)). Second, the return on the zero-coupon bond was linked to the performance of an index of the equities of European firms selected by FTSE as following best practice environmental policies. Third, investors had the option, but not the obligation, to spend returns to purchase carbon credits.
In summary, the bonds had the following characteristics: ● 5-year bonds capital protected offering returns as a single payment at maturity. ● Premium at maturity linked to the performance of an equity index, the new FTSE4Good Environmental Leaders Europe 40 Index, with a minimum of 5%. ● Investor option to purchase and cancel CO2 EU Allowances, within the scope of the EU emission trading system, at maturity.
26 See Srinivasan (2010), page 55, and Jayadev (2013), page 33. 27 See Vinod Kothari (2024), page 20. 28 In India in particular, see, for example, Vinod Kothari (2009) prepared before May 2009. 29 See EIB (2021) section 4.1, 61. 30 In 2007, the European Union (EU) comprised 27 countries including the UK. Croatia joined the EU from July 2013 (https://european-union.europa.eu/principles-countries-history/eu-countries/croatia_en). Later, the UK left the EU on 31st January 2020.
The EIB employed a large syndicate of 13 banks to distribute the bonds, with Dresdner Kleinwort, Merrill Lynch International and UniCredit Markets & Investment Banking as lead managers. The issuance was intended to be listed in Luxembourg and possibly other EU stock exchanges, thanks to the prospectus passporting ability granted by the EU Prospectus Directive.
3.4.2 How was the transaction innovative?
Earmarking proceeds for green purposes was the critical innovation in this transaction. EIB (2007) states that “the earmarking will be effected by allocation of the proceeds within EIB’s Treasury, pending disbursement, to a specially created and segregated sub-portfolio invested in money market instruments. These arrangements will be reflected in EIB’s financial statements, permitting public monitoring of disbursements.”[31]
Investors were invited to learn more about EIB’s objectives to fund renewable energy projects in EIB’s ‘Corporate Operational Plan for 2007-2009’ on the EIB’s website. This EIB inaugural CAB issuance constituted the first green bond issuance worldwide and was based on the ‘use-of-proceeds’ principle already employed to issue ‘social bonds.’ [32]
3.4.3 What demonstration effects did the transaction achieve?
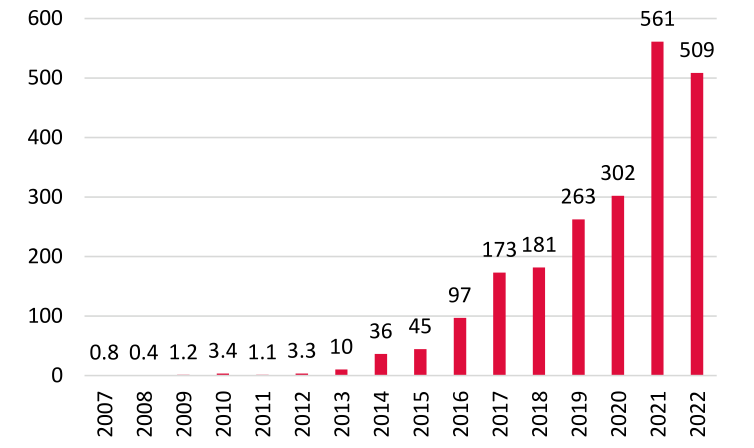
Cumulative issuance of green bonds exceeded US$1 trillion in October 2020 (see EIB (2021)) and US$2.8 trillion by the end of 2023 (see Climate Bonds Initiative (2024)). While this still represents a relatively small fraction of global bond issuance, green bond issuances have experienced significant growth since 2014, as illustrated in Figure 3.5.
Other MDBs have followed the EIB’s example in issuing green bonds. The International Bank for Reconstruction and Development (IBRD) issued green bonds in SEK and USD in 2008 and 2009, respectively. In 2010, the Nordic Investment Bank (NIB) and European Bank for Reconstruction and Development (EBRD) issued green bonds denominated in ZER and IDR, respectively.[33]
Figure 3.5 displays the annual amount of green bond issuances, in US$ billions, from the first EIB issuance in 2007 until the end of 2022. It shows issuances remained limited before starting to take off in 2013. According to EIB (2021), “A turning point for the market came with the sale of a US$1 billion green bond by the IFC in
March 2013, closely followed by the first corporate issuance of green bonds. But the market really took off in 2014, following the launch of the Green Bond Principles (GBPs) by ICMA.”[34]
According to the Climate Bonds Initiative, the cumulative size of the green bond market reached US$2.8 trillion by the end of 2023, and green bond issuance totalled US$587.6 billion for 2023, “breaking through the halftrillion mark for the third consecutive year.”[35]
The ‘use-of-proceeds’ approach has been adopted as the primary feature of green bond issues in the ICMA Green Bond Principles.[36] Both the other green features of indexation based on the returns of environmentally responsible companies and the option to purchase emission allowances have not been widely adopted.
After the inaugural 2007 EIB CAB, the issuance of index-linked green bonds has been anecdotal. In 2015, EIB issued another equity index-linked green bond for €500 million, dubbed ‘Tera Neva’, and HSBC issued an inaugural Equity Linked Green Bond for €38 million in 2017. More recently, France issued the first-ever inflation-linked sovereign green bond for €4 billion in 2022.
What were the positive success factors?
• The issue was very prominent in that the public offering occurred in all 27 domestic markets of the EU in 2007.
• The size of the issue was large.
What were the negative success factors?
• Index linking to equity returns introduced complexity to the bonds, limiting their appeal to investors.
• The transaction included multiple green features, some of which (such as indexing to an equity portfolio) were probably unattractive to fixed-income investors.
Note: The data sources are EIB (2021) and S&P Global Ratings (2023) from the Environmental Finance database.
3.5 IFC’s Managed Co-Lending Portfolio Program (MCPP) – 2013
3.5.1 Inaugural transactions
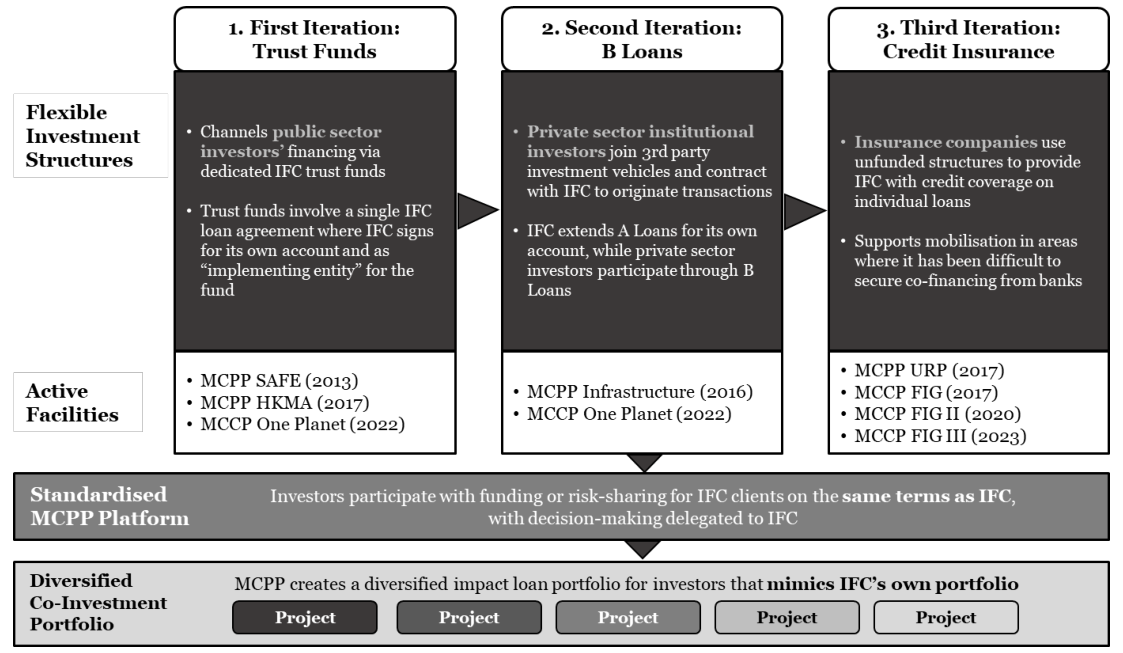
In 2013, the International Finance Corporation (IFC), part of the World Bank Group, launched its Managed Co- Lending Portfolio Program (MCPP) platform with a first trust fund with a US$3 billion investment mandate from the State Administration of Foreign Exchange (SAFE) of the People’s Bank of China.[37]
The MCPP approach was for IFC to set up a trust to hold SAFE’s invested funds. From the outset, SAFE and IFC agreed on the eligibility criteria for projects to be financed. IFC then originated development loans granted by both IFC and the trust funds using a co-lending approach. IFC signed “the loan agreements with borrowers twice, once for its own account and once as ‘implementing entity’ of the trust fund.”[38]
IFC called the transaction MCPP SAFE. In terms of projects financed, MCPP SAFE had a cross-sectoral focus agreed with SAFE, meaning it could invest in loans to all sectors available to IFC’s lending. MCPP SAFE mobilised governmental investments for co-lending with IFC in private sector development projects. It created a first category of MCPP structure: the ‘trust funds.’
In 2016, IFC created a second iteration of MCPP with the support of the Swedish International Development Cooperation Agency (SIDA). It focused on infrastructure financing and was called MCPP Infrastructure. The financing approach was different from MCPP SAFE. IFC created a B-loan fund which purchased infrastructure loans to be originated by IFC, again with pre-agreed eligibility criteria. The B-loan fund was itself funded by a Senior Tranche and a Junior Tranche. The Senior Tranche was placed to private institutional investors, thereby mobilising finance from the private sector. The Junior Tranche was funded by IFC and SIDA, thereby catalysing governmental fund support to help mobilise senior private sector investors. MCPP Infrastructure created a second category of MCPP structures: the ‘B Loan funds.’[39]
34 See EIB (2021) section 3.1, 28. 35 See Climate Bonds Initiative (2024). 36 See S&P Global Ratings (2023) and ICMA (2022). 37 See IFC (2018a) page 28, and IFC (2022) page 29. 38 See IFC (2022), page 31. 39 See IFC (2022), page 32.
In 2017, IFC launched three new iterations of MCPP. The first was a US$1 billion trust fund with the Hong Kong Monetary Authority (HKMA). MCPP HKMA followed the same approach as MCPP SAFE in terms of a ‘trust fund’ structure and cross-sectoral focus.
The other two 2017 iterations created a third category of MCPP structures: the ‘credit insurance’ programmes. MCPP Unfunded Risk Participation (URP) was a portfolio credit insurance programme focused on infrastructure lending in developing countries. It benefited from a US$500 million credit insurance commitment from Swiss RE. MCPP Financial Institutions (FIG) was also a portfolio credit insurance programme but focused on lending to financial institutions in developing countries. It benefited from a US$1 billion credit insurance commitment from Munich RE and Liberty Mutual Group (US$500 million each).[40]
In the MCPP credit insurance structures, IFC again originates loans based on pre-agreed eligibility criteria and keeps them on its balance sheet. The MCPP credit insurance programmes provide IFC with credit insurance or unfunded risk participations on each loan following a pre-agreed portfolio approach, thereby mobilising private insurers’ capital via portfolio risk transfer.
Figure 3.6 summarises the MCPP platform as it was in April 2023, showing all initial transactions and new programmes created in 2020, 2022 and 2023.
Note: The source is IFC (2023).
3.5.2 How was the transaction and platform innovative?
In 2013, MCPP SAFE was an important innovation for IFC in terms of its syndication approach. According to WBG-IEG (2021), SAFE also considered it one of the more innovative investments in its portfolio.
For IFC, MCPP SAFE – and MCPP more generally – have permitted the mobilisation of significant amounts of capital available for larger financing packages than IFC could provide on its own. The syndication process via MCPP was also simplified as:
a) IFC and mobilised investors pre-agreed the sectoral focus and eligibility criteria of future financed projects from the outset.
b) IFC was granted authority to approve loans for MCPP and its own account and has been the sole interface with borrowers.
For mobilised investors (such as SAFE in 2013), MCPP has provided an efficient way to make a large capital allocation to IFC’s pipeline. Investors then gain priority access to IFC’s new origination of eligible projects, passively co-lending or sharing risk alongside IFC, and can develop experience in investing in developing countries with which they were not familiar. For example, SAFE expressed to the World Bank Group’s Independent Evaluation Group (WBG-IEG) that it “considers the MCPP one of the more innovative investments in its portfolio because it allows SAFE to review and analyse similar commercial projects on a dealby-deal basis.”[41]
Finally, IFC further innovated by adapting the initial MCPP SAFE approach via trust funds and transposing its benefits to other forms of capital mobilisation by creating the two other MCPP categories of B-loan funds and credit insurance programmes.
3.5.3 What demonstration effects did the transaction have?
For the WBG-IEG, demonstration effects are observed in four ways in private capital mobilisation (PCM):[42]
• Commitment by a project sponsor or investor to new PCM projects after successful previous PCM projects in which they invested.
• Additional lending from an investor or commercial bank to the same PCM project as it develops.
• Commitment by a new project sponsor or investor to new PCM projects after successful previous sponsors or investors.
• Replication by another MDB or DFI for their own assets of previous financial structures or platforms.
A first demonstration effect of MCPP SAFE comes from SAFE, which stated to WBG-IEG that the programme allowed them to learn from projects financed via IFC to consider similar projects on a deal-by-deal basis.
A second demonstration effect was IFC's ability to capitalise on the MCPP SAFE approach to devise the MCPP Infrastructure programme with support from institutional investors and SIDA and to launch it in 2016.[43]
A third demonstration effect of MCPP SAFE was with HKMA in preparing MCPP HKMA, launched in 2017. WBG-IEG (2021) opined that there was “evidence of impressive demonstration effects in an adjacent jurisdiction with the Hong Kong Monetary Authority (HKMA).” In support of this assessment, the report added that “As part of their due diligence, HKMA sought references from SAFE, and with SAFE providing positive feedback, HKMA was able to proceed with an increased level of comfort.” MCPP HKMA was the first ever investment commitment from HKMA with IFC, and it “was very impressed with the portfolio construction” and “eager to expand its impact investing initiatives.” As a result, HKMA committed an additional US$1 billion to MCPP HKMA in 2019.[44]
Regarding SAFE, WBG-IEG (2021) mentioned that it had started a private debt partnership with the Inter- American Development Bank (IDB) before IFC. It also added that, after MCPP-SAFE, “SAFE is pursuing similar EMDE exposure through private equity and local currency investment platforms with the EBRD and the Government of Brazil, respectively.” The report did not provide more information on the outcome of these initiatives or other EMDE investments SAFE may have considered.
MCPP’s demonstration effects vis-à-vis IFC’s partner investors and clients have been significant. To date, MCPP has grown considerably and multiplied its number of active facilities. At the end of 2023, IFC reported that since its launch, MCPP had raised more than US$16 billion from 17 partners (governmental investors and private sector insurers) and had supported more than 260 IFC clients across 63 countries.
MCPP’s demonstration effects in terms of replication by other MDBs, DFIs, or private sector institutions appear less clear. To date, it does not appear that other MDBs, DFIs or commercial lenders have replicated MCPP and its approach of investors entrusting the originator to build portfolios of loans to developing countries and colending.
In 2020-2021, FAST-Infra, an initiative supported by the Climate Policy Initiative (CPI), the Global Infrastructure Facility (GIF) and IFC, proposed the idea of an ‘open-sourced MCPP’ (dubbed OMCPP) that would extend IFC’s MCPP approach. The proposal considered creating an open MCPP that various MDBs and DFIs could join to broaden MCPP’s delegated co-lending mobilisation approach for infrastructure financing. The initiative led to the creation of FAST-Infra Group in 2022, a French-law association headquartered in Paris. Aat this stage, it focused on a FAST-Infra Sustainable Infrastructure label and the FAST-Infra Platform, a digital collaboration platform to support stakeholders in developing and implementing large-scale sustainable infrastructure programs, particularly in emerging countries. To date, the OMCPP platform has not been created and the FAST-Infra Group website states that it remains an idea under development.[45][46]
More recently, in April 2024, a coalition of ten MDBs[47] announced the creation of the Global Collaborative Co- Financing Platform, consisting of the digital Co-Financing Portal and the Co-Financing Forum. The Co- Financing Portal will be a secure platform, hosted by the World Bank, allowing registered co-financiers to share their pipeline of projects to help identify co-financing opportunities which can be discussed in the Co-Financing Forum. This appears to be a major initiative by MDBs. However, at this stage, it does not seem to expand on MCPP’s approach of delegated origination, for example.[48]
What were the positive success factors?
• IFC’s strong pipeline of private-sector projects to be financed in developing countries.
• IFC’s reassuring track record of expertise in originating and managing such lending and its low risk.
• Motivation by governmental funds and institutional investors to extend their reach and investments in developing countries while benefiting from IFC’s expertise and track record.
• Ability to adapt the structure and eligibility criteria of MCPP facilities to various governmental or institutional investors and their requirements while maintaining strong pipelines of eligible projects.
What were the negative success factors?
• MCPP facilities, with origination delegation, require a large enough pipeline of future projects to make sense and attract investors.
• It seems the approach has been particularly adapted to IFC and its syndication approach but is not necessarily easy for originators to replicate.
3.6 Trade MAPS multi-bank trade finance securitisation – 2013
3.6.1 Initial transaction
In December 2013, Citigroup and Santander launched Trade MAPS 1 Limited, a new multi-seller platform for the securitisation of global short-term trade finance loans. At the same time, they launched the first issuance from the platform, the US$1 billion 3-year floating rate notes, Series 2013-1.
Series 2013-1 included 4 classes of notes, Class A to Class D, rated from AAA/AAA down to B/BB by Fitch and S&P. The issuance of Class C and D notes permitted the transfer of credit risk to investors and, thus, for Citigroup and Santander to obtain capital relief from the securitisation.
For the initial issuance, Trade MAPS 1 securitised global trade finance loans originated by Citigroup and Santander. However, the platform was designed as a blueprint so that other banks active in global trade finance could join it in the future. The project had already started as soon as 2011. At the time, and ING was participating in it with Citigroup and Santander.[49]
The transaction was celebrated by trade finance and securitisation practitioners as the first multi-bank securitisation platform of global trade-finance loans, supporting global trade financing by creating a new way to mobilise capital markets. It was hoped the Trade MAPS platform would pave the way for repeat issuances and that additional trade finance banks would join it in the future.
3.6.2 How was the transaction innovative?
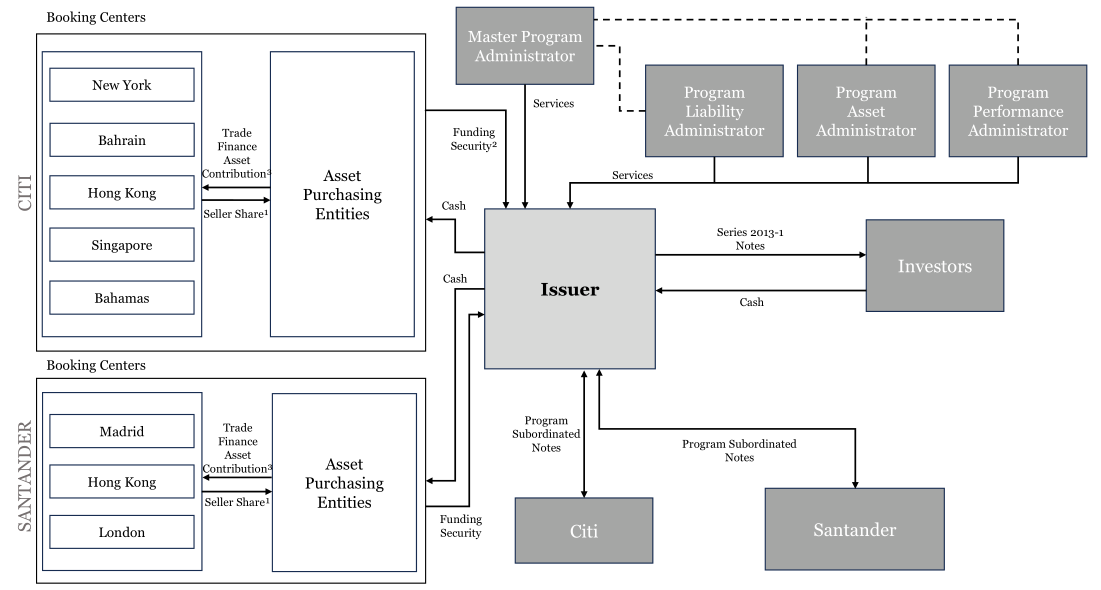
Trade MAPS was an innovative multi-bank securitisation platform, but it was consequently shown to be a fairly complicated structure and transaction, as illustrated by Figure 3.7.
Trade finance loans constitute a relatively complex asset class since they comprise multiple product subsets with little standardisation of characteristics and documentation. Trade finance is also a global and intrinsically cross-border activity, which complicates funded securitisation.
Trade MAPS also featured more typical characteristics of short-term asset securitisations, employing a master issuer: Series 2013-1 featured a revolving period during which new trade finance receivables could be purchased to replace previously repaid assets. Trade MAPS 1 could also issue new series of notes in the future, while Series 2013-1 was still in existence, subject to certain conditions.
Figure 3.7 summarises Trade MAPS’s transaction structure and key parties. The boxes above and below the Issuer and on the right-hand side are typical parties in a securitisation platform via a master issuer, i.e. a party able to issue multiple series of notes.
The boxes on the Issuer’s left-hand side illustrate the additional complexity of a multi-bank platform securitising global and cross-border receivables. Citigroup’s trade finance activities included in the transaction were carried out from five different booking centres worldwide, and Santander’s trade finance activities involved three booking centres within the group. In addition, the transaction structure included five Asset Purchasing Entities (APEs) in different countries to accommodate the various countries of the trade finance loans and booking centres.
The APEs were intermediary SPVs that purchased trade finance receivables from Citigroup and Santander's various booking centres. They were set up to optimise the efficiency of purchasing the receivables and minimise the potential legal and tax constraints between the countries where the borrowers, booking centres, and APEs were located. Five APEs were already created for Trade MAPS’s first issuance, Series 2013-1:
• Two in Ireland and Hong Kong for Santander.
• Three in Ireland, Hong Kong and Singapore for Citigroup.
Note: The source is Citigroup et al. (2013).
3.6.3 What demonstration effects did the transaction have?
Initial demonstration effects obtained Initially, at the end of 2013 and in 2014, Trade MAPS was hailed as a highly innovative platform to securitise global trade finance loans. In terms of market impact, IFLR (2014) called it a “first of its kind asset-backed securities (ABS) deal” and wrote that “Trade MAPS has ramifications for both the securitisation and trade finance sectors.”
The transaction was also featured prominently in an article about “New ways to finance trade” in The Banker in April 2014 (see The Banker (2014)).
The initial issuance size of US$1 billion was significant and widely noticed. The cross-border and global aspects of the securitised receivables and the dual-bank characteristics of the initial issuance were breakthroughs in the trade finance and securitisation markets. It was hoped that the initial Trade MAPS transaction would lead to repeat issuances and inspire other trade finance banks to join the platform or set up their own trade finance securitisation programmes.
In March 2014, Asset-Backed Alert (2014) featured a news piece called “Trade-Finance Sequel On the Way,” announcing that Citigroup and Santander were already preparing the second issuance out of the Trade MAPS platform. The deal was “expected to hit the market in the coming weeks.”
Eventually, there was no follow-on issuance from the Trade MAPS programme, neither by Citigroup, Santander or any other banks. Although very innovative from a cash securitisation point of view, we understand that the platform proved costly and complicated to set up and operate. Its multi-bank and global approach, involving various booking centres and intermediary asset purchasing entities across the world, added to the complexity of involving several bank groups.
The Trade MAPS platform required originators with very similar trade finance portfolios and closely aligned transaction objectives (in terms of funding and/or risk transfer) to justify the complexities and costs of new issuances. We understood that Citi’s objectives included funding and risk transfer. Santander’s objectives were more focused on improving the funding conditions of trade finance. This improved in 2014, making it too onerous to use Trade MAPS.
The initial issuance was redeemed as expected in 2016, and the Trade MAPS platform was wound up. Since then, the Trade MAPS approach has not been replicated and commercial banks have focused on using synthetic securitisation approaches for their trade finance exposures to achieve risk transfer and capital relief.
What were the positive success factors?
• The deal was extremely high profile, with considerable coverage in the specialist press.
• Other banks were working on related but less sophisticated ways of securitising trade finance receivables, so many thought the timing of the transaction was good. What were the negative success factors?
• The attempt to involve multiple banks in the platform complicated the deal substantially. In the end, only two banks participated. The two banks committed very different portfolios and had very different objectives.
• The inclusion of receivables from many jurisdictions complicated the legal issues that needed to be resolved and made the deal expensive to execute.
• There was no follow-on deal by the originators after Santander concluded that it had little to gain commercially.
3.7 Seychelles debt conversion for marine conservation – 2016
3.7.1 Inaugural transaction
On 26 February 2015, the Seychelles Presidency announced the first-ever debt-for-nature swap focusing on marine conservation, which was the first transaction to employ loan capital to help finance the swap.[50]
50 See Seychelles Presidency (2015) and BBC Future (2020).
The debt buyback agreement, secured with the Paris Club and South Africa, was hailed as a historic moment to support Large Ocean Developing States (LODS)[51] and the Blue Economy. It included a discounted partial buyback of US$21.6 million of Seychelles debt vis-à-vis its Paris Club creditors to help the country redirect a portion of its previous debt payments towards marine conservation and climate adaptation.
The agreement entailed the creation of the Seychelles Conservation and Climate Adaptation Trust (SeyCCAT), an independent trust established to manage the debt-conversion deal proceeds later in 2015. The debt buy-back and swap were implemented in March 2016.
Even though it was announced in 2015, the debt-conversion agreement took time to devise and negotiate. This took place with the support of The Nature Conservancy (TNC).[52] Discussions between TNC and the Seychelles Government started as early as 2011. The global financial crisis (GFC) had a substantial negative impact on Seychelles. It encountered debt payment difficulties in 2008 and resorted to support from the International Monetary Fund (IMF). In November 2008, the IMF reported that Seychelles was “in the midst of an acute balance of payments and public debt crisis, which jeopardizes its high living standards and economic development.” Seychelles had public debt representing over 150% of GDP and external public debt of US$808 representing 95% of GDP, of which over 40% was in arrears, mostly to Paris Club creditors.
In November 2008, the IMF granted Seychelles a US$26 million 2-year stand-by support arrangement, including drastic economic and financial reforms. In 2009, the Paris Club agreed to restructure Seychelles's debt in light of the country’s strong commitment to implementing the IMF reforms.
Seychelles is highly dependent on its blue economy, which supports more than two-thirds of the local economy. At the time, Seychelles’ marine and coastal environment was threatened by pollution, climate change and overfishing. It was, therefore, critical for Seychelles to better protect its maritime Exclusive Economic Zone (EEZ) of 1.37 million km[2] (compared with a land area of just 455 km[2]). In 2012, following the initial discussions with TNC, Seychelles committed to expanding its Marine Protected Areas (MPAs) to 30% of its EEZ (from only 0.04% before), representing 410,000 km[2] (an area larger than Germany) by 2020.
Seychelles’ promise to create 13 new MPAs enabled TNC to provide funding to support the debt-for-nature swap. The deal, closed in 2016, involved impact investors mobilised by TNC providing a US$15.2 million loan (at a concessional rate of 3%) and US$5 million in grants, all paid to SeyCCAT. SeyCCAT then lent US$20.2 million to the Seychelles Government, which used the money to buy back US$21.6 million from its Paris Club creditors at a US$1.4 million discount (equivalent to a 93.5% buy-back price). The net savings from SeyCCAT between its larger loan to the Seychelles Government and interest payments on the TNC loan generated the financial capacity to fund marine conservation and climate change adaptation projects in the Seychelles.
3.7.2 How was the transaction innovative?
Figure 3.8 displays the structure of the Seychelles debt-for-nature conversion as it was in 2016 and the subsequent ‘Blue Bonds’ issuance in 2018. It illustrates an innovative and fairly complicated financial structure to free up financial resources – which Seychelles would have otherwise used to service its external debt – to finance marine conservation and climate adaptation projects.
SeyCCAT was created in November 2015 through the Conservation and Climate Adaptation Trust of Seychelles Act 2015. It was established to manage the grant and loan from impact investors mobilised by TNC. Interposing SeyCCAT between TNC and the Seychelles Government was required as TNC cannot provide grants directly to governments. In March 2016, SeyCCAT received the US$5 million grant and US$15.2 million loan proceeds from TNC and on-lent them to the Seychelles Government. The Seychelles Government used the amount to buy back US$21.6 million from its Paris Club creditors at a US$1.4 million discount (equivalent to a 93.5% buy-back price).
The 2016 debt-for-nature swap was followed in 2018 by the ‘Blue Bond’ issued by the Seychelles Government, which constituted the first sovereign blue bond worldwide. All boxes and arrows on the chart above referring to
51 There are 58 LODS in the world which are home to over 65 million people.
Blue Bond, GEF Credit, IBRD Guarantee and Blue Investment Fund are linked to the 2018 Blue Bond issuance. In 2018, proceeds from the Blue Bond issuance were split between US$3 million paid to SeyCCAT and US$12 million put into the Blue Investment Fund managed by the Development Bank of Seychelles (DBS).
Seychelles’ Conservation and Climate Adaptation Trust Blue Bond $3M US$15M
IBRD Guarantee $3M invested @ BB Proceeds DS Proceeds $12M US$5M $150K yr @ 7%, 20 yrs $3M $5.6M (P&I) compounding (P&I)
BLUE GRANTS BLUE BLUE FUND ENDOWMENT INVESTMENT $8.6M FUND FUND (EV $6.6M) US$12M
Note: The source is Commonwealth Blue Charter (2020).
Further to SeyCCAT’s loan to the Seychelles Government, it received two notes from the government: ● Note 1 issued for US$15.2 million and paying 3% interest over 10 years. ● Note 2 issued for US$6.4 million.
Note 1 backs the US$15.2 concessional loan from TNC’s impact investors. On the other hand, thanks to the TNC US$5 million grant, Note 2 – and the periodic payments to be received from it – are available to SeyCCAT to endow the Blue Grants Fund and the Blue Endowment Fund progressively, alongside the US$3 million Blue Bond proceeds received by SeyCCAT in 2018.
DBS manages the Blue Investment Fund separately, whereas SeyCCAT manages the Blue Grants Fund and Blue Endowment Fund. The Blue Endowment Fund is capitalising until maturity in 2036, with an expected US$6.6 million value at maturity. The Blue Grants Fund is SeyCCAT’s main revolving fund to finance investments in marine conservation and climate adaptation projects through competitive requests for proposals.

Note 1: $15.2M Note 1: $15.2M $5M grants GEF Credit (3% 10 yrs): $17.7M Note 2: $6.4M $20.2M US$5M
3.7.3 What demonstration effects did the transaction achieve?
The Seychelles debt-for-nature swap led to Seychelles issuing the first sovereign ‘blue bonds’ in 2018, which started to create ‘blue bonds’ as a nascent bond asset class (although they can also be considered a subset of green bonds).
In March 2020, Seychelles announced the final details to achieve its objective of protecting 30% of its maritime EEZ, having legally declared them as MPAs after extensive planning and consultation work.[53]
53 See Seychelles Presidency (2020).
The Seychelles transactions have already been followed by four more recent debt-for-marine-conservation deals, three of which were implemented with the participation of TNC: ● November 2021: US$ 364 million debt conversion for marine conservation by the Belize Government that reduced Belize’s debt by 12% of GDP. ● September 2022: US$ 50 million ‘Blue Bonds’ and debt conversion (refinancing) to help Barbados protect up to 30% of its marine ecosystems, involving the Inter-American Development Bank (IDB). ● May 2023: US$ 1.6 billion debt conversion and US$ 656 million blue bond issuance (the ‘Galápagos Marine Bond’) by the Ecuador Government to support long-term marine conservation (18 years) in the Galápagos Islands. ● August 2023: US$ 500 million ‘Blue Bonds’ refinancing part of Gabon’s national debt and unlocking US$ 163 million to protect and manage its maritime areas.
The Belize, Barbados, and Gabon debt conversions and blue bonds were completed with the support of TNC, as in the Seychelles transaction. The Galápagos Marine Bond and debt conversion were implemented with the support of the IDB, which provided a US$85 million guarantee, and the US International Development Finance Corporation (US DFC), which provided US$656 million political risk insurance.
What were the positive success factors?
• The transaction displayed a very strong commitment by Seychelles to extend its MPAs while helping its blue economy to adapt, as demonstrated by the 30% MPA objective reached in 2020.
• The support of a leading non-profit environmental charitable organisation like TNC and its financial backers, permitting the grant given to Seychelles.
• The support of Paris Club creditors, which accepted the debt buy-back at a discount.
• The following creation of the nascent ‘blue bond’ new bond asset class.
What were the negative success factors?
• The need for concessional lending levels – and grants when available – to obtain favourable debt conversion terms and free up financial resources for the issuing countries.
• The lack of generally accepted criteria to designate bonds as ‘blue bonds’, unlike the Green Bonds Principles from ICMA or the Climate Bonds Standard and Certification Scheme by the Climate Bonds Initiative, although this is a field in progress.[54][55]
3.8 Room2Run – 2018
3.8.1 Initial transaction
In autumn 2018, the African Development Bank (AfDB) synthetically securitised a portfolio of existing loans with a face value of US$1 billion. The transaction was known as Room2Run (R2R). The structure adopted left the Bank with a thin junior tranche detaching at 2% and a thick senior tranche attaching at 27.25%. Figure 3.9 shows the structure of the deal.
Two private sector funds, the International Infrastructure Finance Company II (“IIFC II”), managed initially by the Mariner Investment Group and subsequently by Newmarket Capital, and Africa50, provide credit protection for a mezzanine credit tranche with a face value of US$152.5 million attaching at 2% and detaching at 17.25%. These private sector investors provided collateral to eliminate counterparty risk. IIFC II purchased 80% of this tranche. Credit protection for the senior mezzanine part of the structure was provided by the European Commission (EC)’s European Fund for Sustainable Development.
The reference portfolio for the deal consisted of approximately 45 non-sovereign loans to entities in 16 African nations and 13 different sectors. About half of the loans were to infrastructure projects, with the other half to financial institutions.
Mizuho acted as advisor to AfDB for the transaction. Mizuho (2018) reports that AfDB’s objective to agreeing the deal was to achieve a reduction of at least 65% in the Risk Weighted Assets (RWAs) as measured by the rating agency Standard & Poor’s. This would increase the Bank’s Risk Adjusted Capital (RAC) ratio, the primary basis on which Standard & Poor’s assesses the capital adequacy of MDBs when determining their credit rating. Following the transaction, AfDB and Mariner jointly commissioned Risk Control to write a summary of the transaction and an assessment of the scope for other MDBs to engage in similar deals (see Risk Control (2019)).
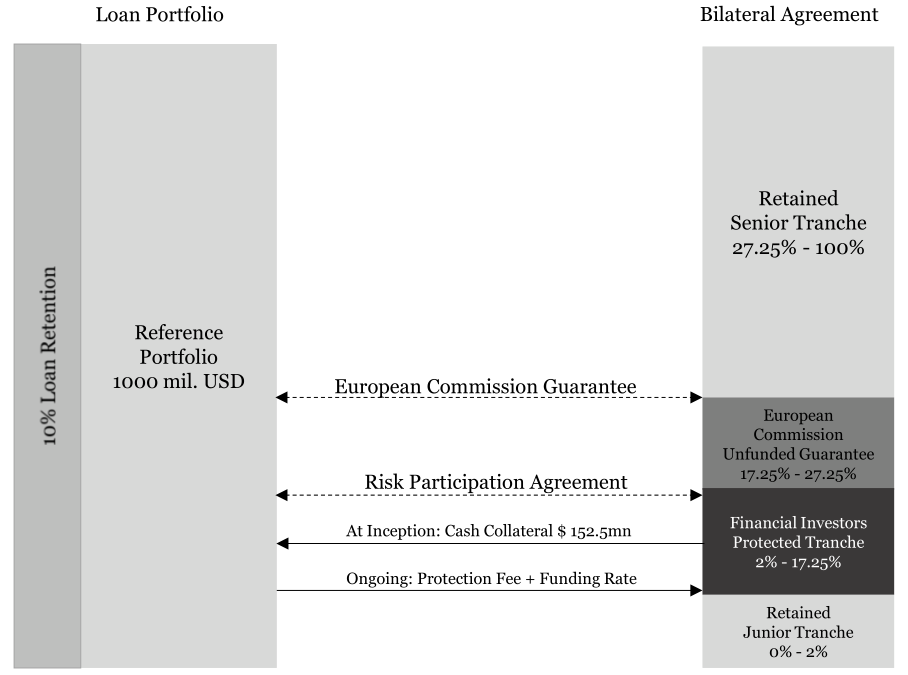
3.8.2 How was the transaction innovative?
While a very early, one-off securitisation had been performed by IFC two decades earlier, the 2018 Room2Run deal was the first securitisation of MDB loans in recent times. The transaction included only Non-Sovereign Obligor (NSO) loans. These form a small fraction of the balance sheet of most major MDBs, which lend primarily to Sovereign Obligors (SOs).
The major achievements of the AfDB team in implementing the deal were:
1. Persuading Standard & Poor’s to devise a rating methodology that could be used to rate (privately) the retained senior tranche of the deal. This was essential because, in the RAC methodology employed by the agency to rate the Bank itself, the retained senior tranche had to be rated. The standard methodologies employed by the agency for rating securitisation tranches were penally conservative in the case of the senior tranche of the 2018 R2R. The methodology devised by Standard & Poor’s, which was more consistent with the relatively low-risk nature of AfDB’s loans, meant that the deal became possible.
2. Establishing objective grounds for pricing the deal. Since the transaction was highly innovative for an MDB audience, it was important to provide reassurance that the transaction was appropriately priced. AfDB achieved this by launching a credit reinsurance portfolio risk transfer transaction around the same time as Room2Run. By comparing the pricing of the two approaches, it was possible to be confident that pricing was appropriate.
3.8.3 What demonstration effects did the transaction have?
Room2Run NSO garnered significant coverage among the MLI community, in the synthetic risk transfer markets, and in the specialised financial press once AfDB announced it in September 2018. The following month, the transaction was the subject of a dedicated workshop on the sidelines of the World Bank/IMF General Assembly, attended by around 70 participants from the international finance community (investors, bankers and other financial institutions).
The transaction was also the subject of a case study by the United Nations (UN) Principles for Responsible Investment (PRI) in September 2019 and was shortlisted in the ‘Real World Impact Initiative of the Year’ category for the PRI Awards 2019.[56] The following month, Room2Run NSO was awarded ‘Impact Deal of the Year’ at the Capital Relief Trades Awards 2019 organised by the Structured Credit Investor (SCI) publication and its global panel of credit risk transfer professionals.[57]
Many in the development finance community and credit risk transfer markets expected that Room2Run 2018 would pave the way for more synthetic securitisations by MDBs. As mentioned above, NSO loans of the type involved in Room2Run 2018 constitute a small part of the exposure of most major MDBs, which lend primarily to SOs. It was not until four years later, in 2022, that AfDB implemented a comparable transaction comprising SO loans. So far, this has been only the second synthetic securitisation by an MDB.
In 2023, IBD Invest announced that it was working on a synthetic securitisation of NSO loans (which takes inspiration from the 2018 Room2Room) to boost its lending capacity in Latin America and the Caribbean. In June 2024, IDB Invest’s CEO confirmed to LatinFinance that the bank was planning to launch the deal by the following September (see LatinFinance (2024)).
The 2018 Room2Run synthetic securitisation also generated useful developments in supranational rating methodologies. These have started to clarify the way rating agencies approach credit risk transfer transactions by MDBs and other supranationals. Standard & Poor’s has, for example, expanded on the methodology developed for R2R NSO and incorporated it into its general rating methodology for MLIs and other supranational institutions.[58]
In December 2023, Fitch Ratings also issued a discussion paper in which they considered, among other topics, adding portfolio risk transfer criteria to the agency’s supranational rating criteria and invited comments from market participants. In early July 2024, following its discussion paper, Fitch issued draft supranationals rating criteria.[59]
What were the positive success factors?
• The deal overcame a major obstacle associated with securing a rating methodology for the retained senior tranche.
• The deal also overcame a technical, financial obstacle in the sense that the good credit performance of the Bank’s NSO loan portfolio convinced investors (this being a new asset class for the investors involved).
• The deal employed standard synthetic risk transfer approaches familiar to most market participants and consequently deployable in other deals. What were the negative success factors?
• The transaction involved NSO loans, which, for most MDBs, form a small part of the balance sheet and, hence, are less material for risk transfer purposes.
• MDBs are typically constrained in their balance sheet management by one of the three major rating agencies. The Room2Run deal was most relevant for MDBs constrained by the Standard & Poor’s rating, but this represents only a fraction of all MDBs.
3.9 Guaranteed Green Certified Local Currency Bond in Nigeria – 2022
3.9.1 Inaugural transaction
In September 2022, InfraCredit, a local currency infrastructure guarantee company,[60] guaranteed the first green-certified local currency bond issuance supported by blended finance in Nigeria. The NGN 800 million[61] guaranteed senior green bonds (Senior Tranche A) formed part of an NGN 1.6 billion total debt issuance (then equivalent to USD 3.7 million) to finance an off-grid solar rural electrification project by Darway Coast Nigeria Limited in two states in Nigeria. The 7-year Senior Tranche A was supported by NGN 800 million in 7-year subordinated green concessional debt (Subordinated Tranche B) provided by the Climate Finance Blending Facility (CFBF).
The CFBF was set up in May 2022 in Nigeria by InfraCredit with GBP 10 million concessional funding from the UK’s Foreign, Commonwealth & Development Office (FCDO) as ‘anchor funder’ and InfraCredit as co-financing partner. Within FCDO, the CFBF is a component of the UK Nigeria Infrastructure Advisory Facility, (UKNAIF).[62] Its purpose is to act as a catalytic first-loss multi-donor facility, alongside InfraCredit’s local currency guarantees, to help mobilise additional funding from development partners and domestic institutional investors in Nigeria to co-finance off-grid clean energy projects. The Darway Coast green-certified blended debt issuance was the first transaction supported by the CFBF.
Figure 3.10 depicts the financing structure of the Darway Coast P1 solar mini-grid electrification project in September 2022. The two green debt Tranches, A and B, were issued by InfraFunding SPV Ltd, a multi-series funding SPV established by InfraCredit to raise debt in the Nigerian private capital markets to finance eligible infrastructure projects in Nigeria. InfraFunding then on-lent the issuance proceeds to Darway Coast P1 Ltd, a project SPV set up by Darway Coast Nigeria (DCN) to build and operate the six isolated hybrid-solar mini-grids covered by the project.
The credit enhancement provided by CFBF’s subordinated concessional debt (50% of the debt issuance) enabled InfraCredit to guarantee the Senior Tranche A, which in turn permitted the Tranche A bonds to be rated AAA(NG) in local currency by GCR Ratings, a part-subsidiary of Moody’s established in South Africa.
According to GCR Ratings (2023a), the Senior Tranche A pays a 14% fixed-rate coupon. The Subordinated Tranche B pays a 2.5% concessional fixed-rate coupon (which creates a blended total coupon of 8.25%). InfraCredit (2022) and GCR Ratings (2023a) also state that the NGN 1.6 billion total debt issuance has an effective blended interest rate of 9.75% per annum. To accommodate the project construction phase, both Tranches A and B feature a 2-year principal repayment grace period from the issuance date.
Thanks to InfraCredit’s AAA guarantee in NGN, the Senior Tranche A was distributed to six domestic private institutional investors in Nigeria, including insurance companies, asset managers, and pension funds. Prior to issuance, the total NGN 1.6 billion green debt was certified by the Climate Bonds Initiative (CBI) under the Climate Bonds Standard and Certification Scheme, solar energy sector criteria. The Darway Coast P1 project will electrify unserved households and small businesses in Nigeria's Abia and Rivers states, with a total capacity of 526 kW. It will contribute to SDGs 7, 8, 9, 11, 13 and 17, as identified in its green bond framework.[63]
Finally, the Darway Coast P1 debt issuance also benefited from funding and technical assistance (TA) in relation to some initial transaction costs. FSD Africa (also supported by FCDO) funded the debt issuance green verification under a TA agreement. KfW Development Bank also funded the technical, legal, environmental and social due diligence costs under a TA agreement.
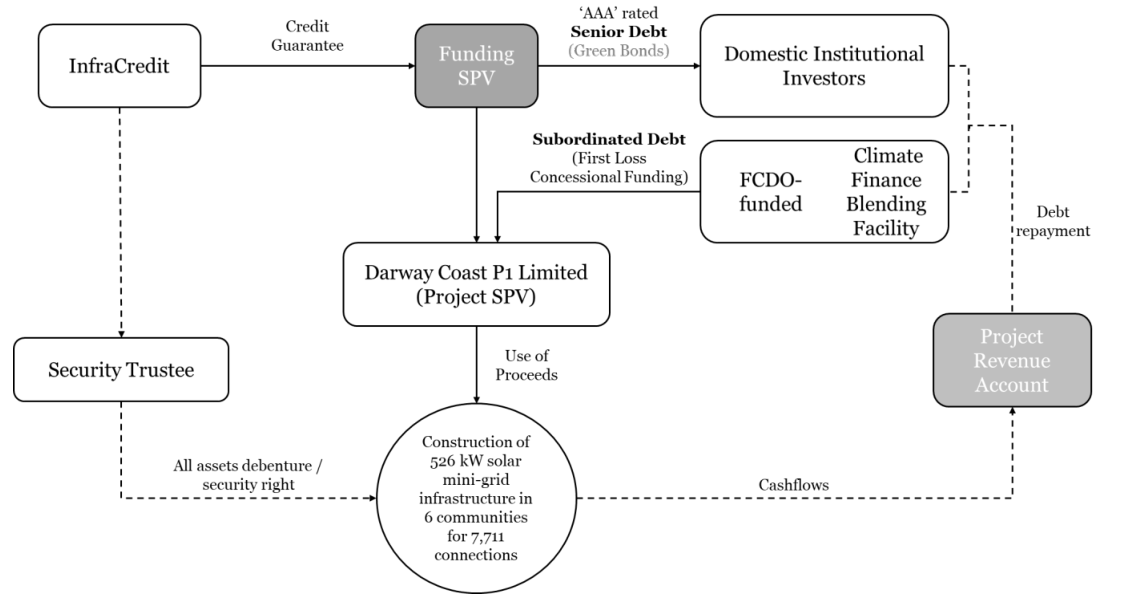
Note: The sources are InfraCredit (2022) and GCR Ratings (2023a).
3.9.2 How was the transaction innovative?
According to CBI’s Certified Climate Bonds database,[64] the transaction was only the fourth certified climate bond from Nigeria. The previous three issuances, also denominated in local currency, were from larger issuers such as the Nigerian Government, Access Bank Nigeria and North South Power Company Ltd, for issuance amounts between NGN 6.3 billion and NGN 15 billion and did not involve blended finance.
However, the Darway Coast P1 financing supported a smaller project and sponsor (Darway Coast Nigeria). This inaugural CFBF-supported transaction was then the first debt issuance in Nigeria to combine:
• The CBI certification.
• The blended finance approach with 50% subordinated concessional debt from the CFBF.
• The InfraCredit-guaranteed senior green bonds, which mobilised domestic private institutional investors for the remaining 50% of debt funding.
The CBI certification came with a thorough ESG assessment of the Darway Coast P1 off-grid rural solar electrification project and DCN as its sponsor to comply with the CBI’s Climate Bonds Standard. DCN has a strong commitment to mitigating climate change and achieving the UN Sustainable Development Goals (SDGs).
The Darway Coast P1 project’s CBI certification and SDG commitments made it eligible for blended finance support from the CFBF. This support created the required credit enhancement to enable InfraCredit to guarantee the senior tranche debt, which in turn permitted the bonds’ distribution to six domestic institutional investors and the mobilisation of 50% local private capital in Nigeria.
3.9.3 What demonstration effects did the transaction achieve?
InfraCredit had operated since 2017 and had already guaranteed a number of local infrastructure debt issuances in Nigeria before the 2022 Darway Coast transactions. It already had an extensive network of active domestic institutional investors interested in sustainable and green domestic bonds.
The innovative inaugural debt issuance was extensively covered in the Nigerian business press when it was publicly announced in November 2022. In May 2023, InfraCredit and the Darway Coast blended financing were covered in detail in the WEF community paper “Mobilizing Investments for Clean Energy in Nigeria” prepared with the Renewable Energy & Energy Efficiency Associations (REEEA-A) and featured at a joint WEF & REEEA-A roundtable on the topic in Abuja, Nigeria. This further extended the coverage and visibility of the inaugural CFBF transaction for mobilising capital for blended finance of clean energy in unserved or underserved areas of Nigeria.[65]
In June 2023, the CFBF and InfraCredit closed a second green-certified blended finance debt issuance in local currency, again comprising subordinated concessional funding from the CFBF and a senior AAA(NG) bond tranche guaranteed by InfraCredit. The NGN 1.9 billion (equivalent to US$3.4 million) 7-year financing funded a solar-powered rural telephony project by Hotspot Network Ltd across 22 states in Nigeria.[66]
The Hotspot Network blended finance was again split 50:50 between the guaranteed Senior Tranche A bonds and the concessional Subordinated Tranche B funded by the CFBF. This time, according to GCR Ratings (2023b), the Senior Tranche A pays a 15% fixed-rate coupon, and the Subordinated Tranche B pays a 1.5% concessional fixed-rate coupon (which creates again a blended total coupon of 8.25%). InfraCredit (2023) and GCR Ratings (2023b) state again that the total debt issuance has an effective blended interest rate of 9.75% per annum.
The Senior Tranche A bonds mobilised private capital from nine domestic institutional investors comprising four institutions which participated in the inaugural transactions and five new ones. The debt issuance also benefitted from technical assistance funding preparatory and issuance costs from the US Trade and Development Agency (USTDA), KfW and FSD Africa.
In December 2023, the CFBF and InfraCredit closed a third green-certified blended finance debt issuance in local currency, including subordinated concessional funding from the CFBF and a senior AAA(NG) bond tranche guaranteed by InfraCredit. The NGN 1.5 billion (equivalent to US$1.7 million) 7-year financing funded an offgrid hybrid-solar mini-grid infrastructure by ACOB Lighting Technology Ltd for unserved communities in two Nigerian states.[67]
The ACOB Lighting blended finance was again split 50:50 between the guaranteed Senior Tranche A bonds and the concessional Subordinated Tranche B funded by the CFBF. This time, according to GCR Ratings (2023b), the Senior Tranche A pays a 16.5% fixed-rate coupon, and the Subordinated Tranche B pays a 0.25% concessional fixed-rate coupon (which creates a blended total coupon of 8.25% again). InfraCredit (2024) and GCR Ratings (2024) state again that the total debt issuance has an effective blended interest rate of 9.75% per annum.
The Senior Tranche A bonds mobilised capital from seven domestic institutional investors, including the Nigeria Sovereign Investment Authority (NSAI) and six private institutions, five of which had already participated in the previous transaction. The debt issuance also benefitted from FSD Africa funding of the technical, legal, environmental, and social due diligence costs and green verification costs under a TA agreement.
It would be worth understanding what underpinned the different Senior Tranche A coupon rates of 14%, 15% and 16.25% between the three different issuances, as they were all 7-year domestic bonds rated AAA(NG) thanks to the InfraCredit-guarantee, benefitted from the same Green certification and strong ESG commitments, and are funding somewhat comparable projects involving off-grid rural solar electrification. Preliminary data on 7year Nigerian government bonds in local currency show their market yield increasing from around 12.6% in September 2022 to around 13.8% at the beginning of June 2023 and around 15% at the beginning of December
2023. At the beginning of June 2024, they were trading at around 18.8% yield.
Finally, the CFBF aims to be a multi-donor first-loss blending finance facility beyond starting with a GBP 10 million seed concessional funding from FCDO. In November 2023, FCDO updated its annual review of its UK Nigeria Infrastructure Advisory Facility (UKNIAF) programme, of which the CFBF is one of three components. It acknowledges the local expertise brought by InfraCredit to “a difficult sector for investment, i.e. mini-grids, which are not usually commercially viable but provide a great opportunity for providing access to electricity to households that do not have access to the grid.” FCDO notes that InfraCredit “has also been proactive in talking to potential institutional investors and donors about future scale-up of the CFBF.” To date, it does not seem that additional donors may have joined the CFBF in addition to FCDO.[68]
In this latest annual review, FCDO assesses that the CFBF is on track to achieve its outcomes and concludes that “the success of this programme will depend on the financial sustainability of investments which, if achieved, could be replicated on a transformational scale. It will be important to evaluate the actual effectiveness and potential sustainability of the work as investments take place.”[69]
What were the positive success factors?
• Innovative blended finance solution with AAA local-currency guarantee, adapted to financing the offgrid clean-energy projects required in Nigeria.
• Strong local partner (InfraCredit) expert in the infrastructure projects targeted and well-established in the domestic private capital market.
• Attractive financing structure for the project sponsors and attractive AAA(NG) domestic bonds with Green certification and ESG credentials.
What were the negative success factors?
• Reliance on concessional funding and donors to make the funding competitive enough to finance the mini-grid clean-energy projects in Nigeria.
• Potentially an unfavourable environment of rising interest rates in Nigeria since 2022.
3.10 Bayfront Infrastructure Capital IV (BIC IV) – 2023
3.10.1 Inaugural MOBILIST transaction
In September 2023, Bayfront Infrastructure Management (Bayfront) – a platform investing in infrastructure debt in Asia-Pacific and Middle East regions – priced Bayfront Infrastructure Capital IV (BIC IV), its fourth issuance of infrastructure asset-backed securities (IABS), for US$410.3 million notes issued to finance a loan portfolio of the same amount.
Although it was the fourth issuance out of Bayfront’s BIC platform, BIC IV was a landmark transaction in the programme. Mobilising Institutional Capital Through Listed Product Structures (MOBILIST) – a flagship investment programme of the UK government’s Foreign, Commonwealth & Development Office (FCDO) – committed up to US$20.4 million for investment (equivalent to up to 49%) in BIC IV’s equity tranche.[70]
It was the first time in the programme that a transaction featured a third-party equity investor. MOBILIST eventually received a final allocation of US$5 million in BIC IV’s equity tranche (19.5% of the tranche) due to very strong investor demand for the issuance. As transaction sponsor, Bayfront retained 80.5% of the equity tranche (US$20.6 million), which enables it to comply with the 5% minimum risk retention required, e.g. by the securitisation regulations in the UK, the EU and Japan.[71]
BIC IV offered five classes of notes to investors, of which four are rated by Moody’s Investors Service (from Aaa to A3) and listed on the Singapore Exchange Securities Trading Limited (SGX). Like the two previous BIC issuances, BIC IV also comprised a senior dedicated sustainability tranche, Class A1-SU rated Aaa, issued for US$115 million.
3.10.2 How was the transaction and platform innovative?
Figure 3.11 describes the structure of BIC IV and the main parties and participants in the transaction.
BIC IV’s major innovation was first the commitment by MOBILIST to invest up to US$20.6 million (or 49%) in its equity tranche.[72] Another significant innovation was the creation of unrated and unlisted junior Class D Notes pre-placed in full to funds managed by Apollo Global Management. To permit placement of the Class D
Notes, they have been guaranteed by GuarantCo Ltd (rated A1 by Moody’s and AA by Fitch), a member of the Private Infrastructure Development Group (PIDG).
The Class D Notes issuance allowed the reduction in size of the equity tranche subscribed by Bayfront and MOBILIST. Bayfront’s equity tranche share was then reduced to 5% of the transaction consistent with regulatory retention regulati0ns.
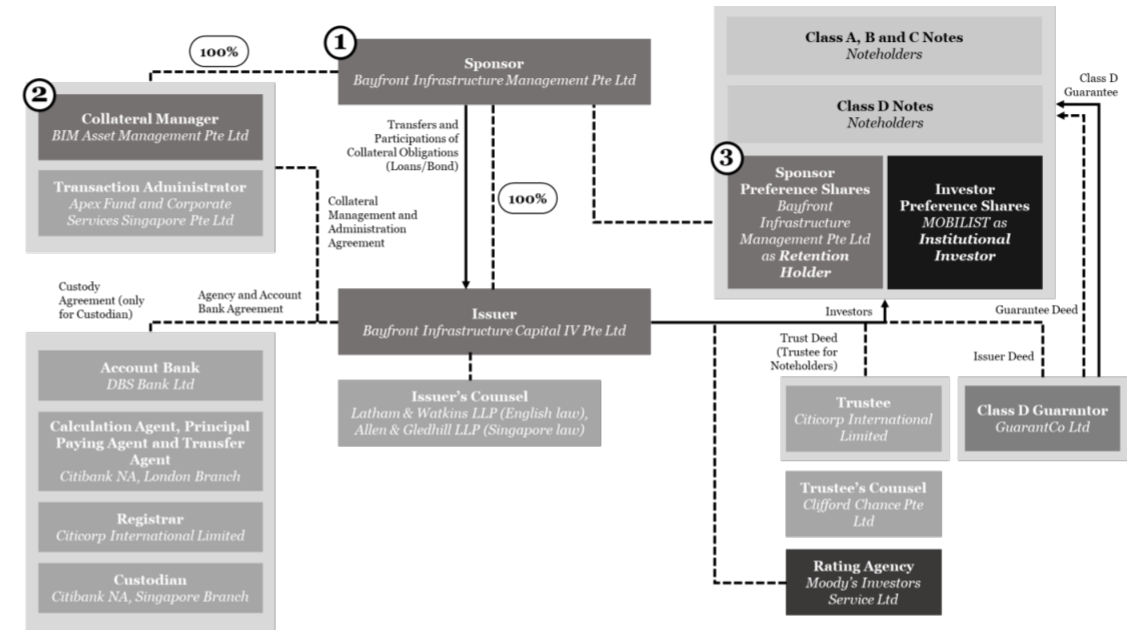
Note: The source is Bayfront Infrastructure (2024).
3.10.3 What demonstration effects did the transaction have?
In June 2024, it remains too close to the transaction’s financial closing to assess comprehensively the demonstration effects of BIC IV.
Bayfront’s infrastructure securitisation platform was initiated in 2018 with the first BIC IABS issuance, after which Bayfront Investment Management (Bayfront) and its infrastructure and project finance warehouse were established. The second IABS issuance, BIC II, took place in 2021, followed by the third issuance, BIC III, in
2022. BIC II introduced the first senior sustainability tranche (Class A1-SU), recognised by the Singapore Exchange (SGX), an innovation replicated in BIC III and BIC IV.
Although labelled IABS, the BIC transactions form part of the broader category of infrastructure and project finance (PF) collateralised loan obligations (CLOs), as seen by rating agencies and investors. True sale PF CLOs were already issued before the 2008 global financial crisis (GFC) and used to finance portfolios of PF loans from Northern America, Europe and emerging countries. PF CLO issuances came to a halt with the GFC and resumed in 2017 in the US. In 2018, BIC I was the first post-GFC true sale PF CLO financing infrastructure loans from Asia-Pacific and the Middle East. Since then, PF CLO issuances have started to pick up in the US. In Asia-Pacific and the Middle East, they have mostly focused mostly on issuances out of the BIC platform with BIC II and III in 2021 and 2022.[73]
Prior to BIC IV, a significant demonstration effect of the BIC platform was the issuance of Bauhinia ILBS 1, labelled infrastructure loan-backed securities (ILBS), by the Hong Kong Mortgage Corporation (HKMC) in May
2023. This can be viewed as a replication in Hong Kong of the BIC II-III transactions. To date, Bauhinia ILBS 1 has been the only known replication of the BIC IABS issuances in Asia-Pacific and the Middle East.
BIC IV already created some key demonstration effects, which were incremental to those of previous BIC issuances, thanks to the participation of recognised investors such as MOBILIST, GuarantCo and the Apollo Global Management funds in the transaction. Their investment in the riskiest tranches of BIC IV acted as a catalyst for the distribution of the rated tranches (Class A to C) to more risk-averse investors. Consequently, BIC IV achieved a very high oversubscription ratio with investors of x1.9 (across Class A to D), particularly in comparison to previous BIC issuances.
The investments by MOBILIST and Apollo Global Management may generate additional demonstration effects if they inspire new investors to invest in unrated subordinated and equity tranches of upcoming IABS or true sale PF CLO issuances. At the date of this report, however, this remains to be observed.
What have been the positive success factors?
• Bayfront and its BIC platform are recognised participants in the IABS market.
• Landmark investment by MOBILIST in the equity tranche of BIC IV (its most junior tranche).
• Issuance of the Class A1-SU sustainability tranche under the Bayfront Sustainable Finance Framework, following sustainability tranches issued in the two previous BICs.
What were the negative success factors?
• The notes issued by BIC IV have an expected 3-year maturity heavily reliant on Bayfront’s access to liquidity in three years (and its guarantee from the Singapore Government).
• Such an IABS issuance also relies considerably on Bayfront’s significant expertise in infrastructure financing in Asia-Pacific and the Middle East.
3.11 Lessons from the Case Studies
We believe that the case studies shed considerable light on what contributes to the success or failure of a given innovative deal in terms of generating subsequent follow-on transactions. This subsection sets out some immediate lessons that one may draw.
Transactions that have overcome clear obstacles, for example, by proposing new legal approaches or persuading rating agencies to develop new methodologies, are likely to be associated with subsequent deals since they will tend to unblock issues previously hampering activity. Of the case studies considered, this is most obviously true of the HBOS structured covered bonds and the Room2Run transaction. Note that this factor alone does not guarantee swift take-up and lesson-learning by other market participants, as is evident in the case of the Room2Run, since other factors, like the incentives of different actors, may slow the adoption of the innovation.
Another important factor is the prominence of the transaction. Private market deals can be influential among market participants, but if the form of the deal spreads information widely, it is much more likely to spur copycat transactions. A highly visible deal was the EIB green bond issue we covered. This was listed in many markets simultaneously and widely publicised by the EIB. On the other hand, the IFC’s MCPP was initially little publicised, and while recent events suggest other DFIs may imitate it, this has taken a very long time.
Even if obstacles are overcome and the deals are widely publicised, the scope for follow-on transactions will likely depend on what one might call deal- or market-feasibility. By market feasibility, we mean the profitability of the transaction to all concerned. Transactions may be subsidised by DFIs, but the volume of deals will always be circumscribed if this is necessary for such deals to work.
By deal feasibility, we mean that relatively simple and familiar techniques are employed so others may replicate the deals. Demonstration effects will be even more powerful if institutions that are not simply direct competitors of the first mover are able to replicate the transaction. The HBOS deal is instructive in this context. In this case, the techniques were familiar to many with experience in securitisation, even if they were being used in a novel manner. Note that banks in other countries drew lessons from the HBOS transaction to the extent that market participants started to implement structured Covered Bonds deals in France and the Netherlands before these countries implemented the legal infrastructure for regulated Covered Bonds to be possible.
4. A Framework for DFIs to Allow for Demonstration Effects
4.1 Introduction
As argued above, public research resources suggest that many DFIs devote very limited effort to quantify demonstration effects, although some efforts to conceptualise such effects have been undertaken. One could expect that the systems for evaluating projects (a stable activity performed on some scale within most DFIs) will be more susceptible to being quantified than innovative transactions.
This section sets out a framework for evaluating demonstration effects in Multilateral Development Bank (MDB) transactions.[74] MDBs evaluate development finance investments in several ways. The evaluations may be performed ex ante as part of the MDB’s decision-making process of whether to engage in the transaction or ex post as it studies the implications of past transactions for its business and analyses their success or failure.
Both ex ante and ex post assessments may comprise one or more of the following activities:
(a) Calculations of risk-adjusted returns.
(b) Assessments of the development impact and ESG status of the investment.
(c) Assessments of the private sector financing mobilised by the transaction.
Here, (a) refers to the type of exercise employed by almost all MDBs that provide financing to Non-Sovereign Obligors (NSOs), namely the computation of Risk Adjusted Returns on Capital (RAROC). The RAROC approach, devised by Bankers’ Trust in the 1970s, is used by almost all commercial banks to calculate the riskadjusted expected return on loan investments. RAROC yields a calculation of the Expected Return net of (i) funding costs, (ii) overheads, (iii) Expected Losses (ELs) attributable to future defaults and (iv) the cost capital. This last cost of capital is computed as the product of the capital consumption of the exposure and a return on equity (or ‘price of risk’), which is assumed to be the same for all exposures.
Regarding (b), development impact and ESG status are assessed by all MDBs using scoring approaches that allow for multiple dimensions of the exposures in question. Mobilisation in (c) is measured by adding up the contribution that the exposure makes to total financing by eliciting investment by private sector organisations. There are two well-established approaches to calculating mobilisation, one developed by the OECD and the other generated by a consortium of prominent MDBs and European DFIs. The latter, which is more relevant for our purposes, distinguishes between Direct Private Mobilisation and Indirect Private Mobilisation. In ex ante evaluations, (b) and (a) are commonly linked in the sense that favourable impact or ESG assessments may lead to a downward adjustment in the hurdle rates obtained from (a).
The objective of this section is to set out how demonstration effects could be allowed for in such transaction assessments.[75] The demonstration effect of a particular transaction involving a particular MDB may be defined as additional development financing that is provided by other institutions because they were influenced to provide this financing by the example of the original transaction.
This definition raises several issues. First, how can causality be established? Second, over what horizon are follow-on transactions to be considered? Third, is the simple involvement of an MDB sufficient to claim a demonstration effect or should the MDB play a central and crucial role in the transaction? Fourth, should demonstration effects be assessed via the contribution to the par value of financing rather than attempting to differentiate between commitments like equity that bear more risk and debt-like financing, which absorbs less risk?
We will address these issues in the context of discussing a possible practical approach to assessing development effects. Only after we have considered how demonstration effects could be evaluated in practice can we return to answering the above questions.
The approach we take to devising such a framework is:
• Consider success factors that could contribute to demonstration effects.
• Group and organise these success factors to generate broad factor categories.
• Devise a decision rule for assigning a given transaction a score reflecting its potential for demonstration effects.
• Evaluate how the implied scorecard performs in evaluations of a set of example transactions.
Note that the focus of this paper is to examine demonstration effects generated by transactions. Private sector risk-bearing of development finance exposures may be encouraged or facilitated by other related policies, such as improving information available to third parties regarding risky investments in Emerging Markets and Developing Economies (EMDEs) or by bearing fixed costs that these parties would otherwise have to bear. Here, we do not discuss the relative effectiveness of demonstration effects operating via transactions with alternative policy steps to improve the information available to investors.
Section 2 discusses success factors and how these may be categorised. Section 3 presents the scorecard. Section 4 presents the transactions we are evaluating.
4.2 Demonstration Effect Success Factors
This section discusses the potential success factors contributing to a strong demonstration effect of a transaction. The success factors are categorised broadly into four criteria:
1. Information Generation
2. Obstacles Overcome
3. Profitability and Impact
4. Deal Feasibility
Here, information is a key success factor for the transaction. If no information were provided to other market participants, how could any follow-on transactions occur? However, obstacles overcome are also likely to be predictive of success since, if there were no impediments to the transaction, there may be other reasons why deals of this kind are infeasible. The feasibility indicators are also likely to be predictive. These are unconnected to information and seek to reflect, in the case of ‘deal feasibility,’ if the innovation is simple enough for others to implement and, in the case of ‘profitability and impact’, whether the transaction is profitable and, hence, will be viable without too much subsidy.[76]
Ex ante, we aim to reflect the four aspects listed above in indicators available when the project has been fully designed, but no commitment has been made by the DFI. In the next section, we will consider how, starting from such indicators, or ‘success factors,’ one can deduce a numerical score of demonstration effects that is predictive of future follow-on transactions.
Once a transaction has been completed and some time has passed, one may observe the number and magnitude of follow-on transactions and the performance ex post, in the form of financial, development impact and ESG outcomes. At this point, an ex post evaluation of transactions may be performed. In this study, we use an ex post assessment of a set of scores to evaluate an ex ante scoring framework for individual transaction demonstration effects.
The ex ante success factors are grouped into the four categories listed above.
1. The sub-indicators of the Information Generation category capture the additional information shared by the originator, either by directly sharing the documents related to the transaction or by signalling the quality of the information through rating agencies and listing on a stock exchange. They are primarily divided into two types of transactions:
(a) Private transactions: these transactions are not listed on a stock exchange, and thus, there is no external constraint to meet the requirements of a stock exchange. In private transactions, we learn about the demonstration effect through the (i) size of the transaction, (ii) number of investors involved, (iii) dissemination of information, (iv) presence of an influential investor, and (v) meeting the requirements set by global Credit Rating Agencies (CRAs).
(b) Public transaction: these transactions have an additional demonstration effect due to the transparency ensured by the stock exchanges that list them. Here, we assess the demonstration effect of a publicly listed transaction by the following factors: (i) listing on a global stock exchange, (ii) size of the underwriting syndicate, and (iii) number of market makers.
2. A transaction which has overcome multiple barriers to provide a framework for future deals increases the ease by which others can implement similar transactions. We organise the obstacles which can be overcome into four categories:
(a) Rating-based: this covers the discussion with the rating agencies to reach a consensus on the methodology involved in rating the transaction. This might either be appending a section to an existing methodology document or lead to a separate methodology document by the rating agencies.
(b) Legal-based: new transactions involving mobilisation for development finance require coalescing between various board members, government ministers, and shareholders of the organisation. Hence, the presence of an established legal contract helps in repeating a similar transaction in the future.
(c) Technical-based: due to the novel nature of a transaction, it might lack the financial pricing or technical approach needed to evaluate it accurately. A clear and concise methodology document would help in explaining the price or appraising the deal.
(d) Accounting-based: this means that the organisation’s treatment is consistent with its accounting policies.
3. The sub-indicators of the profitability and impact category capture the size of the transaction and the economic benefit to the stakeholders involved. The economic benefit is divided into three important aspects of a project. These four sub-indicators are:
(a) Matching risk-return appetite: the profitability of a transaction is a measurable metric for the investors after the transaction and estimated profitability serves as a good indicator of the performance.
(b) Matching development impact appetite: transactions also facilitate increased development lending, a key concern for DFIs. An example is how the stakeholders are interested in understanding how many dollars of development finance are generated for a dollar invested in the transaction.
(c) Matching ESG appetite: the Environmental, Social, and Governance (ESG) factors are strongly considered in transactions aiming to achieve the Sustainable Development Goals (SDGs). It is expected that a transaction which caters to the SDGs would have a strong demonstration effect.
(d) Alignment of interests: this indicator captures the conflict of interest that might arise in the organisation or with other investors involved in executing the transaction.
4. The sub-indicators of the Deal Feasibility category capture the ability of other organisations to reproduce similar types of transactions, which broadly depends on the ease of executing the transaction, the ability to reproduce the transaction, and the size of the transaction.
(a) Simplicity: a transaction which is simple to implement and understand has a positive impact on its stakeholders.
(b) Reproducibility: a transaction which can be reproduced by other organisations without requiring expertise in the deal might increase the number of similar types of deals.
(c) Size: the size of the transaction is the par-value amount of the gross amount involved in the transaction.
One may think of obstacles overcome either as resulting from an investment to overcome fixed costs or as an investment to create new information. The distinction between the two may appear ambiguous. Is persuading the rating agencies to change a methodology or the regulators to institute a new rule the creation of information or overcoming of obstacles through bearing a fixed cost?
The distinction is clear, however, if one formulates a model of innovation under uncertainty. A substantial body of finance theory employs real options techniques to investigate the timing of investment. In such models, investment timing is differently affected by (i) the level of fixed costs, (ii) the degree of payoff risk, (iii) whether the investment reduces the uncertainty associated with payoffs either for the inventor or for others, (iv) whether an inventor can gain a competitive advantage as a first mover because of market, technological or regulatory, or patent-related mechanisms. An early contribution to this literature is Lambrecht and Perraudin (1999).
Translating such considerations to our context, it is clearly important whether the benefits of bearing the fixed costs or creating the new information may be retained as private by the innovator or whether the information/innovation is available to all. DFIs and private sector ‘for profit’ innovators are likely to have very different objectives and incentives in this regard. Private sector innovators wish to retain competitive advantages with respect to the innovation even to the extent of enjoying monopoly power through, for example, copyright or patent protection[77]. In contrast, DFIs have a broader mandate to take steps that encourage development in general. In practice, the difference may be more nuanced in that a financial firm that initiates a new market with an innovative transaction will typically wish to see other organisations engage in similar deals to achieve market ‘take off’. Only when liquidity has reached acceptable levels will a new financial market be viable and sustainable.
The real options literature shows that relatively small, fixed costs may substantially delay innovation since, when subsequent benefits/profits are uncertain, innovators maximise value by delaying well beyond the point at which the innovation is marginally positive Net Present Value.
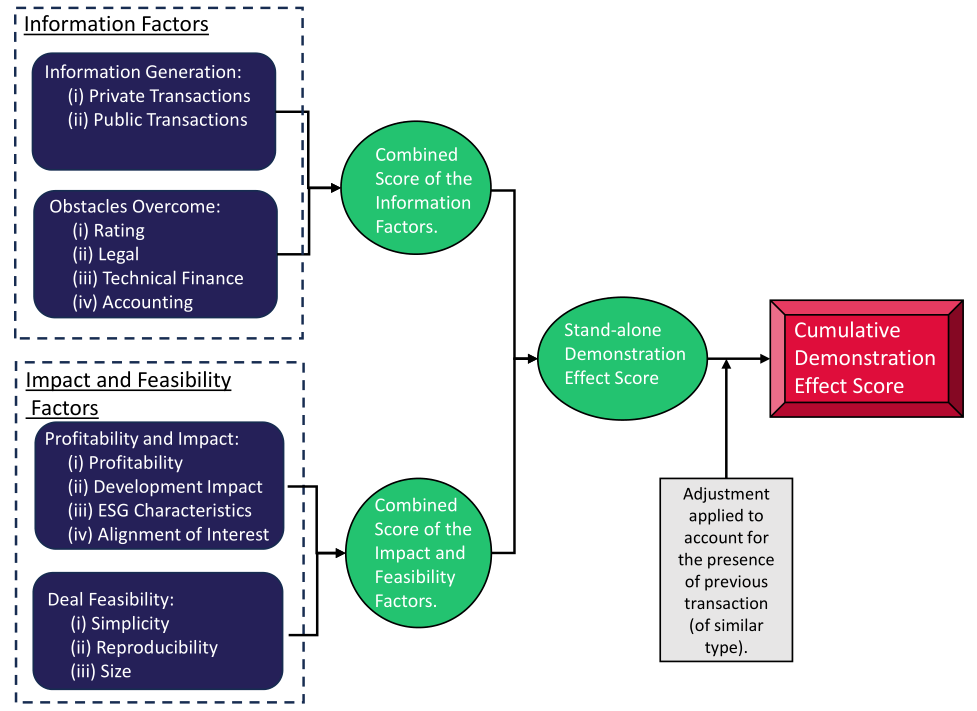
4.3 An Ex Ante Demonstration Effect Scorecard
In this section we provide the framework to evaluate the demonstration effect of a transaction, taking into account the success factors discussed in Section 2. The four primary determinants are:
1. Information Generation,
2. Obstacles Overcome,
3. Profitability and Impact,
4. Deal Feasibility.
The four key indicators are further sub-divided into a sub-indicator to determine the key category score. These sub-indicators are shown in Table 4.1. Each score is in the range of zero to seven (this could be compared to the eight coarse ratings of AAA, AA, A, BBB, BB, B, CCC and CC), where seven represents the highest demonstration effect and vice versa.[78] Only the deal feasibility score is between zero and six.
We believe that information generated and obstacles overcome are key factors for a transaction to have a potentially high demonstration effect. Additionally, investors consider the expected returns and impact of a transaction when deciding to invest, making them equally important to the other key factors. Thus, the first three of the four primary factors have equal weight. While deal feasibility is important as it scores whether a transaction is easily replicable or not, on relative terms it is less important than the others.
1 Weak 0 Very Weak
The two feasibility indicators (1) and (2) are aggregated according to Table A1.1 to yield an ‘Information’ score. The two information indicators (3) and (4) are aggregated according to Table A1.2 to yield a ‘Feasibility’ score. This is obtained by calculating the sum of the two category scores and dividing the outcome by two. The resulting ‘Information’ score is merged with the ‘Feasibility’ score to obtain the final score for the demonstration effect, according to Table A1.3. The final score ranges from zero to five, mapped in Table 4.2.
| Category | Aggregate | Final | ||||||
|---|---|---|---|---|---|---|---|---|
| Key Indicator | Sub- indicator | Range | Scores | |||||
| Scores | Scores | Score | ||||||
| Number of investors | 0 | or | 0.5 | 0.5 | ||||
| Size of issue | 0 | or | 0.5 | 0.5 | ||||
| Other information generation | 0 | or | 0.5 | 0.5 | ||||
| Road shows | 0 | or | 0.5 | 0.5 | ||||
| Media coverage | 0 | or | 0.5 | 0.5 | ||||
| Information | ||||||||
| Involvement of leading institutions | 0 | or | 0.5 | 0.5 | 7 | |||
| Generation | Publication of transaction description | 0 | or | 0.5 | 0.5 | |||
| Rated by a Global CRA | 0 | or | 0.5 | 0.5 | ||||
| 7 | ||||||||
| If public - | ||||||||
| - Market Listings (Core or National) | 0 | or | 1 | 1 | ||||
| - Size of underwriting syndicate | 0 | or | 1 | 1 | ||||
| - Number of market makers | 0 | or | 1 | 1 | 5 | |||
| Rating | 0 | to | 2 | 2 | ||||
| Obstacles | Legal | 0 | to | 2 | 2 | |||
| 7 | ||||||||
| Overcome | Technical finance | 0 | to | 2 | 2 | |||
| Accounting | 0 | or | 1 | 1 | ||||
| Expected profitability | 0 | to | 3 | 3 | ||||
| Profitability | Expected development impact | 0 | or | 1 | 1 | 7 | ||
| and Impact | Expected ESG characteristics | 0 | or | 1 | 1 | |||
| Alignment of interests | 0 | to | 2 | 2 | 7 | |||
| Simplicity | 0 | to | 2 | 2 | ||||
| Deal | 6 | |||||||
| Reproducibility | 0 | to | 2 | 2 | ||||
| Feasibility | ||||||||
| Size | 0 | to | 2 | 2 |
Note: The scores in the column ‘Category Scores’ are example scores for a particular transaction, which leads to the best outcome for every indicator. ‘Aggregate Scores’ is the combined score of the feasibility indicators according to Table A1.1 and information according to Table A1.2. The final score indicates the combined score of the ‘Aggregated Scores’ according to Table A1.3.
| 5 Extremely | Strong |
|---|---|
| 4 | Very Strong |
| 3 | Strong |
| 2 | Moderate |
4.4 Ex Post Evaluation of Demonstration Effects
Demonstration effects may be measured in terms of financing volume or in ways that reflect other contributions, such as the risk capacity provided or the sustainability content. We favour a relatively simple approach that emphasises simple financing volume since (i) this is in line with the current MDB and OECD approaches to measuring mobilisation and (ii) it reduces the challenge of interpreting what is already somewhat complex.
A suitable methodology would also have to handle the following issues:
1. The time window in which subsequent deals may be considered. We understand that IFC has developed an approach to calculating such follow-on transaction volumes based on activity during a 3-year time window starting with the transaction date.
2. How causality is to be assessed. In our view, this must rely on judgment by an assessor who would survey the attitudes of those involved in follow-on transactions to see if they identify the first-mover deal as contributing to their subsequent activities. In this study, we did not have the resources to survey those involved in transactions that ‘followed-up’ on our case-study deals. This seems perfectly possible, however, for a DFI wishing to assess its own past deals and might be implemented for our case study transactions through subsequent research.
We understand that some MDBs are exploring approaches to assessing demonstration effects ex post. Twelve years ago, Spratt and Collins (2012) concluded that “Despite the priority given to the importance of creating demonstration effects, there is little evidence to support it in practice. In part, this is because DFIs have only begun to focus on measurement relatively recently. More fundamentally, perhaps, it reflects the difficulty of proving causality.” As noted above, some MDBs are, as we understand it, currently studying this issue, and we hope that our study will increase the visibility of this important topic.
4.5 Ex Ante Scoring for Example Deals
To investigate how the scorecard described in the last sub-section performs, we apply it to the innovative transactions in our sample. The results are displayed in Table 4.3. Detailed explanations of how we arrived at the scores are provided in Appendix 2.
Overall, we find that the transactions analysed using the scorecard result in global scores in the range of 2 to 4, compared to a feasible range of 0 to 5. Since the scorecard consists of weighted sums of indicators without overrides that can substantially affect global results, concentration around the middle range is to be expected. We did not obtain any scores of 0 or 1, which is consistent with the fact that we studied transactions which could all be expected, ex ante, to generate positive demonstration effects.
The deals that score 4 in our methodology all generate public listings and generally involve leading institutions and large volumes. The deals that scored highest for Deal Feasibility are HBOS Covered Bonds, EIB Climate Awareness Bonds, Bayfront Infrastructure Capital – IV, and AfDB Room2Run. All these transactions employed standard deal approaches in novel ways.
Profitability and impact register the likelihood that other counterparties will find the transaction attractive and so wish to pursue similar financing approaches. In this case, HBOS Covered Bonds, EIB Climate Awareness Bonds, IFC’s MCPP, Bayfront and Room2Run score highly. In Obstacles Overcome, HBOS, Trade MAPS and Bayfront score highly. In ‘Information ’Created, HBOS, EIB Climate Awareness Bonds, Trade MAPS and Bayfront score well.
It is noticeable that transactions that are strong in information created perform well since quite a large weight is attributed to this aspect of the scoring algorithm. Thus, Trade MAPS scores 4 globally, even though in other aspects, it was relatively weak. Even though ex post this deal yielded poor demonstration outcomes, ex ante the market expected a strong performance. On the plus side, the deal overcame strong obstacles but had little alignment of interests (because of the involvement of two banks with different objectives) and was highly complex and, therefore, hard to replicate.
The fact that the scorecard is significantly influenced by information created also explains the score for IFC’s MCPP, although in this case, the score is low. This deal was little publicised and largely private in its early years. Note that our evaluation is implemented on an ex ante basis from the point of view of the very first transaction in the sequence. Again, ex post this deal was unsuccessful from a demonstration effect point of view since awareness only grew very slowly and no other institutions have followed the IFC’s example yet.
One question is which function within a DFI might employ the scoring approach described in this section. The natural location for such evaluation is an impact measurement unit. However, the skills necessary to conduct such evaluations may lie more obviously within operations or finance units. Perhaps a joint activity could be envisaged, led by the impact assessment function but drawing on other departments’ expertise.
| Local | ||||||||||||||
|---|---|---|---|---|---|---|---|---|---|---|---|---|---|---|
| Infrastructure Issue | ||||||||||||||
| Strcutured | Microfinance Bonds | Bonds | Debt | Debt | ||||||||||
| MAPS | Certified | IV | ||||||||||||
| Securitisation | MCPP | - | ||||||||||||
| Awareness | Seychelles | Conversion Room2Run | Guidance | |||||||||||
| HBOS | Covered BRAC | Climate | IFC's | Trade | Green | Currency Bayfront | Capital | |||||||
| Categories | Sub-indicator | |||||||||||||
| Number of investors | 0.5 | 0.5 | 0.5 | 0 | 0.5 | 0.5 | 0.5 | 0 | 0.5 | 0 | to | 0.5 | ||
| Size of issue | 0.5 | 0 | 0.5 | 0.5 | 0.5 | 0 | 0.5 | 0 | 0.5 | 0 | or | 0.5 | ||
| Other information generation | 0.5 | 0.5 | 0.5 | 0.5 | 0.5 | 0.5 | 0.5 | 0.5 | 0.5 | 0 | or | 0.5 | ||
| Roadshows | 0.5 | 0 | 0.5 | 0 | 0.5 | 0.5 | 0.5 | 0 | 0.5 | 0 | or | 0.5 | ||
| Media coverage | 0.5 | 0.5 | 0.5 | 0 | 0.5 | 0.5 | 0.5 | 0.5 | 0.5 | 0 | or | 0.5 | ||
| Leading institutions involved | 0.5 | 0.5 | 0.5 | 0.5 | 0.5 | 0 | 0.5 | 0 | 0.5 | 0 | or | 0.5 | ||
| Information | ||||||||||||||
| Generation | Publication of deal description | 0.5 | 0.5 | 0 | 0 | 0.5 | 0.5 | 0.5 | 0.5 | 0.5 | 0 | or | 0.5 | |
| Rated by a Global CRA | 0.5 | 0 | 0.5 | 0 | 0.5 | 0 | 0.5 | 0 | 0.5 | 0 | or | 0.5 | ||
| If public - | ||||||||||||||
| - Market Listings | 1 | 0 | 1 | 0 | 1 | 0 | 0 | 0 | 1 | 0 | or 1 | |||
| - Size of underwriting syndicate | 1 | 0 | 1 | 0 | 1 | 0 | 0 | 0 | 1 | 0 | or 1 | |||
| - Number of market makers | 1 | 0 | 1 | 0 | 0 | 0 | 0 | 0 | 0 | 0 | or 1 | |||
| Category score | 7 | 2.5 | 6.5 | 1.5 | 6 | 2.5 | 4 | 1.5 | 6 | 0 | to 7 | |||
| Rating | 2 | 2 | 0 | 0 | 2 | 0 | 2 | 0 | 2 | 0 | to 2 | |||
| Legal | 2 | 1 | 1 | 1 | 2 | 2 | 0 | 1 | 2 | 0 | to 2 | |||
| Obstacles | ||||||||||||||
| Overcome | Technical finance | 1 | 1 | 1 | 2 | 2 | 2 | 2 | 1 | 2 | 0 | to 2 | ||
| Accounting | 0 | 0 | 0 | 0 | 1 | 0 | 0 | 0 | 0 | 0 | or 1 | |||
| Category score | 5 | 4 | 2 | 3 | 7 | 4 | 4 | 2 | 6 | 0 | to 7 | |||
| Profitability | 3 | 1 | 3 | 2 | 1 | 2 | 3 | 1 | 2 | 0 | to 3 | |||
| Favourable development impact | 0 | 1 | 1 | 1 | 0 | 1 | 1 | 1 | 1 | 0 | or 1 | |||
| Profitability | ||||||||||||||
| and Impact | Favourable ESG characteristics | 0 | 0 | 1 | 0 | 0 | 1 | 1 | 1 | 1 | 0 | or 1 | ||
| Alignment of interests | 2 | 1 | 2 | 2 | 1 | 1 | 2 | 1 | 2 | 0 | to 2 | |||
| Category score | 5 | 3 | 7 | 5 | 2 | 5 | 7 | 4 | 6 | 0 | to 7 | |||
| Simplicity | 1 | 1 | 2 | 2 | 0 | 1 | 1 | 1 | 1 | 0 | to 2 | |||
| Deal | Reproducibility | 2 | 2 | 2 | 1 | 0 | 1 | 2 | 1 | 1 | 0 | to 2 | ||
| Feasibility | Size | 2 | 0 | 1 | 2 | 2 | 0 | 2 | 0 | 1 | 0 | to 2 | ||
| Category score | 5 | 3 | 5 | 5 | 2 | 2 | 5 | 2 | 3 | 0 | to 6 | |||
| FINAL SCORE | 4 | 3 | 4 | 3 | 3 | 3 | 4 | 2 | 4 | 0 | to 5 |
5. Demonstration Effect Issues
Here, we return to the questions posed in the Introduction.
Question 1: To what extent and how have demonstration effects been conceptualised, measured, monitored, and evaluated by market participants and development finance investors?
From our interviews with impact specialists in these institutions, we have learnt that some DFIs have made efforts to assess demonstration effects ex post. Others have included demonstration effects in ex ante evaluations of transactions. However, ex post evaluations have typically been intermittent, looking across a set of deals and transactions rather than systematic, while ex ante appears to receive relatively little weight in evaluations. We understand that several DFIs are currently reviewing their approaches, and greater emphasis on demonstration effects and more systematic approaches may result.
Question 2: What data and information generated by pioneering transactions is most salient to market participants, including both issuers and investors? How is this information transmitted to and used by different types of investors, and which investor categories are likely to be most responsive? What determines the relevance of a given transaction to different groups of issuers and investors? Are ‘positive’ and ‘negative’ demonstration effects equally influential over behaviour?
For any private sector investor, clearly, the key indicator is performance, i.e., realised profitability. An investment banker involved in the Trade MAPS transaction explained that the two banks involved had very different perspectives and objectives and that the deal was not so profitable for one of them. The implication is that the original participants did not implement a follow-on deal. The legal complexity of implementing a multibank transaction across several national jurisdictions discouraged other banks from executing similar trades.
Given the confidentiality that typically prevails in transactions involving private sector counterparties, the profits obtained by deal participants are generally opaque. When instruments are listed, the lack of transparency may be mitigated. The scale of transactions is generally easier for outsiders to observe and less subject to confidentiality. A large deal size may be seen as correlated with participants' confidence that a transaction is profitable and, hence, may be influential in persuading private market participants to attempt copycat deals.
Investors will be influenced by the prospects of either the profitability of the immediate transactions they may participate in or of repeat transactions and future volumes and increasing profitability over time (and possibly economies of scale). When innovative transactions require significant time investment from investors to participate in them, the likelihood of future replications and additional volumes may become an important consideration, which, if not very likely, would need to be compensated for by higher initial profitability for investors. The same kind of considerations apply in the opposite way for issuers in terms of immediate or future transaction benefits (e.g. funding cost savings or diversification of financing sources).
Public investors will also be guided by profitability in the sense of low levels of required subsidisation and by impact in terms of ESG or SDG characteristics. Some private investors are also very concerned with these nonfinancial aspects of performance or impact. An investor involved in Room2Run emphasised this as an attractive aspect to them. A participant in the Seychelles Debt conversion also underlined how important strong, welldocumented and monitored environmental impact was in encouraging them and others to take part.
How and over what timescale information is conveyed to other market participants varies in that when some transactions are performed, a greater or smaller burst of information is conveyed to the market. If the issue is listed or there are follow-up deals enacted by the original participants, this reinforces the impact of the initial information. This process is particularly important to demonstrate to investors and issuers that there may be a developing market or ‘asset class’ alongside additional information created by the ongoing operational and financial performance of the initial transaction(s).
Question 3: Where it is present, to what extent does the visibility of development finance affect behaviour change among market participants and among other development finance actors? How do different structures and strategies used by development finance actors compare to one another in transmitting risk and return information, with a particular focus on
• Public and private markets,
• Concessional and non-concessional financing, and
• How can exits from pioneering assets be best managed to strengthen, and at a minimum, avoid undermining demonstration effects?
Visibility is important but the right incentives must also be there for an innovation to generate traction in the form of follow-on deals. The Room2Run deal, despite being a private market transaction, was quite visible to market participants but has been slow to generate follow-on transactions. The innovations in the transaction, most notably the change in its methodology that Standard & Poor’s was persuaded to adopt, were a sine qua non for a transaction IDB Invest will reportedly close in the summer of 2024. But this is 6 years after the Room2Run deal exposited in Section 3. The delay, as we understand it, partly reflects the situation of AfDB (its pipeline of suitable loans) and the fact that gains from such trades are most interesting when they relax the constraint of the Standard & Poor’s rating. Many MDBs are constrained instead by other rating agencies, such as Moody’s and Fitch, for which such trades are less helpful.
The EIB’s climate awareness bond issue is perhaps the most visible deal among those we examined. The Bank took great pains to boost awareness of the transaction. The considerable volume of subsequent trades was certainly increased by this visibility, but the trade undoubtedly fitted well with the emerging concerns around climate, which created strong investor interest in a possible new asset class.
The distinction in transparency between public and private markets is more complex than may appear. In some cases, like Room2Run, efforts were made by AfDB to publicise the trade and many market participants were aware of it. Some other private market deals like the MCPP were initially, as far as we can tell, little publicised. If trades are repeated, the informational impact tends to be greater, even if they are private. The visibility of the Bayfront infrastructure securitisations and the debt conversion transactions of The Nature Conservancy have benefitted from the repeated transactions.
One may expect that, in preparing innovative transactions, MDB and DFI dealmakers generally engage with potential investors early in the process. This engagement is crucial to designing the transaction, ensuring it meets the investors’ requirements, and generating the necessary demand for its success. After transactions are launched, sponsors such as AfDB, Bayfront and The Nature Conservancy actively spread the word within the development community and among other potentially interested investors to help the development of follow-on deals. It may be worth considering whether such engagement with potential follow-on investors could be developed earlier on in crafting the initial transaction in anticipation of the requirements of the broader investor community. We suspect DFIs may already partly do this, and it may be an approach worth fostering when aiming to be new-market creators with innovative transactions.
Public deals undoubtedly create more information not just from roadshows, prospectuses, etc., but also from the ex post performance, which mitigates opaqueness in the profitability of the trade. There may be wider informational gains when the transaction involves a new asset class in that the market may be able to infer the risk-return nature of that asset class from the ex post performance of the publicly listed assets. It is reported that the pool performance of the loans securitised in the Room2Run transaction has been very good, which means that the profits made by investors in this deal have been excellent. But this is not directly observable.
Again, when transactions are repeated and remain visible and susceptible to monitoring because they are publicly listed, the information just described is reinforced.
As regards the concessionality of the financing, deals that have been achieved without concessionality are more powerful in stimulating subsequent purely private-sector activity. Nevertheless, deals involving concessionality may lead to strong demonstration effects:
• If the development or environmental impact is so great that concessionality may be available in future (since DFIs will be keen to generate further beneficial impact).
• If the concessionality is explicitly linked to covering the fixed or first-mover costs faced by market innovators.
Few DFIs have well-developed policies around exits except in the simplest kind of fund investments. One senior MDB manager with whom we spoke emphasised the need for these institutions to develop a more asset manager-like approach in which assets are (i) originated and then, as their risk characteristics improve, (ii) shifted to private sector institutions with lower risk appetite and more limited emerging market expertise. But in our experience, this view is uncommon among senior MDB managers.
Question 4: Who are the actors to capture such demonstration effects in public and private markets? How have market participants and development finance actors conceptualised and captured additionality through demonstration, including when investing on pari passu terms? What metrics and methods should be used in the future to capture additionality in terms of
• Direct mobilisation through co-investment,
• Mobilisation through demonstration of follow-on transactions that otherwise would not have happened, and mobilisation through triggering broader, positive market dynamics?
DFIs have become extremely concerned with mobilisation volumes as a measure of their success in bringing private sector financing and risk capacity to bear in plugging development finance shortfalls. Since the requirement here is to report mobilisation to third parties (shareholders in particular), the tendency is to adopt transparent, simple and documentable measures of mobilisation. Natural distinctions, such as how much financing absorbs risk (equity is very different from debt in this regard), are not attempted and simple dollar financing volume is examined.[79]
We believe that more nuanced approaches to measuring mobilisation are important and that these are more feasible and valuable within individual DFIs when these institutions are making decisions about which transactions to prioritise. This is why we have emphasised in this study the possible development of judgmentally-based ex ante scorecards for demonstration effects.
As for external reporting of mobilisation information, just as Publish What You Fund is pushing for greater granularity of mobilisation data within first-round-financing mobilisation as currently exemplified by the MDB and OECD approaches, we view it as feasible to develop estimates of second-round mobilisation in the form of volumes generated by demonstration effects. The methodology for this cannot be as simple as the existing MDB or OECD approaches since some judgmental input is undoubtedly necessary. There may be a role in this for an external entity like the OECD, which might review and report on second-round mobilisation based on data prepared by MDBs and their own dedicated unit.
6. Conclusion
This report analyses demonstration effects in innovative development finance transactions involving Development Finance Institutions (DFIs). Transactions by DFIs have demonstration effects if they serve to overcome informational or other constraints that block investment by private sector market participants, allowing the latter to engage in their own follow-on deals even if the DFI plays no further role.
DFIs are generally very concerned with the degree to which their actions serve to mobilise private-sector development financing. The standard approach to measuring such mobilisation restricts its attention to private sector financing that occurs as part of transactions in which DFIs are involved. Demonstration effects may be thought of as ‘second-round’ mobilisation, which, in principle, could make powerful contributions to development and is certainly important to measure and understand.
In this paper, we examine in detail a set of innovative deals to analyse demonstration effects. In each case, the deal attempted to introduce new ways of financing development and, hence, may or may not have resulted in demonstration effects. In our sample of deals, we also include some innovative transactions involving only private sector participants and aimed at advanced economy assets and markets. These provide some interesting perspectives on the development finance deals on which we are primarily focused.
To illustrate to DFIs how they might approach the ex ante assessment of demonstration effects, we formulate a scorecard that combines success factors suggested by the transactions in our sample. We then use this scorecard to evaluate the transactions as though we were doing this when they were first proposed. Although judgmental in nature, this exercise provides insights and obliges us to confront issues such as the relative importance of different success factors.
The success factors we identify are:
1. Information Generation
2. Obstacles Overcome
3. Profitability and Impact
4. Deal Feasibility
The first two emphasise information barriers that the deals have contributed to breaking down, either by shedding light on a new asset class or by overcoming obstacles that widen the possibilities that market participants perceive. The latter two categories emphasise ex ante perceptions of performance (both financial in development and environmental impact) and the straightforwardness with which the deal can be replicated.
We emphasise ex ante assessments of demonstration effects in this study in part because we believe the way DFIs evaluate prospective deals is the most interesting aspect of mobilisation analysis. We argue that unlike reporting of mobilisation to shareholders or public audiences, ex ante assessments within a DFI are less subject to the requirements that they must be simple and based on undisputable data. Just as credit analysts within an MDB assess the likelihood of repayment through a mixture of unambiguous numerical indicators and the analyst’s own judgmental assessments, ex ante scoring of demonstration effects can similarly blend hard data with expert views.
The focus of our study is predicting demonstration effects. One may expect that demonstration effects will be greater if the market and economic context are favourable to the innovations that they introduce. In proposing an ex ante scoring approach, we include indicators such as expected profitability and impact that may reflect positive assessments of the context of the deal. An alternative focus to ours might be to examine the financial additionality of the MDB in which case one might wish to ‘strip out’ such aspects as favourable context. In this case, the exercise would differ from ours. To reiterate, we aim to forecast the informational additionality resulting in an increased volume of financing achieved through indirect mobilisation.
We believe that there is scope for ex post assessment and reporting on demonstration effects, but the latter are complex to measure directly, and some judgmental elements (of the kind we include in our scorecard) are hard to avoid. For this reason, it may be that an organisation external to DFIs, such as the OECD, should play a role in mitigating the governance issue that would arise from DFIs giving judgmentally-based assessments of their own impact.
The ex ante scoring approach for demonstration effects described here is illustrative although we believe implementing it within a DFI would not require the development of substantial additional elements. Probably, a DFI would wish to constrain the judgments made by the impact assessment staff involved by identifying specific indicators for each of the judgmental categories. One should note, however, that the complexity of achieving this is considerable. For example, as regards profitability, a DFI may accept concessionality in its own contribution if there is substantial developmental or environmental impact or if the concession serves to cover a fixed cost that otherwise is blocking market development. These various considerations should be combined in reaching an overall assessment of this category.
DFIs have reflected demonstration effects in ex ante and ex post evaluations of development finance transactions. The public domain literature on these issues is at an early stage, even though the notion of demonstration effects has formed part of the justificatory rhetoric of DFIs for some time. We find the most interesting aspect of this topic to be the possibility that through a better understanding of how new markets can be opened by innovative deals, DFIs seek to broaden and deepen their mobilisation impact. In internal DFI decision-making, the focus on demonstration effects will be boosted if ex ante scoring approaches are adopted that privilege market-opening deals. Our study seeks to point out some ways in which this could be achieved.
As suggestions for future research, we would highlight, first, the need for further qualitative and quantitative analysis of transactions and the degree to which they open new markets. Deeper consideration of the ex post quantification of demonstration effects would also be valuable. Second, we believe that a survey of investors either (i) involved in innovative transactions or (ii) operating in related markets but who did not participate in the original deal, could shed valuable light on demonstration effects.
References
Arvanitis, Yannis, Marco Stampini and Desiré Vencatachellum (2015) “Balancing development returns and credit risks: project appraisal in a multilateral development bank,” Impact Assessment and Project Appraisal, 33.3, 195-206, May.
Asset-Backed Alert (2014) “Trade-Finance Sequel On the Way,” Issue 21 March 2014, page 4.
Barry, Frank, Holger Görg and Eric Strobl (2003) “Foreign Direct Investment, Agglomerations, and Demonstration Effects: An Empirical Investigation,” Review of world economics, 139, 583-600.
Bayfront Infrastructure (2023a) “Bayfront prices US$410.3 million infrastructure asset-backed securities,” press release, September, available at: https://www.bayfront.sg/bic4.
Bayfront Infrastructure (2023b) “Bayfront Infrastructure Capital IV Pte. Ltd. – Information Memorandum,” September, available at: https://www.bayfront.sg/bic4.
Bayfront Infrastructure (2024) “Our Platforms – Bayfront Infrastructure Capital IV,” on Bayfront website, May, available at: https://www.bayfront.sg/bic4.
BBC Future (2020) “The deal that saved Seychelles’ troubled waters,” August, available at: https://www.bbc.com/future/article/20200803-the-deal-that-saved-seychelles-troubled-waters.
Benteux, Gregory, Christine Van Gallebaert, Dirk Bliesener, Hannes Schneider, Henri Wagner, Paul Péporté, Arjan H. Scheltema, Colin Mercer, and Richard Black (2009) “Regulated covered bonds: a comparative review,” Capital Markets Law Journal, Volume 4, Issue 3, July, pages 341-382, available at: https://doi.org/10.1093/cmlj/kmp015.
Broccolini, Chiara, Giulia Lotti, Alessandro Maffioli, Andrea F. Presbitero and Rodolfo Stucchi (2019) “Mobilization Effects of Multilateral Development Banks,” International Monetary Fund, No. 2019/028, February.
Buiter, Willem, Steven Fries (2001) “What Should the Multilateral Development Banks Do?” London: European Bank for Reconstruction and Development, Annual World Bank Conference on Development Economics, June.
Carter, Paddy (2021) “The Economics of Development Finance: Practical Thinking on Investing for Development,” CDC Group Impact Study, 24, November.
Castalia Strategic Advisors (2011) “Evaluation of the Demonstration Effect of IFC’s Involvement in Infrastructure in Africa, ” available at: https://cica.net/wp-content/uploads/2015/06/IFC-Africa-Evaluation- Final-Report.pdf
Citigroup (2011) “ING and Santander Partner with Citi to Join the Trade MAPS Program,” Business Wire, September, available at: https://www.businesswire.com/news/home/20110920005536/en/ING-and- Santander-Partner-with-Citi-to-Join-the-Trade-MAPS-Program.
Citigroup, Morgan Stanley and Santander (Trade MAPS) (2013) “Trade MAPS 1 Limited – $1,000,000,000 Floating Rate Notes, Series 2013-1 – Offering Memorandum,” December, available at: https://ise-prodnr-euwest-1-data-integration.s3-eu-west-1.amazonaws.com/legacy/Prospectus+-+Standalone_3df552a6-8787-4599- 864b-cee5aec5431a.pdf.
Climate Bonds Initiative (2024) “Sustainable Debt – Global State of the Market Report 2023,” May, available at: https://www.climatebonds.net/resources/reports/global-state-market-report-2023.
Clist, Angela and Nicole Rhodes (2006) “Covered bonds: in the spotlight,” Practical Law, April, available at: https://uk.practicallaw.thomsonreuters.com/9-202-3076?transitionType=Default&contextData=(sc.Default).
Commonwealth Blue Charter, The (2020) “Case Study: Innovative Financing – Debt for Conservation Swap, Seychelles’ Conservation and Climate Adaptation Trust and the Blue Bonds Plan, Seychelles,” November, available at: https://thecommonwealth.org/case-study/case-study-innovative-financing-debt-conservationswap-seychelles-conservation-and.
Consultative Group to Assist the Poor (CGAP) (2013) “A Microcredit Crisis Averted: The Case of Bangladesh,” Focus Note, July, available at: https://www.cgap.org/research/publication/microcredit-crisis-averted-case-ofbangladesh.
Cox, Donald and Oded Stark (1994) “Intergenerational transfers and the demonstration effect,” Working Papers in Economics, 304.
Crosby, James (2008) “Mortgage finance: final report and recommendations,” HM Treasury, November, available at: https://webarchive.nationalarchives.gov.uk/ukgwa/20091109123630/http://www.hmtreasury.gov.uk/fin_mort_crosby.htm.
European Covered Bond Council (ECBC) (2023) “ECBC: European Covered Bond Fact Book 2023,” September, available at: https://hypo.org/ecbc/publications/fact-book/
European Investment Bank (EIB) (2007) “EPOS II - The "Climate Awareness Bond" EIB promotes climate protection via pan-EU public offering,” investor relations news, May, available at: https://www.eib.org/en/investor-relations/press/all/2007-042-epos-ii-obligation-sensible-au-climat-la-beioeuvre-a-la-protection-du-climat-par-le-biais-de-son-emission-a-l-echelle-de-l-ue.
European Investment Bank (EIB) (2021) “Operations Evaluation – Evaluation of the EIB’s Climate Awareness Bonds,” April, available at: https://www.eib.org/en/publications/evaluation-of-the-eibs-climate-awarenessbonds.htm.
Falduto, Chiara, Raphael Jachnik, and Jolien Noels (2024), “The New Collective Quantified Goal on climate finance”, OECD/IEA Climate Change Expert Group Papers, May, available at: https://www.oecdilibrary.org/environment/the-new-collective-quantified-goal-on-climate-finance_7b28309b-en.
Fang, Sheng, Dean Xu, Lixin Colin Xu and Heba Shams (2023) “Does FDI have a social demonstration effect in developing economies? Evidence based on the presence of women-led local firms,” Journal of International Business Studies, 1-19, March.
FAST-Infra (2021) “Finance to Accelerate the Sustainable Transition: Infrastructure – FAST Infra Project Deliverables Progress Meeting #1,” February, available at: https://www.climatepolicyinitiative.org/wpcontent/uploads/2020/05/FAST-Infra-All-WG-Project-Deliverables-Status-Update-Mtg-Feb-2021.pdf.
Fitch Ratings (2005) “Masters of the House –A Review of UK RMBS Master Trusts,” Special Report, June, Fitch Ratings, London, United Kingdom.
Fitch Ratings (2023) “Supranationals Rating Criteria: Discussion Paper,” December, available at: https://www.fitchratings.com/research/sovereigns/supranationals-rating-criteria-discussion-paper-12-12- 2023.
Fitch Ratings (2024) “Exposure Draft: Supranationals Rating Criteria,” Master Criteria, July, available at: https://www.fitchratings.com/research/sovereigns/fitch-ratings-publishes-supranationals-rating-criteriaexposure-draft-02-07-2024.
G20 (2015) “Multilateral Development Banks Action Plan to Optimize Balance Sheets,” available at: http://www.g20.utoronto.ca/2015/Multilateral-Development-Banks-Action-Plan-to-Optimize- BalanceSheets.pdf
G20 Independent Expert Group (“G20 IEG”) (2023a) “Strengthening Multilateral Development Banks – The Triple Agenda (Volume 1),” ICRIER, June, available at: https://icrier.org/publications/the-triple-agenda/.
G20 Independent Expert Group (“G20 IEG”) (2023b) “Strengthening Multilateral Development Banks – The Triple Agenda: A Roadmap for Better, Bolder and Bigger MDBs (Volume 2),” ICRIER, September, available at: https://icrier.org/publications/the-triple-agenda-a-roadmap-for-better-bolder-and-bigger-mdbs/.
G20 Independent Expert Panel (“CAF Panel”) (2022) “Boosting MDBs’ investing capacity – An Independent Review of Multilateral Development Banks’ Capital Adequacy Frameworks,” October, available at: https://www.gihub.org/resources/publications/boosting-mdbs-investing-capacity-an-independent-review-ofmultilateral-development-banks-capital-adequacy-frameworks/.
GCR Ratings (2023a) “GCR assigns a final rating of AAA(NG) to InfraFunding SPV Limited’s N800m Series 2 (Tranche A) Guaranteed Fixed Rate Senior Green Infrastructure Bonds, Outlook Stable,” rating announcement, March, available at: https://gcrratings.com/announcements/gcr-assigns-a-final-rating-of-aaang-toinfrafunding-spv-limiteds-n800m-series-2-tranche-a-guaranteed-fixed-rate-senior-green-infrastructurebonds-outlook-stable/.
GCR Ratings (2023b) “GCR assigns a final rating of AAA(NG) to InfraFunding SPV Limited’s NGN955 million Series 4 Tranche A Guaranteed Fixed Rate Senior Green Infrastructure Bonds, Outlook Stable,” rating announcement, November, available at: https://gcrratings.com/announcements/gcr-assigns-a-final-rating-ofaaang-to-infrafunding-spv-limiteds-ngn955-million-series-4-tranche-a-guaranteed-fixed-rate-senior-greeninfrastructure-bonds-outlook-stable/.
GCR Ratings (2024) “GCR assigns a final rating of AAA(NG) to InfraFunding SPV Limited’s NGN755 million Series 5 Tranche A Guaranteed Fixed Rate Senior Infrastructure Bonds, Outlook Stable,” rating announcement, May, available at: https://gcrratings.com/announcements/gcr-assigns-a-final-rating-of-aaang-to-infrafundingspv-limiteds-ngn755-million-series-5-tranche-a-guaranteed-fixed-rate-senior-infrastructure-bonds-outlookstable/.
Giménez-Nadal, José Ignacio, Miriam Marcén, and José Alberto Molina (2007) “How does the presence of children affect dependent care? A psycho-economic approach,” IZA Discussion Paper, n° 2726.
GPEDC MDB working group (2019) “Multilateral Development Banks and Private Sector Engagement for Sustainable Development,” July, available at: https://www.adb.org/publications/mdbs-private-sectorengagement-sustainable-development.
Gregory, Neil (2023) “Taking Stock of MDB and DFI Innovations for Mobilizing Private Capital for Development,” Center for Global Development (CGD), Policy Paper 290, April, available at: https://www.cgdev.org/publication/taking-stockmdb-and-dfi-innovations-mobilizing-private-capitaldevelopment.
Gurara, D, M Sarmiento and A F Presbitero (2020), “Borrowing costs and the role of multilateral development banks: Evidence from cross-border syndicated bank lending,” Journal of International Money and Finance, October, available at: https://www.sciencedirect.com/science/article/abs/pii/S0261560619300476.
Guriev, G (2019), “How to Afford the SDGs,” Project Syndicate, October, available at: https://www.projectsyndicate.org/magazine/sustainable-development-goals-private-investment-by-sergei-guriev-2019-10.
HBOS Treasury Services (2003) “€14 billion Covered Bond Programme – Offering Circular,” July, available at: https://blog.cscglobal.com/our-services/capital-markets-services/public-transactions/hbos-treasury-servicesplc/.
HBOS Treasury Services (2008) “£3 billion Social Housing Covered Bond Programme – Base Prospectus,” May, available at: https://blog.cscglobal.com/our-services/capital-markets-services/public-transactions/hbossocial-housing-covered-bonds-llp/.
Her Majesty’s Treasury (HM Treasury) (2007) “Proposals for a UK Recognised Covered Bonds legislative framework,” July, available at: https://webarchive.nationalarchives.gov.uk/ukgwa/20081230215624/http://www.hmtreasury.gov.uk/consult_ukrec_covbonds.htm.
Hetherington Hebe, Charles Michaelis , Alison Radevsky , Gregg Smith , Chris Walter (2019) “Mobilising private finance through demonstration effects,” PE2 Private Finance Final Report, December, available at: https://www.itad.com/knowledge-product/mobilising-private-finance-compass-final-report/
Hossain, Shahadat and Rubaiyet Hasan Khan (2018) “Securitization: An Alternative Funding Mechanism for the Microfinance Institutions,” Journal of International Business, Economics and Entrepreneurship, Volume 3, Issue 2, December, available at: https://doi.org/10.24191/jibe.v3i2.14427.
Inderst, Georg (2021) “Financing development: Private capital mobilization and institutional investors,” Inderst Advisory - Discussion Paper, March, Available at SSRN 3806742.
InfraCredit (2022) “Unlocking Long-Term Local Currency Climate Finance for Off-Grid Energy Access in Nigeria,” Factsheet brochure, November, available at: https://infracredit.ng/climate-facility/.
InfraCredit (2023) “Green Finance for Sustainable Rural Telephony – Hotspot Network Limited, Nigeria,” project factsheet, August, available at: https://infracredit.ng/climate-facility/projects/hotspot-networklimited-nigeria/.
InfraCredit (2024) “Green Finance for Off-Grid Rural Electrification in Nigeria – ACOB Lightning Technology Limited,” project factsheet, February, available at: https://infracredit.ng/climate-facility/projects/acoblightning-technology-limited/.
International Capital Market Association (ICMA) (2022) “Green Bond Principles – Voluntary Process Guidelines for Issuing Green Bonds”, June, available at: https://www.icmagroup.org/sustainable-finance/theprinciples-guidelines-and-handbooks/green-bond-principles-gbp/.
International Finance Corporation (IFC) (2017) “Mobilizing Institutional Investments into Emerging Market Infrastructure,” EMCompass, Note 36, April, available at: https://hdl.handle.net/10986/30362.
International Finance Corporation (IFC) (2018a) “Annual Report 2018 – Redefining Development Finance,” September, available at: https://www.ifc.org/en/insights-reports/2018/ifc-ar-2018.
International Finance Corporation (IFC) (2018b) “Volume 2: Financials 2018 – Redefining Development Finance,” September, available at: https://www.ifc.org/en/insights-reports/2018/ifc-ar-2018.
International Finance Corporation (IFC) (2022) “Partnering with IFC Syndications,” IFC Syndications Brochure, February, available at: https://www.ifc.org/en/what-we-do/sector-expertise/syndicated-loans-andmobilization/portfolio-syndications.
International Finance Corporation (IFC) (2023) “NZAOA MDBs/DFIs webinar series: IFC (World Bank Group),” April, available at: https://www.unepfi.org/net-zero-alliance/alliance-extranet/financingtrack/nzaoa-transition-financing-track-2023/.
International Financial Law Review (IFLR) (2014) “First multi-bank ABS programme explained,” February, available at: https://www.iflr.com/article/2a63joz6bn5ixjaiacd8g/first-multi-bank-abs-programme-explained.
International Monetary Fund (IMF) (2008a) “Public Information Notice: IMF Executive Board Concludes 2008 Article IV Consultation with Seychelles,” November, available at: https://www.imf.org/en/News/Articles/2015/09/28/04/53/pn08142.
International Monetary Fund (IMF) (2008b) “Press Release: IMF Executive Board Approves US$26 Million Stand-By Arrangement for Seychelles,” November, available at: https://www.imf.org/en/News/Articles/2015/09/14/01/49/pr08282.
International Monetary Fund (IMF) (2009) “IMF Survey: Reforms, IMF Support Pull Seychelles Back From the Brink,” June, available at: https://www.imf.org/en/News/Articles/2015/09/28/04/53/socar063009a.
Jayadev, M. and Rudra Narasimha Rao (2012) “Financial resources of the microfinance sector: Securitisation deals – Issues and challenges Interview with the MFIs Grameen Koota and Equitas,” IIMB Management Review, Volume 24, Issue 1, March, pages 28-39, available at: https://doi.org/10.1016/j.iimb.2011.12.002.
Lambrecht, Bart and William Perraudin (2003) “Real options and preemption under incomplete information,” Journal of Economic Dynamics and Control, 27 (4). pp. 619-643
LatinFinance (2024) “IDB Invest bets on synthetic securitization to boost lending,” June, available at: https://latinfinance.com/daily-brief/2024/06/07/idb-invest-bets-on-synthetic-securitization-to-boostlending/.
Lee, Jeong Yeon (2000) “The Role of Foreign Investors in Debt Market Development: Conceptual Frameworks and Policy Issue,” Policy Research Working Paper No. WPS2428, August available at: https://documents.worldbank.org/en/publication/documentsreports/documentdetail/892881468740710187/the-role-of-foreign-investors-in-debt-market-developmentconceptual-frameworks-and-policy-issues
Lee, Nancy, Valerie Laxton and Samuel Matthews (2023) “What Would the Ideal Development and Climate MDB Look Like?” Center for Global Development (CGD), Policy Paper 299, June, available at: https://www.cgdev.org/publication/what-would-ideal-development-and-climate-mdb-look.
Lotti, Giulia, Andrea Presbitero (2019) “The mobilisation effects of multilateral development banks,” November, available at: https://cepr.org/voxeu/columns/mobilisation-effects-multilateral-developmentbanks.
Massa, Isabella (2011) “Impact of multilateral development finance institutions on economic growth,” London Overseas Development Institute, August.
McCormick, Ken (1983) “Duesenberry and Veblen: The Demonstration Effect Revisited,” Journal of Economic Issues, Vol. 17, No. 4, December.
McHugh, Christopher A. (2023) “Competitive conditions in development finance,” Journal of International Financial Markets, Institutions & Money, 83, 101741, March.
Mayer Brown (2020) “Covered Bonds Update in the United States,” October, available at: https://www.mayerbrown.com/en/insights/events/2020/10/covered-bonds-update.
MicroCapital (2006) “BRAC’s USD 180mn Microfinance Securitization wins Recognition from International Financing Review Asia and CFO magazine,” December, available at: https://www.microcapital.org/bracs-usd- 180mn-microfinance-securitization-wins-recognition-from-international-financing-review-asia-and-cfomagazine/.
Miles, David (2004) “The UK Mortgage Market: Taking a Longer-Term View – Final Report and Recommendations,” HM Treasury, March, available at: https://webarchive.nationalarchives.gov.uk/ukgwa/20061209023349/http://www.hmtreasury.gov.uk/consultations_and_legislation/miles_review/consult_miles_index.cfm.
Mitrut, Andreea and François-Charles Wolff (2009) “A causal test of the demonstration effect theory,” Economics Letters, 103(1), 52-54.
Mizuho (2018) “Issuer Perspective—SCI’s 4th Annual Capital Relief Trades Seminar 16 October,” available at: https://www.structuredcreditinvestor.com/pdf/pdf_presentation/Untitled%20attachment%2006150.pdf
MOBILIST (2023) “Development Finance Through Public Markets: Originate-to-demonstrate,” November, available at: https://www.mobilistglobal.com/research-data/development-finance-through-public-marketsoriginate-to-demonstrate/.
Multilateral Development Banks (2017) “Mobilization of Private Finance by Multilateral Development Banks: 2016 Joint Report,” available at: https://www.eib.org/attachments/mdb_joint_report_mobilization_2016_en.pdf.
Multilateral Development Banks (2023) “Mobilization of Private Finance 2020-2021 by Multilateral Development Banks and Development Finance Institutions,” June, available at: https://www.ifc.org/content/dam/ifc/doc/2023-delta/mdbs-joint-report-on-mobilization-of-private-finance- 2020-21.pdf
Organisation for Economic Cooperation and Development (2020), “DAC methodologies for measuring the amounts mobilised from the private sector by official development”, May, available at: https://www.oecd.org/dac/financing-sustainable-development/development-finance-standards/DAC- Methodologies-on-Mobilisation.pdf.
Organisation for Economic Cooperation and Development (2023), “Private finance mobilised by official development finance interventions”, Development Co-operation Directorate, OECD Publishing, available at: https://www.oecd.org/dac/2023-private-finance-odfi.pdf.
Potwarka, Luke R., et al. (2018) “Modeling a demonstration effect: The case of spectators' experiences at 2015 Pan Am Games' track cycling competitions,” Leisure Sciences, 40(6), 578-600.
Publish What You Fund (PWYF) (2024) “Crowding in: An advanced approach for measuring and disclosing private capital mobilisation,” available at: https://www.publishwhatyoufund.org/app/uploads/dlm_uploads/2024/04/Crowding-in-An-advancedapproach-for-measuring-and-disclosing-private-capital-mobilisation.pdf.
Rahman, Ray and Saif Shah Mohammed (2007) “BRAC Micro Credit Securitization Series I: Lessons from the World’s First Micro-Credit Backed Security (MCBS),” MF Analytics Ltd, March, available at: https://business.columbia.edu/sites/default/files-efs/imceuploads/tamer_center/BRAC_Micro_Credit_Securitization_MFA.pdf.
Rahman, Ray and Saif Shah Mohammed (2008) "Securitization and Micro-credit Backed Securities (MCBS)," in Sundaresan, Suresh (2008), Chapter 3, November, available at: https://ideas.repec.org/h/elg/eechap/13148_3.html.
Risk Control (2019) “Room2Run: the AfDB’s Approach to Sharing Risk with the Private Sector,” 19-73a, April, available at: https://www.newmarketcapital.com/wp-content/uploads/2021/11/Room-to-Run_Risk-Control.pdf.
S&P Global Ratings (2022) “Criteria | Governments | General: Multilateral Lending Institutions And Other Supranational Institutions Ratings Methodology,” January, available at: https://disclosure.spglobal.com/ratings/en/regulatory/article/-/view/sourceId/12245744.
S&P Global Ratings (2023) “Global Sustainable Bonds 2023 Issuance To Exceed $900 Billion,” September, available at: https://www.spglobal.com/esg/insights/featured/special-editorial/global-sustainable-bonds- 2023-issuance-to-exceed-900-billion.
Seychelles Ministry of Finance (2016) “Seychelles closes landmark buyback of Paris Club debt and activates marine conservation and climate change adaptation initiative,” March, available at: http://www.finance.gov.sc/press-releases/26/Seychelles-closes-landmark-buyback-of-paris-club-debt-andactivates-marine-conservation-and-climate-change-adaptation-initiative.
Seychelles Presidency (2015) “Seychelles Signs Landmark Debt Buyback Agreement with The Paris Club for Debt-For-Climate Change Adaptation Initiative,” February, available at: https://www.statehouse.gov.sc/news/2692/seychelles-signs-landmark-debt-buyback-agreement-with-theparis-club-for-debt-for-climate-change-adaptation-initiative.
Seychelles Presidency (2020) “Seychelles Designates 30% of its EEZ as Marine Protected Area,” February, available at: https://www.statehouse.gov.sc/news/4787/seychelles-designates-30-of-its-eez-as-marineprotected-area.
Shackle, G. L. S. and Duesenberry, James S. (March 1951) “Income, Saving, and the Theory of Consumer Behaviour,” The Economic Journal, 61 (241) 131.
Spratt, Stephen, and Lily Ryan Collins (2012) “Development finance institutions and infrastructure: A Systematic Review of Evidence for Development Additionality,” Private Infrastructure Development Group, August.
Srinivasan, N. (2010) “Microfinance India – State of the Sector Report 2010,” Sage Publications, available at: https://doi.org/10.1177/139156141101200209.
Stieber, Sharon (2007) “Is Securitization Right for Microfinance?”, Innovations: Technology, Governance, Globalization, Volume 2, Issue 1-2, April, pages 202-213, available at: https://doi.org/10.1162/itgg.2007.2.1- 2.202.
Structured Credit Investors (2019) “SCI – Capital Relief Trades Awards 2019,” October, available at: https://www.structuredcreditinvestor.com/SCI_Magazine.asp.
Sundaresan, Suresh (editor) (2008) “Microfinance – Emerging Trends and Challenges,” Edward Edgar Publishing, Monograph Book, November, available at: https://doi.org/10.4337/9781848445178.
The Banker (2014) “New ways to finance trade,” April, available at: https://www.thebanker.com/New-ways-tofinance-trade-1396339320.
Thomson, Benjamin S. (2022) “Blue bonds for marine conservation and a sustainable ocean economy: Status, trends, and insights from green bonds,” Marine Policy, Volume 144, October, available at: https://doi.org/10.1016/j.marpol.2022.105219.
UK Foreign, Commonwealth & Development Office (UK FCDO) (2023) “UK Nigeria Infrastructure Advisory Facility (UKNIAF) – Annual review,” November (published March 2024), available at: https://devtracker.fcdo.gov.uk/programme/GB-GOV-1-300274/documents.
United Nations (2015a) “Addis Ababa Action Agenda of the Third International Conference on Financing for Development,” endorsed by the General Assembly in its resolution 69/313 of 27 July 2015.
United Nations (2015b) “Transforming Our World, the 2030 Agenda for Sustainable Development,” General Assembly Resolution, September, available at: https://sdgs.un.org/publications/transforming-our-world- 2030-agenda-sustainable-development-17981.
United Nations Principles for Responsible Investment (UNPRI) (2019) “PRI Awards 2019 case study: Room2Run,” September, available at: https://www.unpri.org/showcasing-leadership/pri-awards-2019-casestudy-room2run/4848.article.
Vinod Kothari Consultants (2009) “Securitisation of Micro Credit Receivables,” May, available at: https://vinodkothari.com/2013/04/securitisation-of-micro-credit-receivables/.
Vinod Kothari Consultants and Indian Securitisation Forum (2024) “Vikas Path: The Securitised Path to Financial Inclusion,” May, available at: https://vinodkothari.com/2024/05/vikas-path-the-securitised-path-tofinancial-inclusion/.
Weed, Mike, et al. (2015) “The Olympic Games and raising sport participation: a systematic review of evidence and an interrogation of policy for a demonstration effect,” European sport management quarterly, 15(2), 195- 226.
World Bank (2009) “Green Bond Investor Newsletter,” available at: https://treasury.worldbank.org/en/about/unit/treasury/ibrd/ibrd-green-bonds#6.
World Bank (2015) “From billions to trillions: MDB contributions to financing for development,” Vol. 1, July, available at: https://documents.worldbank.org/en/publication/documentsreports/documentdetail/602761467999349576/from-billions-to-trillions-mdb-contributions-to-financing-fordevelopment.
World Bank (2018) “MDB Methodology for Private Investment Mobilization - Reference Guide,” available at: https://documents1.worldbank.org/curated/en/495061492543870701/pdf/114403-REVISED-June25- DocumentsPrivInvestMob-Draft-Ref-Guide-Master-June2018-v4.pdf.
World Bank (2024) “Innovative Co-Financing Platform Will Improve Development Impact,” press release, April, available at: https://www.worldbank.org/en/news/press-release/2024/04/19/innovative-co-financingplatform-will-improve-development-impact.
World Bank Group Independent Evaluation Group (WBG-IEG) (2021) “World Bank Group Approaches to Mobilize Private Capital for Development –An Independent Evaluation,” January, available at: https://ieg.worldbankgroup.org/evaluations/world-bank-groups-approach-mobilization-private-capitaldevelopment.
World Economic Forum (WEF) (2023) “Mobilizing Investments for Clean Energy in Nigeria,” community paper, May, available at: https://www.weforum.org/agenda/2023/05/how-nigeria-is-tackling-barriers-to-itsgreen-energy-transition/.
Yamada, Ken (2006) “Intra-family transfers in Japan: Intergenerational co-residence, distance, and contact,” Applied Economics, 38(16), 1839-1861.
Zhuang, Juzhong, Herath Gunatilake, Yoko Niimi, Muhammad Ehsan Khan, Yi Jiang, Rana Hasan, Niny Khor, Anneli S. Lagman-Martin, Pamela Bracey, and Biao Huang (2009) “Financial Sector Development, Economic Growth, and Poverty Reduction: A Literature Review,” ADB Economics Working Paper Series No. 173, October, available at: https://www.adb.org/sites/default/files/publication/28391/economics-wp173.pdf.
Appendix 1: Combining Demonstration Effect Category Scores
Table A1.1: Aggregate Outcome of Information Indicator
Information Obstacles Overcome Generation 0 1 2 3 4 5 6 7
0 0 1 1 2 2 3 3 4
1 1 1 2 2 3 3 4 4
2 1 2 2 3 3 4 4 5
3 2 2 3 3 4 4 5 5
4 2 3 3 4 4 5 5 6
5 3 3 4 4 5 5 6 6
6 3 4 4 5 5 6 6 7
7 4 4 5 5 6 6 7 7 Note: The matrix is colour-coded with red as bad and green as good outcomes.
Table A1.2: Aggregated Outcome of Feasibility Indicator
Deal Profitability and Impact Feasibility 0 1 2 3 4 5 6 7
0 0 1 1 2 2 3 3 4
1 1 1 2 2 3 3 4 4
2 1 2 2 3 3 4 4 5
3 2 2 3 3 4 4 5 5
4 2 3 3 4 4 5 5 6
5 3 3 4 4 5 5 6 6
6 3 4 4 5 5 6 6 7 Note: The matrix is colour-coded with red as bad and green as good outcomes.
Table A1.3: Aggregate Outcome of Information Indicator and Feasibility Indicator
Feasibility Indicator Information Indicator 0 1 2 3 4 5 6 7
0 0 0 1 1 1 2 2 3
1 0 1 1 1 2 2 3 3
2 1 1 1 2 2 3 3 3
3 1 1 2 2 3 3 3 4
4 1 2 2 3 3 3 4 4
5 2 2 3 3 3 4 4 4
6 2 3 3 3 4 4 4 5
7 3 3 3 4 4 4 5 5
Appendix 2: Scoring the Sample Transactions
Here, we discuss the reason behind the scoring for each case study.
The first success factor, ‘Information generated’, depends in part on whether the transaction is publicly listed or private. The sample includes four publicly listed transactions (i) HBOS structured covered bonds, (ii) climate awareness bonds, (iii) Trade MAPS, and (iv) BIC IV. These score highly in the sub-indicators associated with public listing. We scored trade MAPS lower because of the number of market makers relative to that of other transactions.
The first eight sub-indicators of ‘Information Generated’ reflect public domain information available following the transaction in question. Deals for which ample information was provided via media coverage, road shows and deal descriptions score well. Publicly listed transactions tend to have more elaborate dissemination plans. AfDB’s Room2Run deal, while private, scores well because of the dissemination activities in which the parties engaged.
The second success factor, ‘Obstacles Overcome’, reflects whether the transaction extends existing information or methodology in the market in the areas of the four different sub-indicators. Deals that were rated potentially score well for the ‘rating’ indicator, especially if there has been interaction with rating agencies to accommodate a new instrument or to devise a new methodology. Thus, we find (i) HBOS structured covered bonds, (ii) BRAC microfinance securitisation, (iii) Trade MAPS, (iv) Room2Run, and (v) BIC IV all scoring highly.
For the ‘legal’ sub-indicator, almost all the transactions considered here had to contract legal issues. We rate a transaction highly in this regard if multiple barriers have been overcome. As examples:
(i) HBOS structured covered bonds rate highly because it demonstrated the ability to create structured covered bond programmes, using legal securitisation techniques in jurisdictions where a specific covered bond legal framework did not exist.
(ii) Trade Maps is a global and intrinsically cross-border activity, a characteristic which complicates funded securitisation.
As regards the ‘technical finance’ sub-indicator, we evaluate favourably those transactions that involve pricing or risk modelling challenges, arising either from complexity or the lack of benchmarks. Here, most of the innovative transactions are rated positively, with some attracting higher scores than others. The securitisation transactions require expertise in the calculation of fair prices given the novel risks involved, so we assign these the highest scores in this category.
For ‘accounting’, we do not find any transactions that overcame major obstacles in this category, with the exception of Trade MAPS, for which the cross-border nature of the activity raised difficulties.
The third category, ‘Profitability and impact’, is evaluated based on the (i) expected returns from the transaction, (ii) whether the transaction could be considered to contribute towards SDG goals or green finance, and (iii) the alignment of interests of the stakeholders. Here, scoring for the two development-related subindicators is straightforward, as transactions either exhibited positive development impact or ESG characteristics or not.
The profitability sub-indicator reflects the return that parties expected when the transaction was approved. Examples of transactions that scored well in the profitability sub-indicator are:
• The HBOS transaction since the bank expected to obtain a cheaper cost of funding
• Climate awareness bonds which combined sustainability gains with favourable pricing
• AfDB’s Room2Run deal which was expected by the Bank to yield favourable capital gains while providing investors with appropriate returns.
The alignment of interests sub-indicator is scored either ‘high’ or ‘moderate’ for all the transactions in the sample. We view the alignment of interests as important for stable performance as it reduces the probability of conflicts that may lower returns for one or the other party ex post.
The category deal feasibility combines such considerations as ease of replicability and simplicity of the deal.
Table A2.1: Rationales for Individual Deal Scores Transaction Rationales for Ex Ante Demonstration Effect Scoring HBOS Structure Summary Covered Bonds a. The deal was publicly listed and generated many documents sharing information about the transaction, leading to a high score in the information generation category. b. It overcame significant obstacles in terms of rating methodology and legal structuring. c. It was a profitable transaction and there was no misalignment of interest between stakeholders. d. The deal structure was moderately complex but reproducible easily enough. It was also a large issuance (more than a billion USD).
Discussion by sub-category
• Information Generation The deal ticked all the criteria in this category being large, publicly listed and rated, etc. It, therefore, is scored in this category at the maximum value of 7.
• Obstacles Overcome The transaction was groundbreaking in its legal structuring and the rating approach that it spearheaded. Hence, it receives the maximum sub-scores in these two aspects. The deal represented smart technical finance innovation, although it used tried and tested techniques. For these reasons, it obtains the mid-mark of 1 out 2. No accounting obstacles presented themselves so the score in this subcategory is 0 out of 1. The combined sub-scores result in a high score of 5 for obstacles overcome.
• Profitability and Impact HBOS as issuer enjoyed high profits via cheaper cost of funding, diversification of financing sources, and efficient replicability for further issuances, justifying a score of 3 out of 3. Strong alignment of interests of all deal participants (from issuer to investors) ensured a highly successful transaction at closing and ongoing, justifying 2 out of 2. There was no particular development impact or ESG characteristics, hence we assign 0 out of 1 for both. The transaction scored high on the two higher weight marks (but not the other two), hence obtaining a high mark of 5.
• Deal Feasibility It was a highly reproducible deal in large sizes (> US$1 billion) and, hence, scores 2 out of 2 in both sub-categories. The transaction was simple enough to replicate but still required a significant investment to implement, hence scoring 1 out 2 on Simplicity. These high sub-scores explain a category score of 6, just below the maximum of 7.
• Overall Score High scores in all categories (although only one at the maximum) explain the high overall score of 4 out 5.
Transaction Rationales for Ex Ante Demonstration Effect Scoring but the transaction had no particular ESG characteristics (mark 0). As a result, the deal obtained a low category score of 3 out of 7. Deal Feasibility
• The deal was expected to be easily reproducible (mark 2 out of 2). It was not too complicated (mark 1 out of 2) but remained small (mark 0). These components explain the mid-category score of 3 out of 7.
• Overall Score Scores around the average marks in all four categories explain the mid-overall score of 3. EIB Climate Awareness Summary Bonds a. It was a publicly listed issuance and generated many documents sharing information about the transaction, leading to a high score in the information generation category. b. The deal overcame some challenges in its legal structuring. c. It was a profitable transaction with significant development and ESG impact. d. The deal structure was simple enough and easy to replicate. The transaction size was ‘intermediate’, between 300 million and 1 billion USD.
Discussion by sub-category
• Information Generation The deal ticked almost all the criteria in this category (large issuance, publicly listed and rated, etc.), albeit with limited evidence of publication of deal descriptions (back in 2007). Therefore, the transaction scored 6.5 out of 7, just below the highest of this category.
• Obstacles Overcome There was no rating obstacle to overcome (being EIB’s rating) nor any accounting obstacle. Some technical finance and legal obstacles were overcome (equity indexing and green use of proceeds), hence both marks of 1 out of 2. As a result, the deal scored only 2 out of 7 in this category.
• Profitability and Impact The transaction was highly profitable to implement (mark 3 out of 3). As the first green bond, it had favourable ESG characteristics and positive development impact (mark 1 out of 1 on both criteria). There was an excellent alignment of interests between deal participants, deserving a mark of 2 out 2. These considerations explain a top category score of 7 out of 7.
• Deal Feasibility Green bond issuances were simple to implement and easily reproducible (mark 2 out 2 on both criteria). The initial EIB green bond fairly large (€600 million) but not on the scale of a typical benchmark size of a billion euros or more. Hence, we assign it a score of 1 out of 2 in this regard. As a result, the deal obtained a category score of 5, just below the category maximum.
• Overall Score Thanks to very high scores in three categories out of 4, the transaction achieved an overall score of 4 out 5.
• •
Transaction Rationales for Ex Ante Demonstration Effect Scoring significant alignment of interests between participants (2 marks). Thanks to these, the deal scored 5 out of 7 in this category. Deal Feasibility
• The transaction was relatively simple in concept and implementation and achieved a major size (both marked 2 out of 2). It could be replicated reasonably easily, subject to benefitting from the strong expertise and pipeline of a lender such as IFC. In this category, the deal then scored 5 out of a maximum of 6.
• Overall Score Because of two strong category scores mitigated by two lower categories, the inaugural MCPP transaction obtained a mid-overall score of 3. Trade MAPS 1 Summary a. It was a publicly listed issuance and generated many documents sharing information about the transaction, leading to a high score in the information generation category. b. The deal was highly innovative and overcame multiple obstacles in terms of rating, legal structuring, and accounting. c. It lacked profitability and development impact. d. It was a highly complex deal and difficult to replicate.
Discussion by sub-category Information Generation
• The transaction was widely publicised and resulted in listed securities, hence obtaining marks in most aspects of this category. This explains a category score of 6 out 7.
• Obstacles Overcome The deal was complex especially from a legal, accounting and regulatory viewpoint since it involved multiple jurisdictions from more than one bank. The same was true for the rating process and overall technical finance, all of which resulted in the maximum category score of 7 obtained.
• Profitability and Impact The transaction was more profitable for one of the two banks involved than for the other and the two had somewhat misaligned interests because of the different types of assets that they contributed.
• Deal Feasibility The complexity of the deal, especially from a legal standpoint and g, made it unlikely that others would be able to mimic the deal.
• Overall Score The high marks in information generation and obstacles overcome were compensated by lower marks in profitability, impact, and deal feasibility. This resulted in a mixed overall score of 3 (out of 5).
Transaction Rationales for Ex Ante Demonstration Effect Scoring
• Deal Feasibility The transaction was of moderate complexity but could be replicated with the right actors (and in the context of marine protection), hence both marks on these indicators. But the Seychelles deal size was small (no mark). As a result, the deal obtained only a score of 2 out of 6.
• Overall Score The mixed scores obtained in the different categories resulted in a mid-overall score of 3. AfDB’s Room2Run Summary NSO a. It was a private deal but was significantly publicised and generated extensive information sharing. b. It cleared major rating obstacles in the securitisation of the MDB assets. c. The transaction was profitable for all parties involved and had substantial development benefits. d. The deal was moderately complex but reproducible easily enough. It had a large transaction size (a billion USD).
Discussion by sub-category
• Information Generation Although private, the transaction was publicised by AfDB which made presentations, published a deal description and elicited media coverage. The transaction was evaluated by a global rating agency although a public rating was not obtained. The absence of a listing means that the deal receives a medium score of 4.
• Obstacles Overcome The transaction involved a lengthy negotiation with Standard & Poor’s which resulted in the agency issuing a new methodology for rating the retained senior tranche. Technical finance obstacles were overcome in the sense that this was a new asset class in which investors required education on the level of risk to be expected. No legal or accounting obstacles were overcome. Overall, the category score was moderate at 4.
• Profitability and Impact The deal was profitable for private sector investors and generated significant capital savings relative to foregone spread income for AfDB. The senior mezz tranche was priced finely but analysis suggested the risk of losses for the European Commission was very low. The transaction created headroom for high-impact lending by AfDB. Interests of the parties were aligned. The favourable impact, profitability and alignment of interests imply a score of 7.
• Deal Feasibility While not particularly simple, the deal employed standard securitisation techniques, familiar to many investors in the Significant Risk Transfer (SRT) market. The size of the transaction was relatively large. These arguments suggest a weighted average score of 5.
• Overall Score The high scores in impact and feasibility lead to an overall score of 4 out 5.
Transaction Rationales for Ex Ante Demonstration Effect Scoring
• Deal Feasibility The transaction was moderately simple and replicable with the right participants (including concessional funding). However, its amount was small. Overall Score
• The deal obtained low scores in three categories out of four, with the exception of profitability and impact. This resulted in a low overall score of 2 (out of the maximum of 5). Bayfront Infrastructure Summary Capital (BIC) IV a. It was a publicly listed issuance and generated many documents sharing information about the transaction, leading to a high score in the information generation category. b. It was a highly innovative deal that overcame multiple obstacles in terms of rating approach and legal and financial structuring. c. The transaction was profitable and had significant ESG and development impacts. d. It was a moderately complex deal and not reproducible very easily.
Discussion by sub-category Information Generation
• The deal involved multiple prominent investors and was widely publicised. Hence, it attracts high scores in most of the sub-categories. The transaction notes were listed, and a major rating agency evaluated both the underlying loans and the notes. The resulting information generated helps to shed light on the risk of Asian infrastructure loans. The resulting score is high at 6. Obstacles Overcome
• The sequence of Bayfront transactions has collectively implemented an innovative maturity transformation technique, permitting investors to take exposure to portfolios of infrastructure loans for relatively short periods. Rating, legal and technical finance obstacles were overcome. The score here is high at 6. Profitability and Impact
• The transaction appears to be reasonably profitable for all parties and so attracts a 2 out of 3. The assets include some green loans, and the development impact is positive. The alignment of interests is high in that all parties will favour a relatively early call. The overall score is high at 6. Deal Feasibility
• The deal uses standard securitisation techniques, which even if not simple, are well known to a wide set of investors. The transaction volume was reasonably large although not very substantial. The deal requires liquidity support from the Singaporean authorities. The last issue reduces the score for reproducibility to 3.
• Overall Score Strength in three of four categories results in an overall score of 4.
Risk Control 13-14 Dean Street London W1D 3RS +44(0)2033070730 www.riskcontrollimited.com
Notes
[1] Falduto, Jachnik and Noels (2024) comment “Global clean energy investment has risen by 40% since 2020, reaching USD
[1] 800 billion in 2023, but almost all the recent growth has been in developed countries and in China. Developing countries (excluding China) account for just 15% of the total, as capital flows to clean energy projects in many developing countries remaining stubbornly low.”
[2] World Bank (2018) and OECD (2020) present the definitions and methodologies employed in these reports.
[3] Economic development may, of course, be advanced through demonstration effects even in the absence of DFI interventions. Lee (2000) argues that the presence of foreign investors pushes forward the development of national EMDE debt markets through demonstration effects.
[4] The concept of demonstration effect on individual behaviour has been thoroughly examined in areas other than finance. In sociology, for instance, extensive research and analyses have been conducted to explore demonstration effects within intergenerational transfers. Notable studies include Cox and Stark (1994), Mitrut and Wolff (2009), Giménez-Nadal et al. (2007), and Yamada (2006). Using empirical data, these papers argue that, irrespective of cross-country and gender variations, parents are inclined to allocate more time and attention to their own parents in the presence of their children. Such strategies by parents aim to influence future reciprocal support from their children. Another area in which demonstration effects have been widely researched is the influence exerted by elite sports, athletes, and sporting events on the engagement levels in sports participation. Taking data gathered from spectators attending different sports events, Weed et al. (2015) and Potwarka et al. (2018) show the constructive impact of live sports experiences on the cognitive dimensions of the audience. These findings underscore how such live sports encounters serve as catalysts for increased frequency and renewed enthusiasm in sports participation through demonstration effects.
[5] Specifically, the EIB evaluated impact on Economic Performance by looking at “e.g. job creation, capacity building, technology transfer, demonstration effects, etc.” As far as one can tell from the summaries provided by Massa, the other DFIs she covered (the MDBs IFC, EBRD, AfDB, and the bilateral DFIs: Germany’s DEG, the Netherlands’ FMO, and the UK’s CDC) did not explicitly mention demonstration effects in their project evaluation.
[6] See Gregory (2023), page 7.
[7] The MDB approach assigns direct mobilisation volume only to the MDBs that play active and direct roles and, indeed, only to those that are contributing to the reporting activity. This may have the effect of downplaying the investment contributions of other public sector development finance institutions that do not operate syndication desks.
[8] HBOS Treasury Services plc was a direct wholly-owned subsidiary of Bank of Scotland, fully guaranteed by its parent company and in charge of providing centralised treasury and funding services to the HBOS group (HBOS) in the UK and Ireland. HBOS resulted from the merger of Halifax and Bank of Scotland in 2001.
[9] See HBOS Treasury Services (2003) and Miles (2004).
[10] The German covered bonds are called ‘pfandbrief’ (plural: pfandbriefe) and were the first-ever covered bonds created by law in Prussia as far back as 1769. Pfandbriefe constitute regulated covered bonds governed by a legislative framework in Germany (see Benteux et al. (2009)) and have provided comparatively cheap funding to German mortgage banks thanks to benefitting from AAA ratings and strong demand from investors seeking highly rated financial institution (FI) bond investments.
[11] For covered bond investors, the main difference between HBOS’s structured covered bonds resulted from the fact that they were not recognised as ‘regulated covered bonds’ for the purpose of the EU Undertakings for Collective Investments in Transferable Securities (UCITS) directive or the EU Basel 1 risk-weighting (see Miles (2004), 7.14 to 7.19 pages 77-78). As such, HBOS’s structured covered bonds carried a Basel 1 risk-weighting of 20% instead of 10% for regulated covered bonds in a number of EU countries (including Germany). They also only qualified for a maximum 5% investment limit for EU UCITS instead of a higher 25% limit for regulated covered bonds.
[12] See HBOS Treasury Services (2008).
[13] See Miles (2004), 7.14 page 77. UCITS mean Undertakings for Collective Investments in Transferable Securities.
[14] See Benteux et al (2009).
[15] See Mayer Brown (2020).
[16] See Mayer Brown (2020).
[17] See Benteux et al (2009).
[18] See HM Treasury (2007).
[19] See ECBC (2023), page 494.
[20] See Hossein (2018) and Stieber (2007).
[21] See Hossein (2018)
[22] See MicroCapital (2006).
[23] See ADB (2007), page 60.
[24] See ADB (2007), page 61.
[25] See CGAP (2013).
[31] See EIB (2007).
[32] Such ‘social bonds’ were issued in 2006 as US$1 billion ‘vaccine bonds’ by the International Finance Facility for Immunisation (IFFIm), a UK charity backed by the UK, France, Italy, Spain, Sweden and Norway.
[33] These first green bond issues by different MDBs, and by currency, are documented in EIB (2021), Figure 16, page 49.
[40] See IFC (2018a), page 28.
[41] See WBG-IEG (2021) Box 2.2, page 35-36.
[42] See WBG-IEG (2021), page 46.
[43] See IFC (2017).
[44] See WBG-IEG (2021), page 169.
[45] See FAST-Infra (2021), pages 28-33.
[46] See FAST-Infra Group website, “Our solutions” at: https://fastinfragroup.org/our-solutions/.
[47] AfDB, ADB, AIIB, the Council for Europe Development Bank, EBRD, EIB, IDB, IsDB, NDB and the World Bank Group.
[48] See World Bank (2024).
[49] See Citigroup (2011).
[52] The Nature Conservancy (TNC) is a global environmental non-profit charitable organisation headquartered in Arlington, Virginia (USA) founded in 1951. It describes its mission as being to conserve lands and waters on which all life depends and states that it is one of the largest non-profit environmental organisations in the world (see www.nature.org).
[54] See Thomson (2022).
[55] See also “New Guidance on Blue-Themed Bonds to Help Unlock Finance for a Sustainable Ocean Economy” from ICMA at: https://www.icmagroup.org/News/news-in-brief/new-guidance-on-blue-themed-bonds-to-help-unlock-finance-for-a- sustainable-ocean-economy/.
[56] See UNPRI (2019).
[57] See Structured Credit Investors (2019), page 14.
[58] See S&P Global Ratings (2022), para 152-159.
[59] See Fitch Ratings (2023), and Fitch Ratings (2024) “Portfolio Risk Transfers” page 12.
[60] Incorporated as the Infrastructure Credit Guarantee Company Limited in Lagos, Nigeria.
[61] NGN designates the Nigerian Naira, Nigeria’s legal tender currency. NGN 800 million was equivalent to US$1.9 million in November 2022 when InfraCredit announced the transaction.
[62] See UKNAIF (2024).
[63] These SDGs are: 7 (affordable and clean energy), 8 (decent work and economic growth), 9 (innovation infrastructure), 11 (sustainable cities and communities), 13 (climate action) and 17 (partnerships for the goals).
[64] The Certified Climate Bonds Database can be accessed at https://www.climatebonds.net/certification/certified-bonds.
[65] See WEF (2023).
[66] See InfraCredit (2023) and GCR Ratings (2023b).
[67] See InfraCredit (2024) and GCR Ratings (2024).
[68] See UK FCDO (2023), #19, page 3.
[69] See UK FCDO (2023), #41-42, page 10.
[70] See Bayfront Infrastructure (2023a).
[71] See Bayfront Infrastructure (2023b), pages viii-x and 61-65.
[72] As already noted, MOBILIST subsequently received a reduced allocation of US$5 million (19.5%) of the equity tranche, given the considerable success of the transaction’s distribution with investors.
[73] See ADB (2023), Box 7, pages 44-46.
[74] When we refer to transactions by MDBs, we also include transactions undertaken by bilateral Development Finance Institutions (DFIs).
[75] Gregory (2023), in assessing MDB and DFI innovations and their potential for mobilisation, considers certain demonstration effects that the transactions may have. He examines the relevance of an innovation for mobilisation by looking at how it addresses challenges like scalability, replicability, and the ability of institutional investors to participate (see Gregory (2023), page 13).
[76] If the deal requires a substantial subsidy, one may doubt whether an innovative transaction will be scalable or capable of significant replication. Note that we will interpret profitability here not just as financial but also as the additional dimension investors may seek, namely Environmental, Social, Governance (ESG) or Sustainable Development Goal (SDG) content.
[77] In this context, it is worth noting that the form of financial transactions is explicitly excluded from patentable inventions.
[79] The lack of distinction between the co-financing of debt through loan syndication and, say, equity which absorbs much more risk, may skew the incentives of MDBs to use simple approaches capable of generating high volumes of relatively unimpactful mobilisation. If implemented, the Publish What You Fund proposals for greater granularity in mobilisation reporting would make it possible to understand mobilisation in a more nuanced way and reduce DFI incentives to pursue high volumes of syndicated lending in the most straightforward lending environments, namely medium or high-income countries. Note: The outcomes in the matrix ranges from zero to five. Note: The matrix is colour-coded with red as bad and green as good outcomes. BRAC Microfinance Summary Securitisation a. It was a private deal and generated limited information compared to public transactions. b. This deal overcame significant obstacles in terms of rating methodology. c. It was a profitable transaction and there was no misalignment of interest between stakeholders. d. The deal was moderately complex but easily reproducible. It had a small transaction size (less than three hundred million USD). Discussion by sub-category • Information Generation The transaction ticked only a few of the boxes in the Information Generation category (mostly number of investors, media coverage, leading institutions, and deal description publication), hence receiving these marks. But it remained a small transaction, not listed and not rated by a global CRA. These considerations explain the low 2.5 category score out of 7. • Obstacles Overcome The deal overcame a significant rating obstacle, being the first publicly rated (albeit by a local rating agency) microfinance securitisation in Asia, hence the sub-mark 2 out of 2. It also overcame some legal and technical finance obstacles. Hence, both sub-marks of 1 of 2. No particular accounting obstacles needed to be overcome, so the deal attracts 0 out of 1 in this sub-category. As a result, the transaction scored a little above average in the category: 4 out of 7. • Profitability and Impact The deal’s profitability was limited given its small size (earning a mark 1 out of 3). It was expected to have positive development impacts in the country’s microfinance market (mark 1 out of 1). There was a reasonable alignment of interests between participants (mark 1 out of 2) IFC’s Inaugural MCPP Summary a. It was a private deal and generated limited information compared to public transactions. b. Expertise was required to source and assess the development assets for the transaction. c. The transaction was profitable and had significant development benefits. d. The deal structure was simple but not very easily reproducible owing to the required origination expertise. Discussion by sub-category Information Generation The inaugural 2013 MCPP was a private deal which did not seem to generate much coverage or communication initially, hence the very limited marks obtained in this ex-ante scoring category. However, the transaction was of a major size (US$3 billion) with leading institutions (IFC, SAFE) and generated a template for future replications, justifying the aggregate 1.5 mark accorded in this category (out of a maximum of 7). • Obstacles Overcome The transaction created valuable technical finance innovation in co-lending in EMDEs (mark 2 out of 2) and associated legal approaches (mark 1 of 2). It was not rated and no particular accounting obstacles were overcome. As a result, the deal scored only 3 out of 7 in this category. Profitability and Impact The transaction was expected to generate significant benefits for its investor and for IFC and its borrowers (marked 2 out of 3). It had positive development impacts (1 mark) and displayed Seychelles Blue Debt Summary Conversion a. The deal was not listed but was highly publicised and generated significant information sharing. b. Expertise was required to evaluate the fair price of the transaction. c. The transaction was very profitable for Seychelles and had major ESG and development impacts. d. It was a moderately complex deal and could be replicated with the right participants. Discussion by sub-category • Information Generation The transaction generated significant communication, interaction with investors and market participants, and coverage, justifying the five 0.5 marks accorded in this category. However, it was not publicly listed and its size was small, hence missing out on the other marks. As a result, the deal achieved only a score of 2.5 (out of 7) in this category. • Obstacles Overcome The transaction overcame significant financial obstacles to come to fruition and some legal complexities, justifying the marks accorded. • Profitability and Impact The deal was highly profitable for Seychelles and generated major development and ESG impact. There was also a good alignment of interests among the various transaction participants. These aspects explain the high category score obtained of 5 out of 7. Green Certified Local Summary Debt Issue in Nigeria a. It was a private deal and generated limited information compared to public transactions. b. The transaction overcame some obstacles in terms of legal and financial structuring. c. It had limited profitability (requiring concessional lending) but generated significant ESG and development benefits. d. It was a moderately complex deal and not easily reproducible. Discussion by sub-category • Information Generation The transaction was small even in the context of local capital markets in local currency. It was privately placed to local investors and generated moderate information sharing and media coverage. This explains why the deal obtained marks on only three sub-indicators in this category, hence the category score of only 1.5. • Obstacles Overcome The transaction overcame moderate legal and technical finance obstacles by combining blended finance and guaranteed green-certified bonds. There were no significant rating or accounting obstacles. • Profitability and Impact The transaction featured major ESG characteristics via its green certification and generated significant development impact. However, it was only feasible because of concessional funding. This explains a higher score of 4 (out of 7) in this category compared with the other categories.