

1. Key Points
How has the impact of the Covid-19 crisis evolved in the last two months? This note shows how the credit standing of firms in different industrial sectors and of individual sovereign countries and broad regions have been affected by the evolving crisis.
On real-time sovereign ratings, key points are:
1. Overall, sovereign credit quality deteriorated in the first half of September (as the second wave hit) but then recovered to similar or higher levels than at the start of the period.
2. North America, Asia-Pacific and Latin America have current ratings similar to their pre-crisis level. Other regions, especially Africa, still have worse credit quality than before the crisis.
3. The effect of the pandemic is more persistent on countries with worse ratings.
4. The time paths of ratings for different countries exhibit significant volatility.
On industry sector probabilities of default, the key points are:
1. Most sector PDs have been volatile since early September 2020 but without a consistent trend being evident.
2. Energy is the only sector for which PDs have increased consistently since early September.
3. Positive news about vaccine advances reduced the PDs of those sectors most affected by the pandemic, in particular Energy, Materials, Industrials, Financials and Real Estate.
4. Sectors that performed relatively well through the pandemic, such as IT and Biotechnologies, exhibited little reaction to the news of vaccine.
5. Consumer sectors have gradually recovered but Airlines remain under pressure.
The Risk Control Covid-19 Dashboard is
available at:
https://c19dashboard.riskcontrollimited.com/
2. Sovereign PDs and Ratings
This section presents an update of Risk Control’s regular analysis of the sovereign ratings and PDs implied by CDS spreads. The methodology followed is described in the note: “Real Time Sovereign Ratings in the Covid-19 Crisis,” 20-65a which may be found on the Risk Control website. Similar calculations with daily updates are presented on Risk Control’s real-time dashboard at https://c19dashboard.riskcontrollimited.com.
In this section, we focus on the question: what happened to Sovereign Credit Quality since early September until 20th November 2020? Figure 1 presents sovereign ratings averaged across the sovereigns in each region. The ratings are calculated using data for different CDS tenors, specifically 1-year and 5-years.
One may observe from Figure 1 that the average ratings (expresses in numbers of notches below AAA) are highly correlated for different regions. In general, regional ratings deteriorated in mid-September, but recovered afterwards to a level similar to that of the start of September. North America and Europe exhibits the most stable ratings, while other regions have gone through significant rating fluctuations.
Overall, in the two and a half months, sovereign credit quality has continued to recover in the direction of precrisis levels. Africa, is now around two notches below pre-crisis levels. Europe and Asia are about 1 notch down. North America is unchanged since the crisis (or even slightly improved). Latin America and the Middle East are less than a notch down since pre-crisis levels.
Figure 2 plots PDs for individual sovereigns calculated for 20th November against PDs estimated for 1st September. In general, both short-term and long-term PDs are stable or have decreased slightly.
Countries that exhibit significant falls in 1-year PDs are Guatemala (4.3% to 2.0%) and Turkey (5.3% to 2.8%). Countries with significant drop in 5-year PDs are Turkey (11.2% to 8.3%) and Ukraine (14.9% to 10.8%).
How does the credit quality of sovereigns compare to pre-crisis levels? Figure 3 shows plots of PDs for the 20th November versus PDs calculated for 1st January 2020. The changes in short-term PDs are larger than those in long-term PDs (although PDS for fewer countries are available in the former case). Almost all 1-year PDs have increased during the year. Countries with the most increases in PDs are Ghana (3.8% to 11.5%), Ukraine (2.7% to 4.2%), Turkey (0.3% to 2.8%), Bahrain (0.2% to 1.8%) and El Salvador (2.5% to 4.1%).
The 5-Year PD scatter plot in Panel B shows an interesting pattern. The low PD countries in the bottom left corner of the graph have recovered to equal their pre-crisis levels. For middle-level-PD countries, November PDs are somewhat higher than those observed at the start of 2020, but the difference increase as PDs increase. This suggests that the pandemic is having a deeper impact on countries which started with relatively weak credit standing. Countries in the graph with significantly elevated PDs are: Ukraine (8.4% to 11.8%), Egypt
(7.3% to 8.3%), Bahrain (5.1% to 7.8%), South Africa (5.1% to 6.2%), Uruguay (4% to 5.6%), Brazil (3.7% to 5.3%).
Figure 4 shows time series plots of PDs for selected countries. Their implied ratings appear in Table 1.
PDs peaked for all countries in late March and then recovered differing degrees subsequently different. Among the countries presented, the PDs for United Kingdom and China have returned to pre-pandemic levels. The PD of Saudi Arabia almost doubled at the onset of the pandemic but its credit standing has now recovered. Ukraine’s PD reached extremely high levels in March but recovered quickly. In contrast, the PDs of Ghana and Brazil remain relatively high.
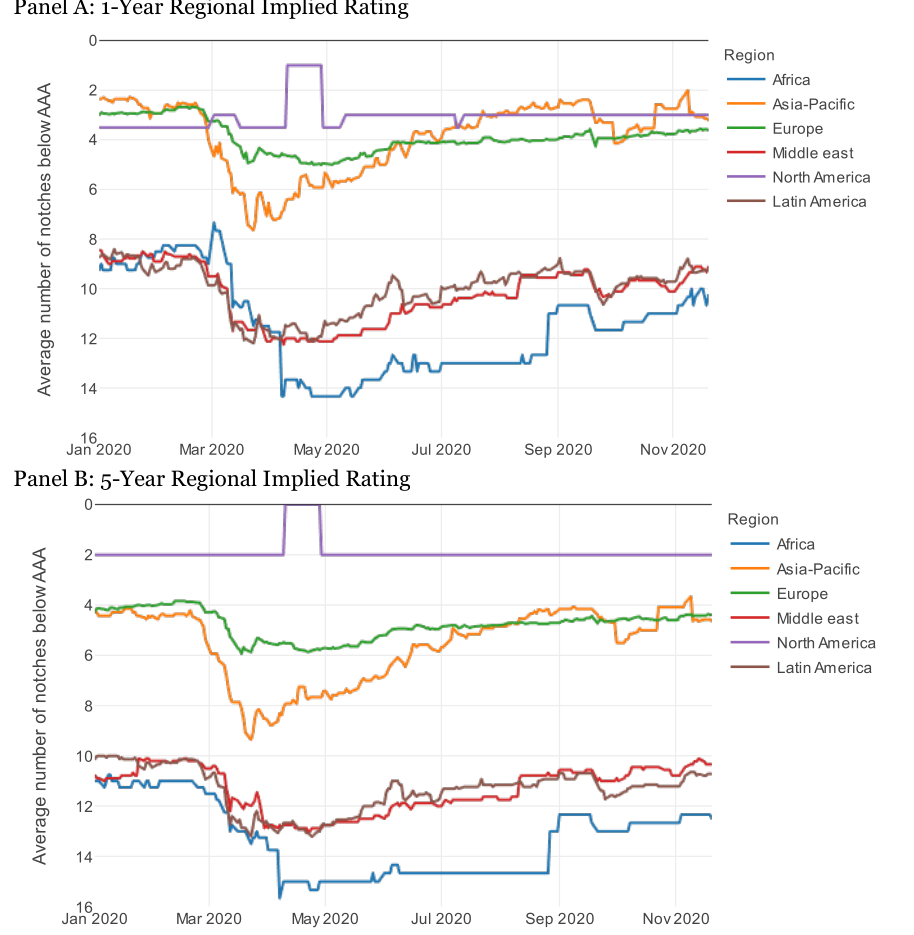
Note: Ratings are calculated by Risk Control.
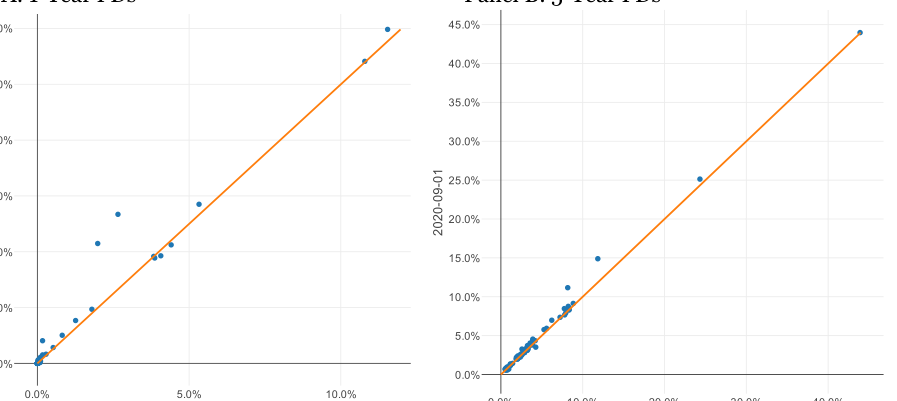
Note: All calculations are by Risk Control. Some countries with very high PDs are eliminated from the scatter plots so that the bottom left corner is shown clearly.
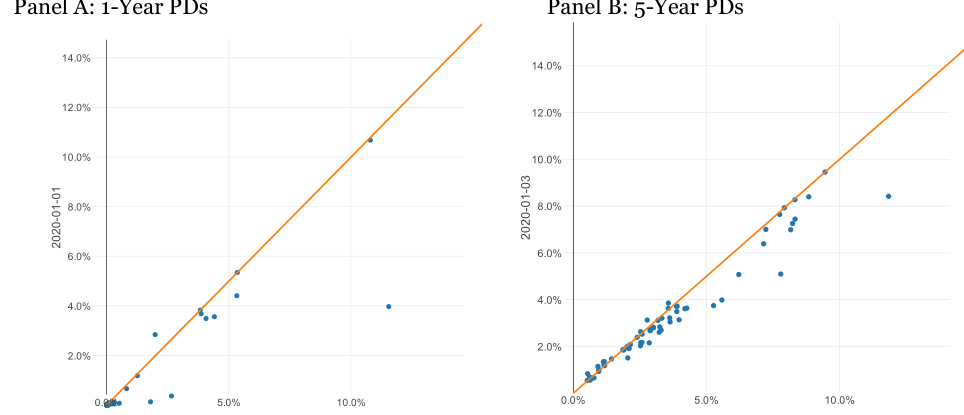
Note: Numbers are calculated by Risk Control. Countries with very high PDs are eliminated from the scatter plots so that the bottom left corner is shown clearly.
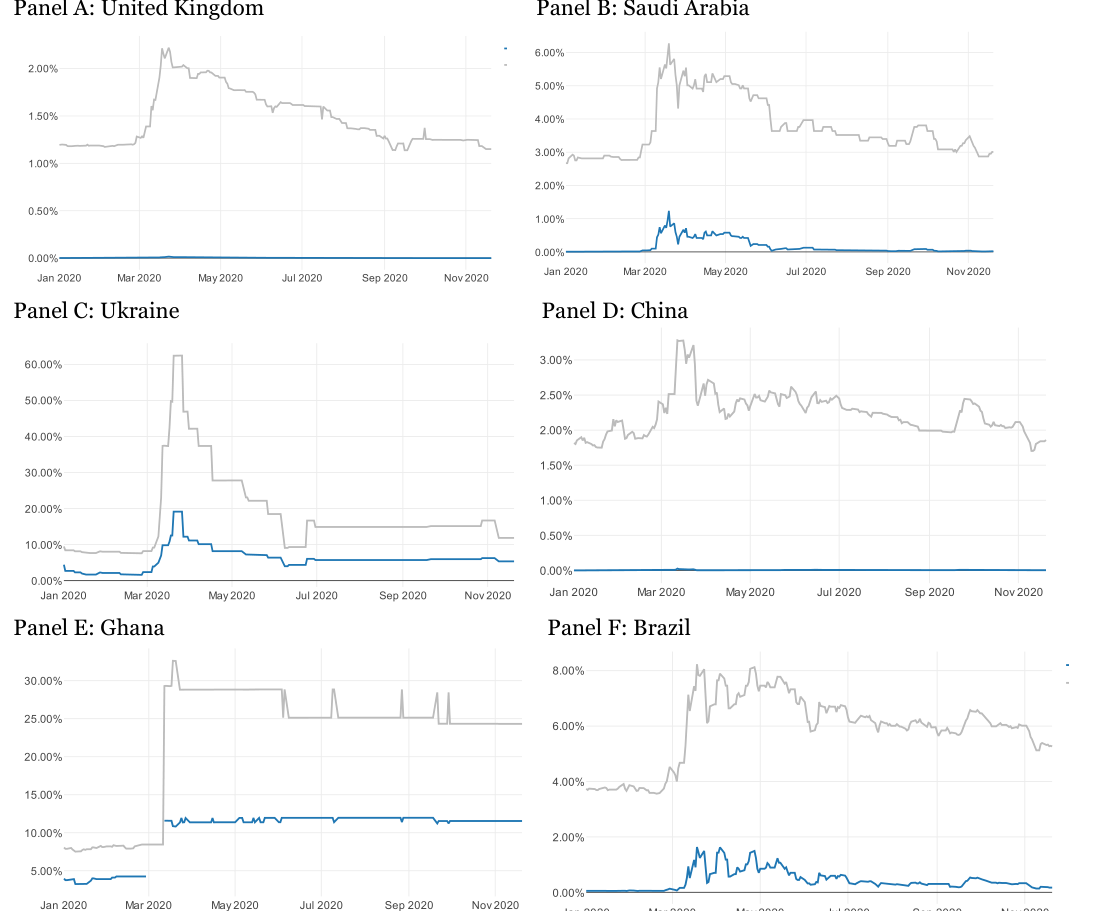
Note: PDs are from Risk Control calculations. The blue lines are 1-year PDs, and the grey lines are 5-year PDs.
| Country | 1-Year | Ratings | 5-Year | Ratings |
|---|---|---|---|---|
| 01/01/2020 | 20/11/2020 | 01/01/2020 | 20/11/2020 | |
| United Kingdom | AA | AAA | AAA | AA |
| Saudi Arabia | A+ | A- | A- | BBB |
| Ukraine | B- | B- | B- | B- |
| China | AAA | AA | AA- | A |
| Brazil | BBB | BB+ | BBB | B+ |
3. Global Sector Default Probabilities
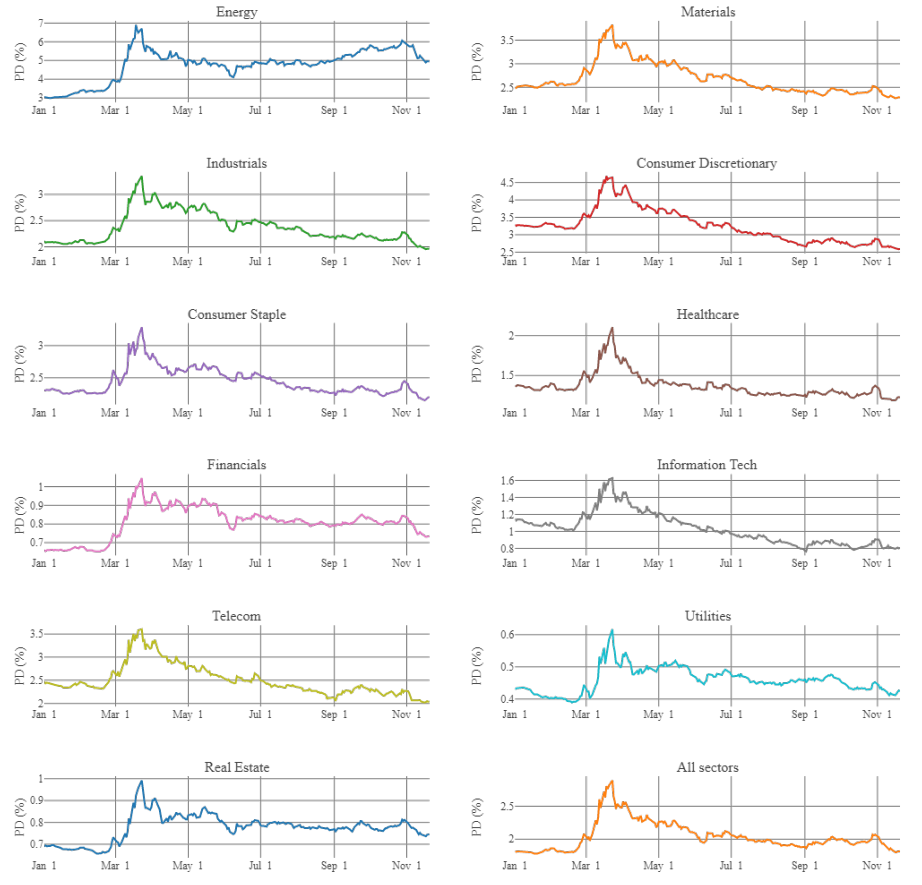
This section presents real-time sector Probability of Default (PD) estimates for industry sectors. The calculations are based on equity market capitalisation and corporate leverage data. The results represent updates of analysis presented in the note: “Gainers and the Losers: Real-time Industry PDs in the Covid-19 Crisis,” 20-70a available on the Risk Control website. Similar calculations with daily updates are presented on Risk Control’s real-time dashboard at https://c19dashboard.riskcontrollimited.com. The analysis reported below shows what happened to the credit quality of global industry sectors from 1st September to 20th November 2020. Figure 5 shows the PD changes in aggregate GICS sectors (Level 1).
The downward trend in PDs since the March peak stalled in early September when the Covid 19 ‘second wave’ appeared. Since then, most industries experienced volatile PDs but without an obvious trend. The Energy sector is the only one for which PDs have shown consistent recent increases. (This could reflect anticipated competition from Green Energy sources as well as Covid-19 issues.) PDs for Industrials and Utilities sectors, in contrast, have recently exhibited slight downward trends. PDs for Financials and Real Estate have not recovered suggesting that the market continues to see problems ahead for these sectors.
Positive news about successful vaccine tests on 9th November produced a strong reaction from the market. Sectors most affected by the virus, such as Energy, Materials, Industrials, Financials and Real Estate, made noticeable recoveries. The PD of Energy, in particular, dropped by more than 100 bps. In contrast, sectors that have performed well during the crisis, such as IT, Telecom and Healthcare, saw no change or a slight increase in PDs. Consumer Discretionary was almost unaffected while Consumer Staple exhibited a slight drop in its PDs.
Overall, the market did not change significantly since September. The sector with the largest drop in PDs is Industrials (from 218 bp to 197 bp). The only sector with an increase in PD is IT (77 bp to 81 bp). The order of sector PDs did not change. The lowest PD is still that of the Utilities sector while the Energy sector still has a distinctly higher PD than others. In the middle two clusters appear: (i) a low-PD cluster consisting of Real Estate, Information Technology, Financials and Healthcare, and (ii) a high-PD cluster consisting of Telecom, Industrials, Consumer Staple, Materials and Consumer Discretionary.
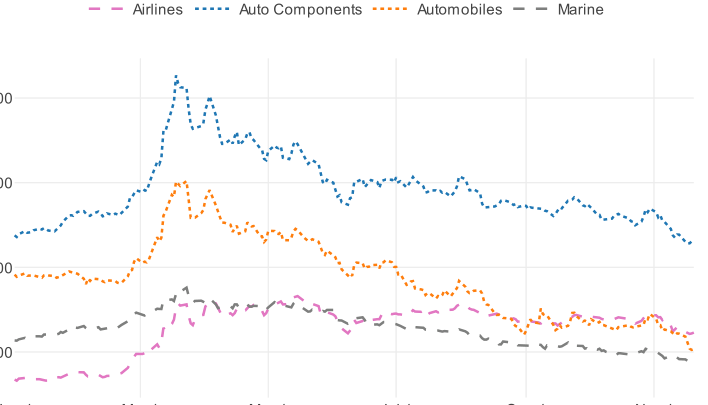
We now turn our focus on a more granular breakdown of sectors. It is interesting to focus on those related to transportations and hospitality. Figure 6 shows the PDs of three, Level-3 sectors related to transportations. While Automobiles, Auto Components and Marine have shown gradual recoveries, the Airlines industry has only recovered slightly and this recently. This is consistent with some increase in local mobility and international trade but international travel remains severely limited. The recent vaccination news brought a positive improvement for all four sectors.
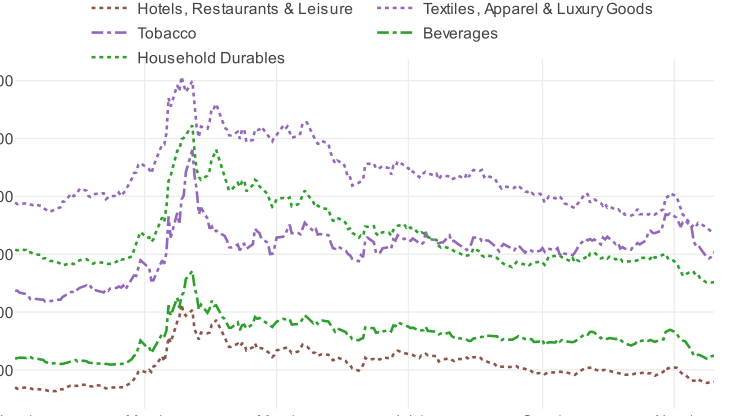
Figure 7 shows the PDs of selected consumer sub-sectors. Hotels Restaurants & Leisure, Textiles Apparel & Luxury Goods and Household Durables exhibit slight improvement in their credit qualities, while the PD of Beverages is steady. This is consistent with slightly improved spending by consumers. Tobacco is the only subsector among those here considered for which PDs have increased. This may be because awareness of lung health has increased with the pandemic. The PDs of all sectors appearing in this figure have declined since 6th November, reflecting positive news about vaccines.
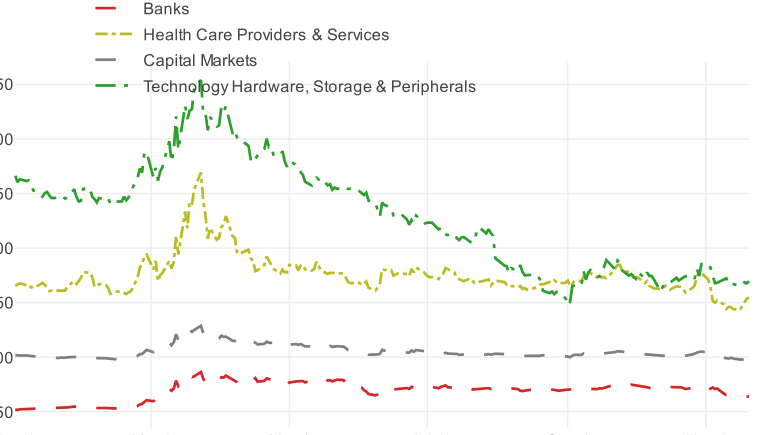
Figure 8 shows PDs for selected high-tech sectors, i.e. Technology Hardware, Storage & Peripherals, representative financial sectors – Banks and Capital Markets, and a representative healthcare sector – Health Care Providers & Services. The high-tech sectors are among those that have performed best since the onset of the pandemic. The downward sloping trend in their PDs ceased in early September. Health Care Providers & Services recovered fastest from the pandemic. After a stable period from May to mid-September, its PD dropped even more in reaction to news about vaccines. On the other hand, the PDs of Banks remain distinctly higher than pre-crisis levels.
Note: Risk Control calculation.
Note: Numbers are from Risk Control’s own calculation.
Note: Numbers are from Risk Control’s own calculation.
Note: Numbers are from Risk Control’s own calculation.
References
Risk Control (2020) “Real Time Sovereign Ratings in the Covid-19 Crisis,” 20-65a, available at https://www.riskcontrollimited.com/wp-content/uploads/2020/05/Real-Time-Sovereign-Ratings-in-the- Covid-19-Crisis-20-65a-15-5-20-FINAL.pdf.
Risk Control (2020) “Gainers and the Losers: Real-Time Industry PDs in the Covid-19 Crisis,” 20-70a, available at: https://www.riskcontrollimited.com/wp-content/uploads/2020/06/Gainers-and-the-Losers-Real-time- Industry-PDs-in-the-Covid-19-Crisis-20-70a-15-05-20-v9-with-appendix.pdf
Risk Control (2020) “Covid 19 Data and Dashboard,” available at: https://c19dashboard.riskcontrollimited.com/login
Risk Control Limited 13-14 Dean Street London W1D 3RS +44 (0)203 307 0730 www.riskcontrollimited.com